Embed Size (px)
Citation preview
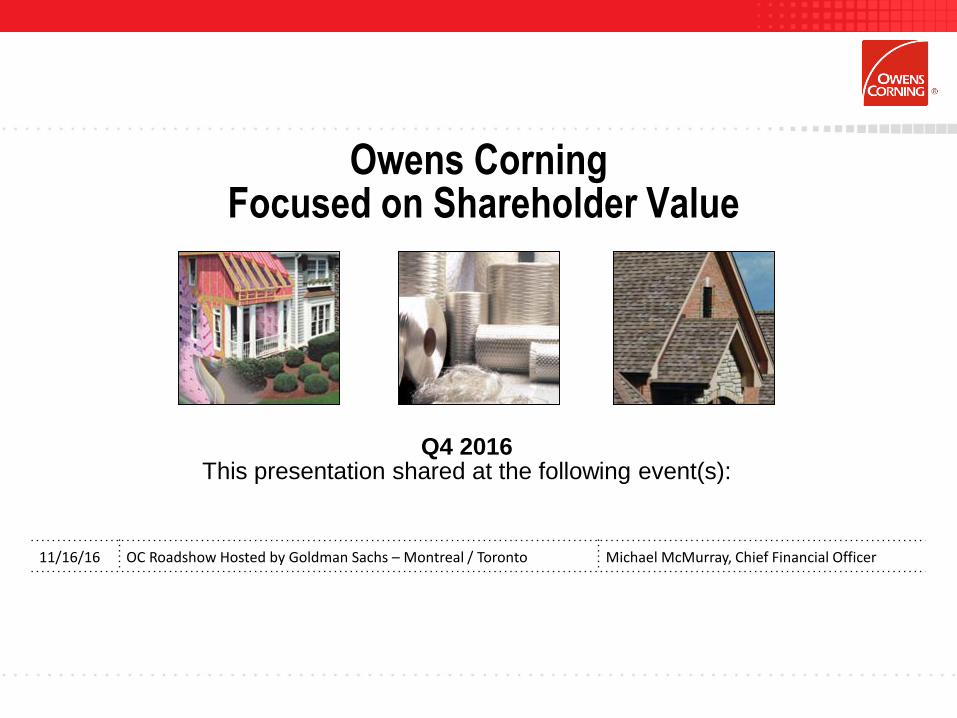
Owens CorningFocused on Shareholder Value
Q4 2016This presentation shared at the following event(s):
11/16/16 OC Roadshow Hosted by Goldman Sachs – Montreal / Toronto Michael McMurray, Chief Financial Officer
This presentation and the associated remarks and comments contain forward-looking statements. We caution you against relying on these statements as they involve risks and uncertainties that are difficult to predict and the Company’s actual results may differ materially from those projected in these statements. Such risks and uncertainties are based on factors such as, without limitation: relationships with key customers and demand for our products; macroeconomic factors like levels of construction activity, global industrial production, industry, economic and political conditions; competitive and pricing factors; currency, commodity and interest rate fluctuations; our level of indebtedness and the availability and cost of credit; weather conditions; energy and raw material availability and cost issues; ability to protect our intellectual property and information technology systems; labor disputes, legal and regulatory proceedings; our ability to utilize net operating loss carry-forwards; issues related to acquisitions, divestitures and joint ventures, including related synergies; and factors detailed from time to time in the Company’s Securities and Exchange Commission filings.
For purposes of this presentation, any discussion referring to “year to date” or last twelve months (“LTM”) refers to the period ended on the last calendar day of the quarter preceding the date of the investor event referred to on the first page of this document. Otherwise the information in this presentation speaks as of the date of the investor event, and is subject to change. The Company does not undertake any obligation to update or revise forward-looking statements beyond what is required under applicable securities laws. Any distribution of this presentation after the date of the investor event is not intended and should not be construed as updating or confirming such information.
This presentation contains references to certain "non-GAAP financial measures" as defined by the SEC, including adjusted EBIT, adjusted earnings, adjusted EPS, adjusted pre-tax earnings and free cash flow. Management uses non-GAAP measures for various purposes, including reporting results of operations to the Board of Directors, analysis of performance and related employee compensation measures. Although management believes these measures, and exclusions from GAAP therein, provide a useful representation of performance, non-GAAP measures should not be considered in isolation or as a substitute for GAAP measures. A reconciliation of these non-GAAP financial measures to their most directly comparable financial measures calculated and presented in accordance with generally accepted accounting principles can be found in the text and Tables 2,3 and 8 of the Press Release furnished on Form 8-K on October 26, 2016 and Appendix B. Adjusted EBIT is earnings before interest, taxes and other items that management does not allocate to our segment results because we believe they are not representative of the Company’s current operations. Free cash flow is net cash flow provided by operating activities minus the sum of cash paid for property, plant, and equipment and purchases of alloy. When the Company provides forward-looking expectations for non-GAAP measures, the most comparable GAAP measures and a reconciliation between the non-GAAP expectations and the corresponding GAAP measures aregenerally not available without unreasonable effort due to the variability, complexity and limited visibility of the adjusting items that would be excluded from the non-GAAP measures in future periods. The variability in timing and amount of adjusting items could have significant and unpredictable effects on future GAAP results.
Forward-Looking Statements and Non-GAAP Measures
2
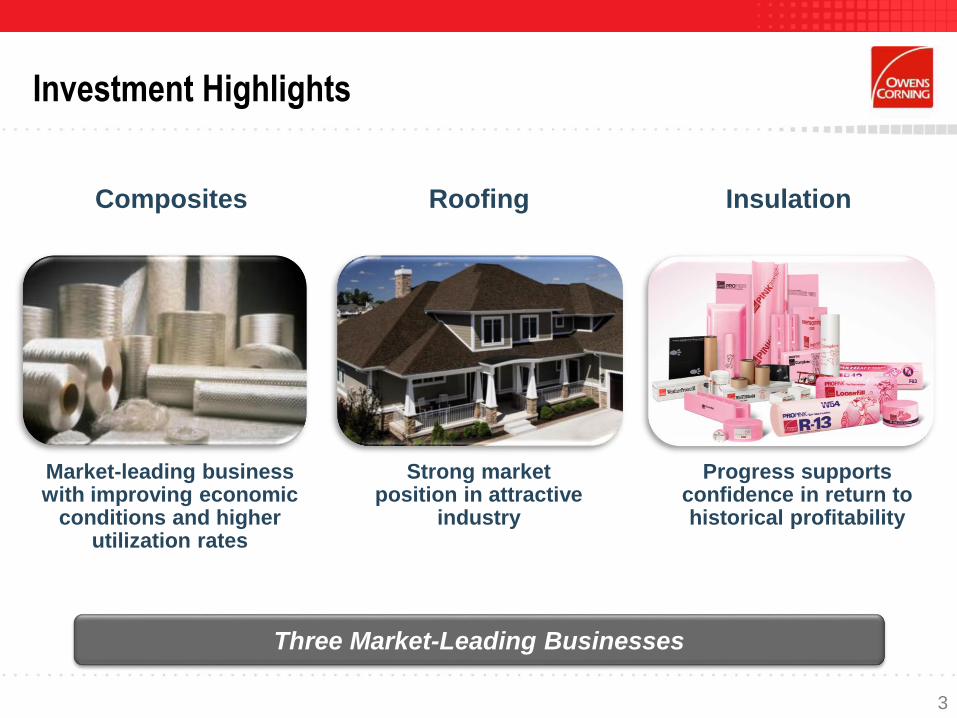
Investment Highlights
Composites
Three Market-Leading Businesses
Roofing Insulation
Market-leading business with improving economic
conditions and higher utilization rates
Strong market position in attractive
industry
Progress supports confidence in return to historical profitability
3
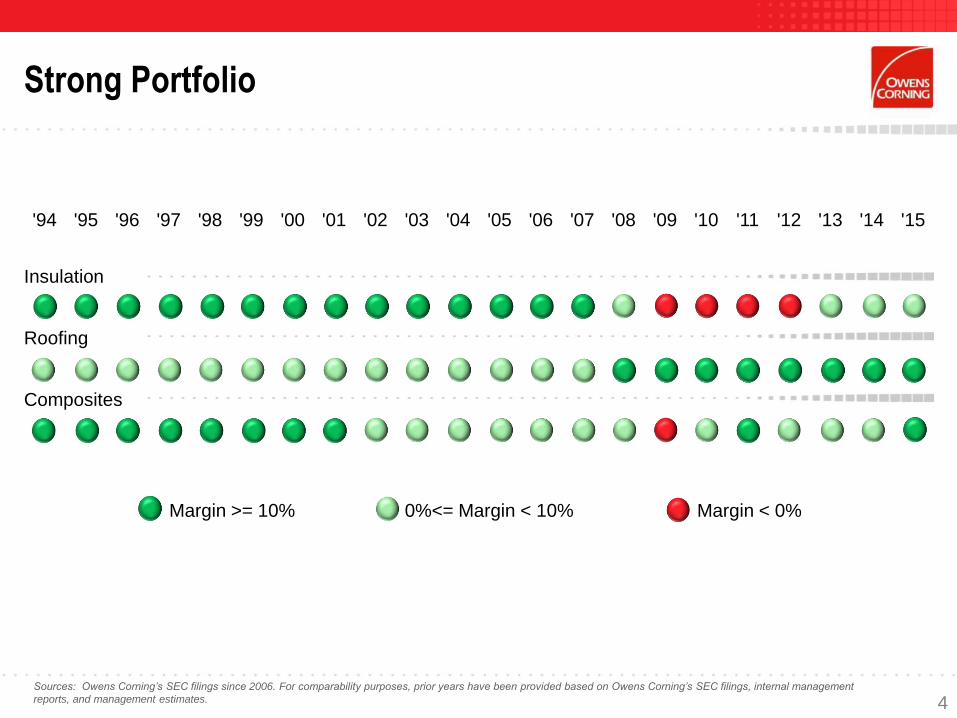
Margin >= 10% 0%<= Margin < 10% Margin < 0%
'94 '95 '96 '97 '98 '99 '00 '01 '02 '03 '04 '05 '06 '07 '08 '09 '10 '11 '12 '13 '14 '15
Insulation
Roofing
Composites
Sources: Owens Corning’s SEC filings since 2006. For comparability purposes, prior years have been provided based on Owens Corning’s SEC filings, internal management
reports, and management estimates.
Strong Portfolio
4
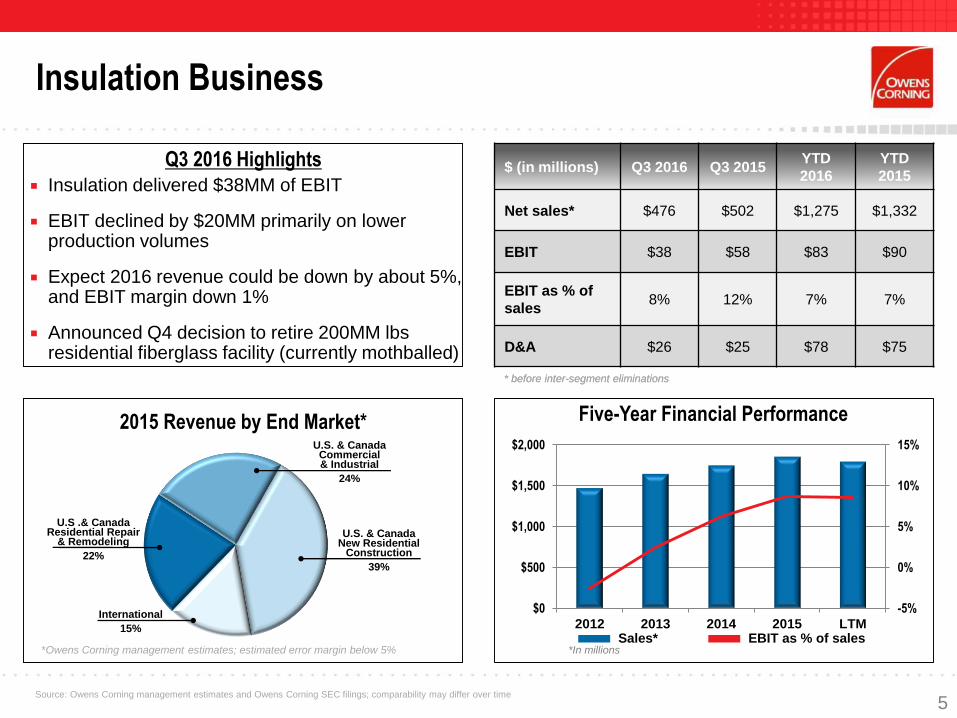
$ (in millions) Q3 2016 Q3 2015YTD
2016
YTD
2015
Net sales* $476 $502 $1,275 $1,332
EBIT $38 $58 $83 $90
EBIT as % of
sales8% 12% 7% 7%
D&A $26 $25 $78 $75
2015 Revenue by End Market*
5
Insulation Business
* before inter-segment eliminations
-5%
0%
5%
10%
15%
$0
$500
$1,000
$1,500
$2,000
2012 2013 2014 2015 LTM
Five-Year Financial Performance
Sales* EBIT as % of sales*In millions
International
15%
U.S. & CanadaNew Residential
Construction
39%
U.S .& CanadaResidential Repair
& Remodeling
22%
U.S. & CanadaCommercial& Industrial
24%
*Owens Corning management estimates; estimated error margin below 5%
Source: Owens Corning management estimates and Owens Corning SEC filings; comparability may differ over time
* before inter-segment eliminations
Q3 2016 Highlights
Insulation delivered $38MM of EBIT
EBIT declined by $20MM primarily on lower production volumes
Expect 2016 revenue could be down by about 5%, and EBIT margin down 1%
Announced Q4 decision to retire 200MM lbs residential fiberglass facility (currently mothballed)
-10%
0%
10%
20%
30%
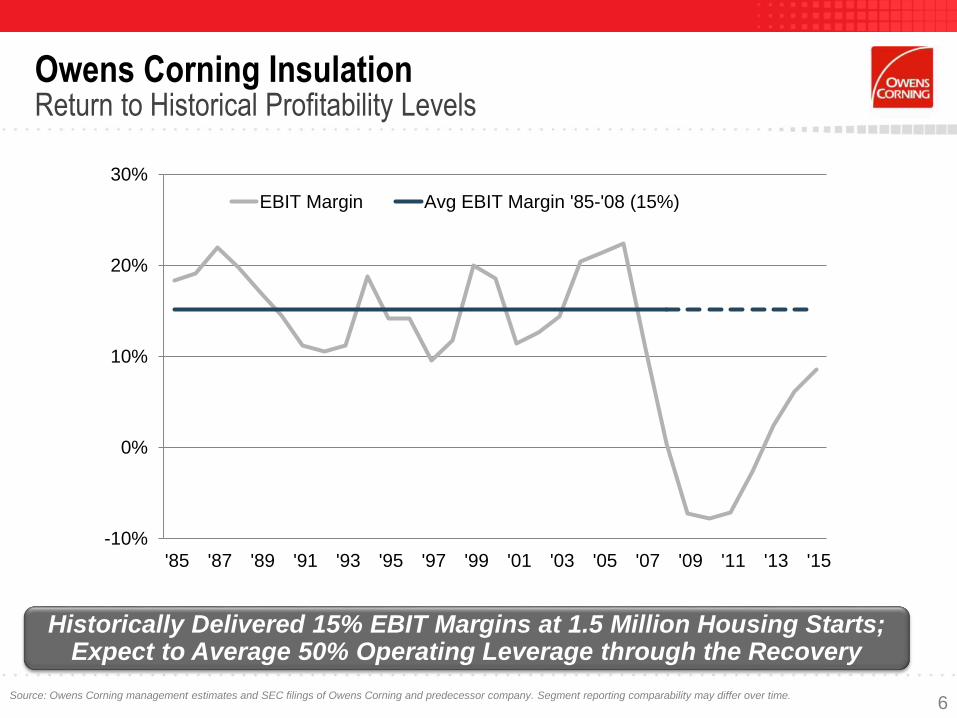
'85 '87 '89 '91 '93 '95 '97 '99 '01 '03 '05 '07 '09 '11 '13 '15
EBIT Margin Avg EBIT Margin '85-'08 (15%)
Owens Corning InsulationReturn to Historical Profitability Levels
Historically Delivered 15% EBIT Margins at 1.5 Million Housing Starts; Expect to Average 50% Operating Leverage through the Recovery
Source: Owens Corning management estimates and SEC filings of Owens Corning and predecessor company. Segment reporting comparability may differ over time.6
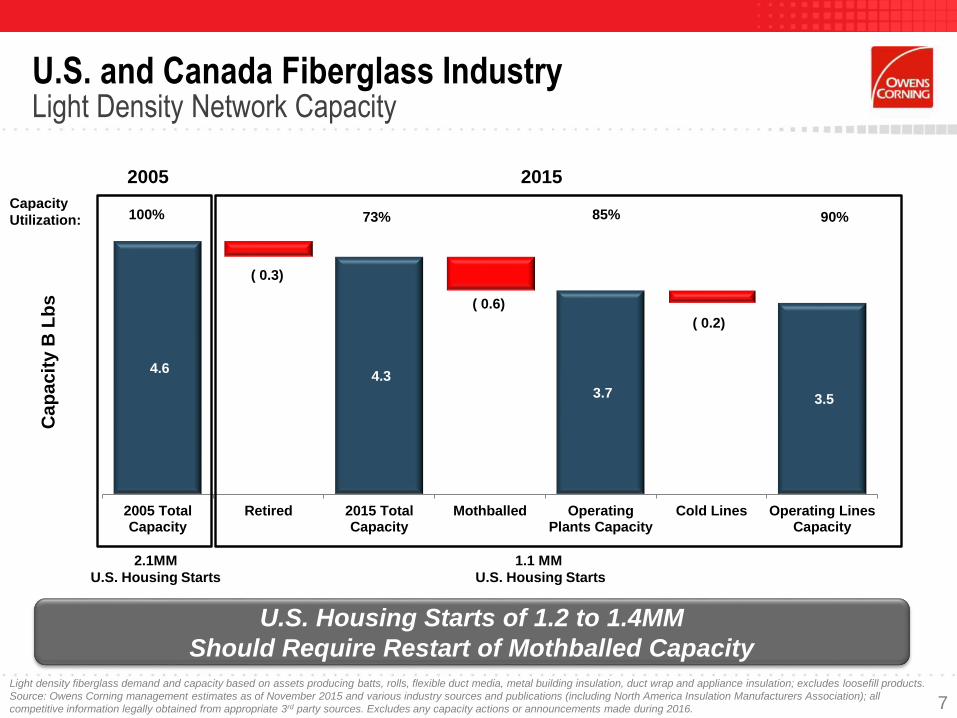
( 0.3)
( 0.6)
( 0.2)
4.6 4.3
3.7 3.5
2005 TotalCapacity
Retired 2015 TotalCapacity
Mothballed OperatingPlants Capacity
Cold Lines Operating LinesCapacity
2.1MM
U.S. Housing Starts
Capacity
Utilization: 100% 73% 85% 90%
1.1 MM
U.S. Housing Starts
2005 2015
Ca
pa
cit
y B
Lb
s
U.S. and Canada Fiberglass Industry Light Density Network Capacity
Light density fiberglass demand and capacity based on assets producing batts, rolls, flexible duct media, metal building insulation, duct wrap and appliance insulation; excludes loosefill products.
Source: Owens Corning management estimates as of November 2015 and various industry sources and publications (including North America Insulation Manufacturers Association); all
competitive information legally obtained from appropriate 3rd party sources. Excludes any capacity actions or announcements made during 2016.
U.S. Housing Starts of 1.2 to 1.4MM
Should Require Restart of Mothballed Capacity
7
OC
U.S. N
ew C
on
structio
n P
rice
Ind
exed
to 2
00
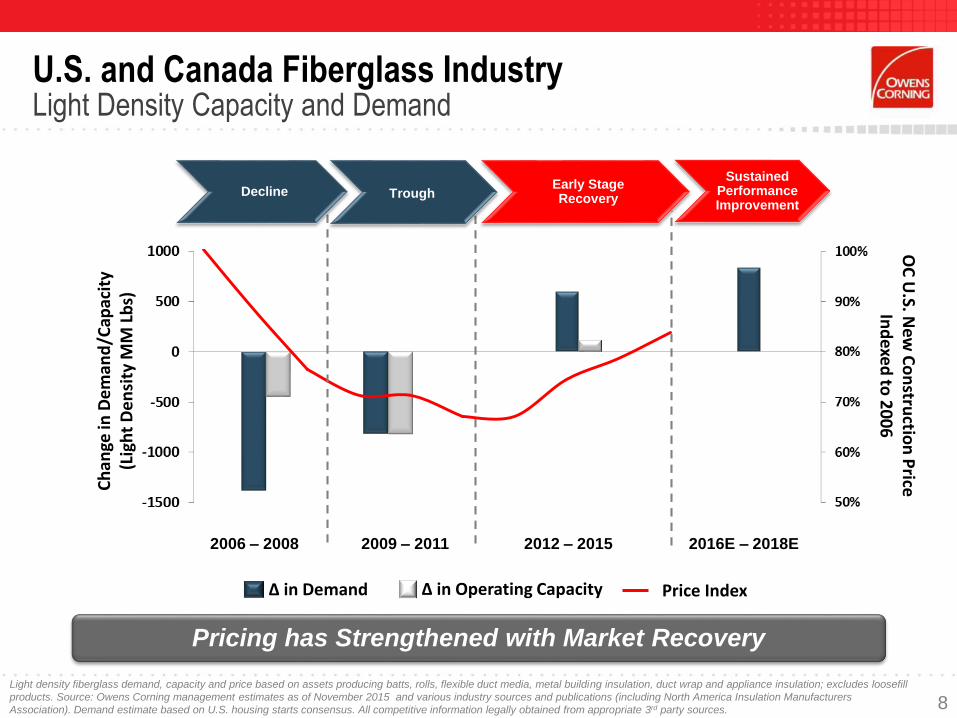
6U.S. and Canada Fiberglass IndustryLight Density Capacity and Demand
Pricing has Strengthened with Market Recovery
Ch
ange
in D
em
and
/Cap
acit
y(L
igh
t D
en
sity
MM
Lb
s)
2006 – 2008 2009 – 2011 2012 – 2015 2016E – 2018E
Price Index∆ in Demand ∆ in Operating Capacity
Decline TroughEarly Stage Recovery
Sustained Performance Improvement
Light density fiberglass demand, capacity and price based on assets producing batts, rolls, flexible duct media, metal building insulation, duct wrap and appliance insulation; excludes loosefill
products. Source: Owens Corning management estimates as of November 2015 and various industry sources and publications (including North America Insulation Manufacturers
Association). Demand estimate based on U.S. housing starts consensus. All competitive information legally obtained from appropriate 3rd party sources. 8
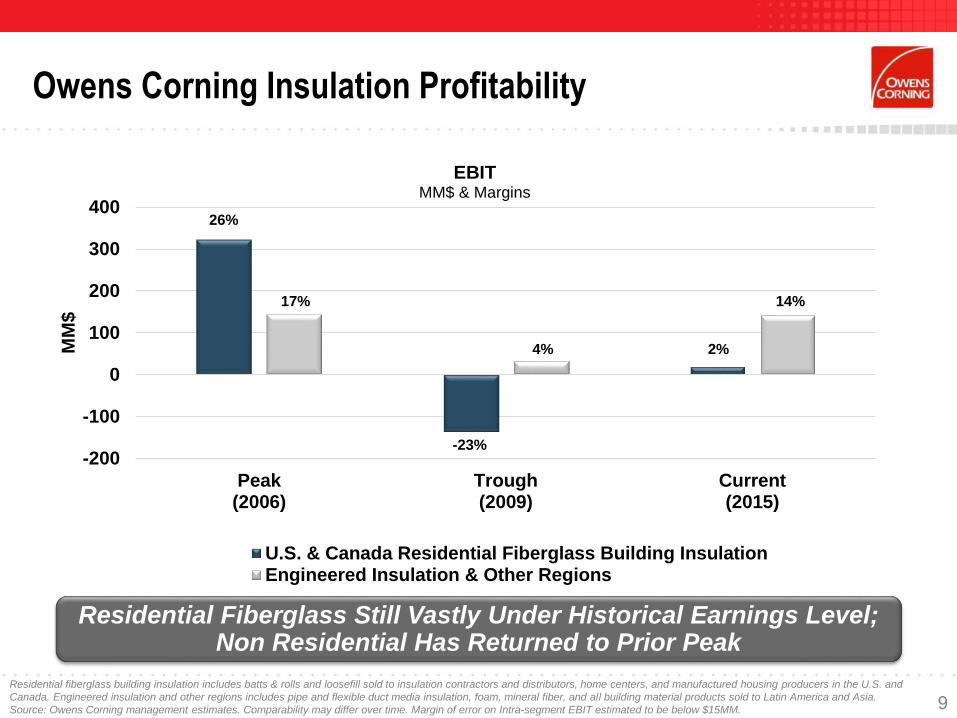
Owens Corning Insulation Profitability
Residential Fiberglass Still Vastly Under Historical Earnings Level; Non Residential Has Returned to Prior Peak
9Residential fiberglass building insulation includes batts & rolls and loosefill sold to insulation contractors and distributors, home centers, and manufactured housing producers in the U.S. and
Canada. Engineered insulation and other regions includes pipe and flexible duct media insulation, foam, mineral fiber, and all building material products sold to Latin America and Asia.
Source: Owens Corning management estimates. Comparability may differ over time. Margin of error on Intra-segment EBIT estimated to be below $15MM.
-200
-100
0
100
200
300
400
Peak(2006)
Trough(2009)
Current(2015)
MM
$
EBITMM$ & Margins
U.S. & Canada Residential Fiberglass Building InsulationEngineered Insulation & Other Regions
26%
17%
-23%
4% 2%
14%
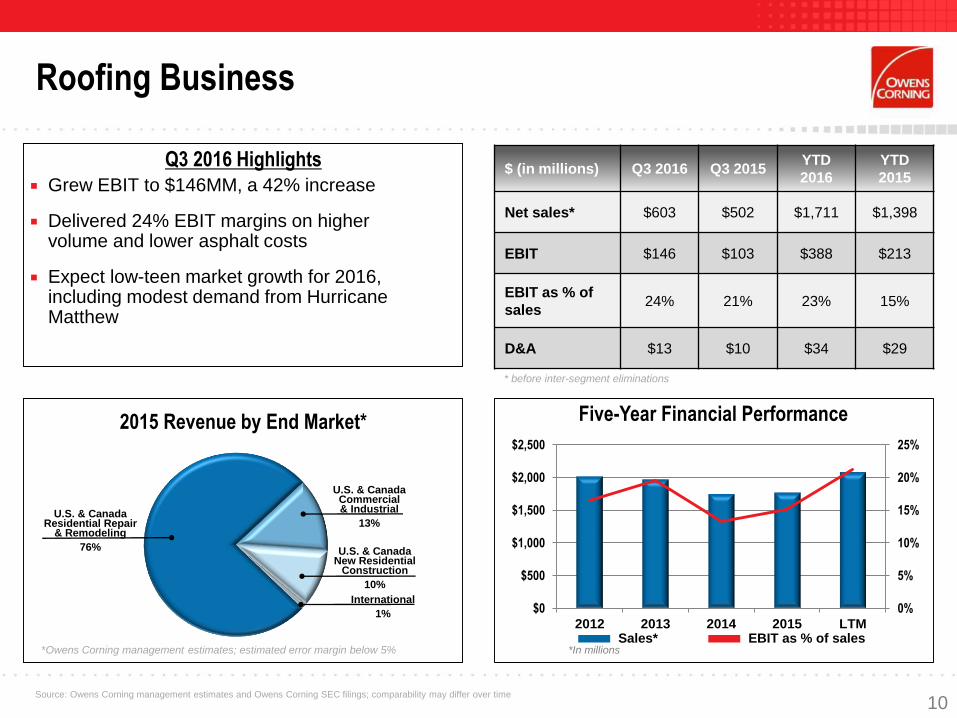
$ (in millions) Q3 2016 Q3 2015YTD
2016
YTD
2015
Net sales* $603 $502 $1,711 $1,398
EBIT $146 $103 $388 $213
EBIT as % of
sales24% 21% 23% 15%
D&A $13 $10 $34 $29
2015 Revenue by End Market*
Roofing Business
* before inter-segment eliminations
0%
5%
10%
15%
20%
25%
$0
$500
$1,000
$1,500
$2,000
$2,500
2012 2013 2014 2015 LTM
Five-Year Financial Performance
Sales* EBIT as % of sales*In millions
U.S. & CanadaNew Residential
Construction
10%
U.S. & CanadaResidential Repair
& Remodeling
76%
U.S. & CanadaCommercial& Industrial
13%
*Owens Corning management estimates; estimated error margin below 5%
Source: Owens Corning management estimates and Owens Corning SEC filings; comparability may differ over time
Q3 2016 Highlights
Grew EBIT to $146MM, a 42% increase
Delivered 24% EBIT margins on higher volume and lower asphalt costs
Expect low-teen market growth for 2016, including modest demand from Hurricane Matthew
International
1%
10
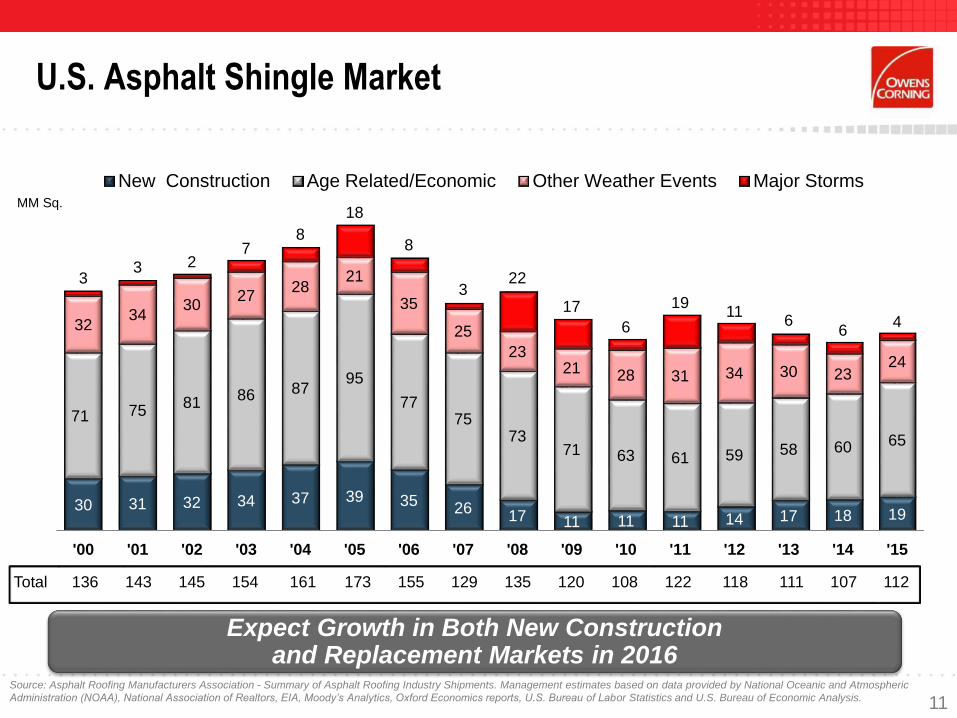
U.S. Asphalt Shingle Market
Expect Growth in Both New Construction and Replacement Markets in 2016
Source: Asphalt Roofing Manufacturers Association - Summary of Asphalt Roofing Industry Shipments. Management estimates based on data provided by National Oceanic and Atmospheric
Administration (NOAA), National Association of Realtors, EIA, Moody’s Analytics, Oxford Economics reports, U.S. Bureau of Labor Statistics and U.S. Bureau of Economic Analysis.
MM Sq.
Total 136 143 145 154 161 173 155 129 135 120 108 122 118 111 107 112
30 31 32 34 37 39 35 2617 11 11 11 14 17 18 19
71 7581
86 8795
7775
7371 63 61 59 58 60 65
3234
3027
2821
35
25
2321 28 31 34 30 23
24
33 2
78
18
8
322
17
6
1911
66
4
'00 '01 '02 '03 '04 '05 '06 '07 '08 '09 '10 '11 '12 '13 '14 '15
New Construction Age Related/Economic Other Weather Events Major Storms
11
Strong Market Position in Attractive Industry
Track record of strong financial performance
– Delivered average operating margins of 18% since 2008
New construction and replacement markets are growing,
after period of extension of replacement cycle
– Housing activity forecasts support demand growth
– Growth of age-related/economic demand has resumed
Strong market position; confidence in sustaining average
operating margins of mid-teens or better
12
InterWrap AcquisitionStrengthens Position of Roofing Components Business
Acquired leading manufacturer of synthetic roofing underlayment and
packaging materials for $450 million on April 21st, 2016
Value contributors:
– InterWrap’s established track record of double-digit revenue growth
– Benefit from conversion of organic to synthetic underlayments
– OC channel strength and InterWrap strong products, brands and technology
– Commercial and operational synergies
– Access to new markets and construction applications
Expect acquisition to be accretive to 2016 EPS, excluding transaction
and integration costs
Expect at least $176MM of revenue and $30MM of adjusted EBIT
in 2016
Anticipate achieving a run rate of $20 million or more of commercial
and operational synergies by the end of next year
Sources: Owens Corning management estimates and press release issued February 24, 2016 13
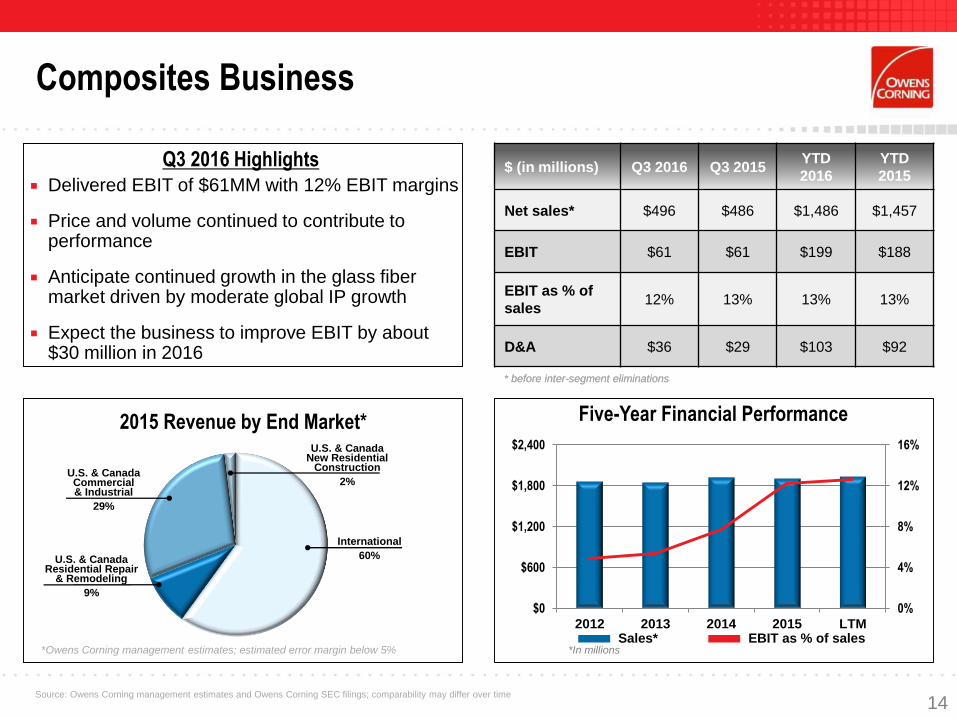
$ (in millions) Q3 2016 Q3 2015YTD
2016
YTD
2015
Net sales* $496 $486 $1,486 $1,457
EBIT $61 $61 $199 $188
EBIT as % of
sales12% 13% 13% 13%
D&A $36 $29 $103 $92
2015 Revenue by End Market*
Composites Business
* before inter-segment eliminations
0%
4%
8%
12%
16%
$0
$600
$1,200
$1,800
$2,400
2012 2013 2014 2015 LTM
Five-Year Financial Performance
Sales* EBIT as % of sales*In millions*Owens Corning management estimates; estimated error margin below 5%
Source: Owens Corning management estimates and Owens Corning SEC filings; comparability may differ over time
* before inter-segment eliminations
International
60%
U.S. & CanadaNew Residential
Construction
2%
U.S. & CanadaResidential Repair
& Remodeling
9%
U.S. & CanadaCommercial& Industrial
29%
Q3 2016 Highlights
Delivered EBIT of $61MM with 12% EBIT margins
Price and volume continued to contribute to performance
Anticipate continued growth in the glass fiber market driven by moderate global IP growth
Expect the business to improve EBIT by about $30 million in 2016
14
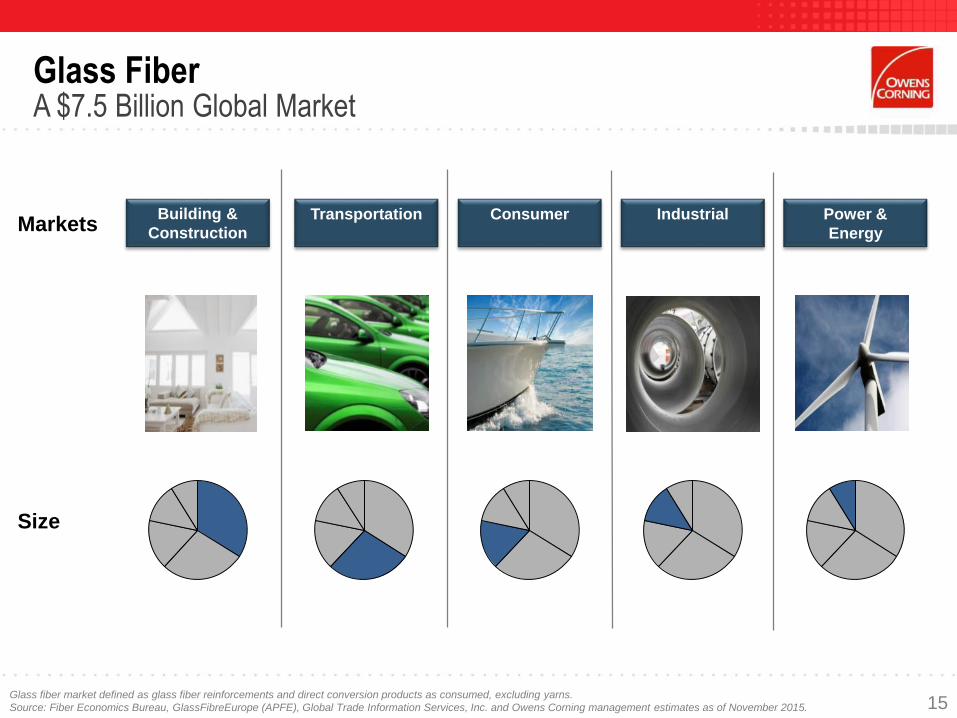
Glass Fiber A $7.5 Billion Global Market
Glass fiber market defined as glass fiber reinforcements and direct conversion products as consumed, excluding yarns.
Source: Fiber Economics Bureau, GlassFibreEurope (APFE), Global Trade Information Services, Inc. and Owens Corning management estimates as of November 2015.
Markets
Size
Building &
Construction
Consumer Power &
Energy
Transportation Industrial
15
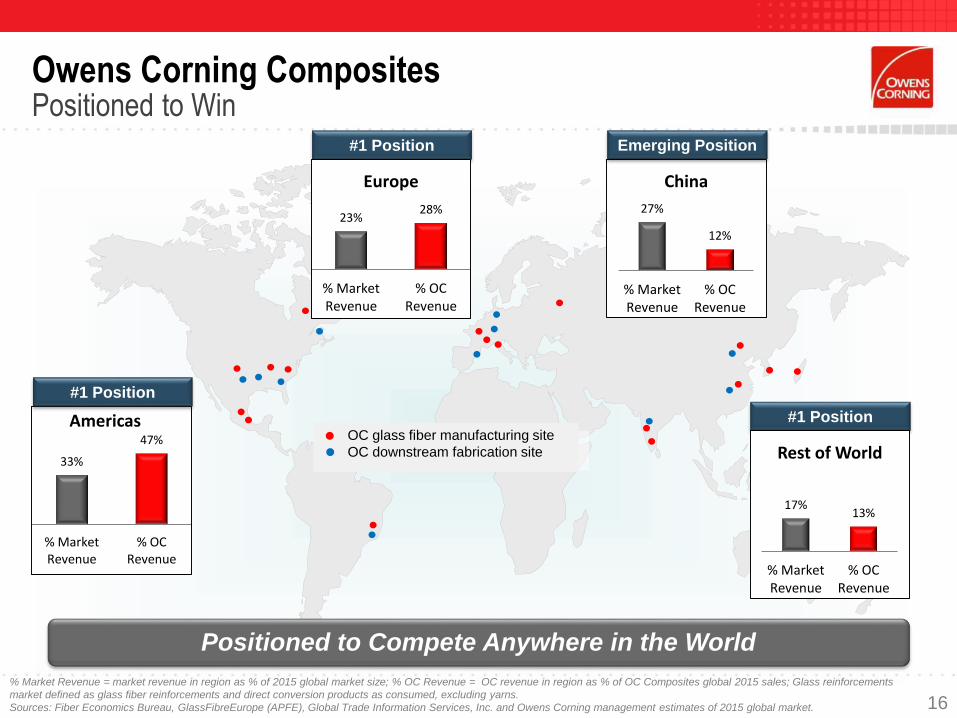
27%
12%
% MarketRevenue
% OCRevenue
China
33%
47%
% MarketRevenue
% OCRevenue
Americas
Owens Corning CompositesPositioned to Win
#1 Position
#1 Position Emerging Position
#1 Position
Positioned to Compete Anywhere in the World
OC glass fiber manufacturing site
OC downstream fabrication site
16
% Market Revenue = market revenue in region as % of 2015 global market size; % OC Revenue = OC revenue in region as % of OC Composites global 2015 sales; Glass reinforcements
market defined as glass fiber reinforcements and direct conversion products as consumed, excluding yarns.
Sources: Fiber Economics Bureau, GlassFibreEurope (APFE), Global Trade Information Services, Inc. and Owens Corning management estimates of 2015 global market.
23%28%
% MarketRevenue
% OCRevenue
Europe
17%13%
% MarketRevenue
% OCRevenue
Rest of World
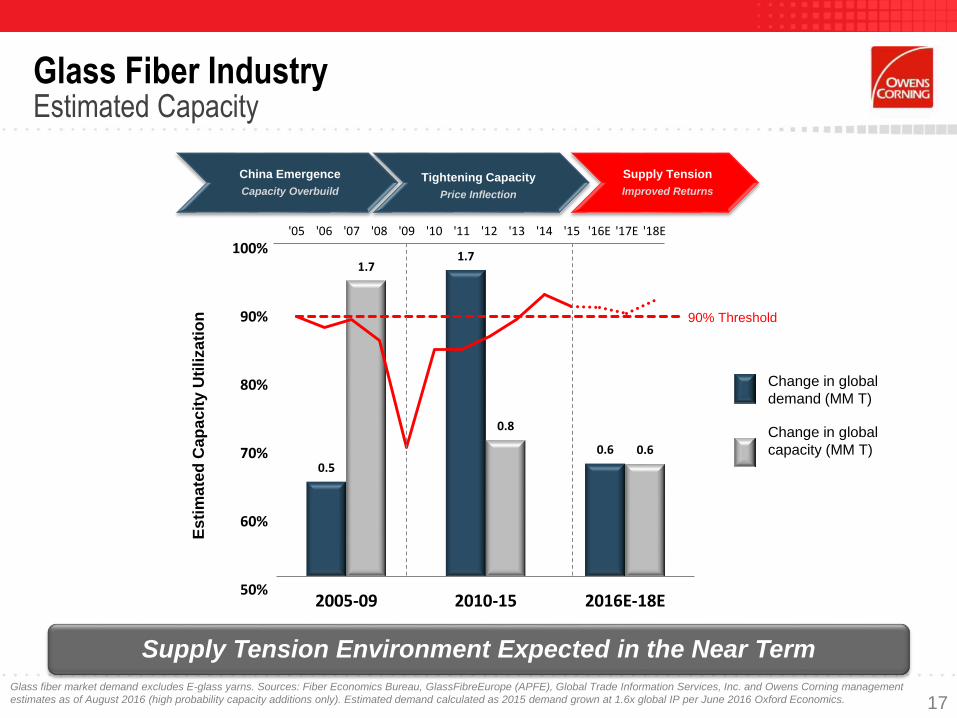
0.5
1.7
0.6
1.7
0.8
0.6
2005-09 2010-15 2016E-18E50%
60%
70%
80%
90%
100%'05 '06 '07 '08 '09 '10 '11 '12 '13 '14 '15 '16E '17E '18E
Glass Fiber IndustryEstimated Capacity
Glass fiber market demand excludes E-glass yarns. Sources: Fiber Economics Bureau, GlassFibreEurope (APFE), Global Trade Information Services, Inc. and Owens Corning management
estimates as of August 2016 (high probability capacity additions only). Estimated demand calculated as 2015 demand grown at 1.6x global IP per June 2016 Oxford Economics.
Change in global
demand (MM T)
Change in global
capacity (MM T)
Es
tim
ate
d C
ap
ac
ity U
tili
za
tio
n
China Emergence
Capacity Overbuild
Tightening Capacity
Price Inflection
Supply Tension
Improved Returns
Supply Tension Environment Expected in the Near Term
90% Threshold
17
Disciplined Capital Allocation Strategy
Drive shareholder returns by enabling organic and inorganic growth and supporting the balance sheet
– Maintain investment grade
Capital allocation strategy
– Investing in attractive organic growth
– Pursuing value-creating acquisitions
– Returning excess cash to shareholders
Quarterly dividend initiated in 2014 conveyed confidence in long-term financial outlook and cash flow generation; 6% annual dividend increases in 2015 & 2016
During Q4, the Board of Directors approved an additional share repurchase authorization for up to 10 million shares
18
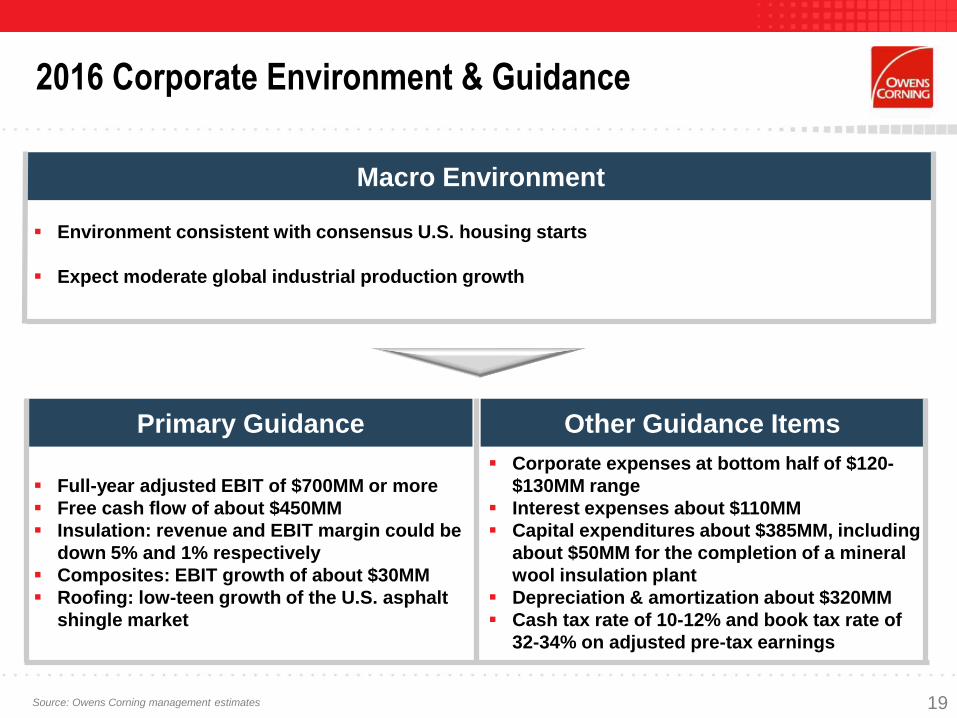
2016 Corporate Environment & Guidance
Macro Environment
Environment consistent with consensus U.S. housing starts
Expect moderate global industrial production growth
Primary Guidance
Full-year adjusted EBIT of $700MM or more
Free cash flow of about $450MM
Insulation: revenue and EBIT margin could be
down 5% and 1% respectively
Composites: EBIT growth of about $30MM
Roofing: low-teen growth of the U.S. asphalt
shingle market
Corporate expenses at bottom half of $120-
$130MM range
Interest expenses about $110MM
Capital expenditures about $385MM, including
about $50MM for the completion of a mineral
wool insulation plant
Depreciation & amortization about $320MM
Cash tax rate of 10-12% and book tax rate of
32-34% on adjusted pre-tax earnings
Source: Owens Corning management estimates
Other Guidance Items
19
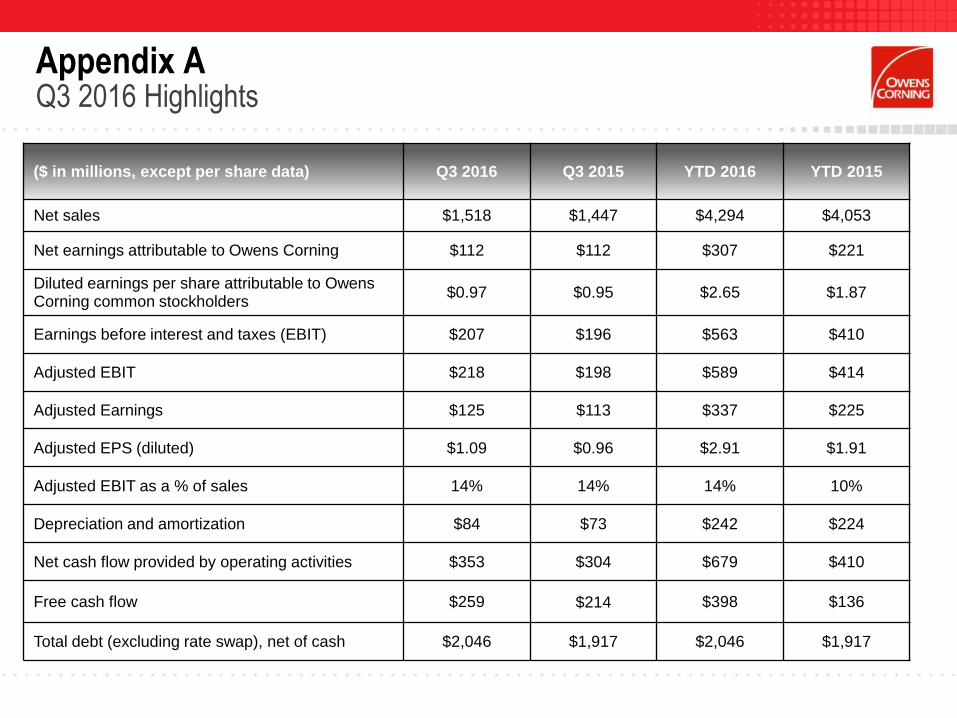
Appendix AQ3 2016 Highlights
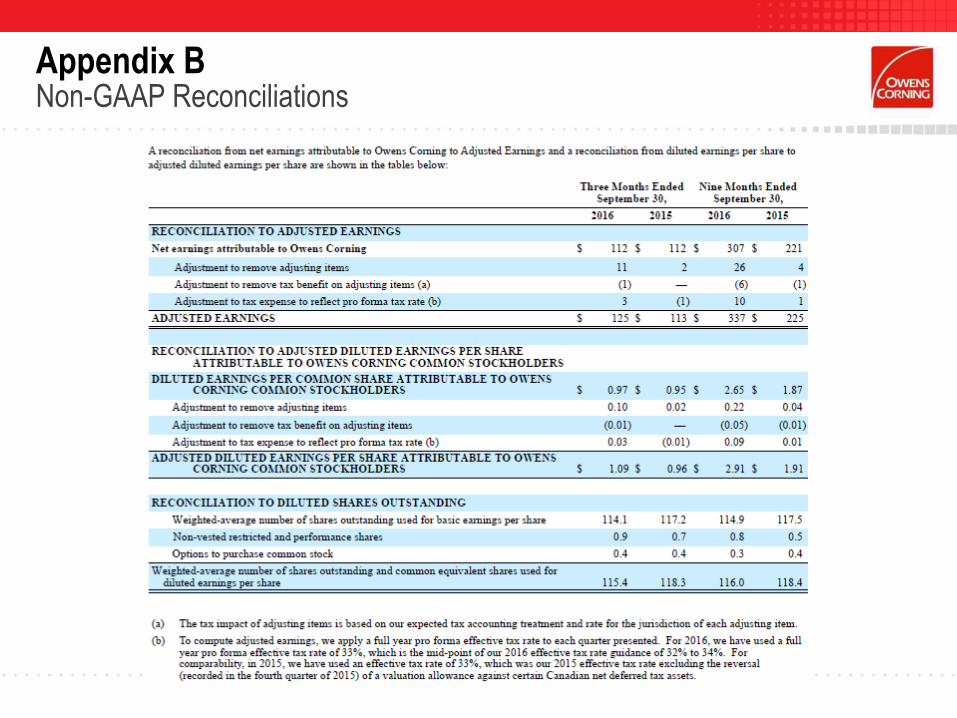
($ in millions, except per share data) Q3 2016 Q3 2015 YTD 2016 YTD 2015
Net sales $1,518 $1,447 $4,294 $4,053
Net earnings attributable to Owens Corning $112 $112 $307 $221
Diluted earnings per share attributable to Owens Corning common stockholders
$0.97 $0.95 $2.65 $1.87
Earnings before interest and taxes (EBIT) $207 $196 $563 $410
Adjusted EBIT $218 $198 $589 $414
Adjusted Earnings $125 $113 $337 $225
Adjusted EPS (diluted) $1.09 $0.96 $2.91 $1.91
Adjusted EBIT as a % of sales 14% 14% 14% 10%
Depreciation and amortization $84 $73 $242 $224
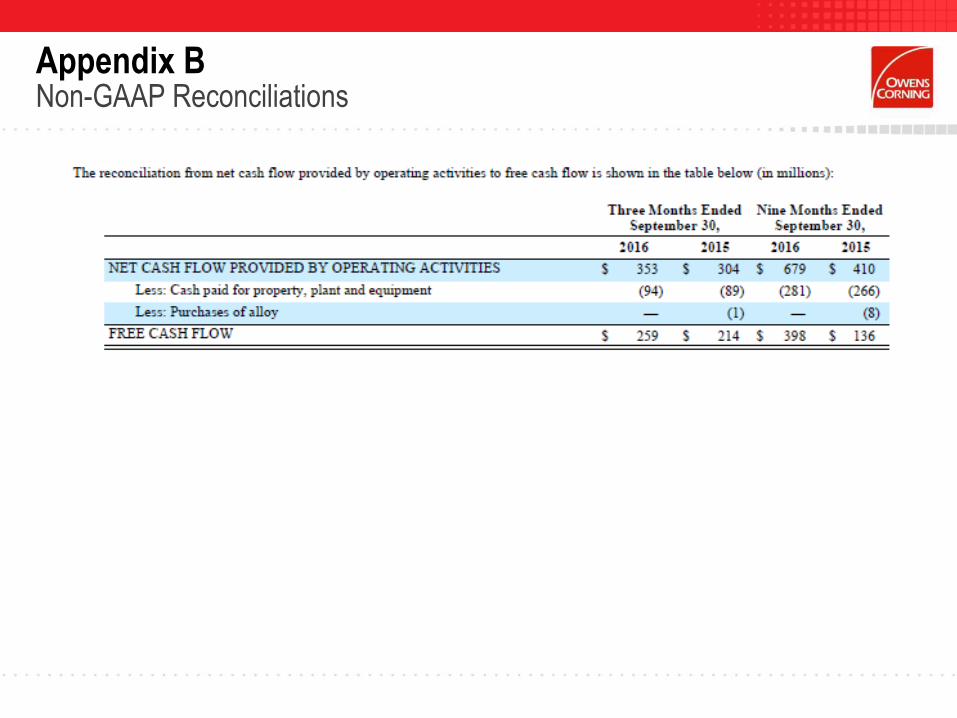
Net cash flow provided by operating activities $353 $304 $679 $410
Free cash flow $259 $214 $398 $136
Total debt (excluding rate swap), net of cash $2,046 $1,917 $2,046 $1,917
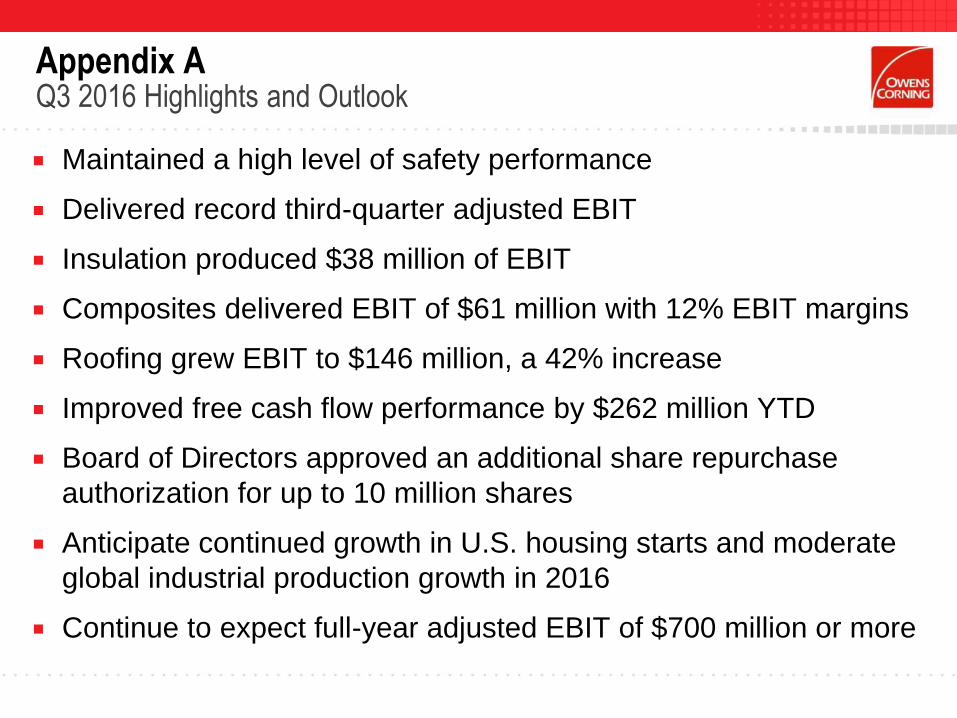
Maintained a high level of safety performance
Delivered record third-quarter adjusted EBIT
Insulation produced $38 million of EBIT
Composites delivered EBIT of $61 million with 12% EBIT margins
Roofing grew EBIT to $146 million, a 42% increase
Improved free cash flow performance by $262 million YTD
Board of Directors approved an additional share repurchase
authorization for up to 10 million shares
Anticipate continued growth in U.S. housing starts and moderate
global industrial production growth in 2016
Continue to expect full-year adjusted EBIT of $700 million or more
Appendix AQ3 2016 Highlights and Outlook
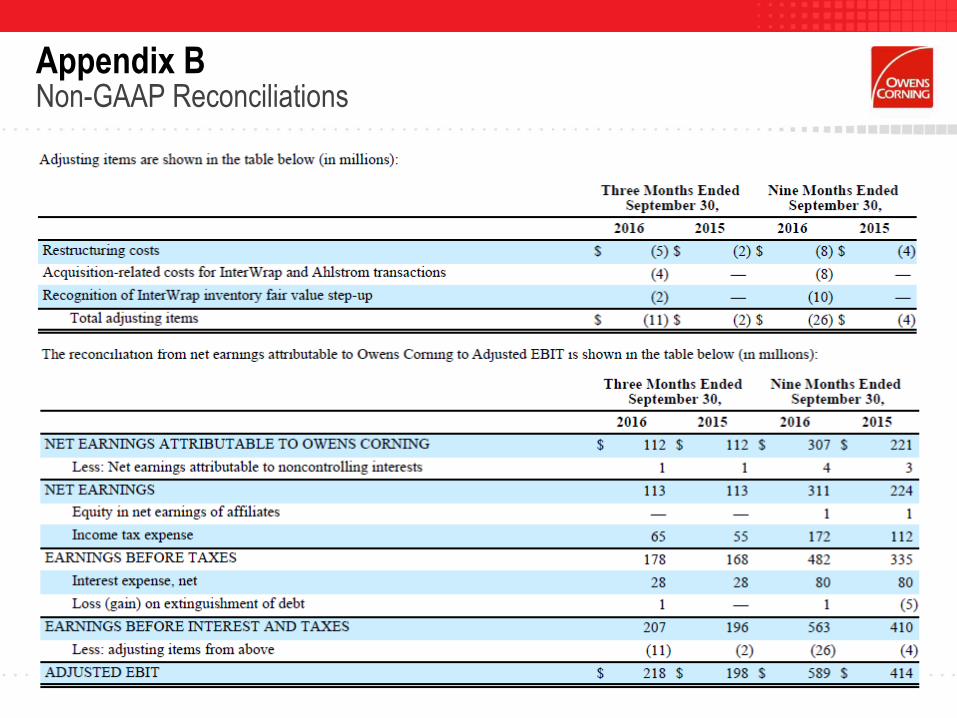
Appendix BNon-GAAP Reconciliations
Appendix BNon-GAAP Reconciliations
Appendix BNon-GAAP Reconciliations