Embed Size (px)
Citation preview
Investor and Analyst Presentation Financial Results 2014
Disclaimer Cautionary note regarding forward-looking statements
The information contained in this document has not been independently verified and no representation or warranty expressed or implied is made as to, and no reliance should be placed on, the fairness, accuracy, completeness or correctness of this information or opinions contained herein.
Certain statements contained in this document may be statements of future expectations and other forward-looking statements that are based on management‘s current view and assumptions and involve known and unknown risks and uncertainties that could cause actual results, performance or events to differ materially from those expressed or implied in such statements.
None of Wienerberger AG or any of its affiliates, advisors or representatives shall have any liability whatsoever (in negligence or otherwise) for any loss howsoever arising from any use of this document or its content or otherwise arising in connection with this document.
This document does not constitute an offer or invitation to purchase or subscribe for any securities and neither it nor any part of it shall form the basis of or be relied upon in connection with any contract or commitment whatsoever.
2
► Wienerberger generates record revenues and exceeds EBITDA goal for 2014 Revenues: € 2,834.5 mn | +6%
Operating EBITDA: € 317.2 mn | +19%
► Clay Building Materials Europe Substantial earnings increase in slightly growing market
Volume growth in all product groups | Successful cost optimization measures and integration of Tondach
► Pipes & Pavers Europe Stable earnings | Earnings growth at Semmelrock and
Steinzeug-Keramo compensates slight earnings decline at Pipelife
► North America Substantial volume growth and market share gains in
challenging price environment
Wienerberger exceeds EBITDA goal
3
► Restructuring program successfully completed Cost savings 2014: € 17 mn | 2012-2014: € 50 mn
► Acquisition of controlling majority in Tondach Gleinstätten Strong mid-term growth potential and increase of
renovation share in revenues | Tondach realizes expected earnings growth in 2014
Contribution: Revenues € 87.3 mn | EBITDA € 15.4 mn
► Strengthening of Group financing structure Exchange of € 272 mn into new hybrid bond
Renewal and extension of credit line to € 400 mn
► Strong free cash flow generation results in improvement of net debt / op. EBITDA to 1.9x
Highlights 2014
4
► Improvement of operating EBITDA: +23% Revenues: € 686.0 mn | +9%
Operating EBITDA: € 69.1 mn | +23%
► Clay Building Materials Europe generates substantial earnings growth Volume growth in all product groups results in organic
earnings improvement
Consolidation contribution of Tondach Gleinstätten
► Pipes & Pavers Europe posts slight earnings growth
► North America Significant earnings improvement
Double digit volume growth of facing bricks
Highlights Q4 2014
5
► Wienerberger records total impairment charges of € 208 mn Impairments affect: USA, Germany, Italy, Russia, Estonia,
Pipelife France and small markets on the periphery
Impairment charges to assets: € 100.7 mn
Impairment charges to goodwill: € 106.9 mn
► Non-cash impairment charges prevent return to profit zone Profit after tax: € -170.0 mn
Non-recurring impairment charges
6
► Supervisory Board and Management Board propose increase of dividend from financial year 2014 to the Annual General Meeting: Proposed dividend: € 0.15 per share
Increase by 25% compared to prior year
► Strong commitment to dividend policy The generated free cash flow in the reporting period and
the liquidity planning are the basis for dividend payments
Going forward Wienerberger management plans to distribute 10 – 30% of free cash flow after hybrid coupon payments to shareholders
Dividend increase to € 0.15 per share
7
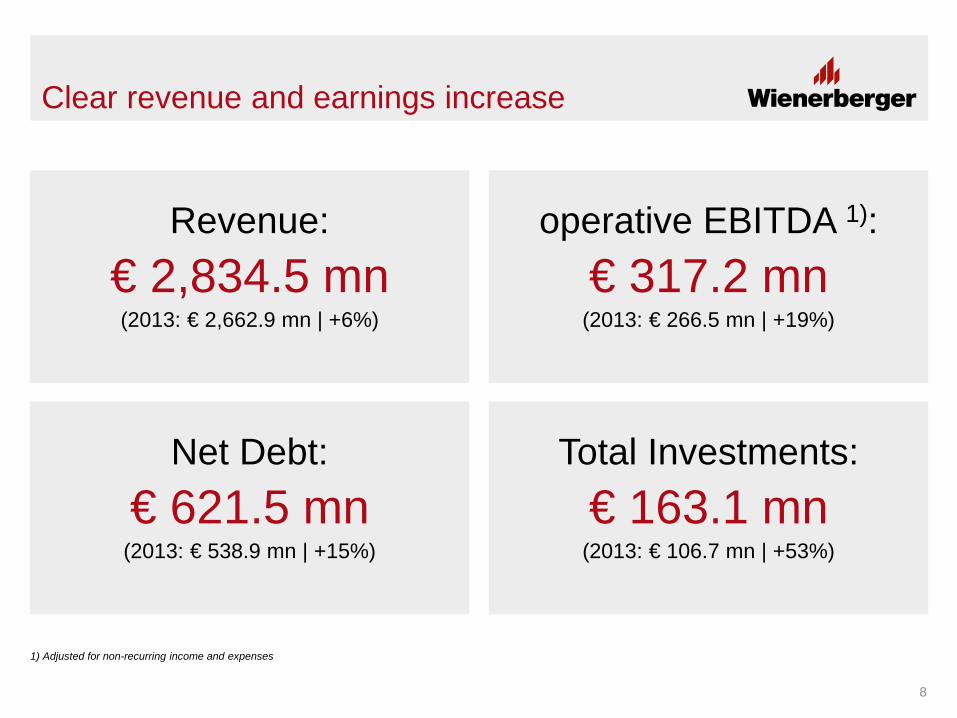
€ 2,834.5 mn (2013: € 2,662.9 mn | +6%)
Clear revenue and earnings increase
Revenue: € 317.2 mn
(2013: € 266.5 mn | +19%)
operative EBITDA 1):
€ 621.5 mn (2013: € 538.9 mn | +15%)
Net Debt: € 163.1 mn
(2013: € 106.7 mn | +53%)
Total Investments:
1) Adjusted for non-recurring income and expenses
8
Impairment charges in detail
► USA Assumptions for normalized level of housing activity unchanged at 1.5 mn housing starts |
EBITDA potential confirmed at € 60 mn
Recovery of residential construction progresses more slowly than expected
Mid-term planning assumptions adjusted for revised market growth forecasts and sustained price pressure
Impairment charges to goodwill: € 85 mn | Impairment charges to assets: € 15 mn
Implementation of measures to enhance profitability under way
► Germany Germany recorded an unexpected decline in 2014 | A small decline in one- and two family
home construction is also expected for 2015
Profitability does not meet our expectations
Implementation of measures to enhance profitability lead to revision of mid-term planning assumptions and impairment charges to assets of € 34 mn
9
Impairment charges in detail
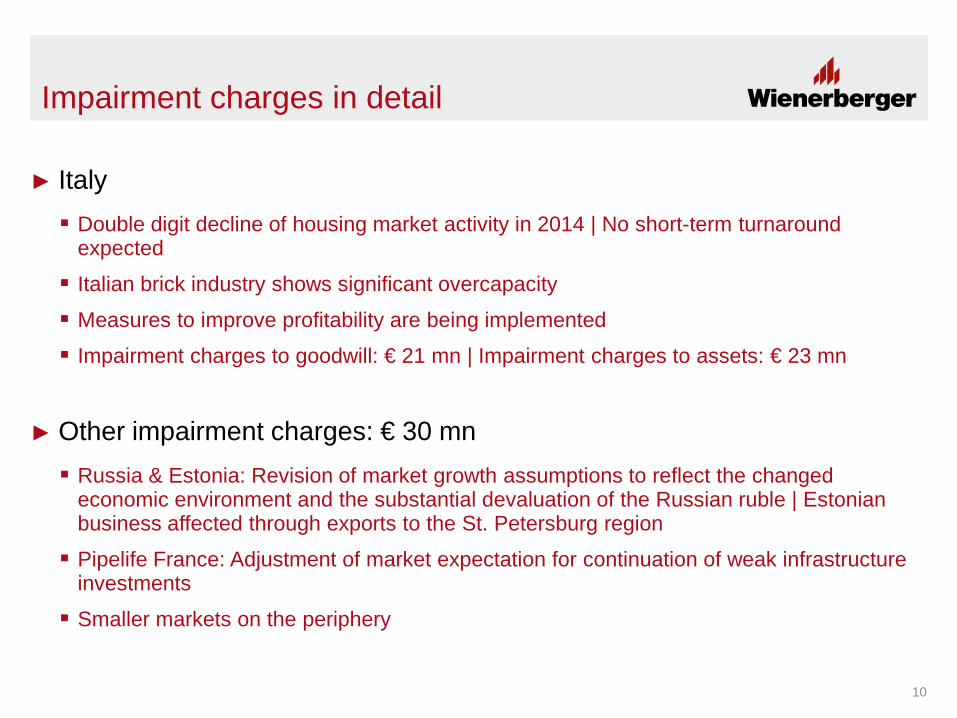
► Italy Double digit decline of housing market activity in 2014 | No short-term turnaround
expected
Italian brick industry shows significant overcapacity
Measures to improve profitability are being implemented
Impairment charges to goodwill: € 21 mn | Impairment charges to assets: € 23 mn
► Other impairment charges: € 30 mn Russia & Estonia: Revision of market growth assumptions to reflect the changed
economic environment and the substantial devaluation of the Russian ruble | Estonian business affected through exports to the St. Petersburg region
Pipelife France: Adjustment of market expectation for continuation of weak infrastructure investments
Smaller markets on the periphery
10
Clay Building Materials Europe
Pipes & Pavers Europe
North America
Holding & Others
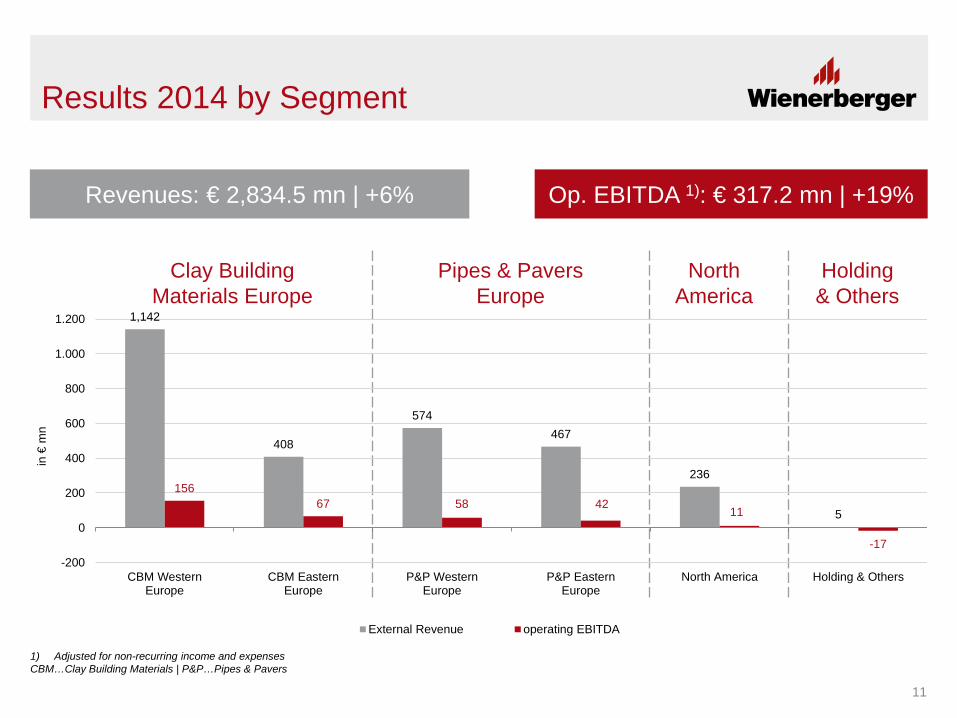
Results 2014 by Segment
Revenues: € 2,834.5 mn | +6% Op. EBITDA 1): € 317.2 mn | +19%
1,142
408
574 467
236
5
156 67 58 42
11
-17 -200
0
200
400
600
800
1.000
1.200
CBM WesternEurope
CBM EasternEurope
P&P WesternEurope
P&P EasternEurope
North America Holding & Others
in €
mn
External Revenue operating EBITDA
1) Adjusted for non-recurring income and expenses CBM…Clay Building Materials | P&P…Pipes & Pavers
11
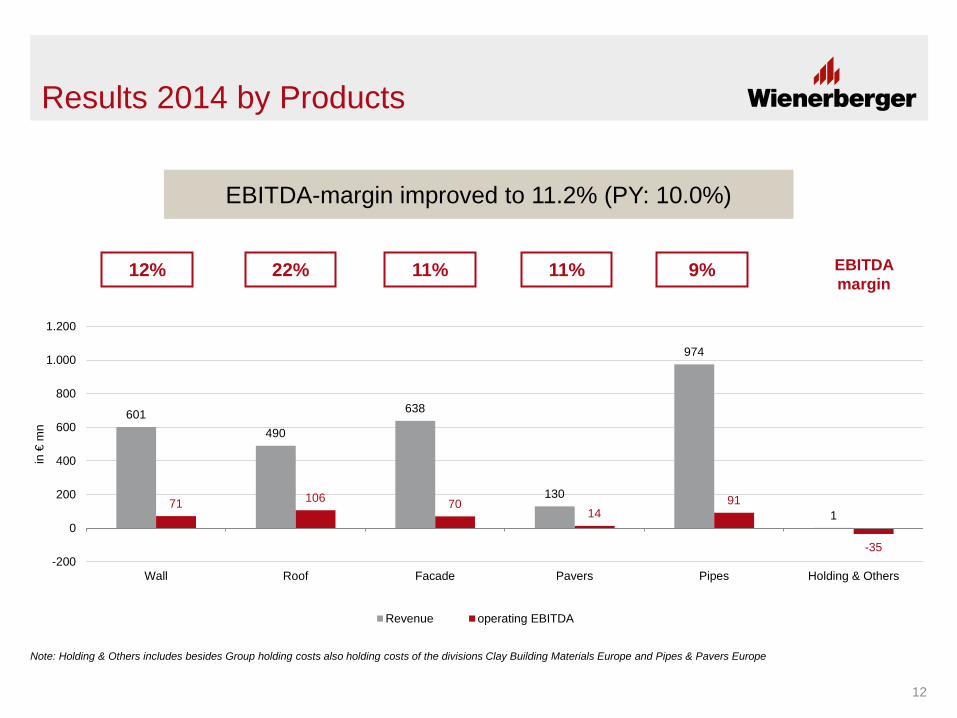
Results 2014 by Products
EBITDA margin
12% 22% 11% 11% 9%
EBITDA-margin improved to 11.2% (PY: 10.0%)
601 490
638
130
974
1 71 106 70
14 91
-35 -200
0
200
400
600
800
1.000
1.200
Wall Roof Facade Pavers Pipes Holding & Others
in €
mn
Revenue operating EBITDA
Note: Holding & Others includes besides Group holding costs also holding costs of the divisions Clay Building Materials Europe and Pipes & Pavers Europe
12
Results 2014
2.000
2.200
2.400
2.600
2.800
3.000
Revenue 2013 SalesVolume
SalesPrice
FX-Effect
TondachGleinstätten
Revenue 2014
in €
mn
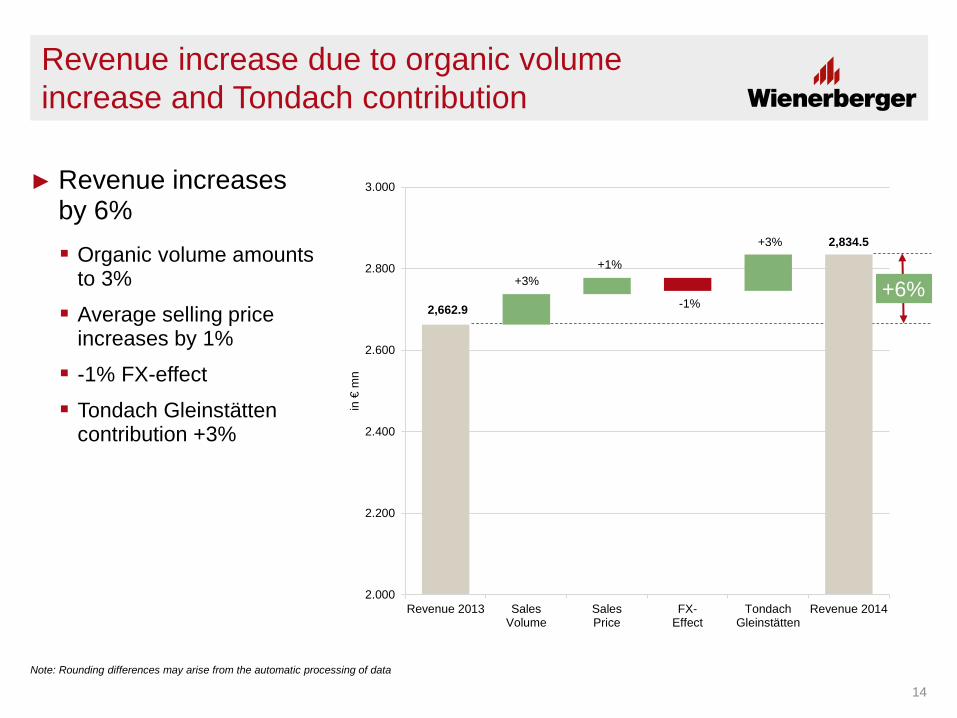
► Revenue increases by 6% Organic volume amounts
to 3%
Average selling price increases by 1%
-1% FX-effect
Tondach Gleinstätten contribution +3%
Revenue increase due to organic volume increase and Tondach contribution
2,662.9
+3% +1%
2,834.5
-1%
+3%
+6%
14
Note: Rounding differences may arise from the automatic processing of data
Slight increase of average prices
► Clay Building Materials Europe Western Europe: Despite market declines in F, IT and NL price increases above cost
inflation due to strong growth dynamics in GB
Eastern Europe: Stable to slight improvement of average prices in challenging market environment
Improvement of product mix through shift to value added products
► North America Ongoing price pressure in our relevant core markets
Lower average prices in the reporting period
► Pipelife Continuous price management to cover volatile raw material prices
15
Income statement 2014
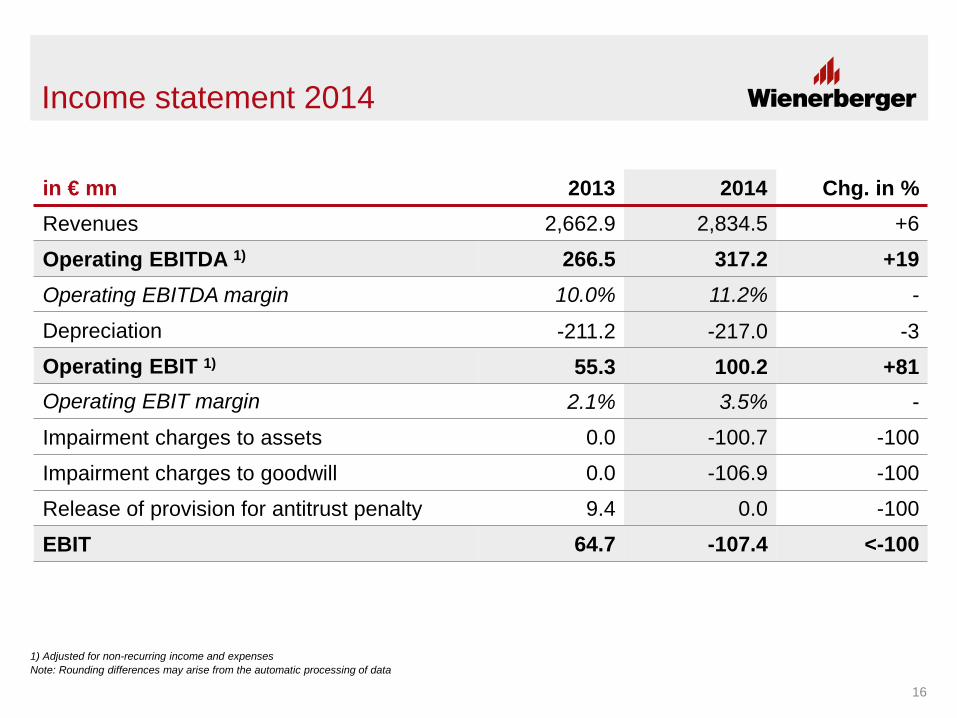
in € mn 2013 2014 Chg. in % Revenues 2,662.9 2,834.5 +6
Operating EBITDA 1) 266.5 317.2 +19 Operating EBITDA margin 10.0% 11.2% -
Depreciation -211.2 -217.0 -3 Operating EBIT 1) 55.3 100.2 +81 Operating EBIT margin 2.1% 3.5% -
Impairment charges to assets 0.0 -100.7 -100
Impairment charges to goodwill 0.0 -106.9 -100
Release of provision for antitrust penalty 9.4 0.0 -100
EBIT 64.7 -107.4 <-100
1) Adjusted for non-recurring income and expenses
16
Note: Rounding differences may arise from the automatic processing of data
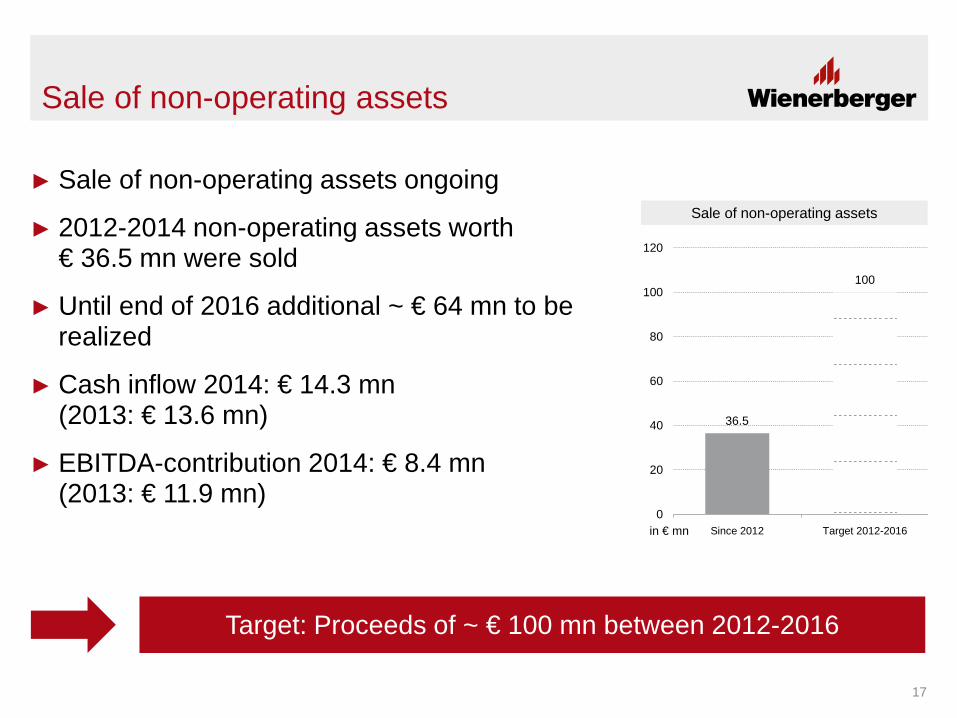
► Sale of non-operating assets ongoing
► 2012-2014 non-operating assets worth € 36.5 mn were sold
► Until end of 2016 additional ~ € 64 mn to be realized
► Cash inflow 2014: € 14.3 mn (2013: € 13.6 mn)
► EBITDA-contribution 2014: € 8.4 mn (2013: € 11.9 mn)
Sale of non-operating assets
36.5
100
0
20
40
60
80
100
120
Since 2012 Target 2012-2016in € mn
Sale of non-operating assets
17
Target: Proceeds of ~ € 100 mn between 2012-2016
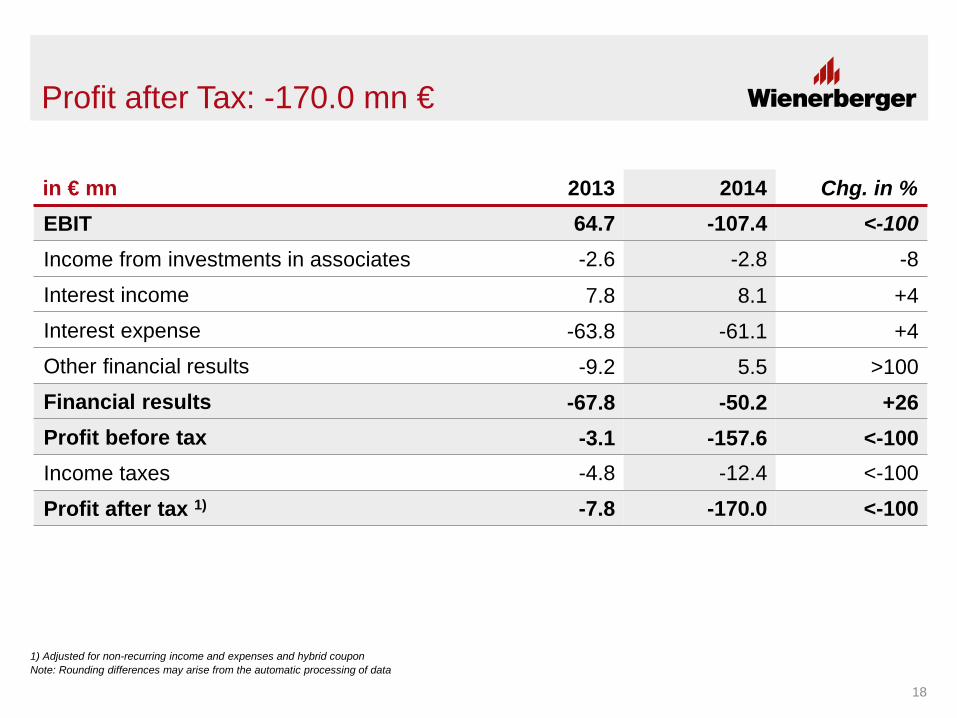
Profit after Tax: -170.0 mn €
in € mn 2013 2014 Chg. in % EBIT 64.7 -107.4 <-100 Income from investments in associates -2.6 -2.8 -8
Interest income 7.8 8.1 +4 Interest expense -63.8 -61.1 +4 Other financial results -9.2 5.5 >100 Financial results -67.8 -50.2 +26 Profit before tax -3.1 -157.6 <-100 Income taxes -4.8 -12.4 <-100
Profit after tax 1) -7.8 -170.0 <-100
1) Adjusted for non-recurring income and expenses and hybrid coupon
18
Note: Rounding differences may arise from the automatic processing of data
0
50
100
150
200
250
300
350
EBITDAFY 2013
CBMWE
CBMEE
P&PWE
P&PEE
NorthAmerica
Holding &Others
EBITDAFY 2014
in €
mn
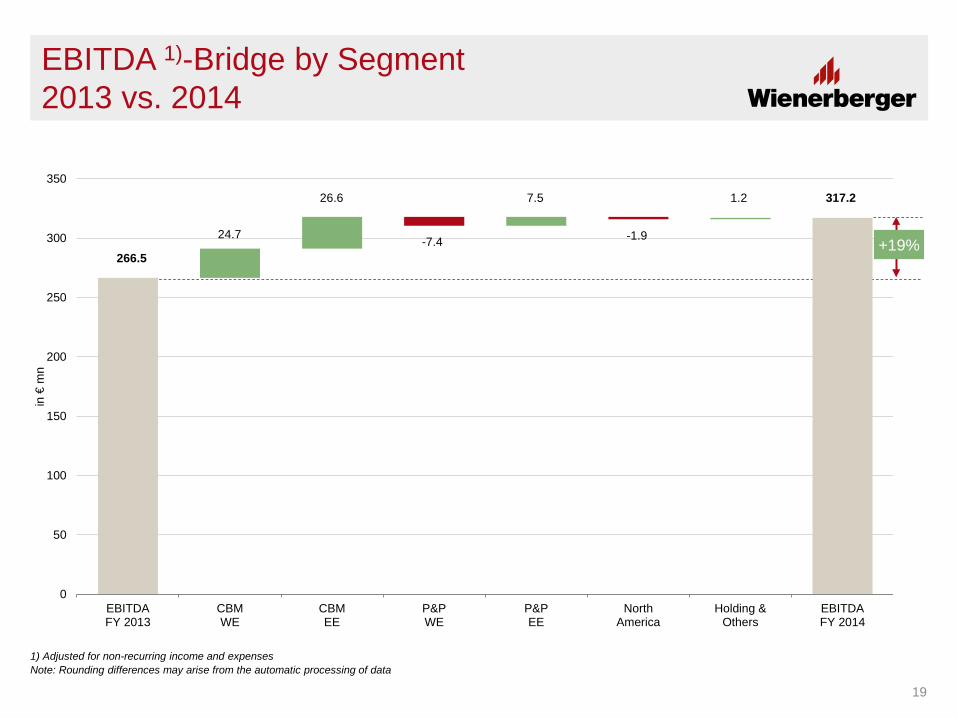
EBITDA 1)-Bridge by Segment 2013 vs. 2014
1) Adjusted for non-recurring income and expenses
19
266.5
317.2
24.7
1.2
-1.9
7.5
-7.4
26.6
+19%
Note: Rounding differences may arise from the automatic processing of data
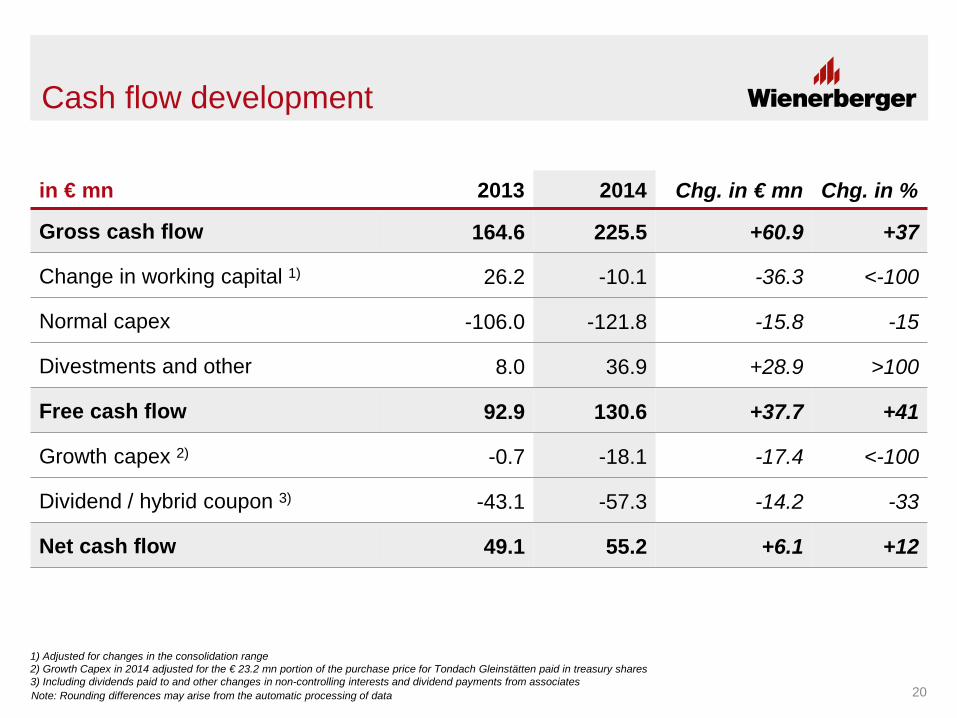
Cash flow development
in € mn 2013 2014 Chg. in € mn Chg. in %
Gross cash flow 164.6 225.5 +60.9 +37
Change in working capital 1) 26.2 -10.1 -36.3 <-100
Normal capex -106.0 -121.8 -15.8 -15
Divestments and other 8.0 36.9 +28.9 >100
Free cash flow 92.9 130.6 +37.7 +41
Growth capex 2) -0.7 -18.1 -17.4 <-100
Dividend / hybrid coupon 3) -43.1 -57.3 -14.2 -33
Net cash flow 49.1 55.2 +6.1 +12
1) Adjusted for changes in the consolidation range 2) Growth Capex in 2014 adjusted for the € 23.2 mn portion of the purchase price for Tondach Gleinstätten paid in treasury shares 3) Including dividends paid to and other changes in non-controlling interests and dividend payments from associates
20 Note: Rounding differences may arise from the automatic processing of data
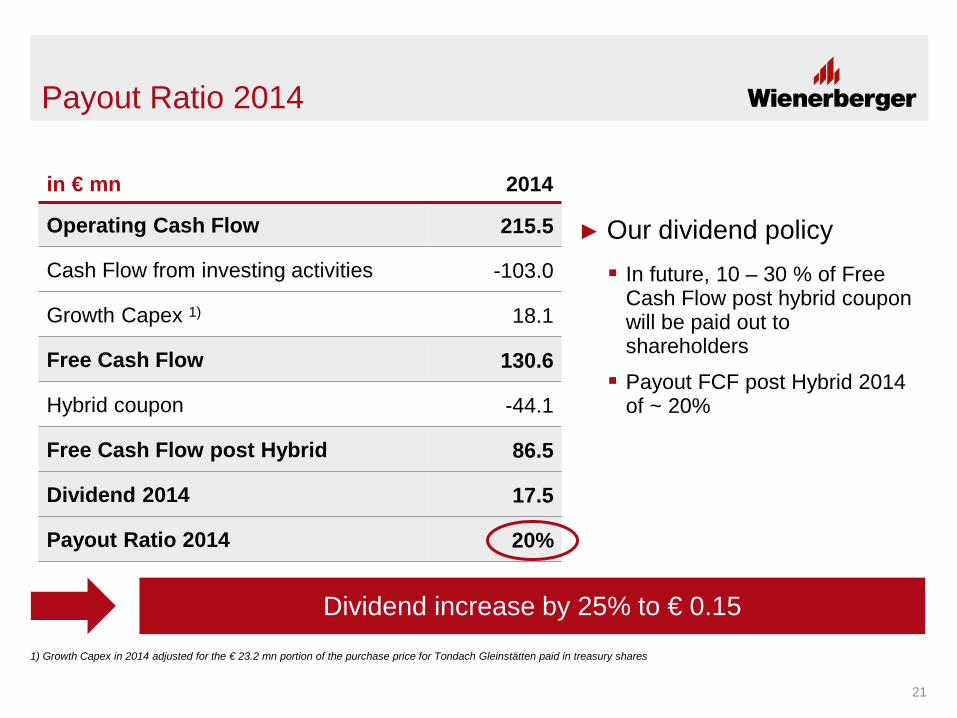
Payout Ratio 2014
in € mn 2014
Operating Cash Flow 215.5
Cash Flow from investing activities -103.0
Growth Capex 1) 18.1
Free Cash Flow 130.6
Hybrid coupon -44.1
Free Cash Flow post Hybrid 86.5
Dividend 2014 17.5
Payout Ratio 2014 20%
21
Dividend increase by 25% to € 0.15
► Our dividend policy In future, 10 – 30 % of Free
Cash Flow post hybrid coupon will be paid out to shareholders
Payout FCF post Hybrid 2014 of ~ 20%
1) Growth Capex in 2014 adjusted for the € 23.2 mn portion of the purchase price for Tondach Gleinstätten paid in treasury shares
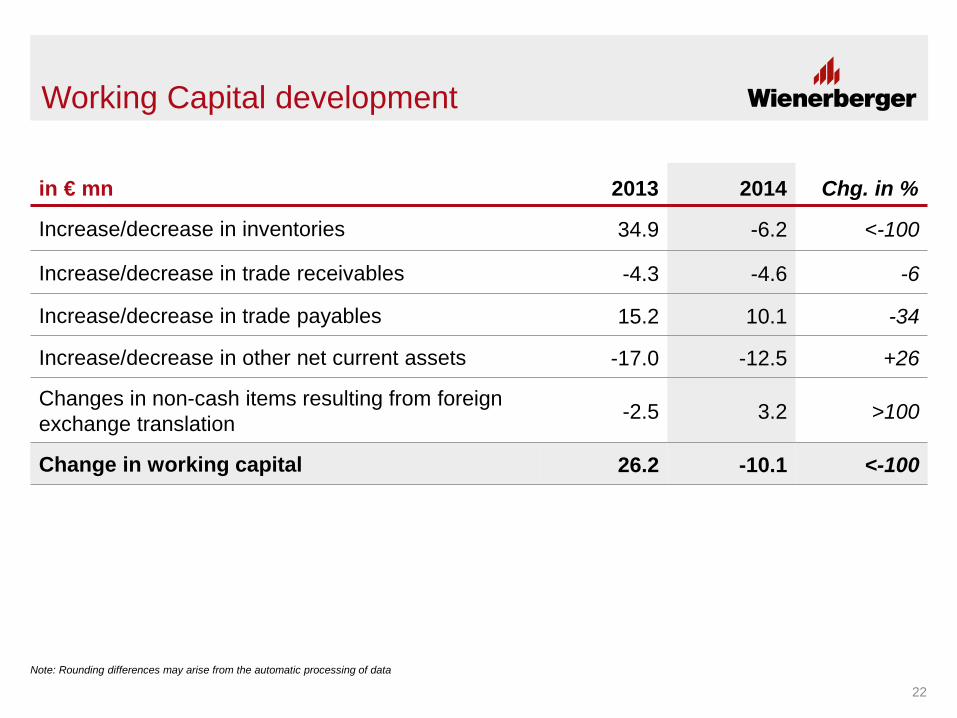
in € mn 2013 2014 Chg. in %
Increase/decrease in inventories 34.9 -6.2 <-100
Increase/decrease in trade receivables -4.3 -4.6 -6
Increase/decrease in trade payables 15.2 10.1 -34
Increase/decrease in other net current assets -17.0 -12.5 +26
Changes in non-cash items resulting from foreign exchange translation -2.5 3.2 >100
Change in working capital 26.2 -10.1 <-100
Working Capital development
22
Note: Rounding differences may arise from the automatic processing of data
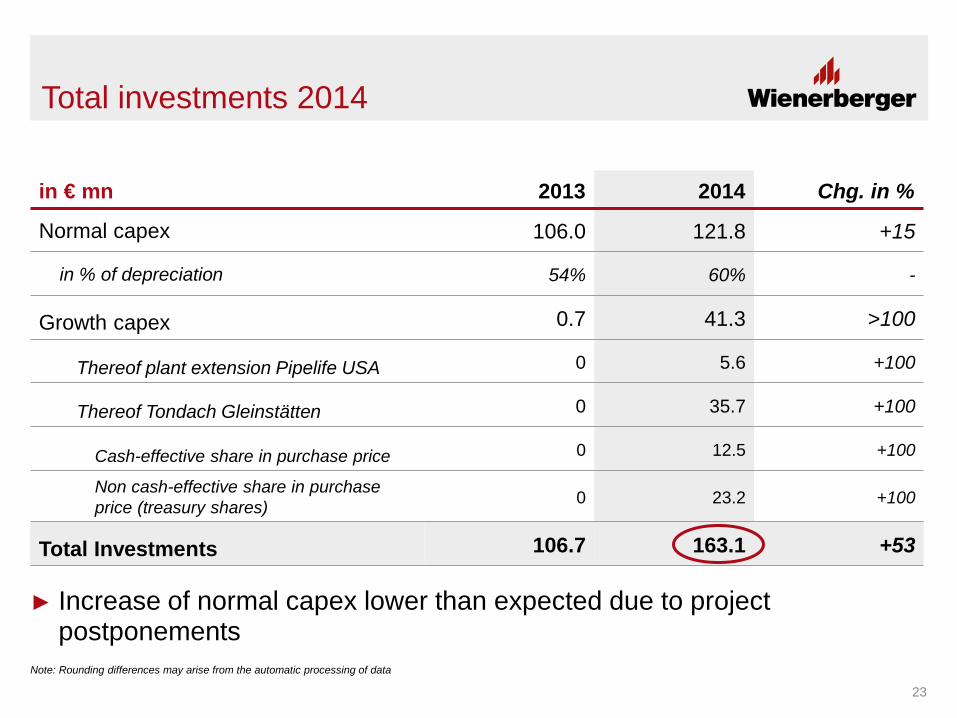
in € mn 2013 2014 Chg. in %
Normal capex 106.0 121.8 +15
in % of depreciation 54% 60% -
Growth capex 0.7 41.3 >100
Thereof plant extension Pipelife USA 0 5.6 +100
Thereof Tondach Gleinstätten 0 35.7 +100
Cash-effective share in purchase price 0 12.5 +100
Non cash-effective share in purchase price (treasury shares) 0 23.2 +100
Total Investments 106.7 163.1 +53
Total investments 2014
23
► Increase of normal capex lower than expected due to project postponements
Note: Rounding differences may arise from the automatic processing of data
0
100
200
300
400
500
600
700
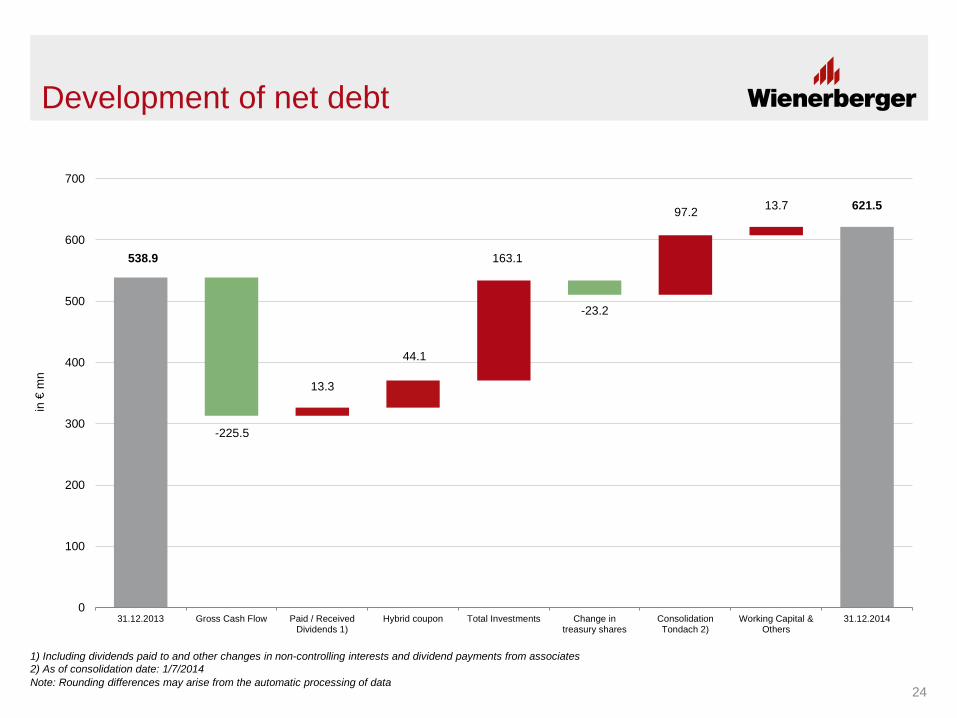
31.12.2013 Gross Cash Flow Paid / ReceivedDividends 1)
Hybrid coupon Total Investments Change intreasury shares
ConsolidationTondach 2)
Working Capital &Others
31.12.2014
in €
mn
538.9
-225.5
44.1
13.3
13.7
-23.2
163.1
97.2
Development of net debt
24
621.5
1) Including dividends paid to and other changes in non-controlling interests and dividend payments from associates 2) As of consolidation date: 1/7/2014 Note: Rounding differences may arise from the automatic processing of data
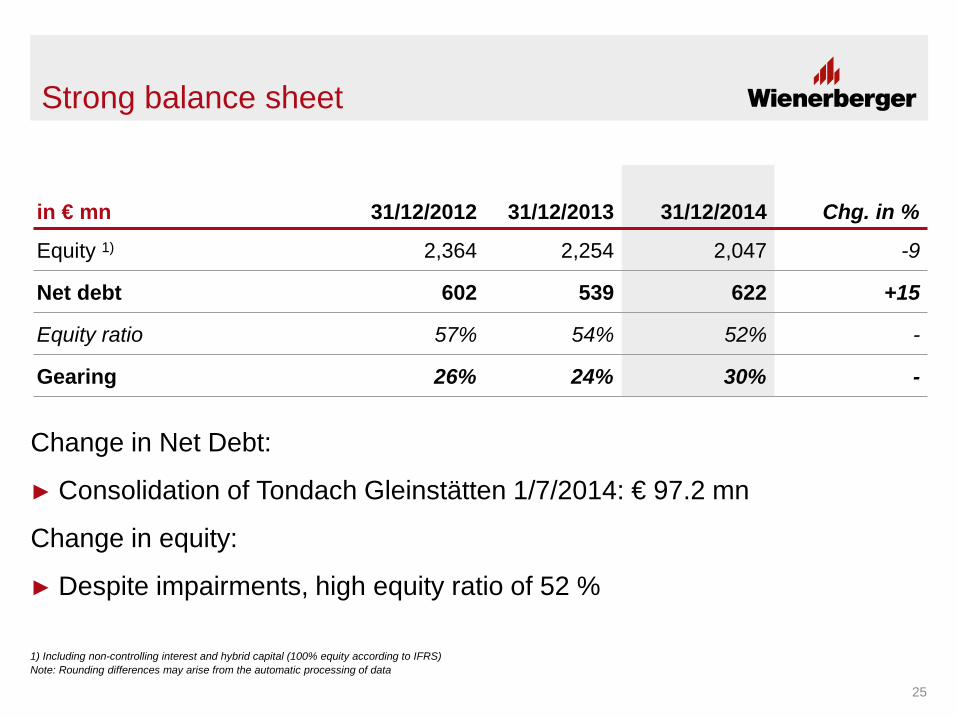
Strong balance sheet
in € mn 31/12/2012 31/12/2013 31/12/2014 Chg. in %
Equity 1) 2,364 2,254 2,047 -9
Net debt 602 539 622 +15
Equity ratio 57% 54% 52% -
Gearing 26% 24% 30% -
25
1) Including non-controlling interest and hybrid capital (100% equity according to IFRS)
Change in Net Debt:
► Consolidation of Tondach Gleinstätten 1/7/2014: € 97.2 mn
Change in equity:
► Despite impairments, high equity ratio of 52 %
Note: Rounding differences may arise from the automatic processing of data
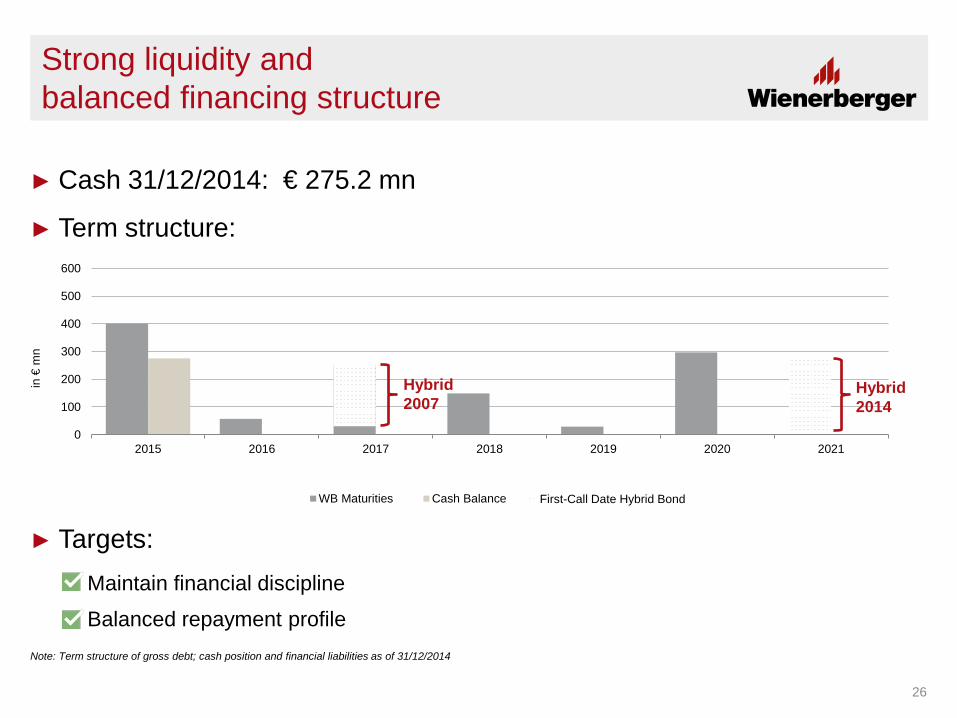
► Cash 31/12/2014: € 275.2 mn
► Term structure:
► Targets: Maintain financial discipline
Balanced repayment profile
0
100
200
300
400
500
600
2015 2016 2017 2018 2019 2020 2021
in €
mn
WB Maturities Cash Balance First-Call Date Hybrid Bond
Strong liquidity and balanced financing structure
Hybrid 2007
Hybrid 2014
26
Note: Term structure of gross debt; cash position and financial liabilities as of 31/12/2014
Financing measures 2014
► Successfull exchange of hybrid bond Further step to protect strong capital structure and balanced financing profile
Wienerberger exchanges € 272 mn of existing 2007 hybrid bond for new 2014 hybrid bond
Substantial interest in the exchange offer confirms strong confidence of our investors
► Liquidity reserves secured up to 2019 New revolving credit line replaces previous revolving credit lines
Increase in the volume to € 400 mn for ongoing general corporate purposes
Optimization of financing costs
27
Financial discipline remains top priority
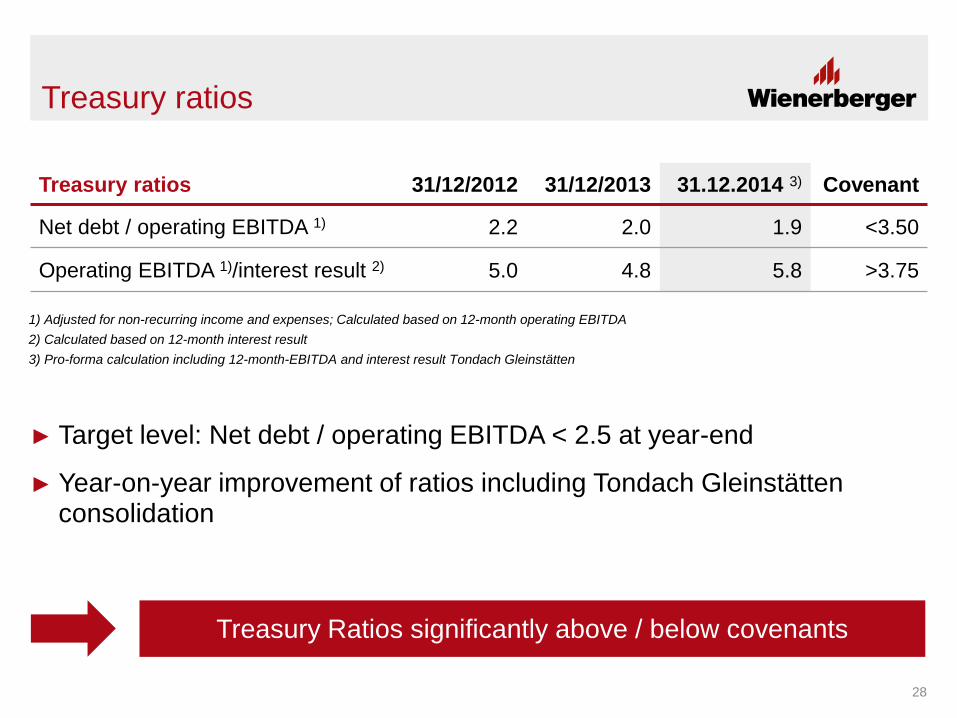
Treasury ratios 31/12/2012 31/12/2013 31.12.2014 3) Covenant
Net debt / operating EBITDA 1) 2.2 2.0 1.9 <3.50
Operating EBITDA 1)/interest result 2) 5.0 4.8 5.8 >3.75
► Target level: Net debt / operating EBITDA < 2.5 at year-end
► Year-on-year improvement of ratios including Tondach Gleinstätten consolidation
Treasury ratios
1) Adjusted for non-recurring income and expenses; Calculated based on 12-month operating EBITDA 2) Calculated based on 12-month interest result 3) Pro-forma calculation including 12-month-EBITDA and interest result Tondach Gleinstätten
Treasury Ratios significantly above / below covenants
28
Wienerberger Segments
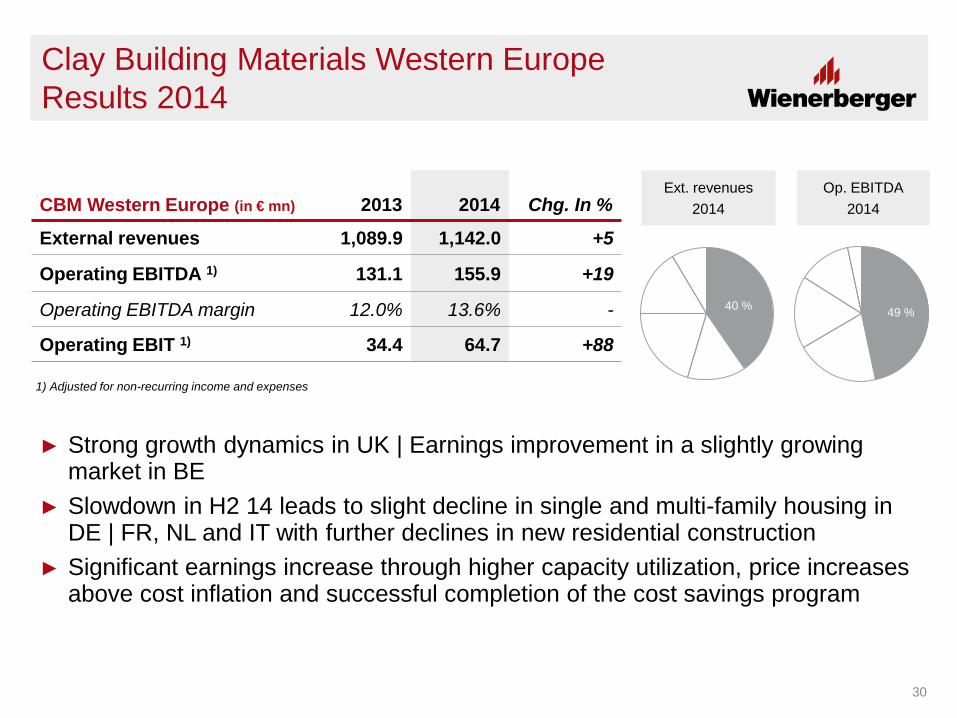
Clay Building Materials Western Europe Results 2014
CBM Western Europe (in € mn) 2013 2014 Chg. In %
External revenues 1,089.9 1,142.0 +5
Operating EBITDA 1) 131.1 155.9 +19
Operating EBITDA margin 12.0% 13.6% -
Operating EBIT 1) 34.4 64.7 +88
Ext. revenues 2014
Op. EBITDA 2014
1) Adjusted for non-recurring income and expenses
40% 49% 40 % 49 %
30
► Strong growth dynamics in UK | Earnings improvement in a slightly growing market in BE
► Slowdown in H2 14 leads to slight decline in single and multi-family housing in DE | FR, NL and IT with further declines in new residential construction
► Significant earnings increase through higher capacity utilization, price increases above cost inflation and successful completion of the cost savings program
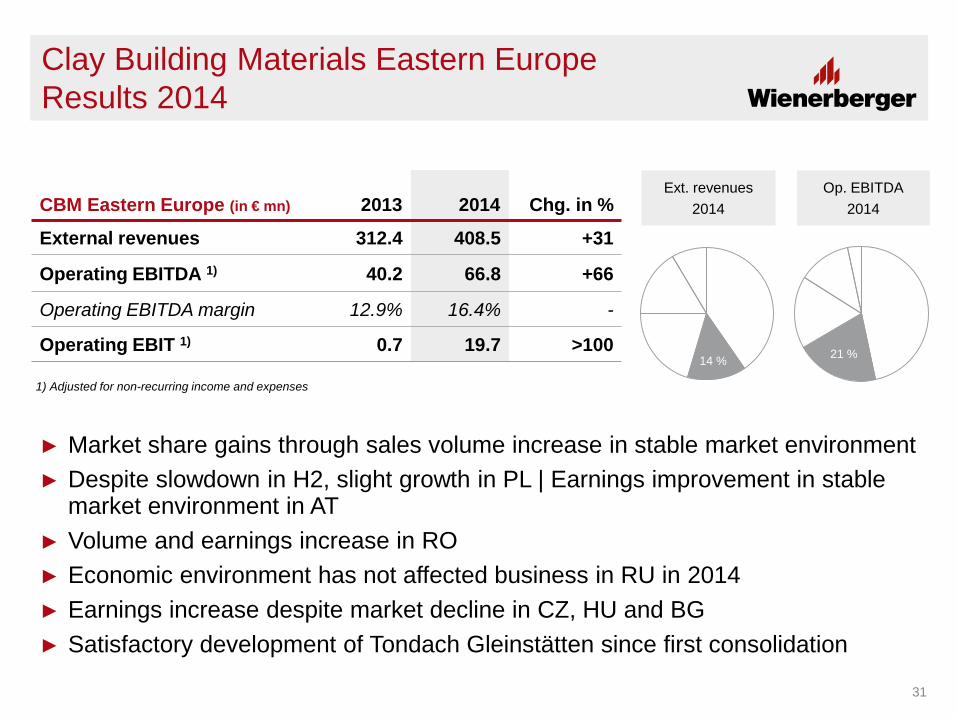
Clay Building Materials Eastern Europe Results 2014
CBM Eastern Europe (in € mn) 2013 2014 Chg. in %
External revenues 312.4 408.5 +31
Operating EBITDA 1) 40.2 66.8 +66
Operating EBITDA margin 12.9% 16.4% -
Operating EBIT 1) 0.7 19.7 >100
Ext. revenues 2014
Op. EBITDA 2014
1) Adjusted for non-recurring income and expenses
49% 17%
14 % 21 %
31
► Market share gains through sales volume increase in stable market environment ► Despite slowdown in H2, slight growth in PL | Earnings improvement in stable
market environment in AT ► Volume and earnings increase in RO ► Economic environment has not affected business in RU in 2014 ► Earnings increase despite market decline in CZ, HU and BG ► Satisfactory development of Tondach Gleinstätten since first consolidation
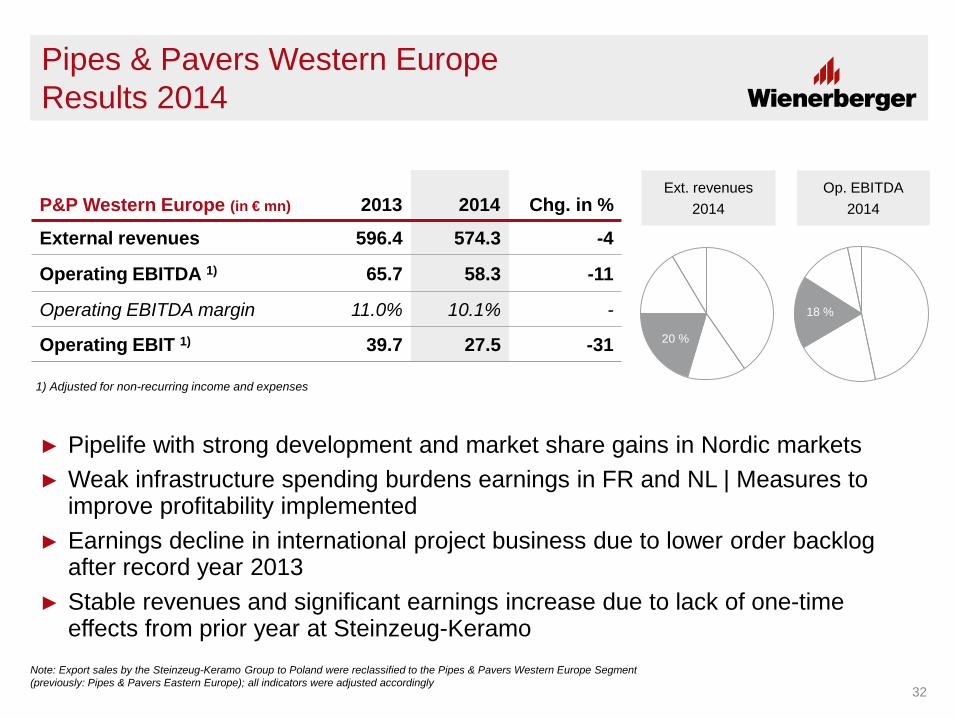
Pipes & Pavers Western Europe Results 2014
P&P Western Europe (in € mn) 2013 2014 Chg. in %
External revenues 596.4 574.3 -4
Operating EBITDA 1) 65.7 58.3 -11
Operating EBITDA margin 11.0% 10.1% -
Operating EBIT 1) 39.7 27.5 -31
Ext. revenues 2014
Op. EBITDA 2014
1) Adjusted for non-recurring income and expenses
40% 49% 20 %
18 %
32
► Pipelife with strong development and market share gains in Nordic markets ► Weak infrastructure spending burdens earnings in FR and NL | Measures to
improve profitability implemented ► Earnings decline in international project business due to lower order backlog
after record year 2013 ► Stable revenues and significant earnings increase due to lack of one-time
effects from prior year at Steinzeug-Keramo Note: Export sales by the Steinzeug-Keramo Group to Poland were reclassified to the Pipes & Pavers Western Europe Segment (previously: Pipes & Pavers Eastern Europe); all indicators were adjusted accordingly
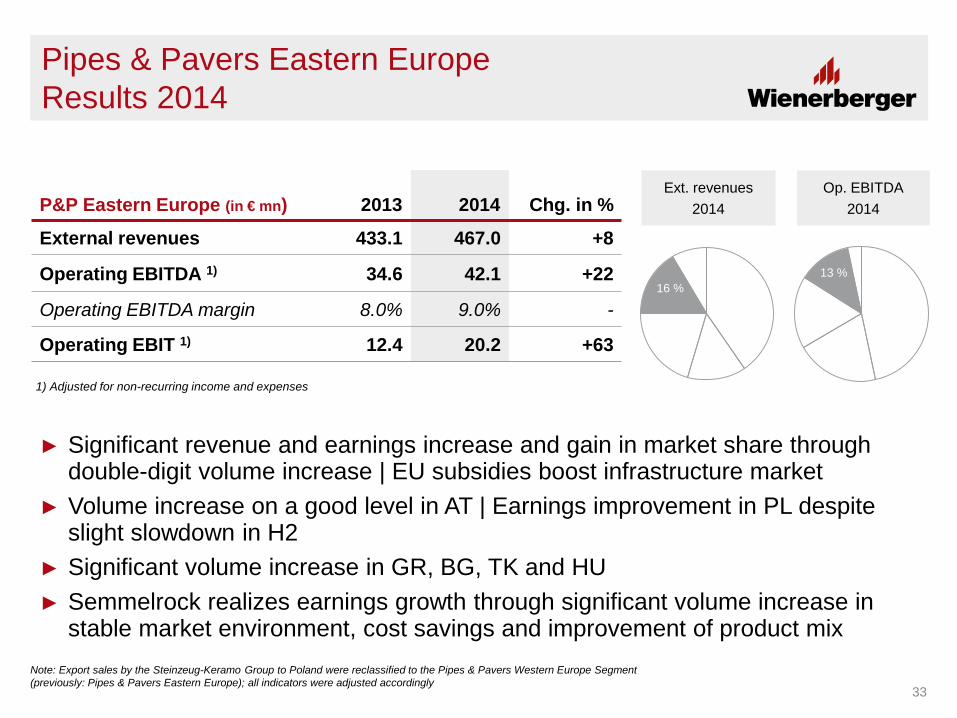
Pipes & Pavers Eastern Europe Results 2014
P&P Eastern Europe (in € mn) 2013 2014 Chg. in %
External revenues 433.1 467.0 +8
Operating EBITDA 1) 34.6 42.1 +22
Operating EBITDA margin 8.0% 9.0% -
Operating EBIT 1) 12.4 20.2 +63
1) Adjusted for non-recurring income and expenses
40% 49% 16 %
13 %
33
Ext. revenues 2014
Op. EBITDA 2014
► Significant revenue and earnings increase and gain in market share through double-digit volume increase | EU subsidies boost infrastructure market
► Volume increase on a good level in AT | Earnings improvement in PL despite slight slowdown in H2
► Significant volume increase in GR, BG, TK and HU ► Semmelrock realizes earnings growth through significant volume increase in
stable market environment, cost savings and improvement of product mix Note: Export sales by the Steinzeug-Keramo Group to Poland were reclassified to the Pipes & Pavers Western Europe Segment
(previously: Pipes & Pavers Eastern Europe); all indicators were adjusted accordingly
North America Results 2014
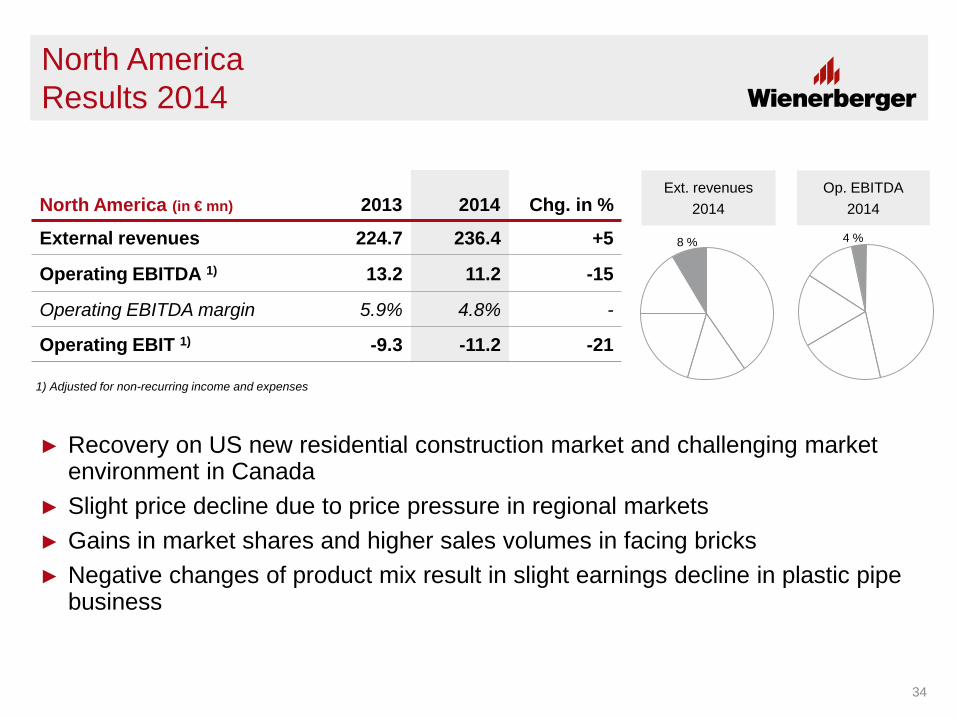
North America (in € mn) 2013 2014 Chg. in %
External revenues 224.7 236.4 +5
Operating EBITDA 1) 13.2 11.2 -15
Operating EBITDA margin 5.9% 4.8% -
Operating EBIT 1) -9.3 -11.2 -21
40% 49%
Ext. revenues 2014
Op. EBITDA 2014
1) Adjusted for non-recurring income and expenses
4 % 8 %
34
► Recovery on US new residential construction market and challenging market environment in Canada
► Slight price decline due to price pressure in regional markets ► Gains in market shares and higher sales volumes in facing bricks ► Negative changes of product mix result in slight earnings decline in plastic pipe
business
Outlook 2015
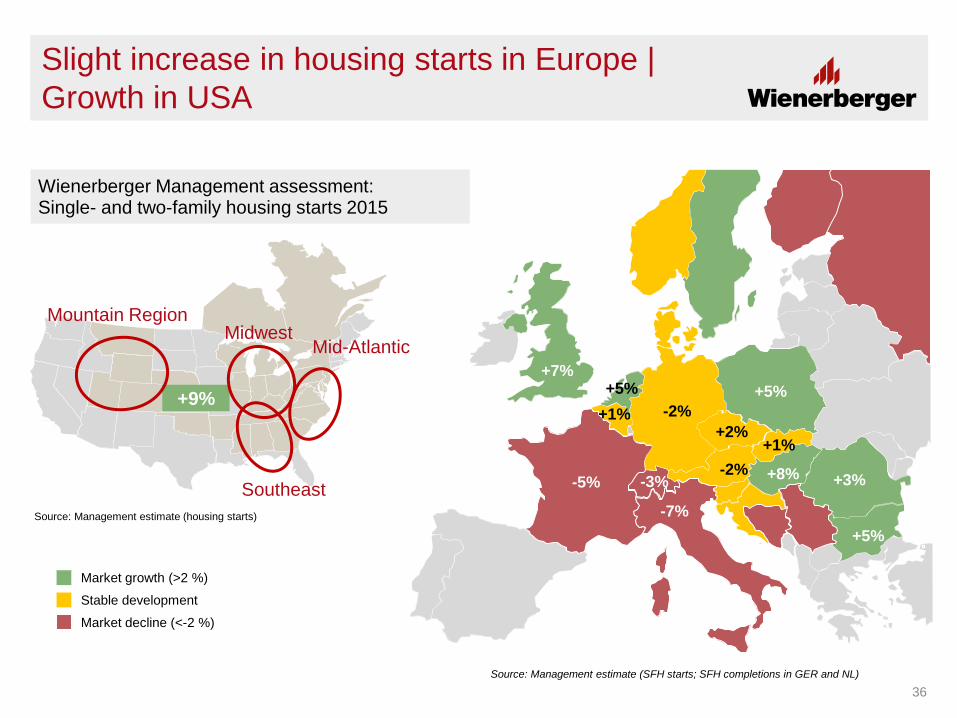
Mid-Atlantic Midwest
Southeast
Mountain Region
+9%
Source: Management estimate (housing starts)
Slight increase in housing starts in Europe | Growth in USA
Wienerberger Management assessment: Single- and two-family housing starts 2015
Source: Management estimate (SFH starts; SFH completions in GER and NL)
-5%
-2% +1% +5%
+7%
-2% -3%
+1%
+5%
+8%
+2%
+3%
+5% -7%
Market growth (>2 %)
Stable development
Market decline (<-2 %)
36

► Euroconstruct estimate: Repair, maintenance and improvement spending in residential construction in 2015
Moderate growth in RMI spendings
Source: Euroconstruct November 2014 (RMI spending in residential construction)
+3%
+1%
0% +3% +1%
+3%
+1% +1%
+3% -2%
+3%
+3%
37
+3%
Market growth (>2 %)
Stable development
Market decline (<-2 %)
► Stable to slightly positive development of European residential construction activity
► Moderate volume increase
► Price increases in line with cost inflation
► Implementation of measures to optimize cost structure and improve efficiency of internal processes ongoing
► Consolidation effect Tondach Gleinstätten in Clay Building Materials Eastern Europe Segment in H1 15: Revenue: ~ € 67 mn | EBITDA ~ € 8 mn
Clay Building Materials Europe: Outlook 2015
38
Significant revenue and earnings increase
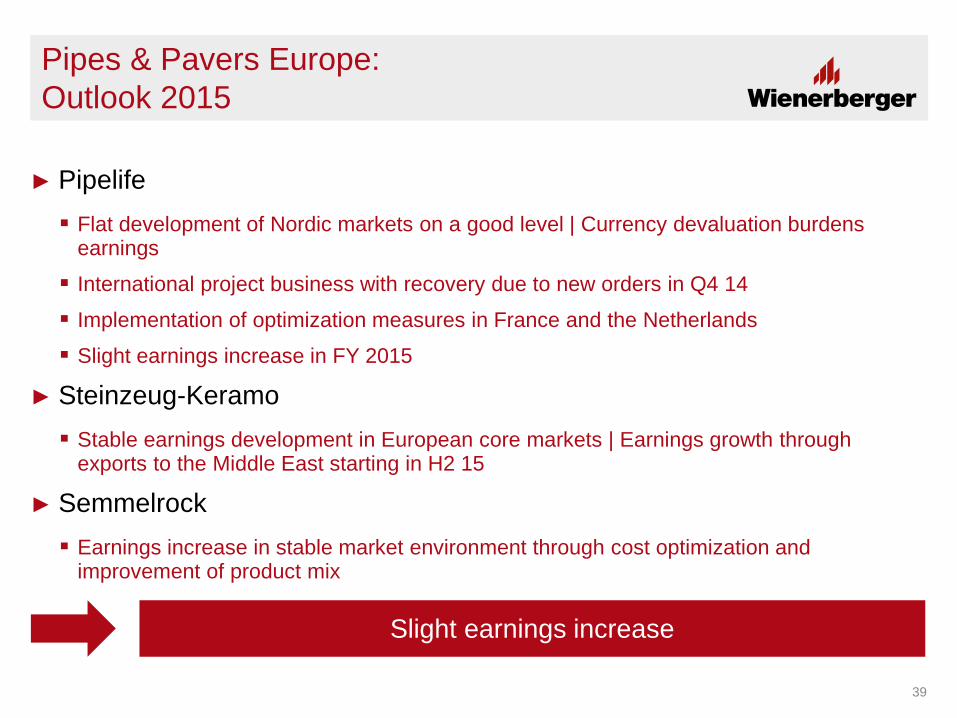
► Pipelife Flat development of Nordic markets on a good level | Currency devaluation burdens
earnings
International project business with recovery due to new orders in Q4 14
Implementation of optimization measures in France and the Netherlands
Slight earnings increase in FY 2015
► Steinzeug-Keramo Stable earnings development in European core markets | Earnings growth through
exports to the Middle East starting in H2 15
► Semmelrock Earnings increase in stable market environment through cost optimization and
improvement of product mix
Pipes & Pavers Europe: Outlook 2015
39
Slight earnings increase
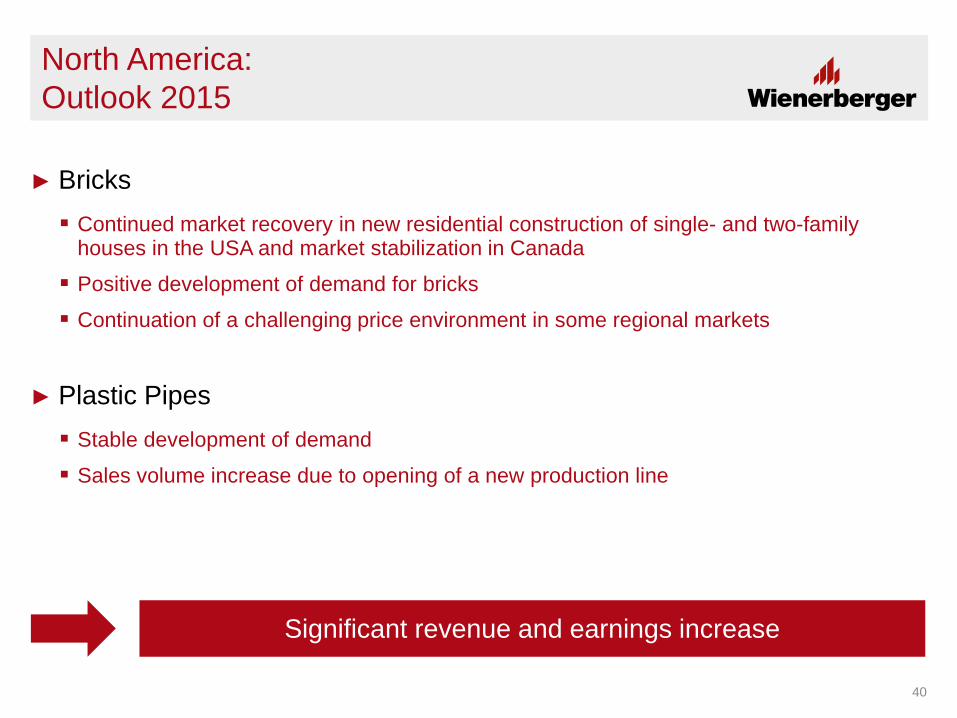
► Bricks Continued market recovery in new residential construction of single- and two-family
houses in the USA and market stabilization in Canada
Positive development of demand for bricks
Continuation of a challenging price environment in some regional markets
► Plastic Pipes Stable development of demand
Sales volume increase due to opening of a new production line
North America: Outlook 2015
40
Significant revenue and earnings increase
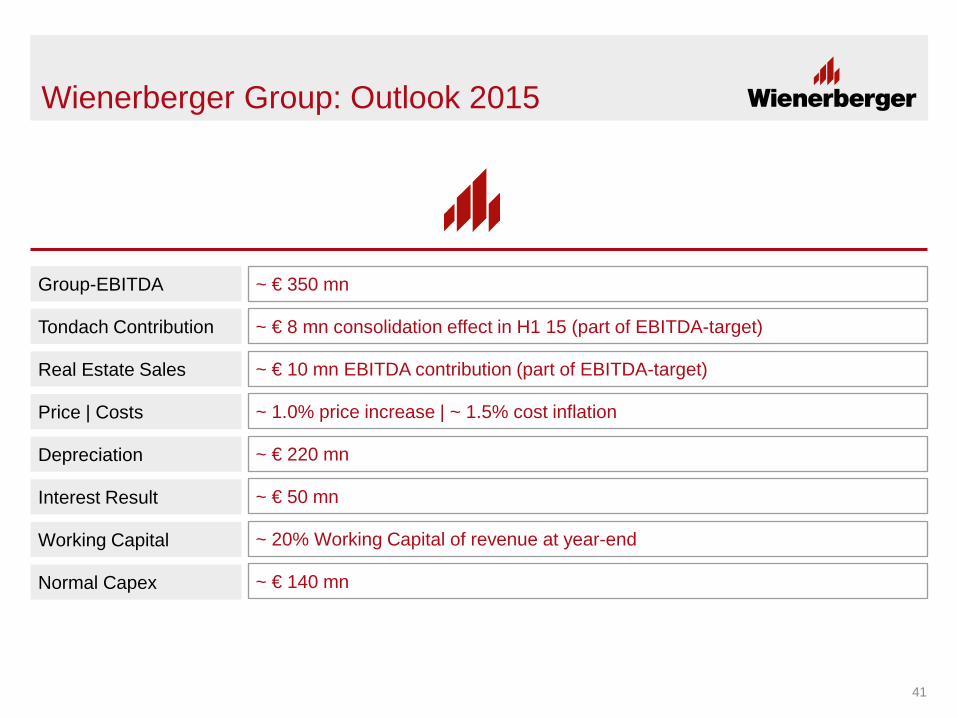
Wienerberger Group: Outlook 2015
Real Estate Sales
Group-EBITDA
Normal Capex
Working Capital
Interest Result
Depreciation
Price | Costs
Tondach Contribution
~ € 10 mn EBITDA contribution (part of EBITDA-target)
~ € 350 mn
~ € 140 mn
~ 20% Working Capital of revenue at year-end
~ € 50 mn
~ € 220 mn
~ 1.0% price increase | ~ 1.5% cost inflation
~ € 8 mn consolidation effect in H1 15 (part of EBITDA-target)
41
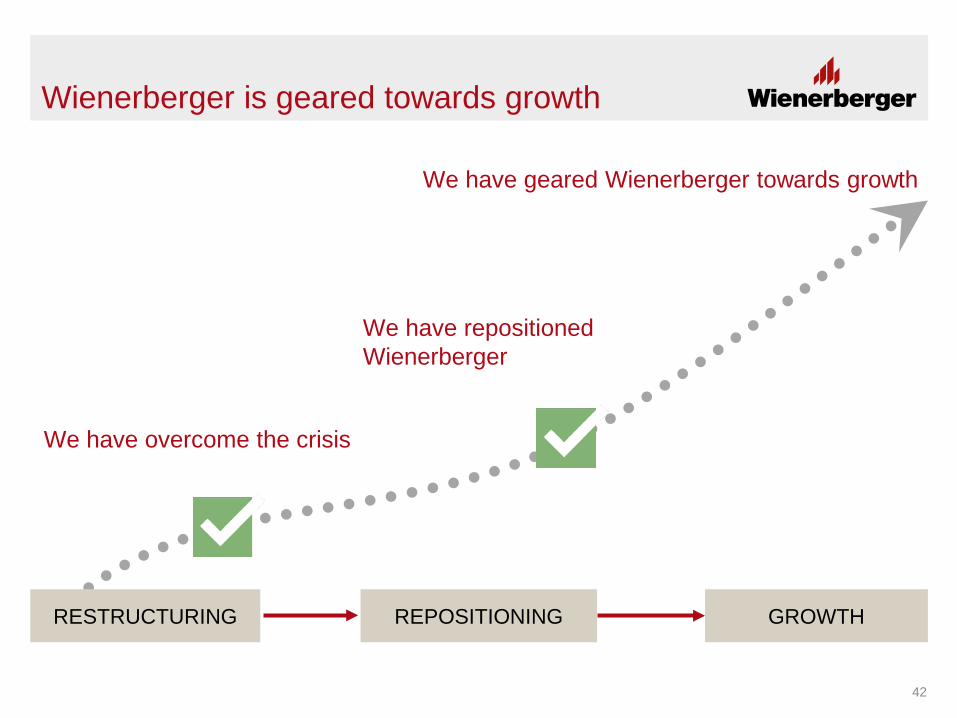
Wienerberger is geared towards growth
We have geared Wienerberger towards growth
GROWTH
We have overcome the crisis
RESTRUCTURING
We have repositioned Wienerberger
REPOSITIONING
42

Thank you for your attention!
Wienerberger Investor Relations Wienerberger AG, A-1100 Vienna, Wienerberg City, Wienerbergstrasse 11 T +43 1 60192 10221 / F +43 1 60192 10425, [email protected] / www.wienerberger.com