Embed Size (px)
Citation preview

Previously…
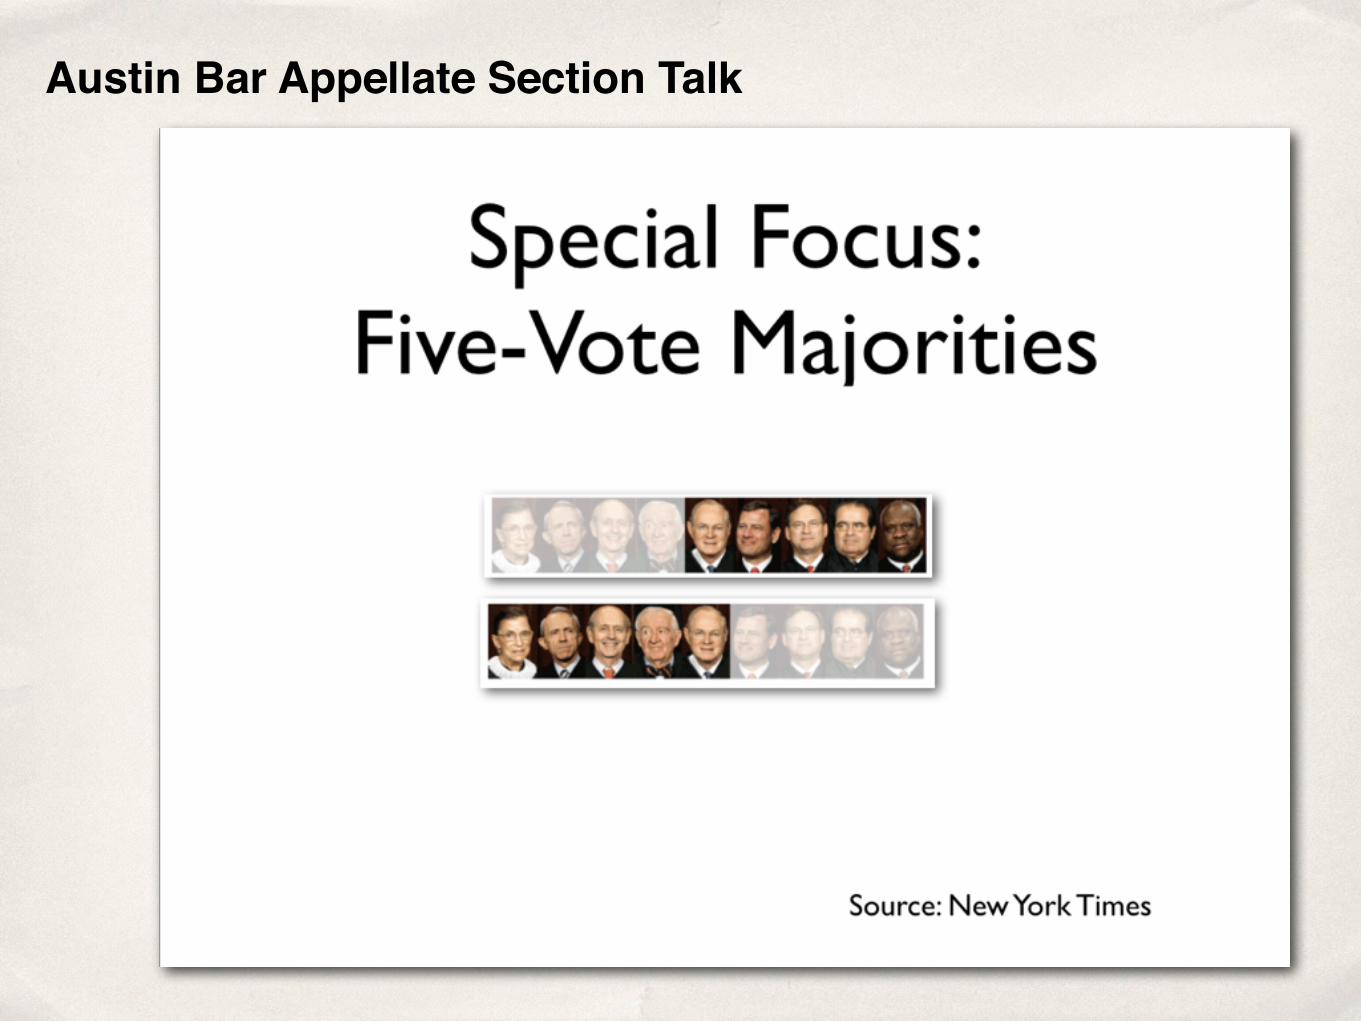
Austin Bar Appellate Section Talk

111111111111112233
20
35 U.S. Supreme Court
Over the same time period, almost 70% of 5-4 decisions!
are one of two patterns

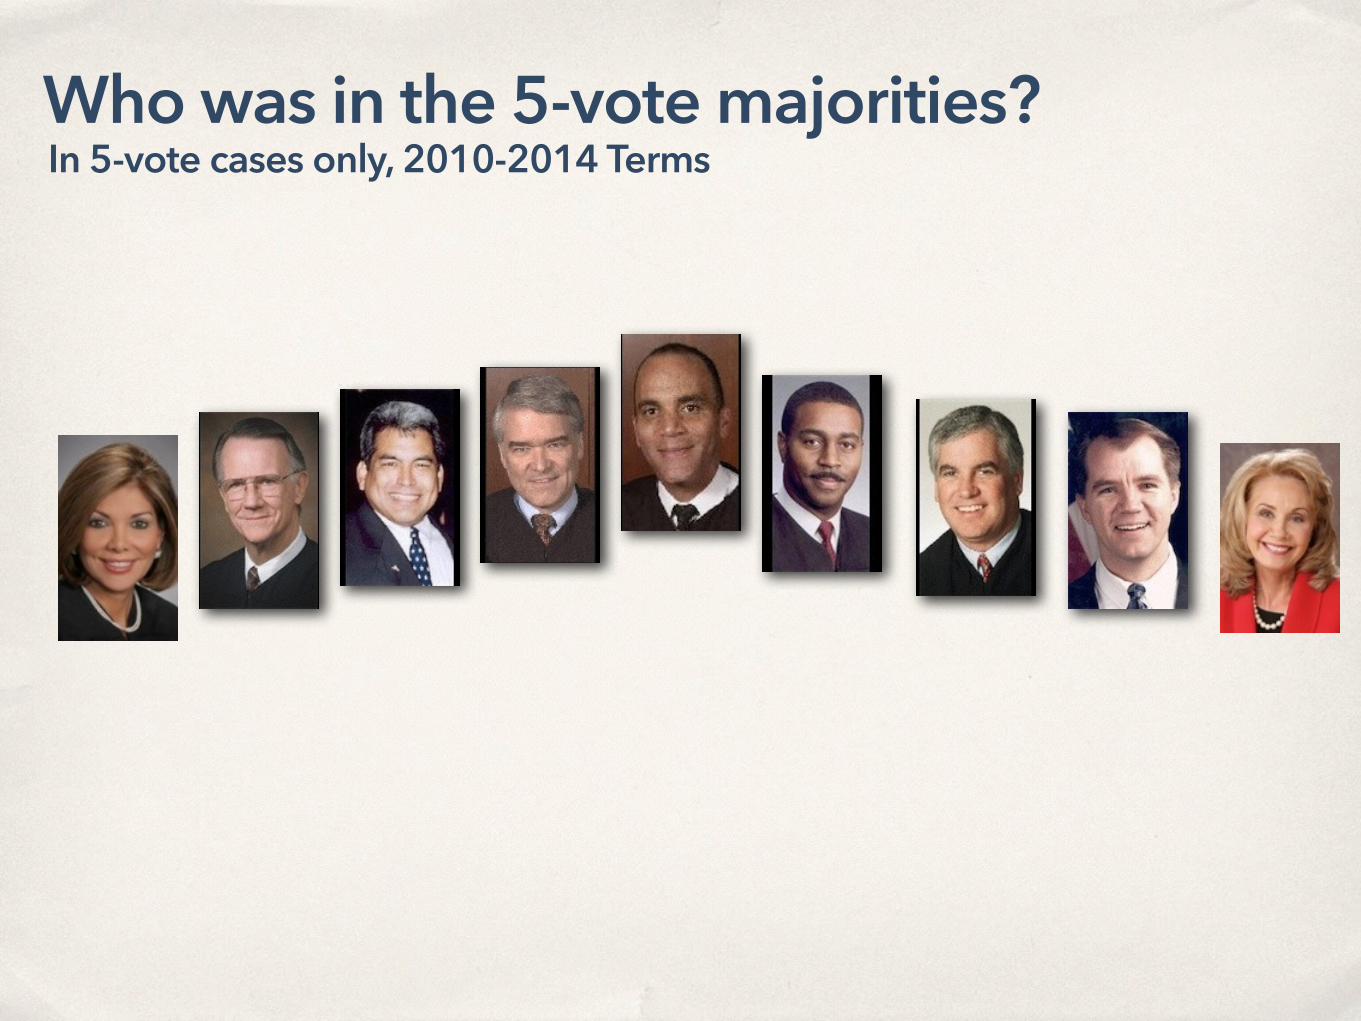
How did the Texas Supreme Court divide up in these 37
5-4 decisions?
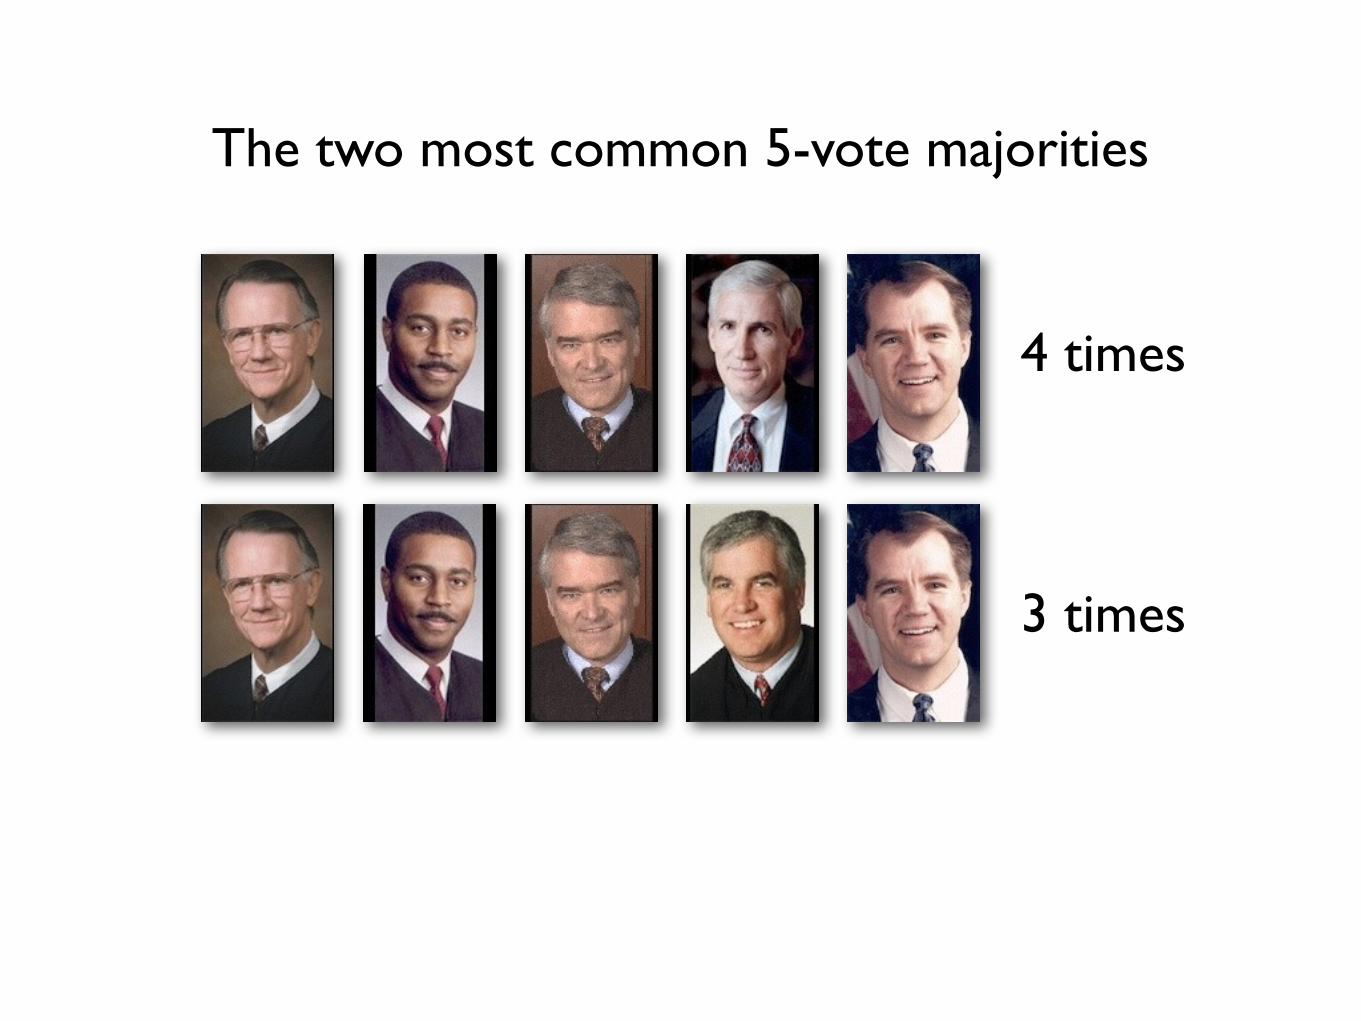
The two most common 5-vote majorities
4 times
3 times

111111111111111112222222
34
Texas Supreme CourtMuch more variety!in voting patterns!
in these 5-4 decisions
... compared to the U.S. Supreme Court

Looking for Patterns

U.S. Supreme Court

SCOTUS!Voting Affinity!(in 79 5-4 decisions)

Texas Supreme Court

Voting Affinity!(in 37 5-4 decisions)

The Current Court

There Have Been Fewer Close Cases
2005-2009 Terms 2010-2014 Terms*
* So far! (No spoilers.)
• 39 cases with only 5 votes for the majority opinion
• 34 cases with 6 votes for the majority opinion
• 15 cases with only 5 votes for the majority opinion
• 31 cases with 6 votes for the majority opinion
• 3 more cases decided by a plurality opinion
• 2½ cases decided by a plurality opinion

Who was in the 5-vote majorities?In 5-vote cases only, 2005-2009 Terms

Who was in the 5-vote majorities?In 5-vote cases only, 2010-2014 Terms
Jefferson
Hecht
Wainwright
Medina
Green
Johnson
Willett
Guzman
Lehrmann
Boyd
Devine
0 2 4 6 8 10
Early Departures
Late Arrivals
Who was in the 5-vote majorities?In 5-vote cases only, 2010-2014 Terms
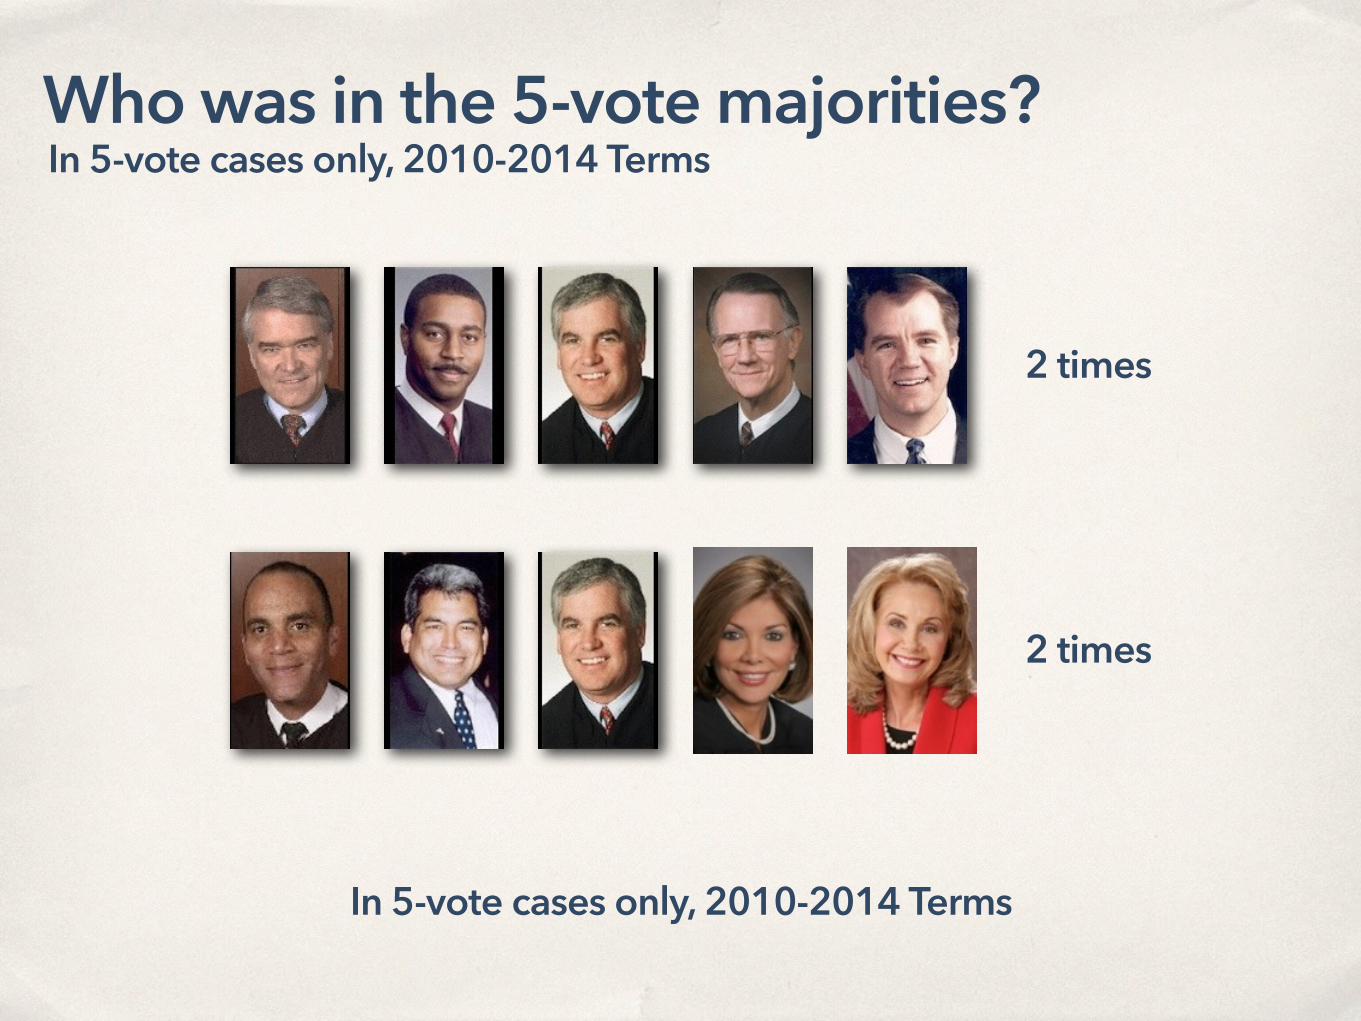
Who was in the 5-vote majorities?In 5-vote cases only, 2010-2014 Terms
2 times
2 times
In 5-vote cases only, 2010-2014 Terms

Who was in the 5-vote majorities?
111111111111112233
20
35
U.S. Supreme Court

Who was in the 5-vote majorities?
In 5-vote cases only, 2010-2014 Terms
1111111111122

Vote PatternsOpinions Issued in 2012-2013
How often did each pair of Justices agree about the judgment, in those cases that drew at least one dissent?
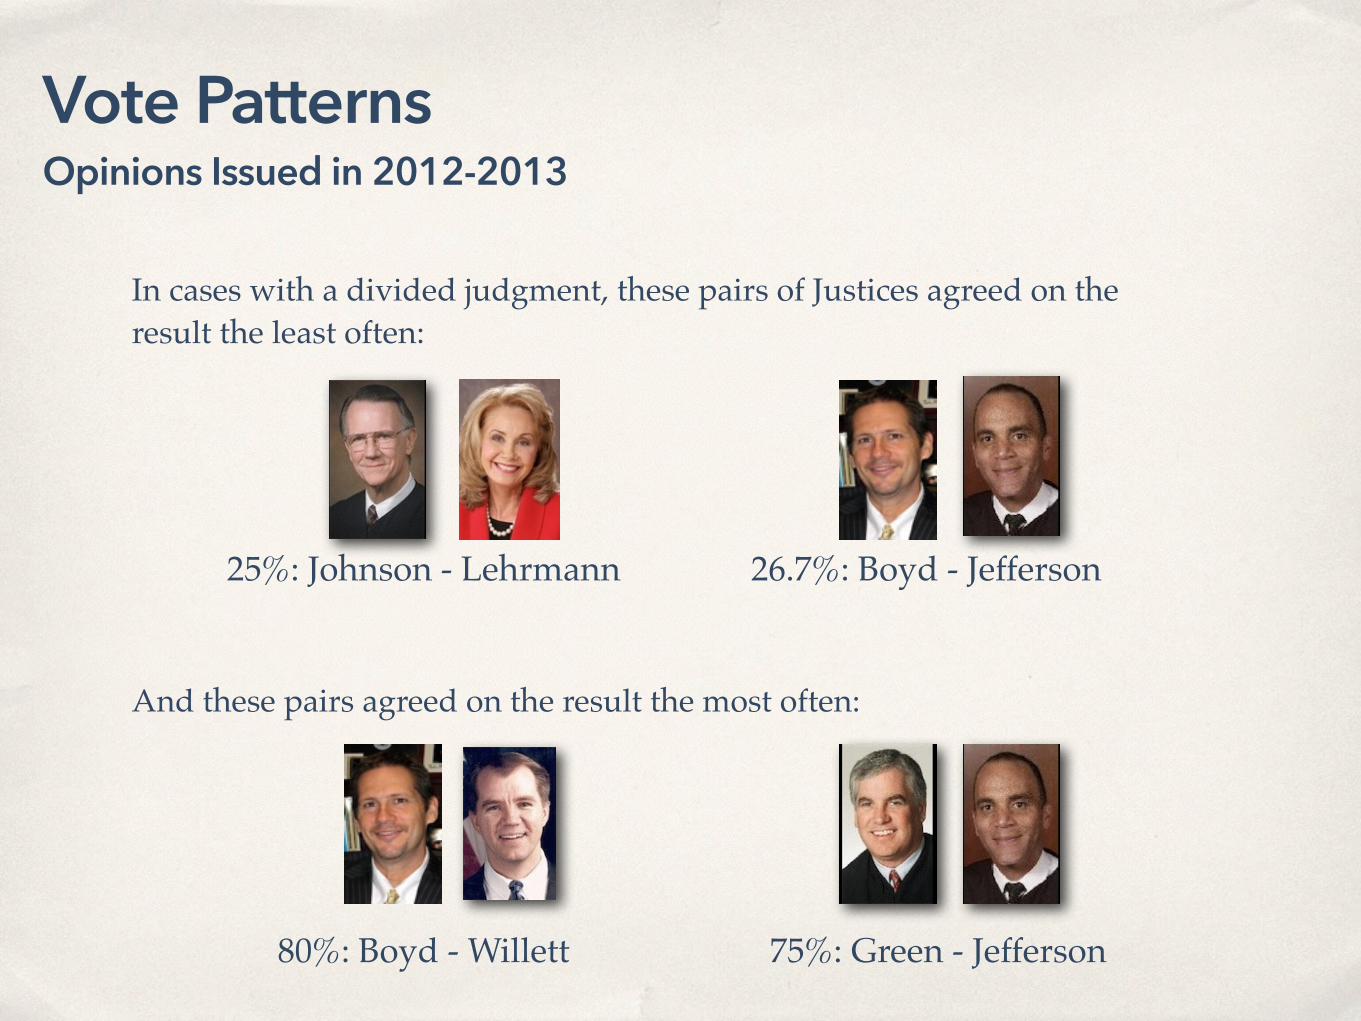
25%: Johnson - Lehrmann 26.7%: Boyd - Jefferson
80%: Boyd - Willett 75%: Green - Jefferson
Vote PatternsOpinions Issued in 2012-2013
In cases with a divided judgment, these pairs of Justices agreed on the result the least often:
And these pairs agreed on the result the most often:

Who Joins Separate Opinions?In cases with at least one separate opinion, 2012-2013
JeffersonHechtGreen
JohnsonWillett
GuzmanLehrmann
BoydDevine
-10 -6 -2 2 6 10 14 18 22
ConcurrenceMajorityConcur/DissentDissent
Chief Justice Jefferson, Justice Green, and Justice Johnson did not join any separate concurring opinions.
Every Justice joined at least two dissents. Justice Lehrmann joined dissenting opinions most often, followed by Chief Justice Jefferson and Justice Willett.

Who Joins Separate Opinions?In cases with at least one separate opinion, 2010 Term to present
JeffersonHecht
WainwrightMedina
GreenJohnson
WillettGuzman
LehrmannBoyd
DevineBrown
-35 -25 -15 -5 5 15 25 35 45 55 65 75 85
ConcurrenceMajorityConcur/DissentDissent

The Court Over Time

Jefferson
Hecht
Green
Johnson
Willett
Guzman
Lehrmann
Boyd
Devine 15%
24%
42%
13%
25%
13%
9%
23%
25%
85%
76%
58%
87%
75%
88%
91%
77%
75%
With Judgment Against Judgment
Who Votes With the Judgment?Just in divided cases, 2012-2013
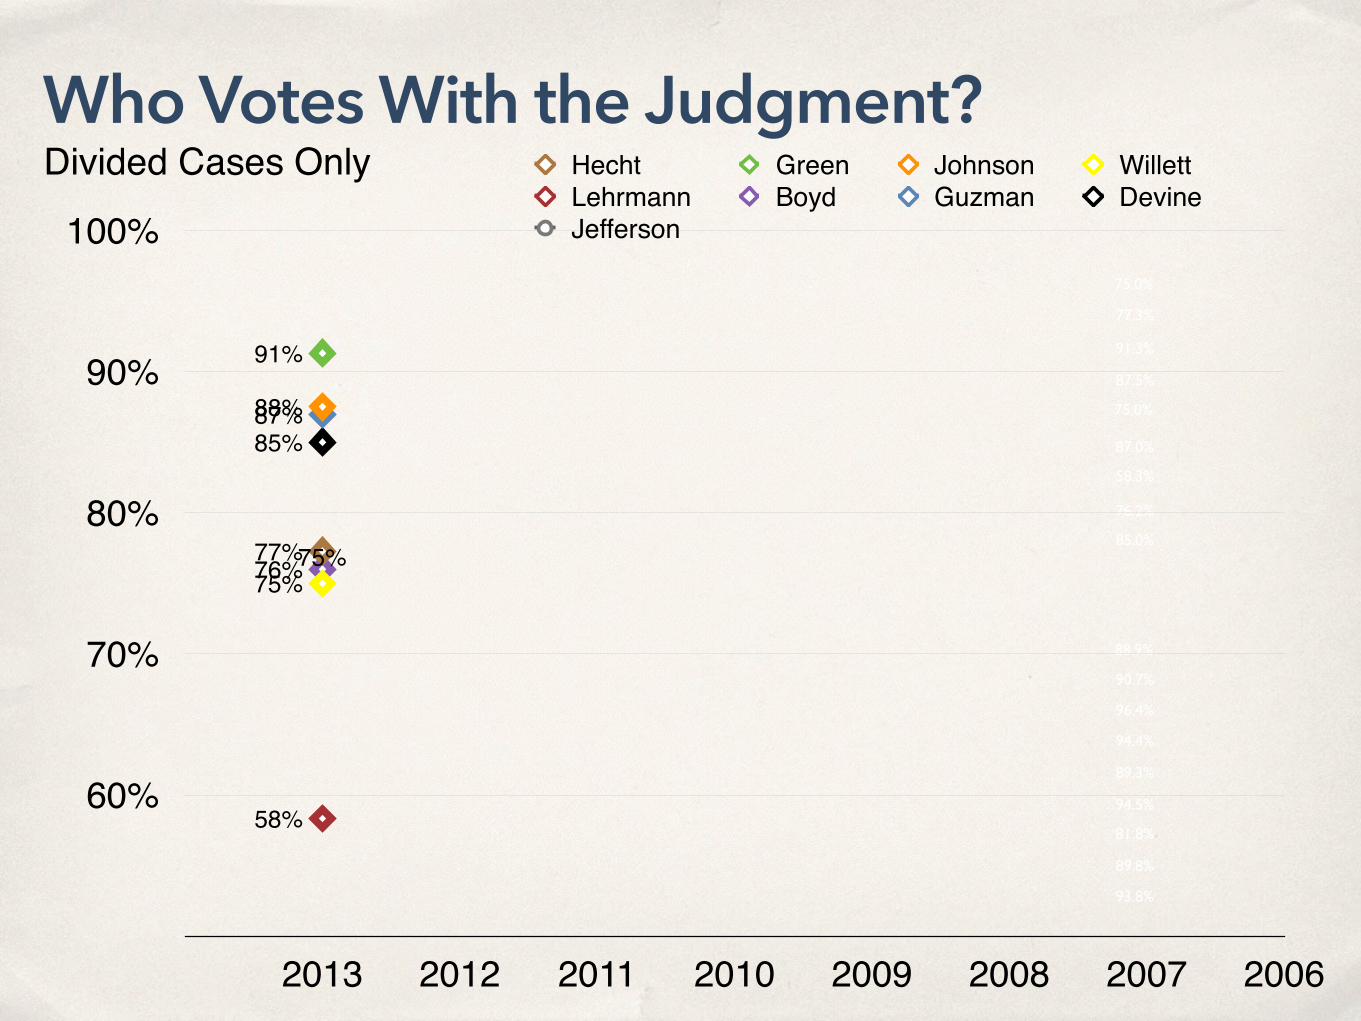
75.0%
77.3%
91.3%
87.5%
75.0%
87.0%
58.3%
76.2%
85.0%
Who Votes With the Judgment?
88.9%
90.7%
96.4%
94.4%
89.3%
94.5%
81.8%
89.8%
93.8%
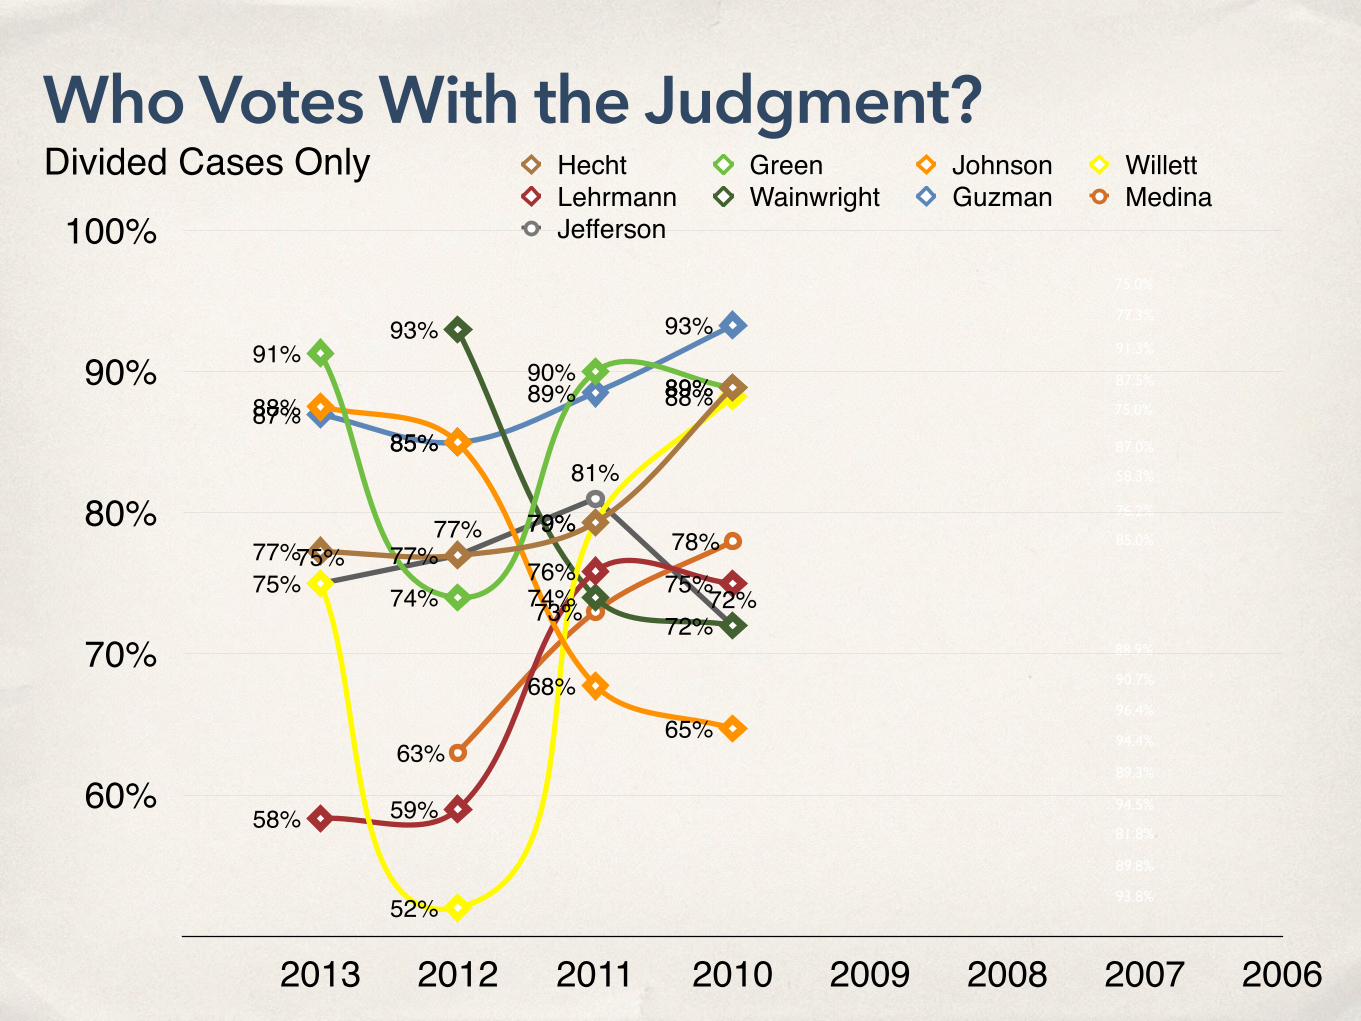
Divided Cases Only
60%
70%
80%
90%
100%
2013 2012 2011 2010 2009 2008 2007 2006
75%
85%87%
76%
58%
75%
88%
91%
77%
Hecht Green Johnson WillettLehrmann Boyd Guzman DevineJefferson
75.0%
77.3%
91.3%
87.5%
75.0%
87.0%
58.3%
76.2%
85.0%
Who Votes With the Judgment?
88.9%
90.7%
96.4%
94.4%
89.3%
94.5%
81.8%
89.8%
93.8%
Divided Cases Only
60%
70%
80%
90%
100%
2013 2012 2011 2010 2009 2008 2007 2006
75%77%
81%
72%
63%
73%
78%
87%85%
89%
93%93%
74%72%
58% 59%
76% 75%75%
52%
79%
88%88%85%
68%65%
91%
74%
90% 89%
77% 77%79%
89%
Hecht Green Johnson WillettLehrmann Wainwright Guzman MedinaJefferson

75.0%
77.3%
91.3%
87.5%
75.0%
87.0%
58.3%
76.2%
85.0%
Who Votes With the Judgment?
88.9%
90.7%
96.4%
94.4%
89.3%
94.5%
81.8%
89.8%
93.8%
Divided Cases Only
60%
70%
80%
90%
100%
2013 2012 2011 2010 2009 2008 2007 2006
81%
73%
82%79%
58%
78%
59%
67%69%
76%
71%
83%
55%
82%
59%
80%
86%
81%79%
64%
83%
79%77%
94%
83%
77%79%
64%
79% 79%
92%
88%
80%
72% 71%
84%
Hecht Green Johnson WillettWainwright Medina Jefferson O'NeillBrister

75.0%
77.3%
91.3%
87.5%
75.0%
87.0%
58.3%
76.2%
85.0%
Who Votes With the Judgment?
88.9%
90.7%
96.4%
94.4%
89.3%
94.5%
81.8%
89.8%
93.8%
Divided Cases Only
60%
70%
80%
90%
100%
2013 2012 2011 2010 2009 2008 2007 2006
81%
73%
82%79%
77%
58%
78%
59%
67%
63%
73%
78%
55%
82%
59%
80%
93%
74%72%
86%
81%79%
64%
75%77%
81%
72%69%
76%
71%
83%85%87%
85%
88%
93%
76%
58% 59%
76% 75%75%
52%
79%
88%
83%
79%77%
94%
88%85%
68%65%
83%
77%79%
64%
91%
74%
90% 89%
79% 79%
92%
88%
77% 77%79%
89%
80%
72% 71%
84%
Hecht Green Johnson WillettLehrmann Boyd Guzman DevineJefferson Wainwright Medina O'NeillBrister

75.0%
77.3%
91.3%
87.5%
75.0%
87.0%
58.3%
76.2%
85.0%
The Pattern for New Justices
88.9%
90.7%
96.4%
94.4%
89.3%
94.5%
81.8%
89.8%
93.8%
60%
70%
80%
90%
100%
2013 2012 2011 2010 2009 2008 2007 2006
85%87%
85%
88%
93%
76%
58% 59%
76% 75%75%
52%
79%
88%
83%
79%77%
94%
Willett Lehrmann Boyd Guzman Devine

Looking for Voting Groups

Clusters of JusticesHow do we go from a chart showing pairs of Justices to something reflecting relationships across groups of Justices?Here’s the approach:!I assigned a distance value to each pair of Justices, and then used an algorithm to flatten those distances into a two-dimensional graph.(1) For each decision, assign a “1”, “-1”, “0” to each Justice(2) Put all that into a matrix, and then add up the total agreement/disagreement between each pair of Justices(3) Divide each pair’s total by the number of votes that those!Justices actually shared (after recusals, departures, etc.)(4) Convert that into a distance measure for each pair, in n-dimensional space (Euclidean distance)(5) Use “MDS” to scale that down to 2 dimensions, and plot


Clusters of Justices

Current Justices*
*There is not yet enough data to plot Justice Brown.

The Amicus Docket
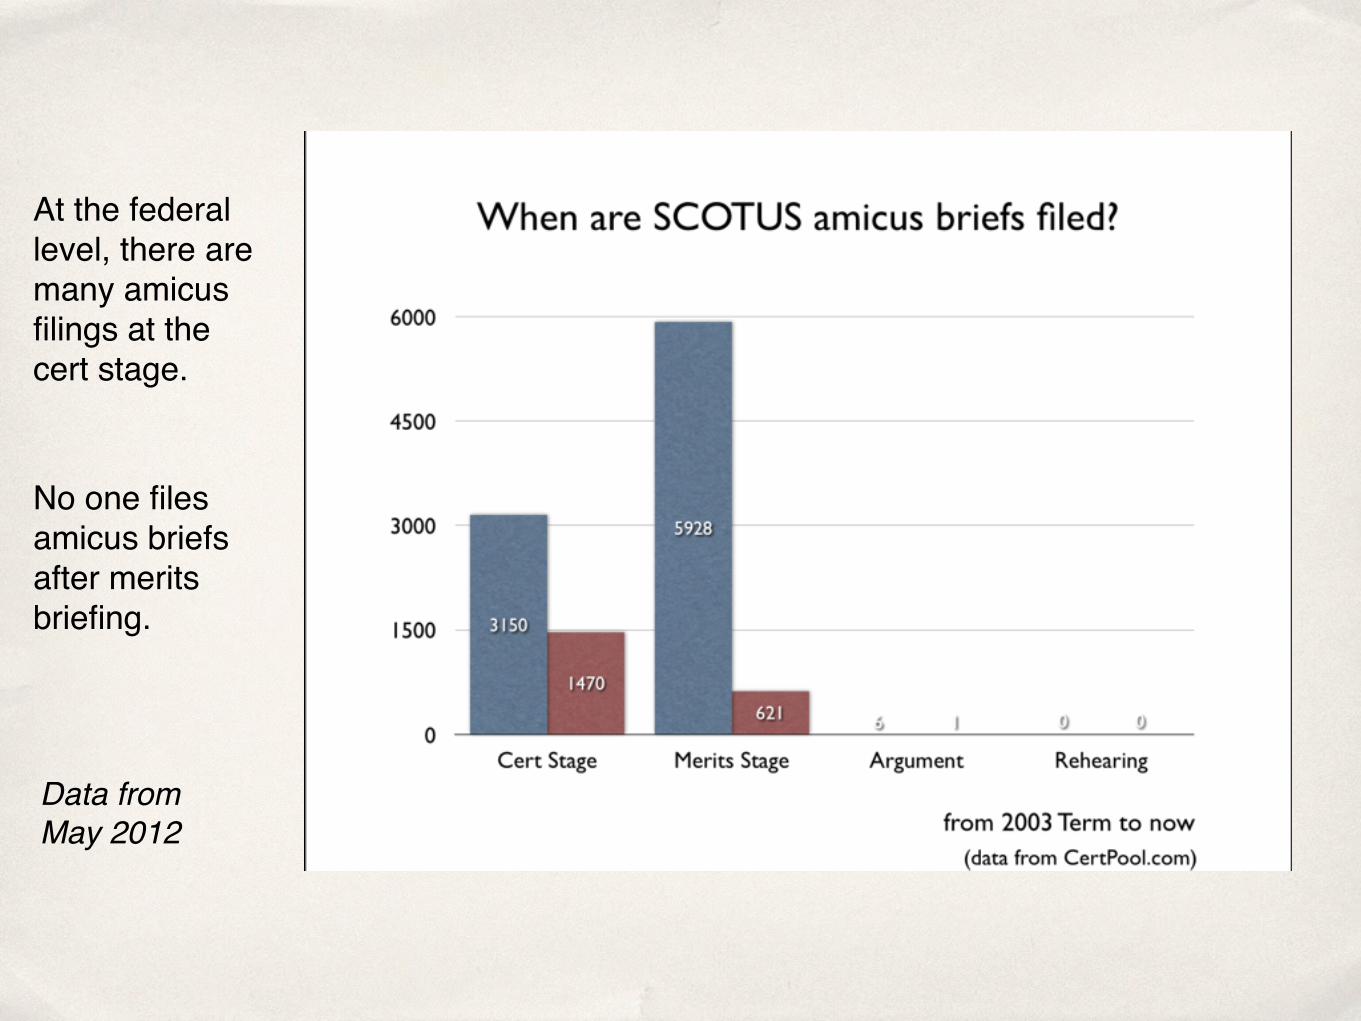
Data fromMay 2012
At the federal level, there are many amicus filings at the cert stage.
No one files amicus briefs after merits briefing.

In Texas, amici can appear anytime, and do.
Many wait until grant or even after a decision is issued.
Data fromMay 2012

Slides from a May 2012 panel
Having a swarm of amicus filings appear on rehearing is now a “thing.”

Cases Attracting the Most Amicus Briefs
Zachry Construction
HMC Hotel v Keystone
Bostic v Georgia-Pacific
Kia Motors v Ruiz
Boerjan v Rodriguez
Hooks v Samson
EPS v FPL Farming
Richie v Rupe
0 2 4 6 8 10 12 14 16 18 20 22
1
3
1
3
2
2
1
7
7
2
3
5
2
2
2
3
3
1
4
2
10
PFR BOM Grant Submitted Rehearing

How does the presence of amicus filers affect the odds of getting a response request for a petition?
Baseline forall petitions
With an amicus!brief on file
~40%
(~2% of petitions!had such a filing)
85%

How does the presence of amicus filers affect the odds of getting a request for full merits briefing?
Baseline forall petitions
With an amicus!brief on file
~25%
(~7% of petitions!had such a filing)
82%

How does the presence of amicus filers affect the odds of getting a grant or summary disposition after briefing?
Baseline forall petitions
With an amicus!brief on file
~40% 55%
(~18% of briefed caseshad such a filing)

How does the presence of amicus filers affect the odds of getting a grant or summary disposition after briefing?
Baseline forall petitions
With an amicus!brief on file
~40% 55%
~15%
~25%Grants
Per Curiams ~8%
~48%
Combined

Thanks!
Questions?

![Introduction - Computer Sciencerlaz/prec2010/slides/MajorityVote.pdf · Voting. Majority Voting Perormance [1] JustinTalbot,ErinWirch Voting. Patterns of Success and Failure Upper](https://img.pdfslide.net/doc/110x75/5f9ee870604fac1336291c28/introduction-computer-science-rlazprec2010slides-voting-majority-voting.jpg)