Embed Size (px)
Citation preview

Bauer Supply Chain Spring 2015 Symposium Supply Chain Complexity
March 6, 2015
Wilson Perumal & Company, Inc. 2
Agenda
• Complexity facing companies today
• QuanDfying the impact of complexity
• EliminaDng and managing complexity

Wilson Perumal & Company, Inc. 3
The world has changed!
Volume
Cost
Pre-‐Industrial Age
“Individual producDvity”
Dominated by variable costs
Volume
Industrial Age
“Economies of Scale”
Dominated by fixed costs
Complexity
Post-‐Industrial Age
“Complexity”
Dominated by complexity costs

Wilson Perumal & Company, Inc. 4
Complexity and its impacts grow exponenEally
CharacterisEcs of Complex Systems
1. Non-‐linear reacDons
2. Emerging properDes
3. Feedback loops
4. Unknown interacDons These characteris+cs make Complex Systems almost impossible to predict
and control

Wilson Perumal & Company, Inc. 5
Complexity is stretching companies’ capabiliEes TECHNOLOGY IS MORE COMPLEX PRODUCTS AND SERVICES MORE COMPLEX
PROCESSES MORE COMPLEX ORGANIZATIONS MORE COMPLEX
REGULATIONS MORE COMPLEX
MARKETS MORE COMPLEX
X
X
X
X X

Wilson Perumal & Company, Inc. 6
Many companies are passing a complexity threshold
VALUE (diminishing returns)
COST & RISK (exponenDal growth)
Level of complexity you can support
$
Complexity
Costs and opera+onal risk grow exponen+ally with complexity
Few companies are s+ll here
Many companies are here
An increasing number of companies are here

Wilson Perumal & Company, Inc. 7
Complexity impacts all aspects of your business
Cost & OperaEons
Business & OperaEonal Risk
Growth & InnovaEon
• Hidden costs • ExponenDal growth
• Cross subsidizaDon • Most products are unprofitable
• Grows exponenDally with complexity
• Cannot anDcipate all points of failure
• Slows new product development
• Overwhelms customers
• Distracts sales force

Wilson Perumal & Company, Inc. 8
Product, Process & OrganizaEon Complexity interact to drive higher costs & risk
Organization
Value add
Non-value add
The Complexity Cube
Product Process
OrganizaEon
Number of processes, steps, handoffs, etc.
Number of products and
services you offer
Number of assets, faciliDes, enDDes, partners, etc.
Wilson Perumal & Company, Inc. 9
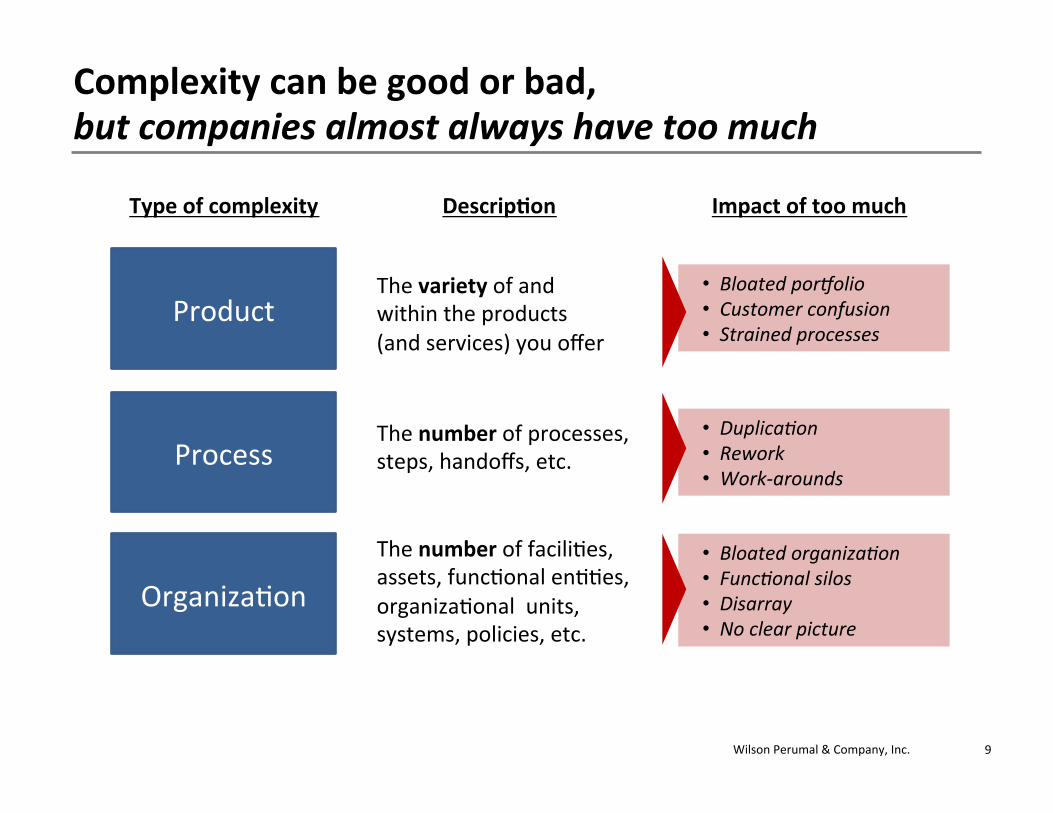
Complexity can be good or bad, but companies almost always have too much
The variety of and within the products (and services) you offer
The number of processes, steps, handoffs, etc.
The number of faciliDes, assets, funcDonal enDDes, organizaDonal units, systems, policies, etc.
• Bloated por6olio • Customer confusion • Strained processes
• Duplica:on • Rework • Work-‐arounds
• Bloated organiza:on • Func:onal silos • Disarray • No clear picture
Product
Process
OrganizaDon
Type of complexity DescripEon Impact of too much

Wilson Perumal & Company, Inc. 10
Complexity impacts all aspects of supply chain performance
Complexity-‐driven supply chain challenges
Bloated Inventories
More Supply Chain
DisrupEons
Increased NVA Cost/ Overhead
Slower Response Times
Poor S&OP Accuracy

Wilson Perumal & Company, Inc. 11
Agenda
• Complexity facing companies today
• QuanDfying the impact of complexity
• EliminaDng and managing complexity
Wilson Perumal & Company, Inc. 12
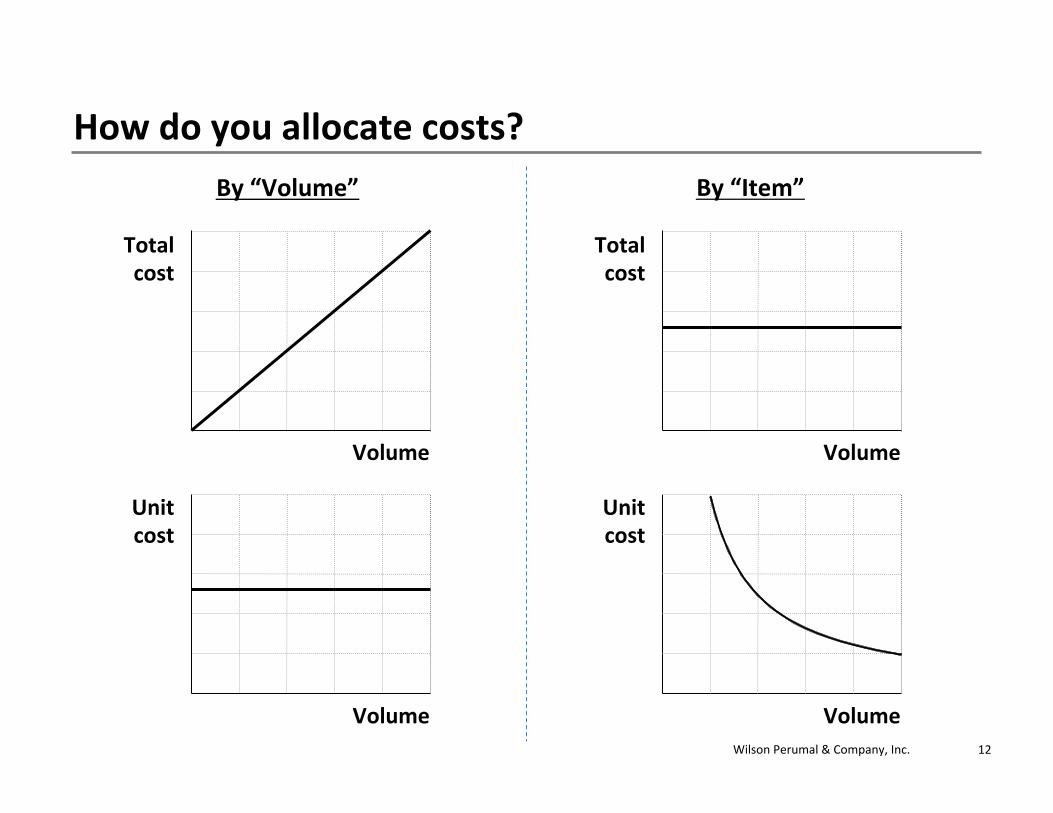
How do you allocate costs?
Total cost
Volume
Unit cost
Total cost
Volume
Unit cost
By “Volume”
Volume Volume
By “Item”

Wilson Perumal & Company, Inc. 13
Complexity costs follow a square root of volume relaEonship
Most NVA costs fall in between “by volume” and “by unit” extremes
We see the SQRT rela:onship over and over
• Cost rises with volume but not as much as in “by volume” approach
• Unit cost drops off with volume but not as much as in “by item” approach

Wilson Perumal & Company, Inc. 14
Cost allocaEon methods
CosEng approach
By actual costs By allocaEon
By ‘volume’ By ‘SQRT vol.’ By ‘item’ • Best approach • But not always pracDcal (e.g., acDvity-‐based cosDng)
Cost allocated in proporDon to either # units, revenue, cost, etc.
I.e., “Peanut bucer spread”
• Costs divided equally between products, stores, regions, etc. regardless of volume
• In between “by volume” and “by item” methods
• Higher-‐vol. items receive greater aggregate cost
• Lower-‐vol. items receive greater unit cost
• NVA/complexity costs follow the “SQRT of volume” relaDonship • Without this tool, most companies allocate these costs using the “by volume” method, leading to over-‐cosEng of high-‐volume items and under-‐cosEng of low-‐volume items

Wilson Perumal & Company, Inc. 15
EXAMPLE: Square root cosEng
$1 $1
$6
$0.88
$25
$0.50
“By Volume” “By Item” “By SQRT Vol.”
• Product “A”: volume of 1 unit • Product “B”: volume of 50 units • Total cost to allocate = $50
“In between” is not simply the average of the two extremes
Unit cost:
AllocaEon method:
Scenario:

Wilson Perumal & Company, Inc. 16
Only complexity-‐driven costs are allocated using square root cosEng
Variable (α Vol.)
Fixed
Variable (α Vol.)
Fixed
SQRT costs
TradiEonal AllocaEon
CategorizaEon
“Square Root” AllocaEon
CategorizaEon
• Unmasks cross-‐subsidizaDon
• Corrects for under-‐cosEng small volume items/acEviEes
• Corrects for over-‐esEmaEng potenEal for fixed cost leverage
Wilson Perumal & Company, Inc. 17
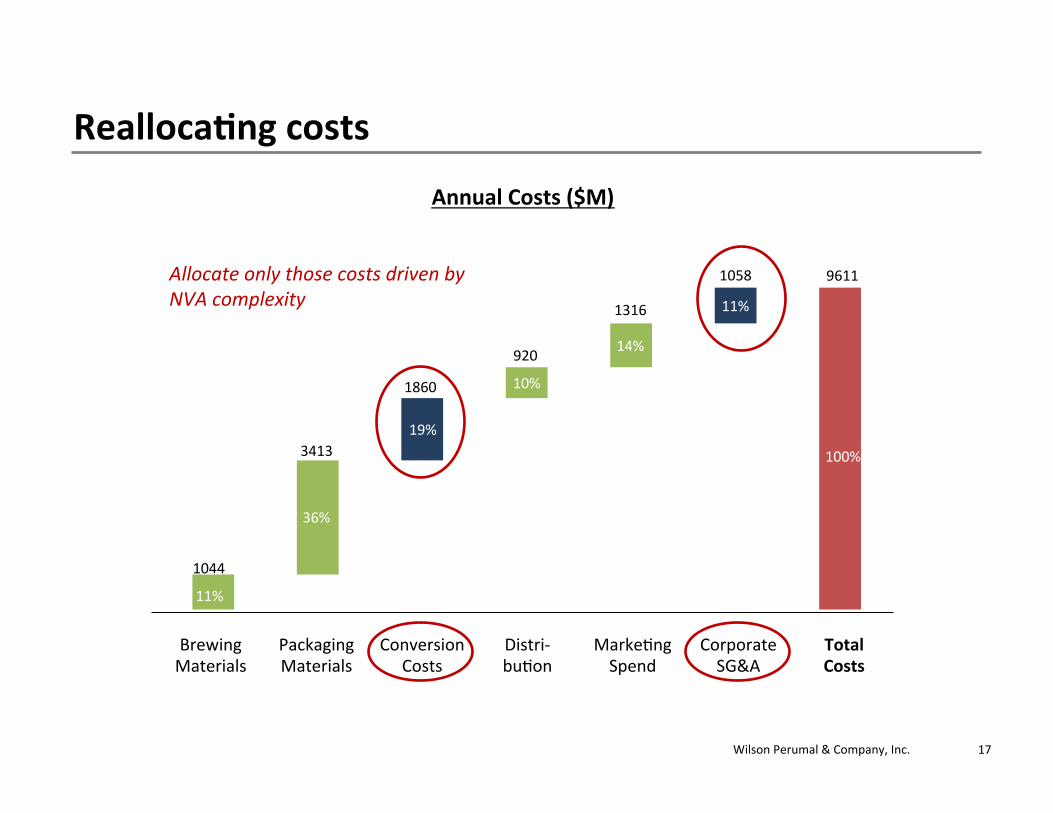
ReallocaEng costs
Total Costs
Corporate SG&A
Packaging Materials
MarkeDng Spend
Distri-‐ buDon
Conversion Costs
Brewing Materials
11%
36%
19%
10%
14%
11%
100%
1044
3413
1860
920
1316
1058 9611 Allocate only those costs driven by NVA complexity
Annual Costs ($M)

Wilson Perumal & Company, Inc. 18
The powerful impact of complexity cost allocaEon
9%
13% 14%
26%
14%
5% 10%
19%
9%
14%
0%
10%
20%
30%
Budget Below Premium Premium Cram Average
% OperaDng Margin
Vol. (bbls): 12.5M 16.4M 44.3M 4.8M 78.0M
Typical standard cosDng Complexity-‐adjusted cosDng
Wilson Perumal & Company, Inc. 19
Agenda
• Complexity facing companies today
• QuanDfying the impact of complexity
• EliminaDng and managing complexity

Wilson Perumal & Company, Inc. 20
Complexity creates a vicious cycle

Wilson Perumal & Company, Inc. 21
Mastering complexity requires a two-‐pronged approach
Product/ service
rationalization
Brand elimination Material
consolidation
Vendor, dealer, distributor, supplier
consolidation
Geography or market
rationalization
Management System
Reduce amount of complexity?
Operating model
redesign
Process flexibility
Dynamic modeling
High Reliability Culture
Or make complexity less expensive?
QUESTION:
ANSWER: • Both • We do not live in a “plain vanilla” world (we need variety) • Customers demand good prices (we need cost-‐compeEEveness) • But no real operaEon is lean enough to support infinite variety
Wilson Perumal & Company, Inc. 22
Conclusion
• Complexity has become a key factor driving performance for many companies…
• …but most companies are ill-‐prepared to idenDfy and manage complexity in their operaDons
• Companies can becer deal with increasing complexity by:
– Understanding the sources of complexity and the impacts (cost & performance)
– EliminaDng NVA complexity and becer managing necessary complexity