Embed Size (px)
Citation preview
COMMUNICATING THE BUSINESS VALUE OF SAFETY
Chris Ferguson EHS Manager 407ETR Concession Company
Process vs. ProgramOne of the many challenges for an environmental, health, and safety (EHS) professional is convincing the management to maximize the effectiveness of the safety process and consequently increasing productivity.
EHS professionals have to help the management transform safety into an accepted business value for their organization.
EHS professionals have to learn how to make the “business case” for EHS interventions. In order to be successful, the EHS professionals have to learn to use the tools and language of the business managers effectively.

Process vs. ProgramEHS professionals can effectively measure the performance of their processes using the tools of business managers and the format and language of the organization’s financial analysts.

BarriersLack of standard terminology to describe EHS performance.
A common terminology to describe EHS management strategies, and technical skills to relate such strategies to financial performance, can be lacking.
If EHS performance cannot be precisely defined, it cannot be measured rigorously. If such performance is not defined with reference to the operational objectives of individual firms and specific industries, it will not be relevant to managers and investors.
A comparison of the language and criteria used to show performance in different corporate environmental or safety reports underscores the lack of consensus on the definitions and metrics used to convey EHS related financial results.
BarriersNo common language among financial and EHS professionals for describing EHS values.
An organization’s financial managers often do not have evidence that it is worth the time and effort to understand the business value of a company’s EHS strategies.
Financial analysts have limited industry-specific EHS analyses nor company-specific EHS data related to established drivers of corporate value.
Financial analysts, company EHS managers, and regulators have different professional vocabularies and perspectives for evaluating and describing the same conditions.

BarriersInadequate technical skills to understand how EHS strategies affect financial outcomes.
The lack of means to translate EHS issues into financial terms is one of the greatest single barrier to integrating information about EHS strategies into financial analysis.
One industry may consider such integration important, and another industry may not. The lack of uniformity in skill and information integrity across industries will limit the ability of financial analysts who work for companies to articulate the value of those companies’ EHS strategies.
Within companies, few people are experienced with EHS and full-cost accounting, which enables managers to measure total EHS costs.
BarriersLack of market incentives for EHS-related value to a product.
There is currently no way to demonstrate an industry-recognized standard of EHS performance that increases a product’s value in the marketplace.
The existing EHS regulatory system is generally focused on prescribing and enforcing environmental, safety, and health standards.
It has not gained much success with market mechanisms that would provide economic incentives to improve EHS performance.
BarriersTraditionally, EHS investments have been looked upon as being expensive, but necessary to avoid costly government citations.
Therefore, improvements or innovations in EHS beyond what is necessary to meet compliance obligations were often delayed and actual business benefits of expenditures for EHS were not examined.
A major barrier in expressing EHS functions or performance as a business value is a lack of common terminology.
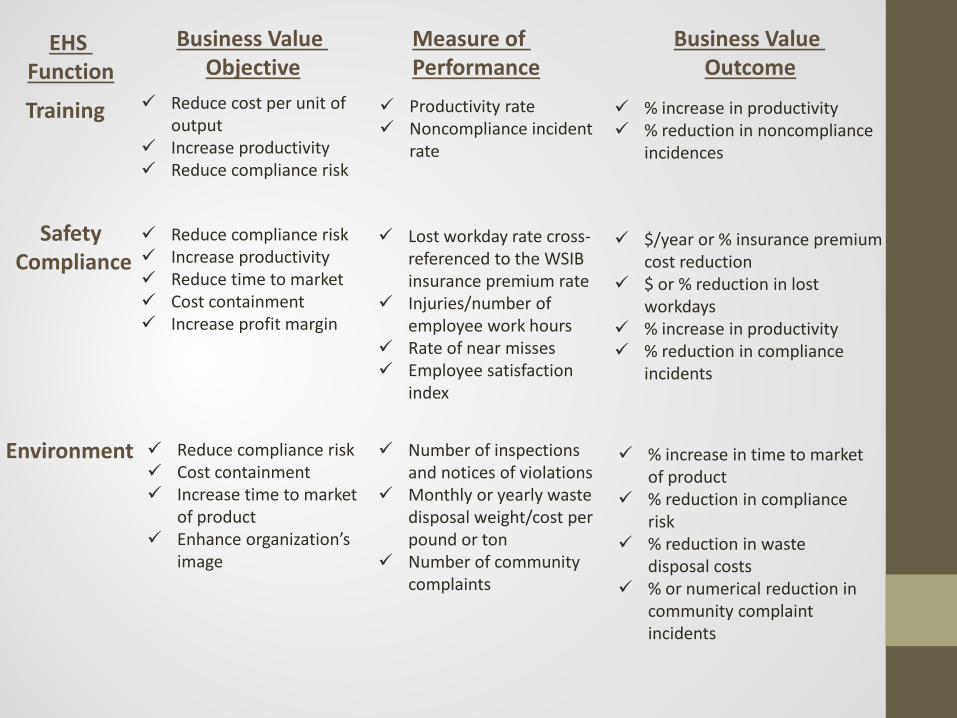
EHS Function
Business Value Objective
Measure of Performance
Business Value Outcome
Reduce cost per unit of output
Increase productivity Reduce compliance risk
Productivity rate Noncompliance incident
rate
% increase in productivity % reduction in noncompliance
incidences
Training
Reduce compliance risk Increase productivity Reduce time to market Cost containment Increase profit margin
Safety Compliance
Lost workday rate cross-referenced to the WSIB insurance premium rate
Injuries/number of employee work hours
Rate of near misses Employee satisfaction
index
$/year or % insurance premium cost reduction
$ or % reduction in lost workdays
% increase in productivity % reduction in compliance
incidents
Environment Reduce compliance risk Cost containment Increase time to market
of product Enhance organization’s
image
Number of inspections and notices of violations
Monthly or yearly waste disposal weight/cost per pound or ton
Number of community complaints
% increase in time to market of product
% reduction in compliance risk
% reduction in waste disposal costs
% or numerical reduction in community complaint incidents

LeadershipOrganizational Leadership should address how you guide your EHS department in setting values, directions, and performance expectations.
By documenting your actions, you will be able to show upper management a systematic approach to EHS value.• Implementing an EHSMS that includes measurable goals and
results• Conducting risk assessments• Systematically monitor federal, provincial, regional and
municipal EHS regulatory developments• Systematically perform risk-based audits• Effectively implement an EHSMS

Strategic PlanningStrategic planning emphasizes that improvement and learning need to be embedded in your work processes.
It aligns your work processes with your EHS department’s strategic directions, thereby ensuring that improvement and learning will reinforce departmental priorities.
The strategic development process helps you set directions, develop objectives, and sets in place the documentation of your department’s overall performance, competitiveness, and future success.

Strategic PlanningOutline your department’s strategic planning process through a formal, systematic EHS strategy process. Identify:• Key strategic EHS objectives and most important goals for the
objectives• Key participants• Key steps• Short- and long-term planning horizons. Include how you set
these horizons and how your strategic planning process addresses these time horizons.
• External and internal influences on your department

Measurement, Analysis, and Knowledge ManagementHow you measure and analyze your EHS department’s performance will be the driver for continuous improvement. However, central to the use of data and information are their quality and availability. You may find that there is a good amount of comparative safety data, but less environmental. • Research peer companies EHS departments• Collect a list of internal available EHS data• Use existing metrics• Identify additional metrics for the purpose of establishing a baseline
Once you have identified the information you want to analyze and compare over time, develop measurable goals. • Your baseline• Interim targets• Improvement over a manageable period

Measurement, Analysis, and Knowledge ManagementDisplay EHS performance results in a business value format.
The financial value of many EHS functions can be derived from a dashboard. For example, any reduction or increase in the lost workday rate may be graphically illustrated with descriptions of safety program activities over time to make the case for continued or increased funding.

To develop meaningful KPIs. EHS professionals first need to understand the risks of their operations, evaluate the systems that are in place to manage risk, and understand the company’s business plan and culture.
From there EHS professionals can decide where they would like the organization to be in the short and long term.
It’s great to be recognized as one of the industry leaders in the area of EHS, but if the organization has a reactive or emerging culture, it might want to set a short-term goal of ensuring that it is in compliance with applicable legal requirements.
Key Performance Indicators

KPIs that represent what has already happened are referred to as “lagging indicators.”
Lagging indicators are commonly used in company communications to provide an overview of performance, such as the tracking of injury statistics, exposure incidents, and regulatory fines.
“Leading indicators” are more predictive of future performance results. They are viewed as proactive measurements.
Key Performance Indicators

These might include, among other things:Number of audits or inspections performed.Number and types of findings and observations.Timeframe required to close action items.Training completed.Near miss incidents.Timely preventive maintenance tasks performed.Safety committee meetings.
Key Performance Indicators

Once the business and goals have been evaluated, KPIs can be selected. Keep the following points in mind when selecting KPIs:• Quantity does not equal quality.• Measure the most important things, not everything.• Ensure field and line management buy-in.• Consider piloting metrics before rolling them out
company-wide.• Don’t let the cost of measuring exceed the value of the
results.
Key Performance Indicators

Key Performance IndicatorsIncidence rates are a metric used to compare your company's safety performance against a national or provincial average.
This comparison is a safety benchmark to gauge performance with other companies in the same business group, and make an "apple to apple" comparison.
TRIF is Total Recordable Injury Frequency, a calculation that is used to judge how your incidents relate to your number of employees. The calculation that is used is:
(# of Total Recordable Incidents) x 200,000 person hours# of person hours worked in year

For KPIs to be successful, there needs to be a system for tracking, communicating, and improving performance. If data are collected but aren’t communicated to the appropriate audience, efforts will not be successful.
KPIs will evolve as the organization changes. EHS professionals should be prepared to continuously evaluate their progress in tracking EHS performance and the benefits of the KPIs. When necessary and appropriate, KPIs should be modified to reflect changing circumstances or drive further improvement.
Key Performance Indicators
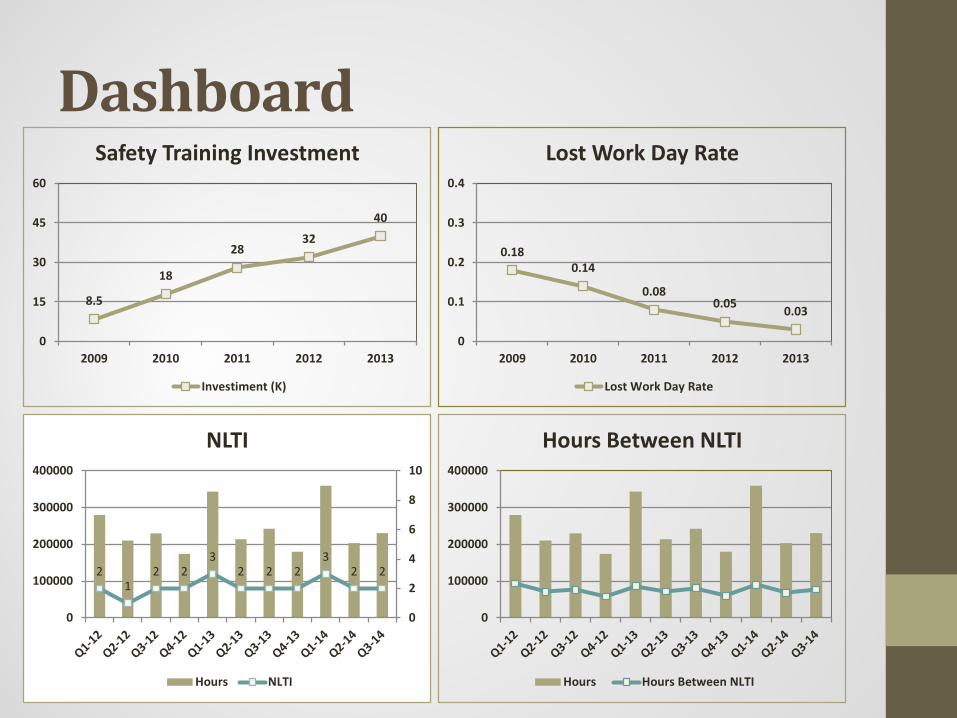
8.5
18
2832
40
0
15
30
45
60
2009 2010 2011 2012 2013
Safety Training Investment
Investiment (K)
Dashboard
0.180.14
0.080.05 0.03
0
0.1
0.2
0.3
0.4
2009 2010 2011 2012 2013
Lost Work Day Rate
Lost Work Day Rate
21
2 23
2 2 23
2 2
0
2
4
6
8
10
0
100000
200000
300000
400000
NLTI
Hours NLTI
0
100000
200000
300000
400000
Hours Between NLTI
Hours Hours Between NLTI
Human Resource FocusEstablish goals that will ensure that EHS department employees achieve high performance. Your management style should promote cooperation, empowerment, and innovation.
Effective employee education, training, and career development will help you achieve your overall goals and contribute to high performance.
Maintaining a work environment and an employee support climate that contributes to the well-being, satisfaction, and motivation of employees will further ensure that you meet your EHS goals.
Process ManagementThis focuses on value creation for all key stakeholders. The aim is to create value for your customers (both external and internal) and other key stakeholders and improve your operational performance and, by extension, the company bottom line.
Key to process management is a commitment to quality and continuous improvement. Examine the EHS department’s key support processes with the goal of improving overall operational performance.
Identify the key support processes that are considered most important for your department’s value creation processes, employees, and daily operations.

Business ResultsProvide real-time information (measures of progress) for evaluation and improvement for processes, products, and services as they relate to your overall departmental strategy.
Examine your EHS department’s financial and market results with the aim of understanding your challenges and opportunities.
Demonstrate current levels and trends in your key indicators of EHS business value, including aggregate measures of financial return, where appropriate.
Summarize your EHS department’s key human resource results as they correlate with the goals you set out. Show how well your department has been creating and maintaining a positive, productive, learning, and caring work environment.
The Cost of an InjuryOntario’s Workplace Safety and Insurance Board (WSIB) reports the average lost time injury costs more than $106,500 (2007 data). This figure includes direct costs to the WSIB of nearly $21,300. Indirect cost to the company, including lost productivity, compliance cost and human resource cost, make up the bulk of the total.This includes:
Capital Costs Administrative Costs Employee Associated Costs Insurance Costs
Legal/Regulatory Costs Production Costs Intangible Business Costs
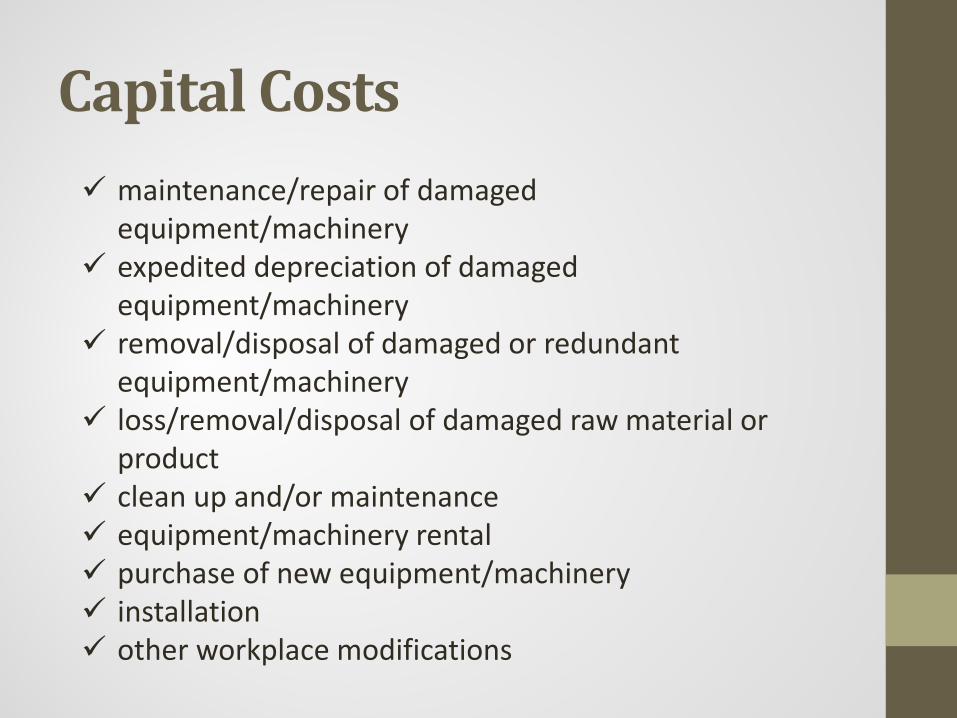
Capital Costs maintenance/repair of damaged
equipment/machinery expedited depreciation of damaged
equipment/machinery removal/disposal of damaged or redundant
equipment/machinery loss/removal/disposal of damaged raw material or
product clean up and/or maintenance equipment/machinery rental purchase of new equipment/machinery installation other workplace modifications
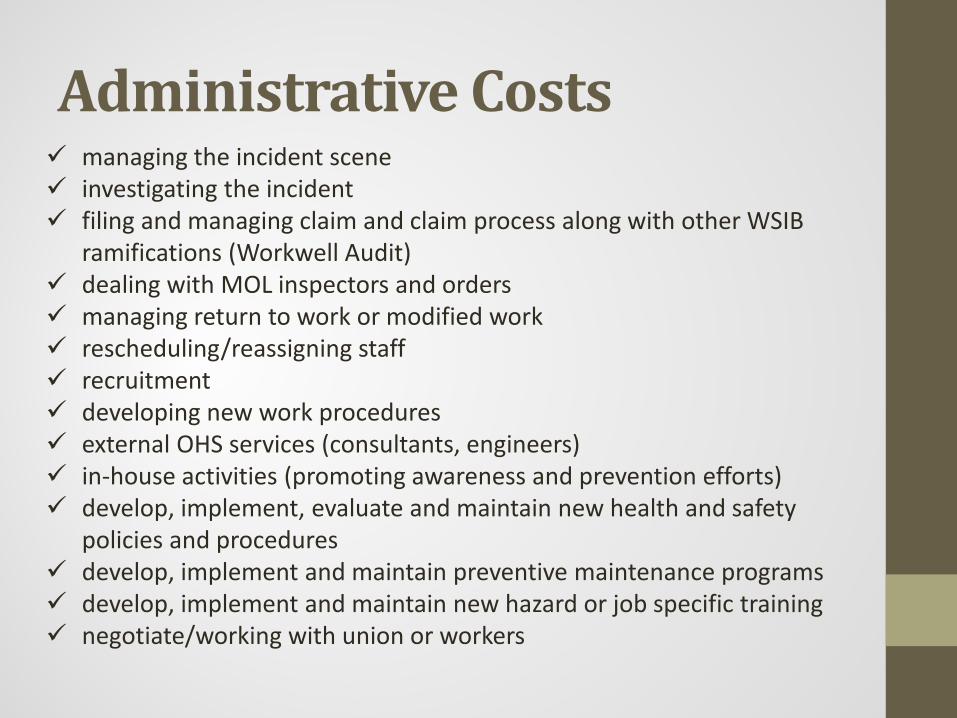
Administrative Costs managing the incident scene investigating the incident filing and managing claim and claim process along with other WSIB
ramifications (Workwell Audit) dealing with MOL inspectors and orders managing return to work or modified work rescheduling/reassigning staff recruitment developing new work procedures external OHS services (consultants, engineers) in-house activities (promoting awareness and prevention efforts) develop, implement, evaluate and maintain new health and safety
policies and procedures develop, implement and maintain preventive maintenance programs develop, implement and maintain new hazard or job specific training negotiate/working with union or workers
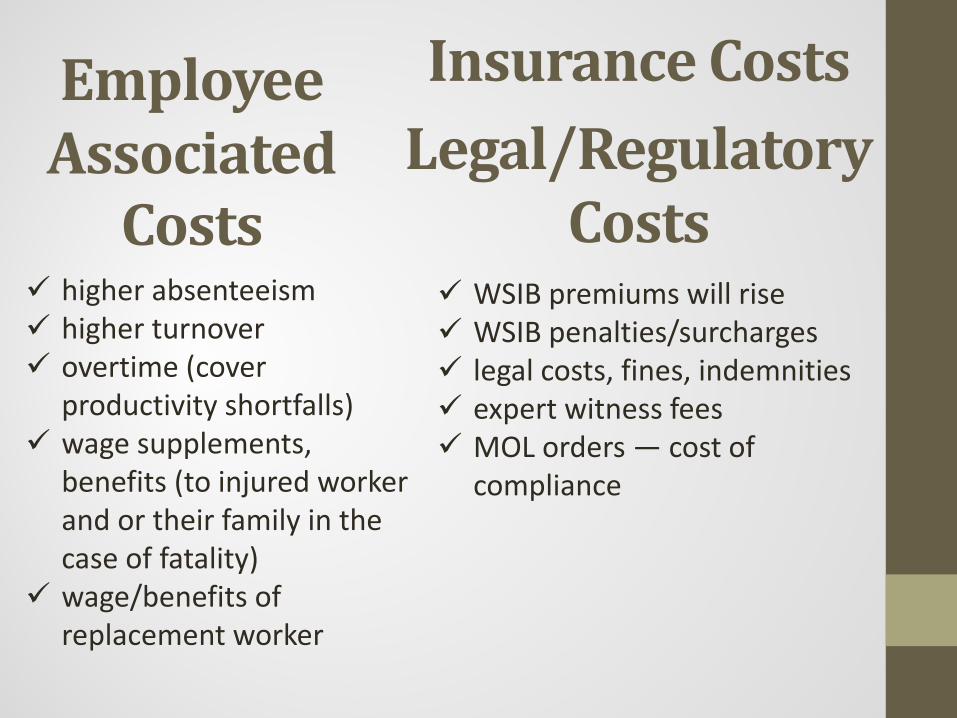
Employee Associated
Costs
Insurance CostsLegal/Regulatory
Costs higher absenteeism higher turnover overtime (cover
productivity shortfalls) wage supplements,
benefits (to injured worker and or their family in the case of fatality)
wage/benefits of replacement worker
WSIB premiums will rise WSIB penalties/surcharges legal costs, fines, indemnities expert witness fees MOL orders — cost of
compliance

Production Costsloss of skilled/productive worker replacement worker not as productive/may produce
lower quality product or servicereduced productivity of injured worker low worker/co-worker morale (lower
productivity/quality)loss of production/business interruption (associated with
an incident) damaged equipment/materials leading to rejected
products
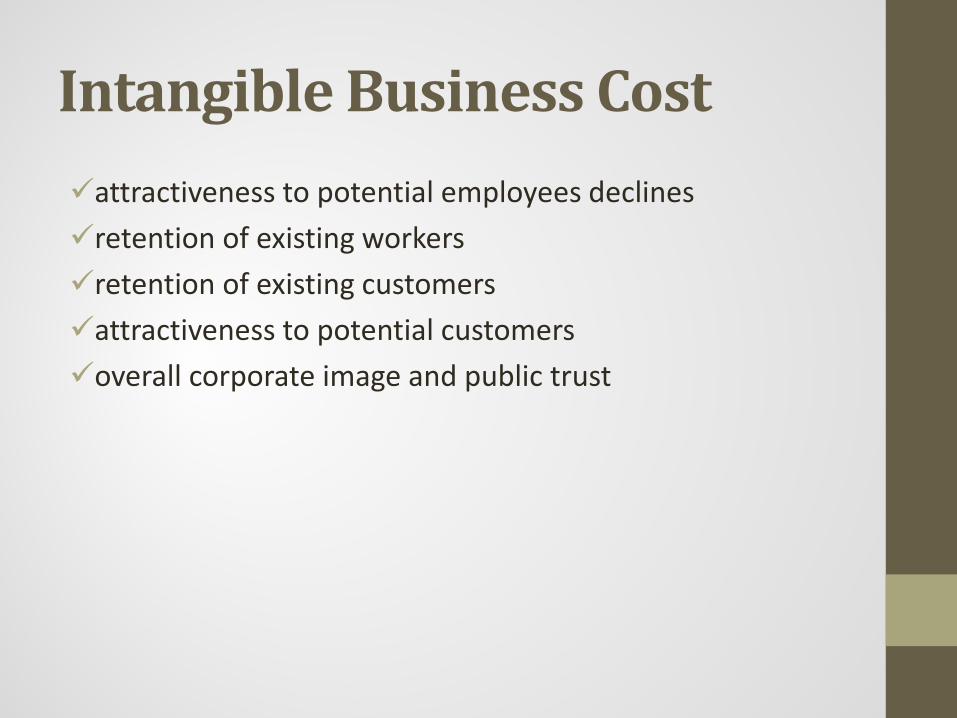
Intangible Business Costattractiveness to potential employees declinesretention of existing workers retention of existing customersattractiveness to potential customersoverall corporate image and public trust

GallupGallup has conducted large-scale meta-analyses, studying 13,751 business and work units regarding the concurrent and predictive relationship of employee attitudes (satisfaction and engagement) with safety, customer attitudes, financials, and employee retention.
The studies have found, rather consistently, that there are positive in current and predictive relationships between employee attitudes and various important business outcomes.
What is Meta-analysis?A meta-analysis is a statistical integration of data accumulated across many different studies. As such, it provides uniquely powerful information because it controls for measurement and sampling errors and other idiosyncrasies that distort the results of individual studies.
A meta-analysis eliminates biases and provides an estimate of true validity or true relationship between two or more variables.

Gallup FindingsFor the safety variable, business units in the top half on employee engagement had, on average, a 44% higher success rate (lower probability of injuries or lost workdays).
With regard to composite business-unit performance, business units in the top half on employee engagement have a 113% higher success rate within their own company, and a 170% higher success rate across business units in all companies studied.
.

In other words, business units high in employee engagement more than double their odds of above-average composite performance within their own companies, and nearly triple their chances for above-average success across business units in all companies.
Comparing top- to bottom-quartile engagement business units resulted in median percentage differences of 62% in safety incidents.
Gallup Findings
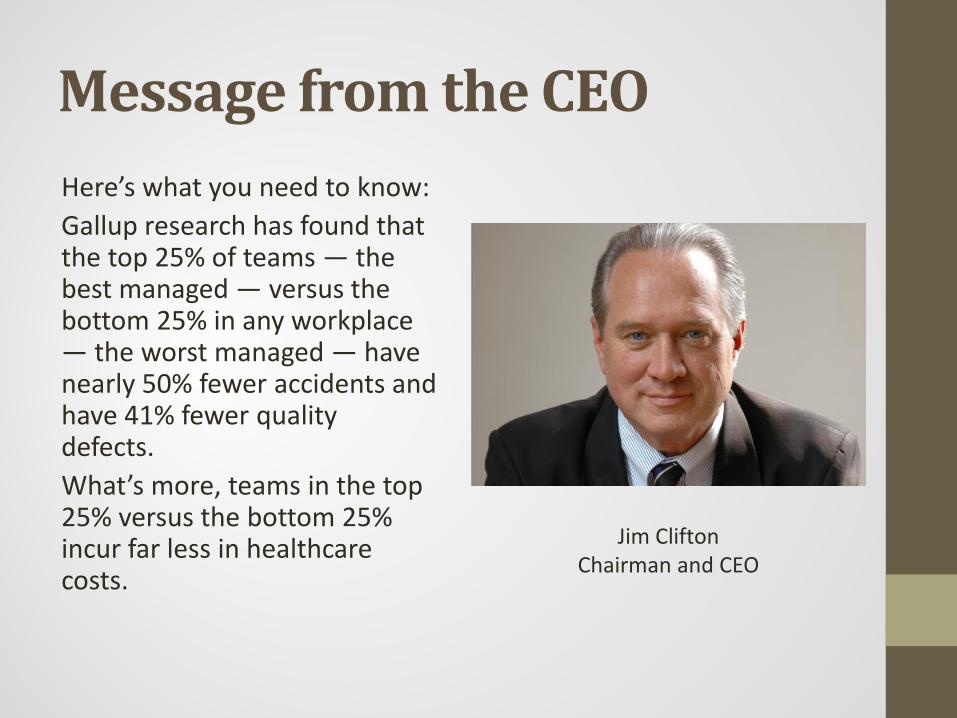
Message from the CEOHere’s what you need to know: Gallup research has found that the top 25% of teams — the best managed — versus the bottom 25% in any workplace — the worst managed — have nearly 50% fewer accidents and have 41% fewer quality defects. What’s more, teams in the top 25% versus the bottom 25% incur far less in healthcare costs.
Jim CliftonChairman and CEO

Final ThoughtsThe benefits of an organization’s EHS functions and performance are often undervalued because of communication barriers between EHS professionals and executive management, and a lack of standard metrics for evaluating all aspects of EHS performance.
EHS professionals must measure the performance of their processes using the tools of business managers and the format and language of the organization’s financial analysts. The results can be integrated and displayed within an overall EHS business strategy. EHS strategies affect financial and other business outcomes.
EHS professionals need to consciously identify the links between specific EHS functions and the core business values. The connections may vary depending on a particular organization’s EHS activities and core business values.
Jack Walsh - WinningClarity around values and behaviors is not much good unless it is backed up. To make values really mean something, companies have to reward people who exhibit them and punish those who don’t.
I say that because every time we asked one of our high-performing managers to leave because he didn’t demonstrate the values - and we said as much publicly - the organization responded incredibly well.
In annual surveys over a decade, employees would tell us that we were a company that increasingly lived its values. That made people more committed to living them too. And as our employees satisfaction results improved, so did our financial results.

Questions