Embed Size (px)
Citation preview
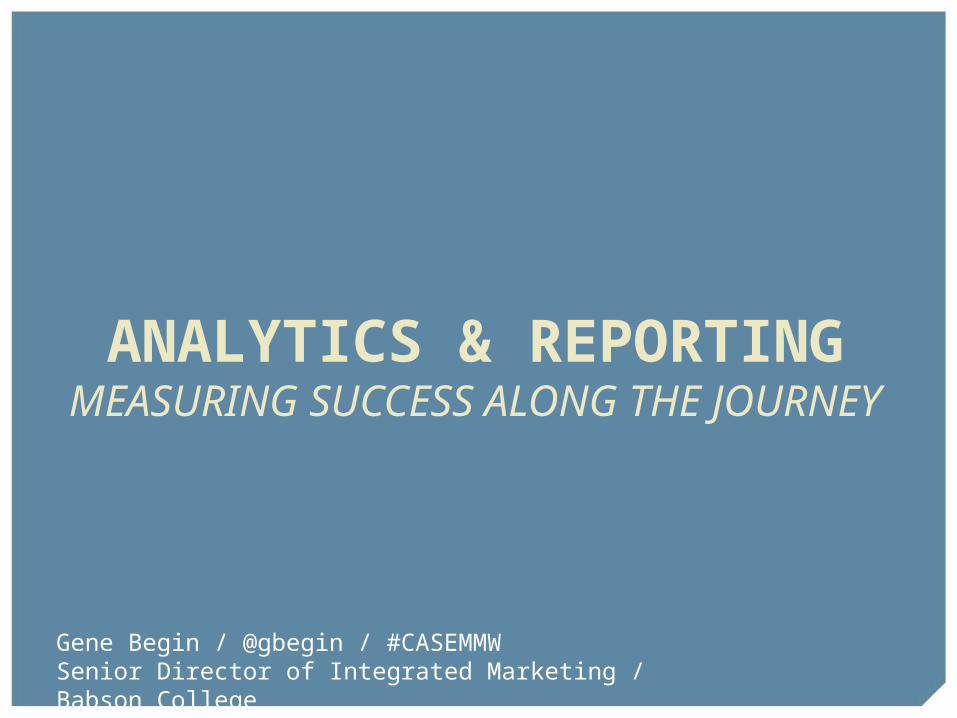
ANALYTICS & REPORTINGMEASURING SUCCESS ALONG THE JOURNEY
Gene Begin / @gbegin / #CASEMMWSenior Director of Integrated Marketing / Babson College


OUR OBJECTIVE TODAY
MAKE MULTIMEDIA MATTER BY COMMUNICATING HOW IT
DRIVES VALUE FOR OUR INSTITUTIONS.

AN INTEGRATED JOURNEY
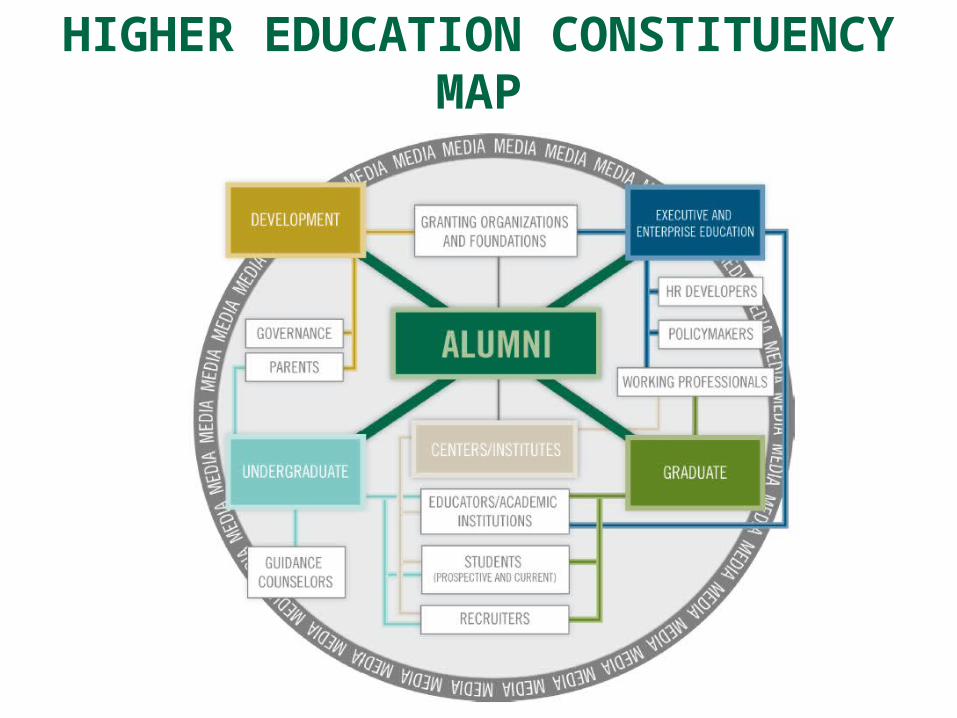
HIGHER EDUCATION CONSTITUENCY MAP

Consider Evaluate BuyGood Luck? Alumni
HIGHER EDUCATION MARKETING’S RELATIONSHIP WITH THE CONSUMER DECISION JOURNEY
ApplyEngage
EnrollRegister

TODAY’S HIGHERED CONSTITUENCY JOURNEY
THE LOYALTY LOOP

THE WAYS WE MEASURE ADVANCEMENT
Key Performance Indicators (KPIs)
AWARE CONSIDER EVALUATE BUY ENJOY
Social Engagement:
• Impressions• Reach• Comments• Shares
Email Opens
Social followers
Email CTR/VTR
Page Views
Time on site
Giving: $$ and participation
Volunteering
Ambassadorship
Event Attendance
Social Comments/ Sharing


QUARTERLY DASHBOARD
Shared with Senior Leadership Shared with Program Managers Shared with Marketing & Social Media Councils Data Helps Drive Future Campaigns and Content Use Data to…– Educate– Educate – Educate

WHERE WE TYPICALLY GET MULTIMEDIA DATA
Data Sources

DATA SOURCES
Social/Multimedia Platforms Facebook Insights Twitter Analytics YouTube Analytics Iconosquare (for Instagram) Pinterest Google+
Advocacy Tool (i.e. GaggleAMP) Qualitative Feedback
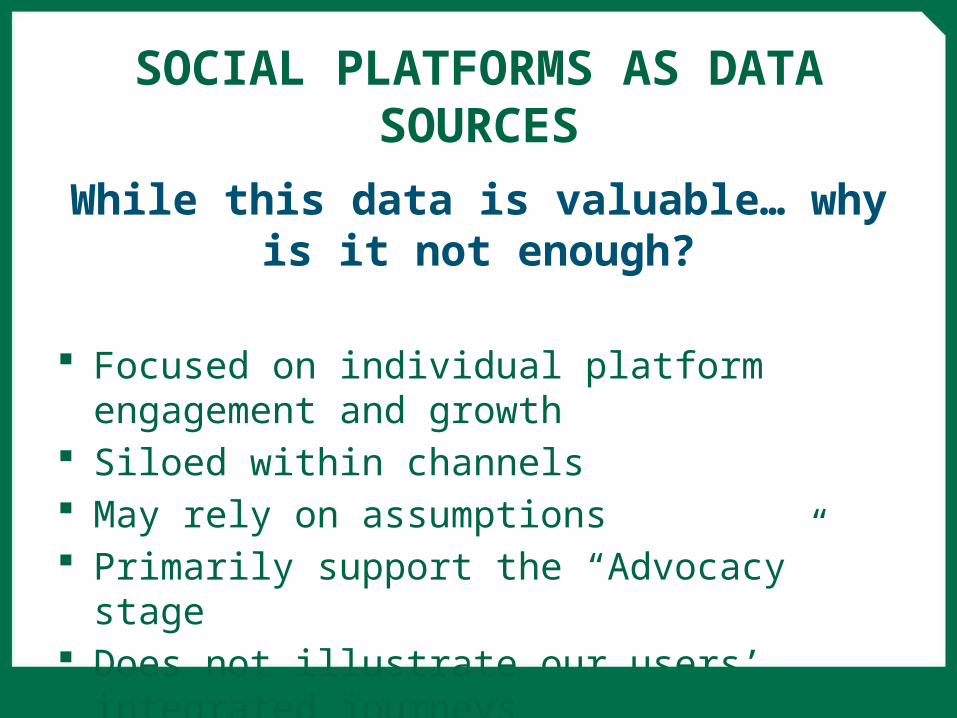
SOCIAL PLATFORMS AS DATA SOURCES
While this data is valuable… why is it not enough?
Focused on individual platform engagement and growth Siloed within channels May rely on assumptions Primarily support the “Advocacy” stage Does not illustrate our users’ integrated journeys

GOOGLE ANALYTICSThe Social Report

THE SOCIAL REPORT: FROM GOOGLE
“The [Social Reports] bridge the gap between social media and the business metrics you care about -
allowing you to better measure the full value of the social channel for your business.”
Measuring Multimedia andSocial Media Impact• Network Referrals• Conversions

THE SOCIAL REPORT: TWO QUESTIONS
1. Which social and multimedia platforms drive engaged visitors?
2. How does traffic from social and multimedia platforms impact programmatic goals?

THE SOCIAL REPORT: OVERVIEW
Acquisition > Social
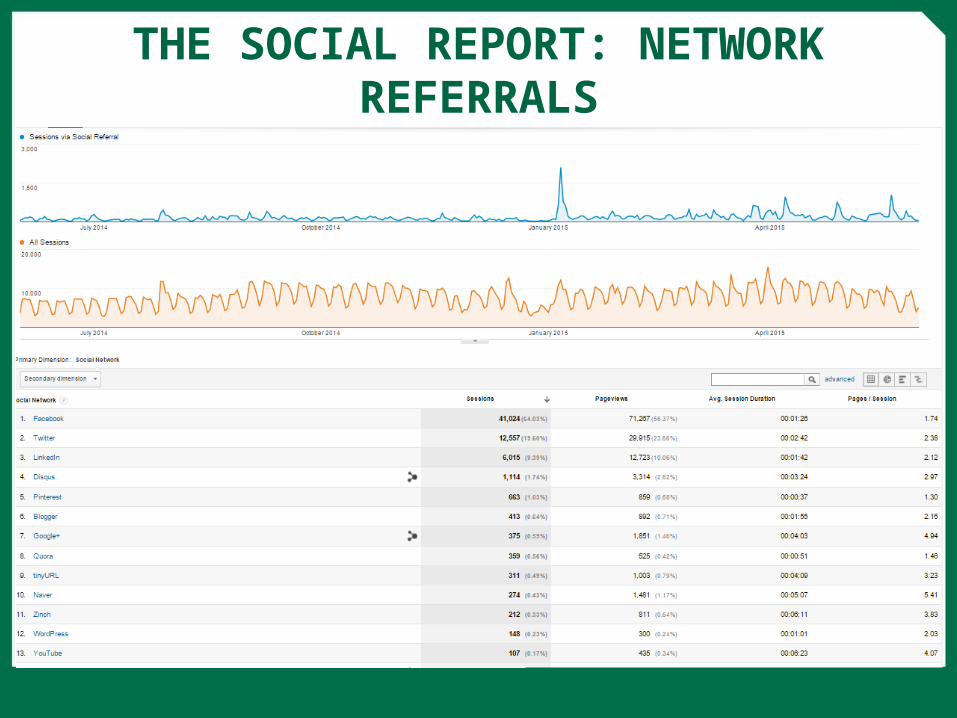
THE SOCIAL REPORT: NETWORK REFERRALS

THE SOCIAL REPORT: CONVERSIONS
Based on goals (i.e. Graduate, Undergrad, Exec Ed inquiries)
WHERE DOES THE DATA FIT INTO THE JOURNEY?
Institutional Quarterly Analytics Dashboard

WHERE DO THESE MULTIMEDIA METRICS FALL ALONG THE JOURNEY?
BECOME AWARE
CONSIDER EVALUATE BUY ENJOY
- Video/Image Views- Subscribers/Followers- Post Reach- Qualitative Feedback (Alumni)- Qualitative Feedback (Media)
- Referral Traffic to Website
- Website Goal Conversions- Advocacy Tool Data- Most Engaged Content- Top Shared URL

INTEGRATED ANALYTICS
BECOME AWARE
CONSIDER EVALUATE BUY ENJOY
Total Potential Reach
Top Shared URLs
Referral Traffic to WWW Properties
Conversions via Social Networks
Most Engaged Content
Total Impressions from Content
Total Followers Advocacy Tool (i.e. GaggleAMP)
Qualitative (External Community)
Qualitative (Advocates)

YOUR NEW MANTRA