Embed Size (px)
Citation preview

How We Used Analytics to Fuel Our GrowthCHUCK LIU & JESSICA TIAO AUGUST 20, 2015

CHUCK LIUDirector of Growth, Kissmetrics
@chuckjliu
JESSICA TIAO, “JT”UX Designer, Kissmetrics
@JessicaTiao
#KissWebinar, @Kissmetrics
@chuckjliu@jessicatiao

1 Introduction
• Segmentation: How to Tilt the Odds in your Favor
• Cohorts: Are Your Growth Tactics Working?
• Message Experimentation: The Hidden Side of Product Growth
2 3 Tactics to Fuel Growth
3 Recap
WHAT YOU WILL LEARN

WATCH WEBINAR RECORDING NOW

EXPERIENCE IN MARKETING / ANALYTICS FOR
5 YEARS
ALOT OF LESSONS LEARNED ALONG THE WAY

Have you seen a marketing campaign that caught your
attention?

THE LAW OF PERCEPTION
Marketing is not a battle of products; it’s a battle of
perceptions.Source: The 22 Immutable Laws of Marketing: Violate Them at Your Own Risk!


28.7% Market Share42.4% Market Share
Source: NASDAQ

In a blind taste test, Pepsi won
Source: Scientific American
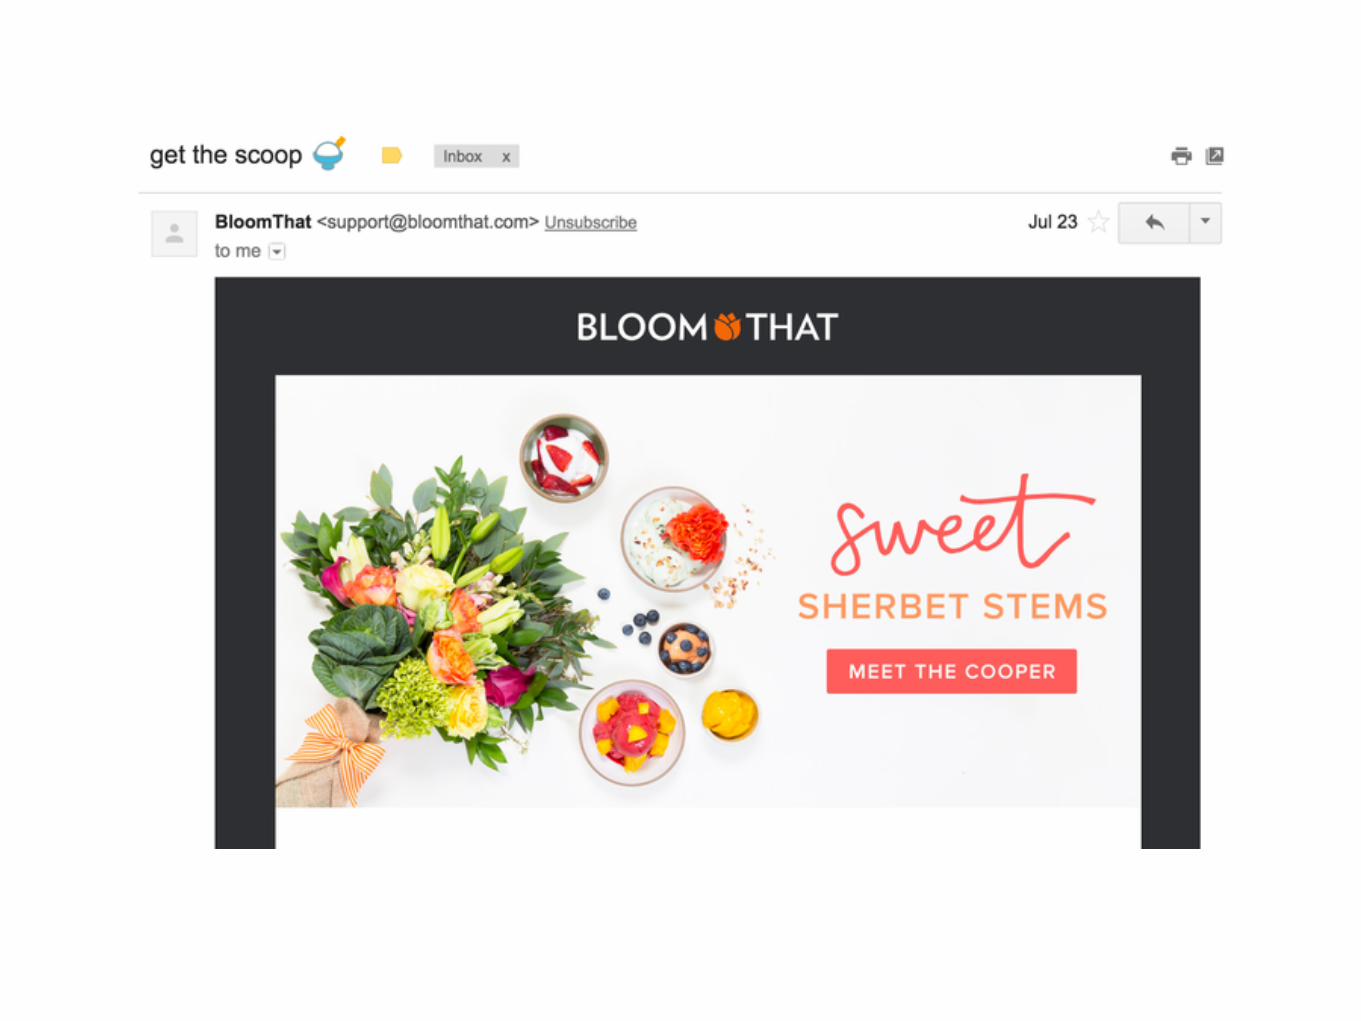
REFLECTIVE DESIGN
DON NORMANAuthor of The Design of Everyday Things
“ Reflection is about ones thoughts afterwards, how it makes one feel, the image it portrays, the message it tells others about the owner’s taste.

REFLECTIVE DESIGN

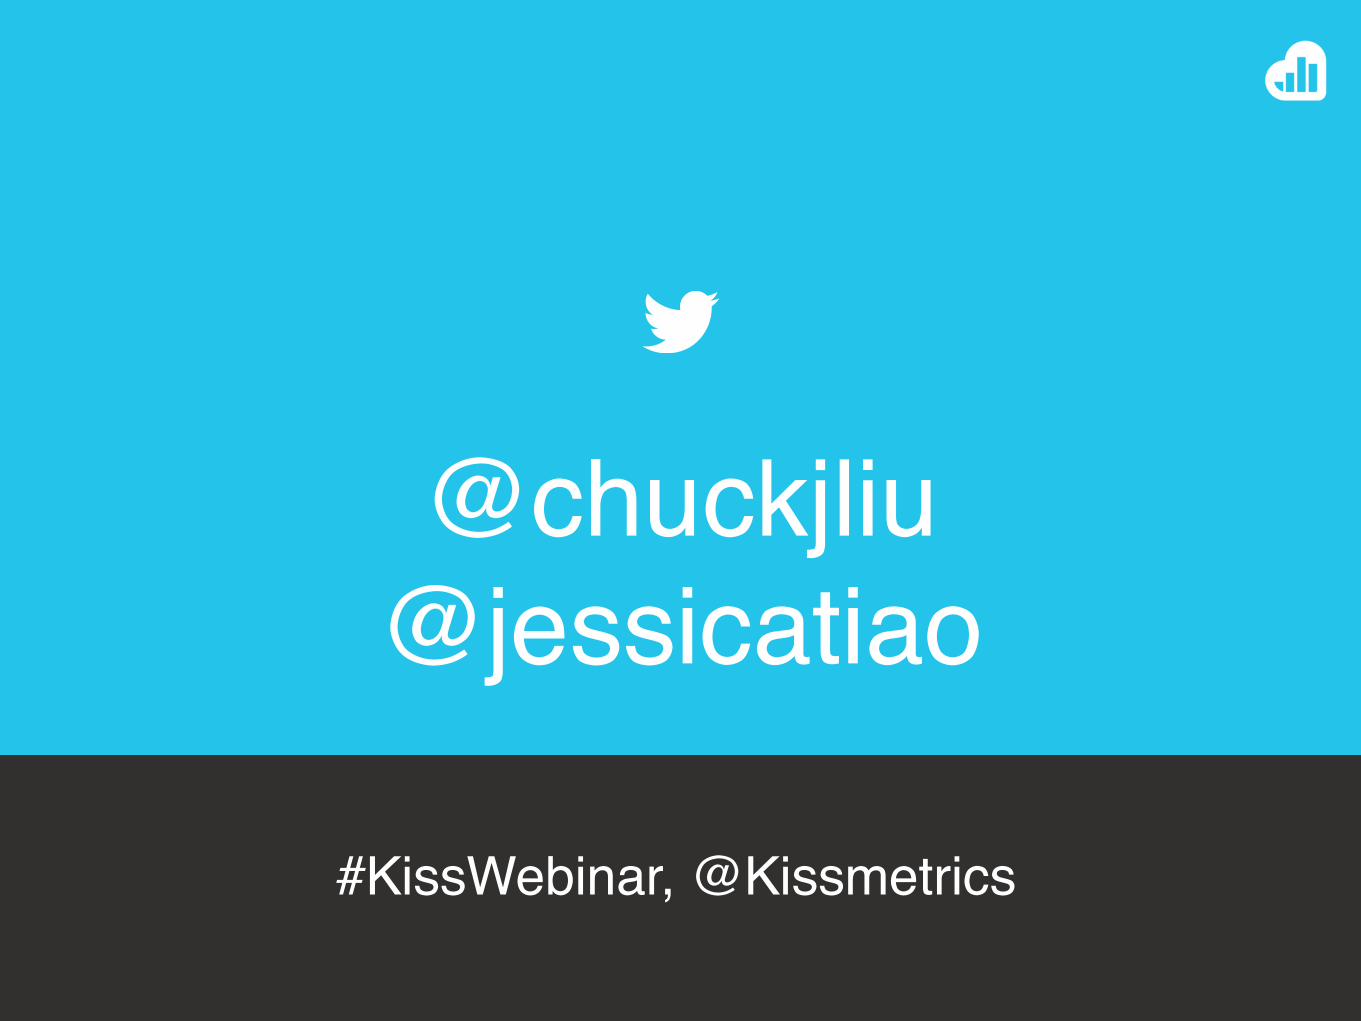
HOW BLOOMTHAT’S EMAIL MARKETING HAS EVOLVED
2013 20152013
ProfessionalCleanSimple
2015
Bright, young and artisanal Handcrafted
Unique & fresh

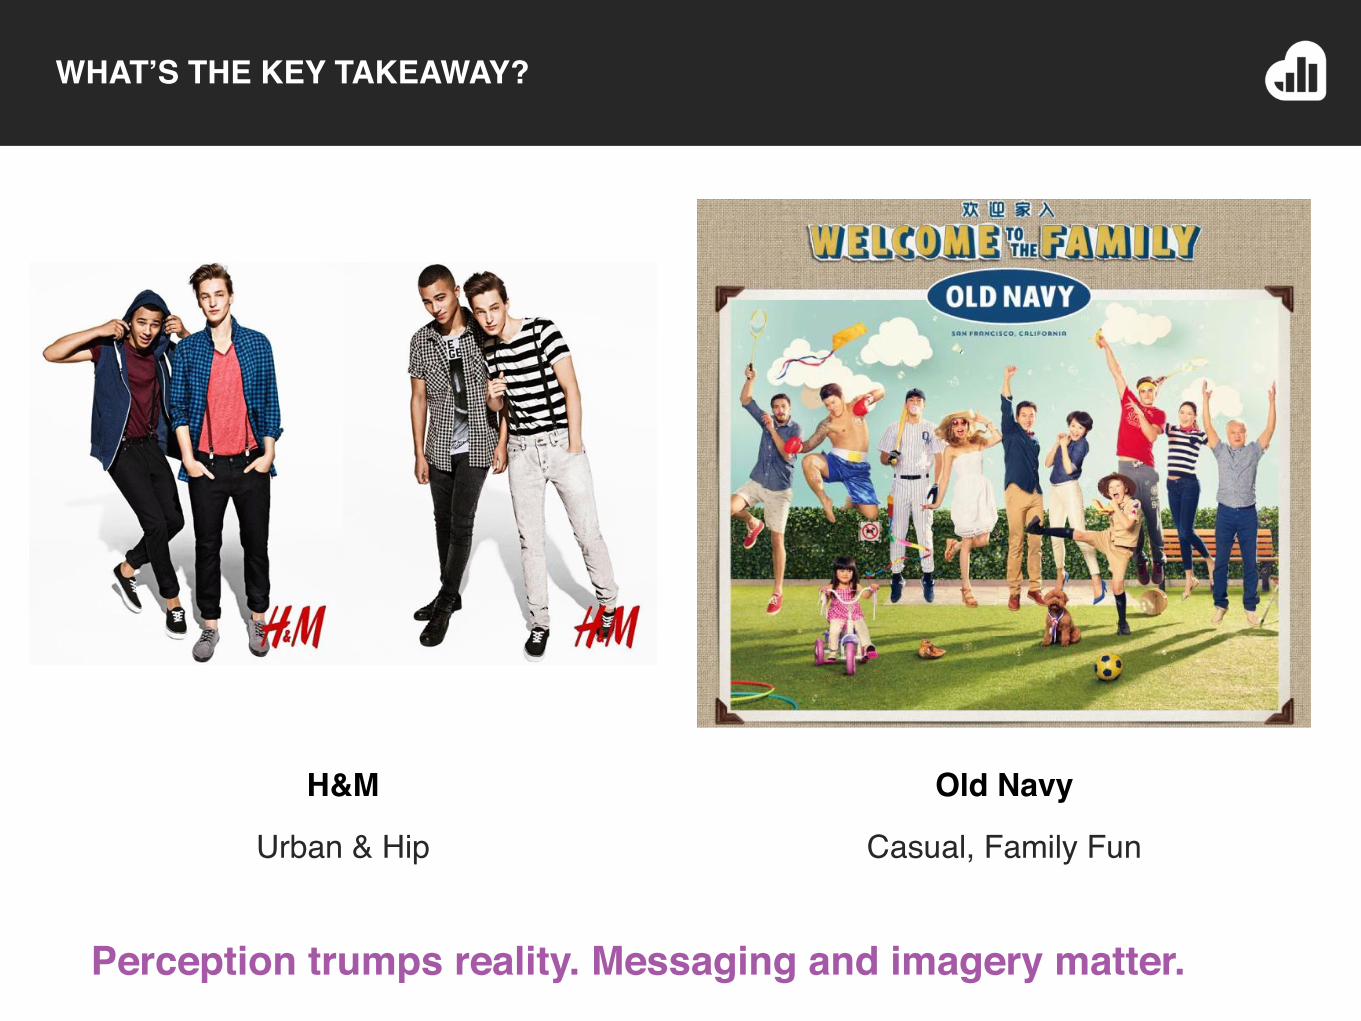
WHAT’S THE KEY TAKEAWAY?
2013 2015
Virgin America
Edgy, Young, Modern
American Airlines
Traditional
Perception trumps reality. Messaging and imagery matter.
WHAT’S THE KEY TAKEAWAY?
2013 2015
H&M
Urban & Hip
Old Navy
Casual, Family Fun
Perception trumps reality. Messaging and imagery matter.

Segmentation:How to Tilt the Odds in
Your FavorBREAK UP THE MASSES INTO BUYING HABITS

“ I’d say you really start with a basic understanding of your consumers or customers, right? …That’s segmentation.
SEGMENTATION
JOHN FORSYTHPartner, McKinsey

SIMILAR NEEDS, DIFFERENT BEHAVIORS
2013 2015

Customer SegmentationBreak up your audience into different groups who want the same thing with different preferences.
Getting an early understanding of customers and thus your market is
critical to long-term success.
Hiten Shah, Founder, Kissmetrics
• Who are your customers and how do you tell them apart?
• How can you reach your different customers?
• Are you able to take action to capture segment?

THE TWO TYPES OF SEGMENTATION
2013 2015
• Needs-based segmentation:• Segment the market based on what customers want, need, and
expect from you• Helps with product development and brand strategy
• Behavioral segmentation:• Segment the market based on what customers do, where
customers go, and how customers interact with your business• Helps with go-to-market and targeting tactics

EXAMPLE OF NEEDS BASED SEGMENTATION
2013 2015
• Company: CVS
• Segment: super customer” persona of a woman who’s responsible for managing medications across three generations: • her children• herself and her husband,• her parents.
• Need: medications for her children, herself and her husband, and her parents
Source: CMO.com

HOW CVS USES NEEDS-BASED SEGMENTATION
2013 2015
Source: CVS

EXAMPLE OF BEHAVIORAL SEGMENTATION
• Segment: Customers who purchase dental hygiene products
• Behavioral activity: CVS identified that people who buy toothpaste also bought beauty products more often.
Source: CMO.com

BEHAVIORAL SEGMENTATION: CVS SEPARATES BEAUTY & DENTAL HYGIENE
2015
Dental HygieneBeauty
Source: CMO.com

BEHAVIORAL SEGMENTATION: CVS MOVES BEAUTY CLOSER TO DENTAL HYGIENE
2015
Beauty Dental Hygiene
Source: CMO.com

NETFLIX TARGETS BINGE WATCHERS
• The Need: Watch at own pace• The Behavior: Binge watch• What Netflix did: Released all TV
season episodes at once
NETFLIX TARGETS BINGE WATCHERS

NETFLIX TARGETS BINGE WATCHERS
Netflix discovered that nearly 50% of users watch an entire TV season in one week.
Source: Wall Street Journal
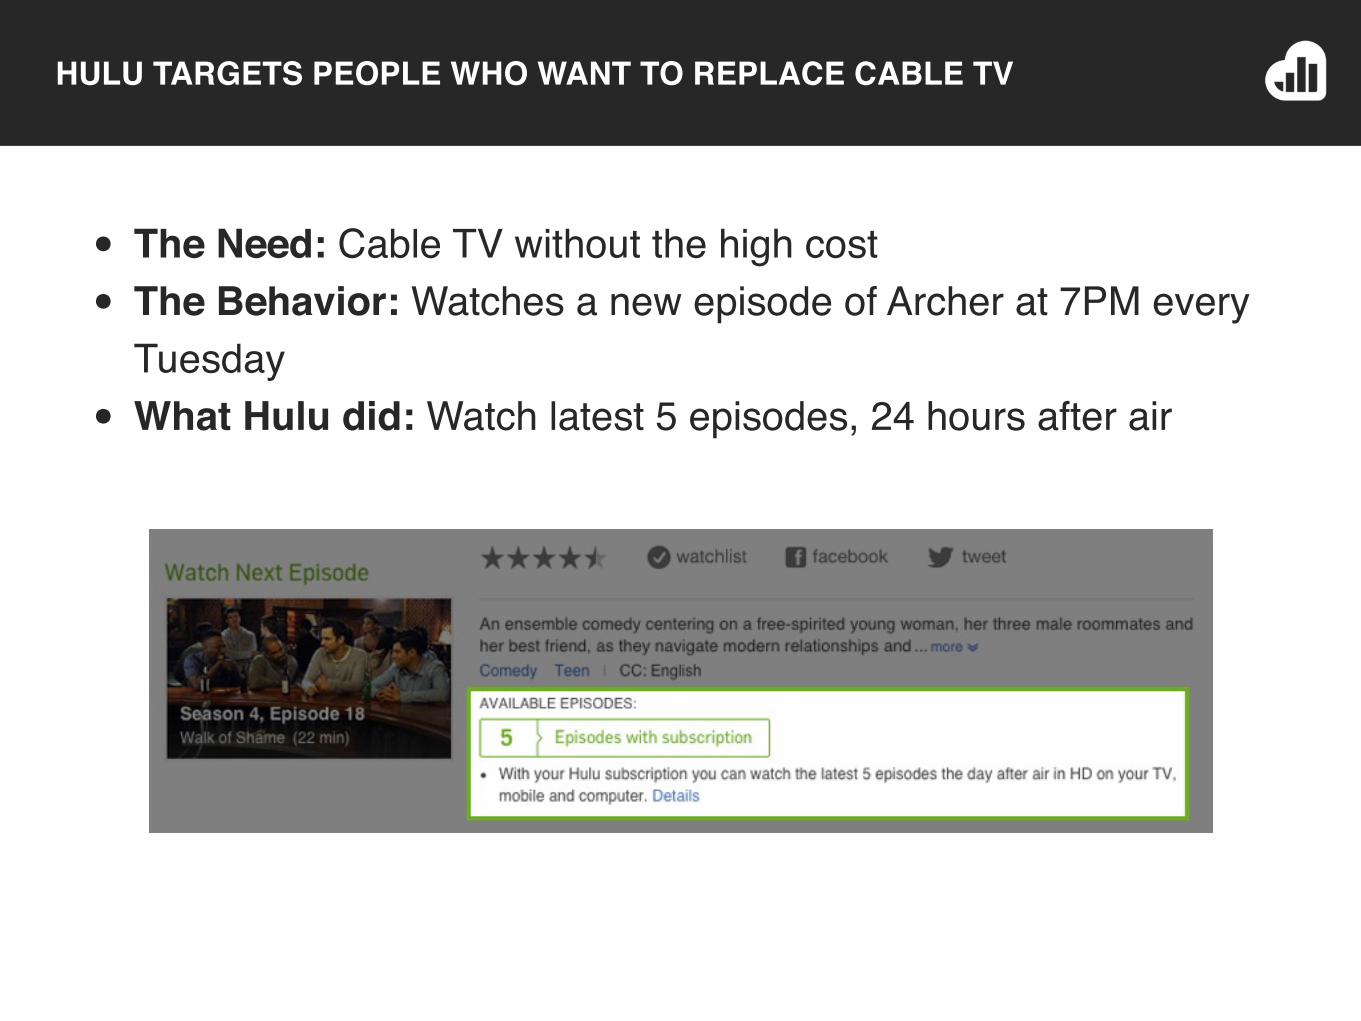
HULU TARGETS PEOPLE WHO WANT TO REPLACE CABLE TV
• The Need: Cable TV without the high cost • The Behavior: Watches a new episode of Archer at 7PM every
Tuesday• What Hulu did: Watch latest 5 episodes, 24 hours after air

IMAGINE YOU ARE A MARKETER AT NETFLIX OR HULU

A SAMPLE FUNNEL REPORT FROM PRICING TO SIGN UP

SEGMENT BY MARKETING CHANNEL TO IDENTIFY THE BEST PERFORMING SOURCES

IDENTIFY THE BEST CONVERTING SOURCE AND ASK YOURSELF “IS THIS SCALABLE?”
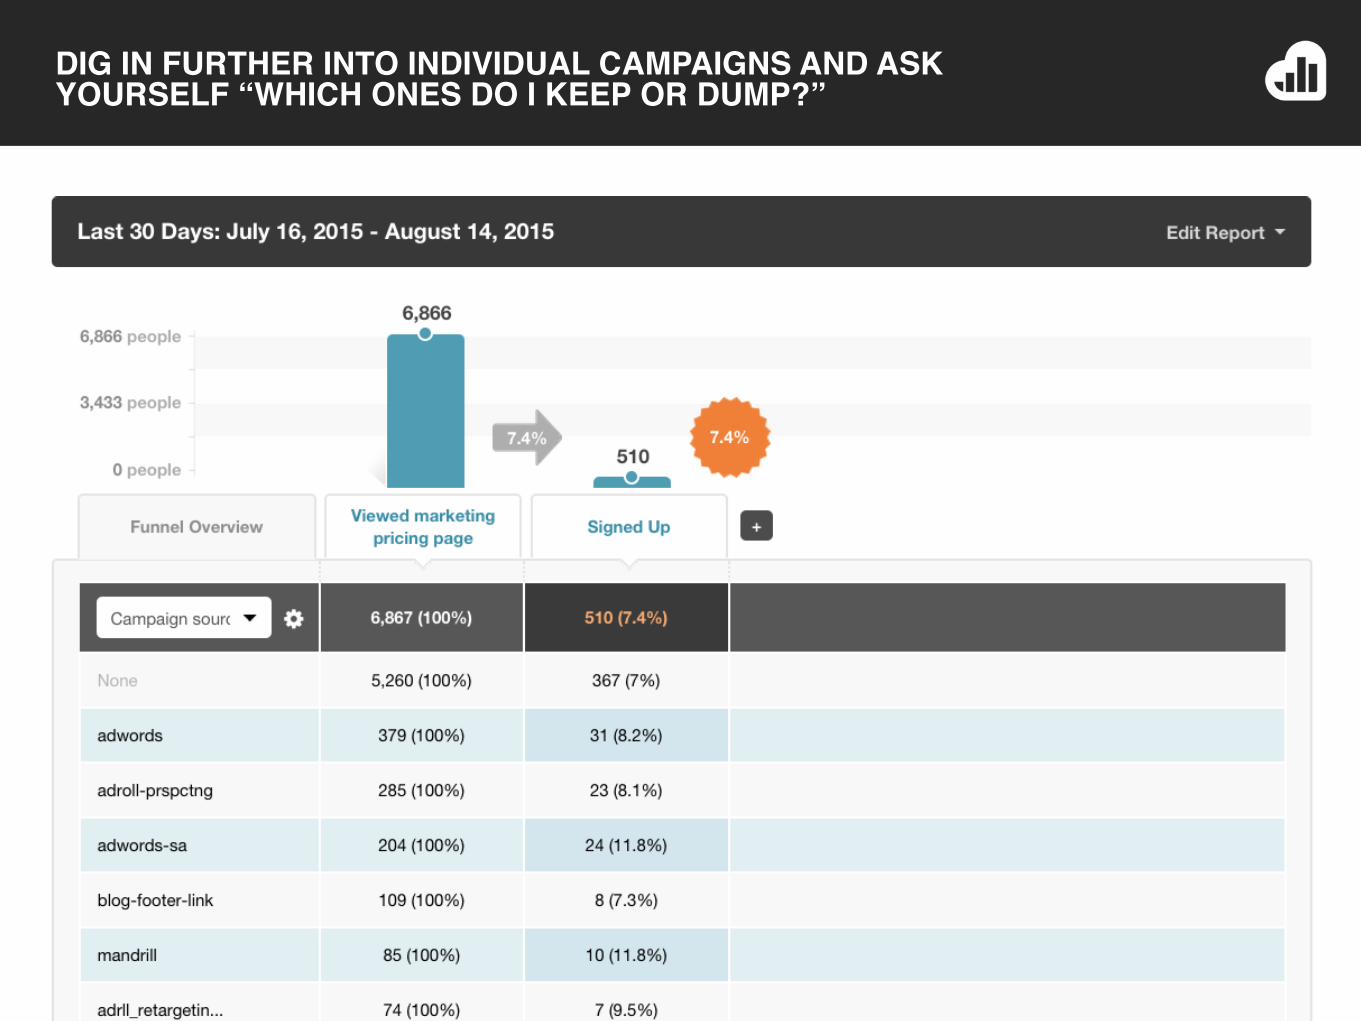
DIG IN FURTHER INTO INDIVIDUAL CAMPAIGNS AND ASK YOURSELF “WHICH ONES DO I KEEP OR DUMP?”

DIG IN FURTHER INTO INDIVIDUAL CAMPAIGNS AND ASK YOURSELF “WHICH ONES DO I KEEP OR DUMP?”

Cohort Analysis: What Is It?
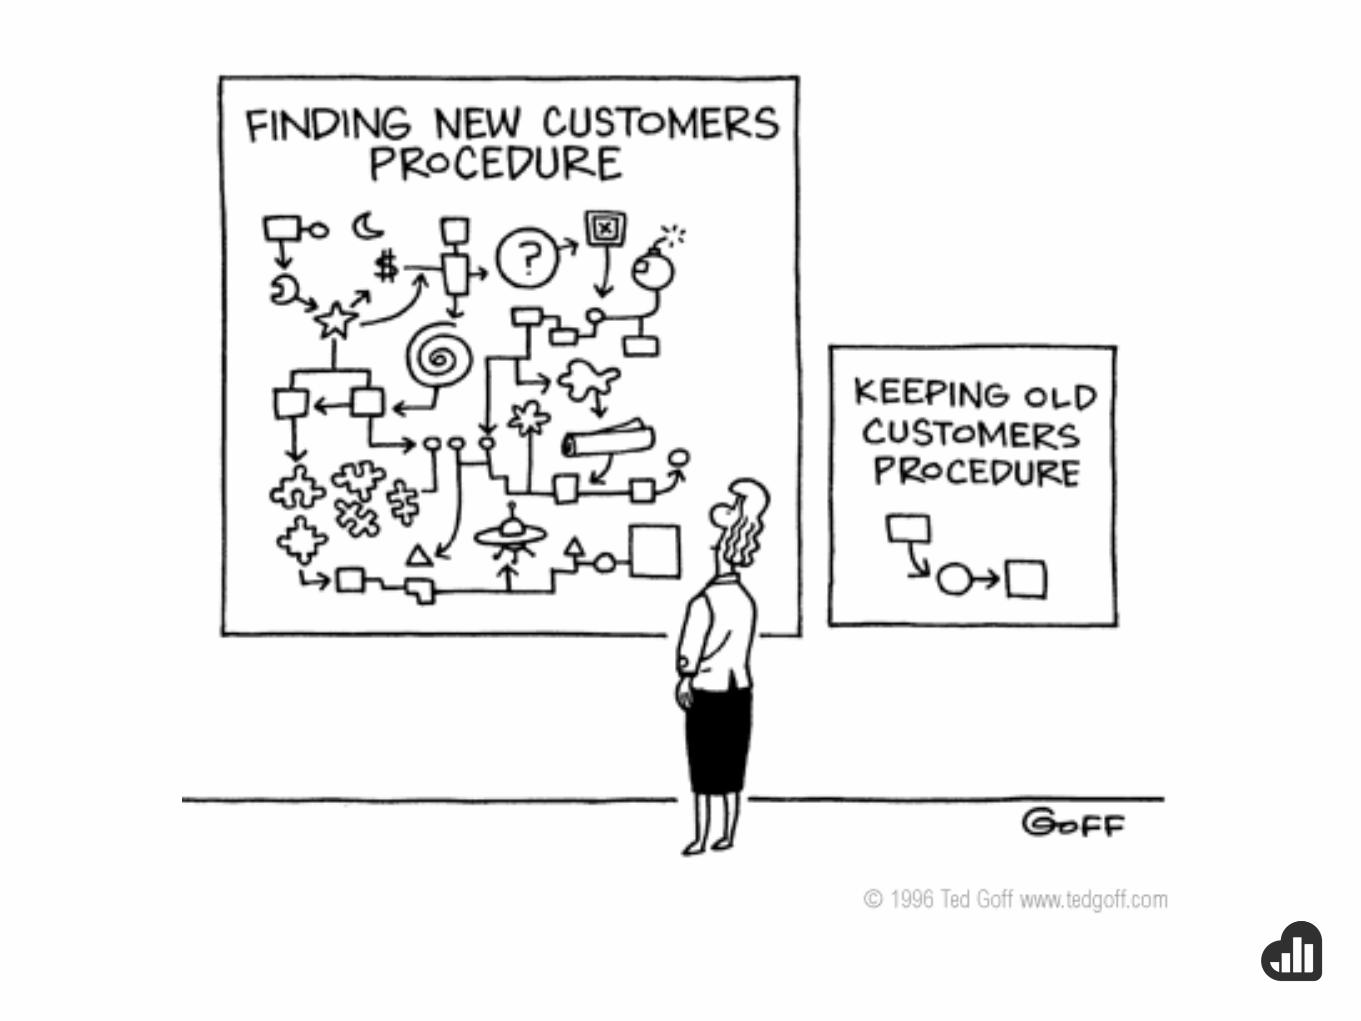
Why Does It Matter?FIGURE OUT HOW TO GET REPEAT BEHAVIOR AND FORM HABIT LOOPS

Cohort AnalysisWho sticks around from one time period to another?
Analyzing cohorts increases your chances of having people upgrade over time or buy again.
If you don’t have good retention, nothing else matters.
Brian Balfour,VP Growth, Hubspot
• What % of the user base is still active?• What differentiates groups of people?• What actions can you take to make
people stay?

Example Cohort Report

This row shows how many people signed up in February 2015.

This row shows how many people signed up in July 2015.

People signed up in February 2015.
People signed up in July 2015.
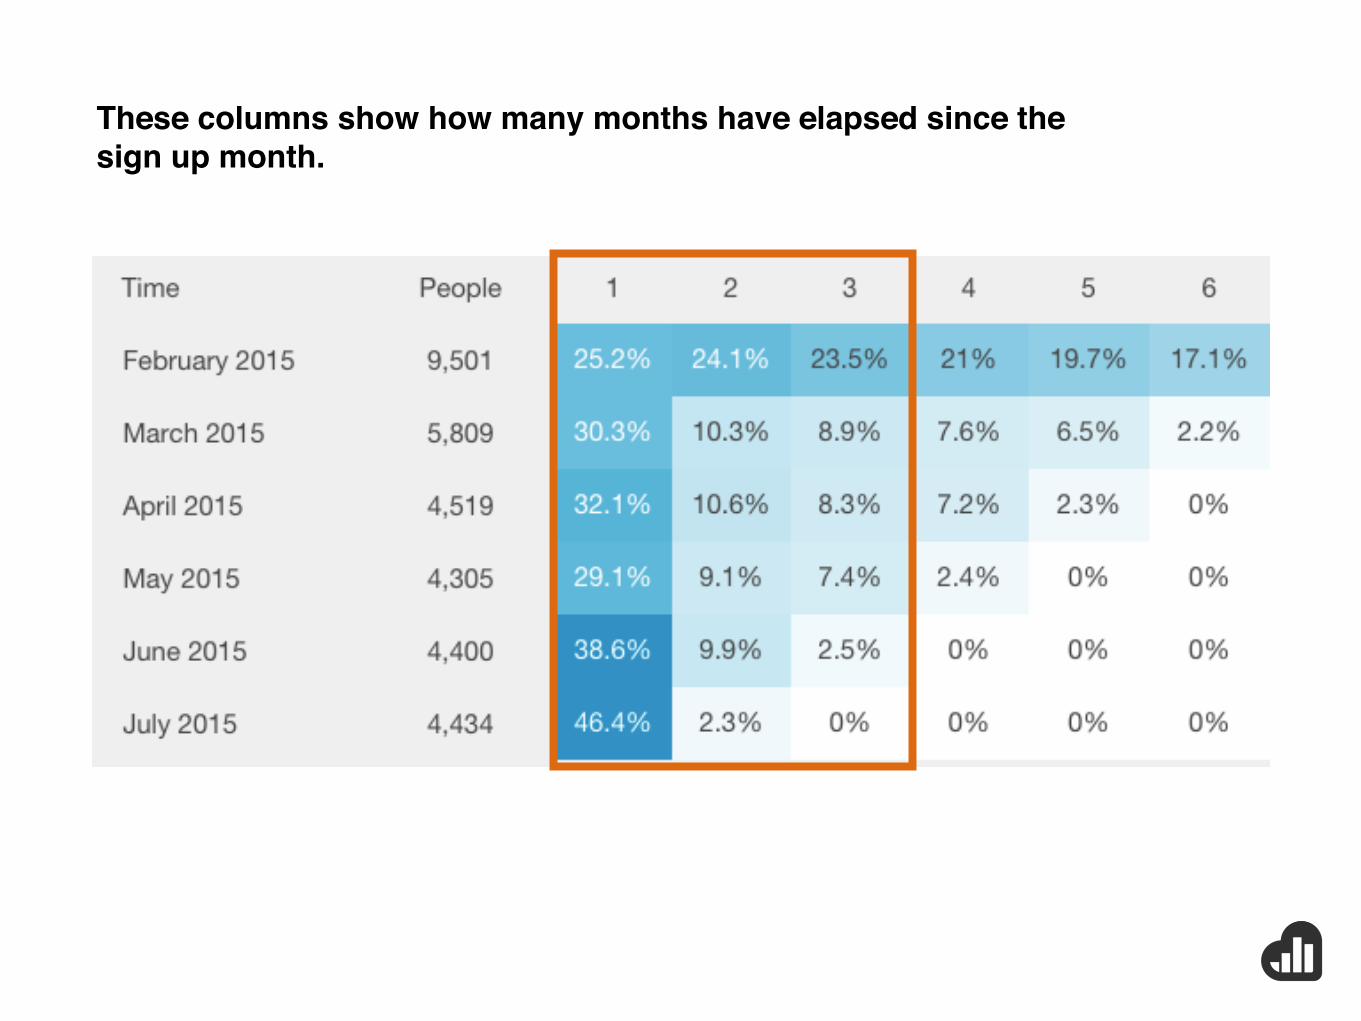
These columns show how many months have elapsed since the sign up month.

These cells represent the % of people that have come back within the first month since signing up.

Darker cells represent hot spots of high retention rate.
Lighter cells represent low retention rates.

The most important thing is the curve of this line.

This is a bad retention curve because this line reaches 0.

Retention starts at 40% at the first month, which means you’ve already lost 60% of your original users.

By month two, you’ve dropped to 15% of your original users.

By month 3 and onwards, barely any original users are present.

Over the course of 3 months, you’ve essentially lost all of your users.

This is a good retention curve because this line NEVER reaches 0.

Retention starts at 100% in the first month, meaning everyone has stuck around.
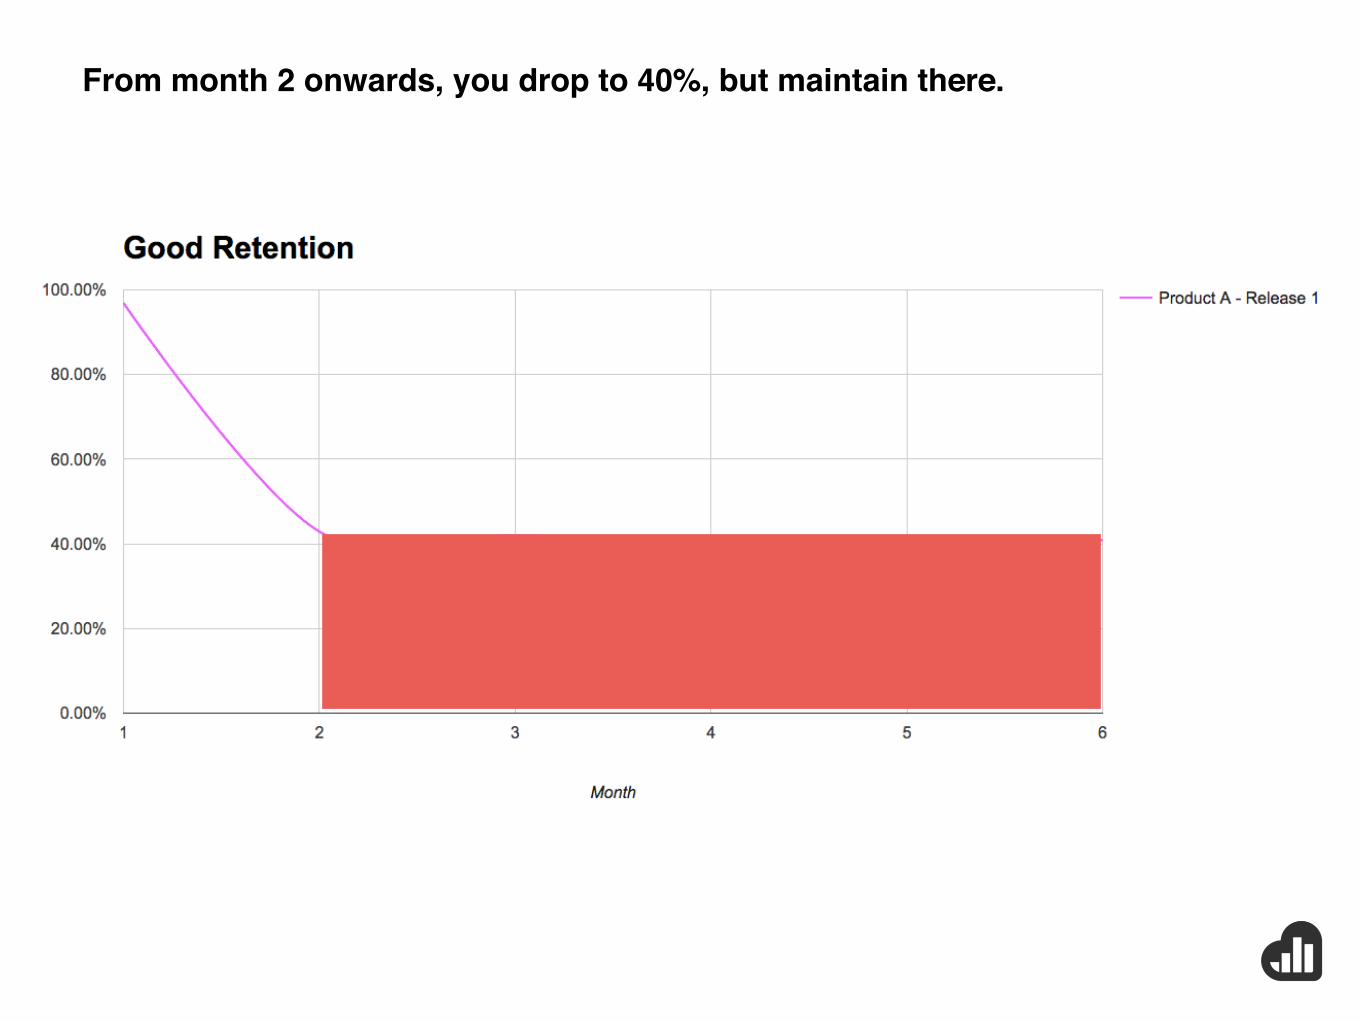
From month 2 onwards, you drop to 40%, but maintain there.

With improvements to your marketing, product, and efforts, you hope to increase retention every month.

With improvements to your marketing, product, and efforts, you hope to increase retention every month.

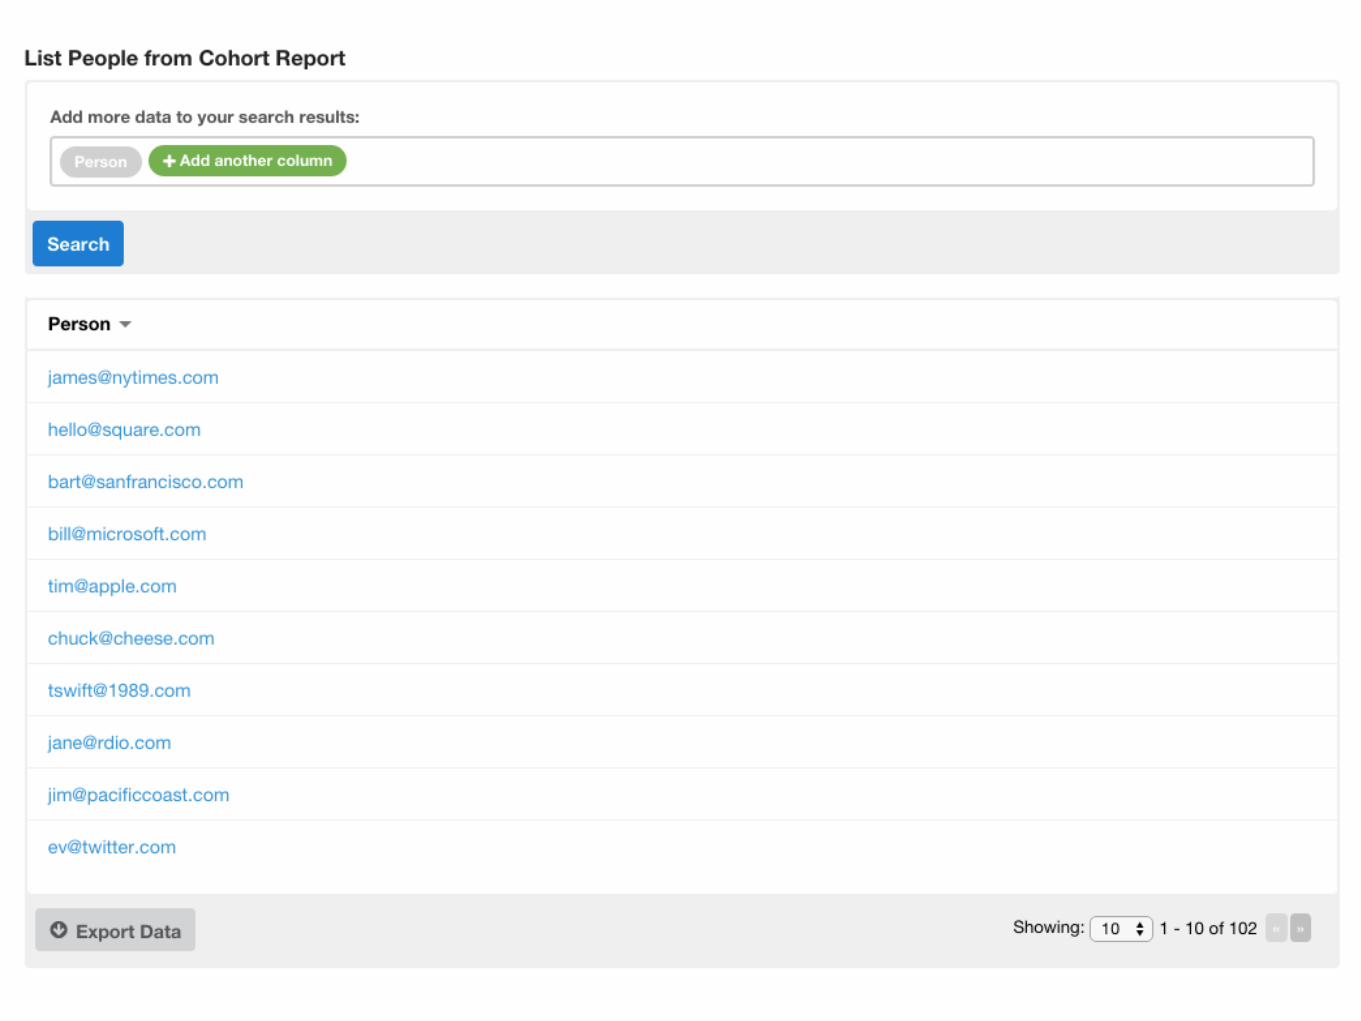
1. Click on the cell
2. Click on the “View the 102 people”

Use the words and phrases from customer
responses in the marketing copy to
increase conversions

Message Experimentation
INCREASED PRODUCT ADOPTION BY 12% IN 2 MONTHS FOR OUR NEW PRODUCT ENGAGE

Thomas H. Davenport, Professor, Babson College
ExperimentationFigure out how one channel works for you.
Experiment on other channels to figure out how to get them to work.
• What do you do now that could be improved?
• What inputs do you control?
• Do you have a culture of using data to make decisions?
The real payoff will happen when the organization as a whole shifts to a
test-and-learn mind-set

This is where we lifted product adoption by 12%.
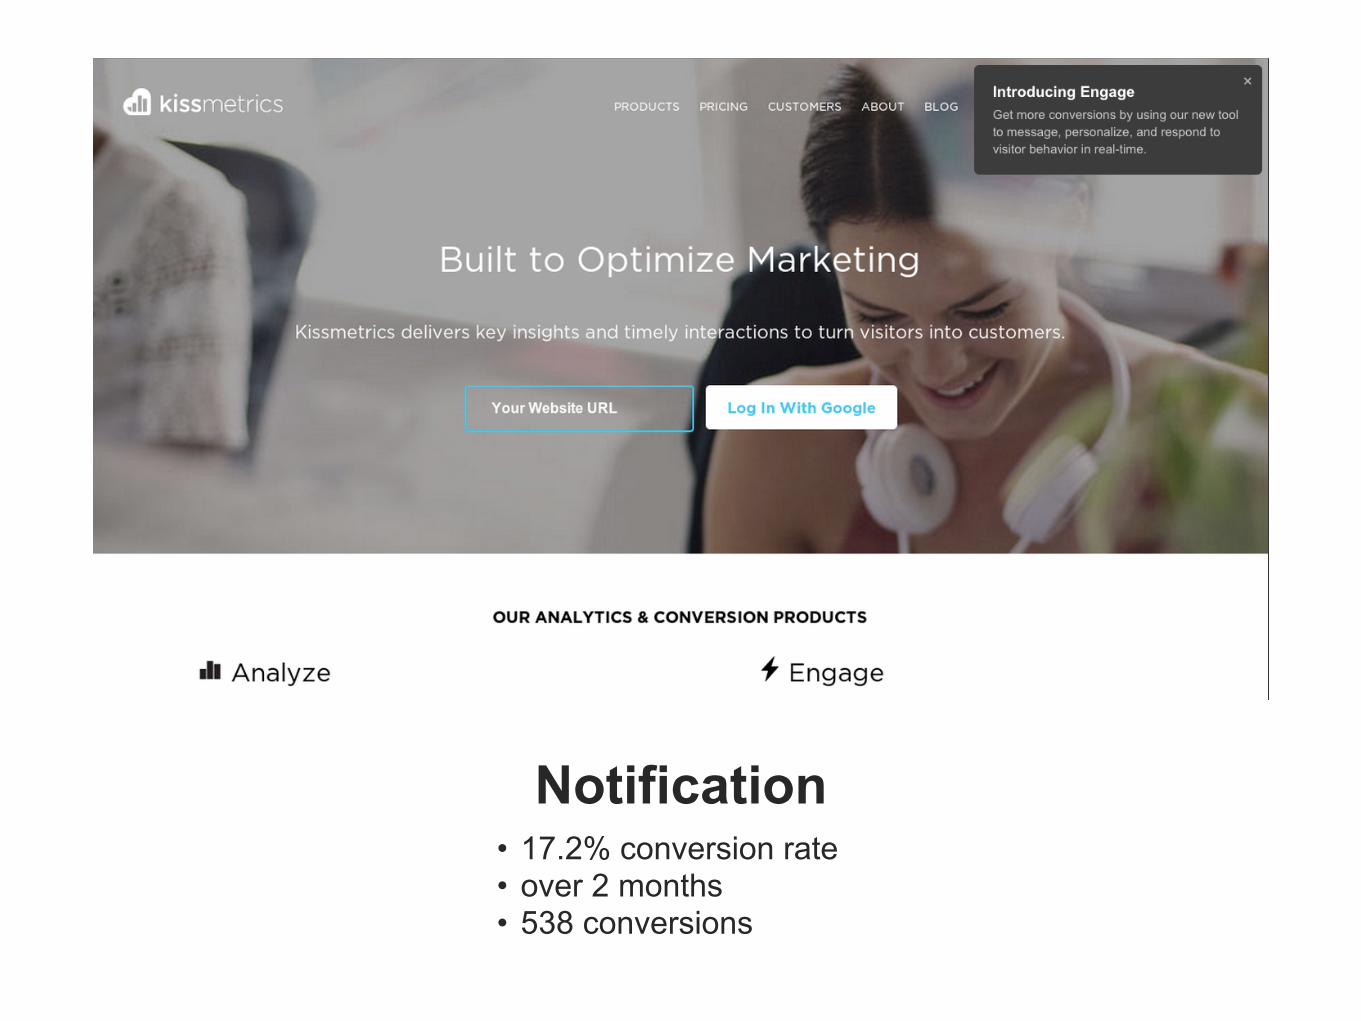
Notification • 17.2% conversion rate • over 2 months • 538 conversions


Lightbox
• 30.84% conversion rate • over 3 days • 278 conversions

1 Perception is everything. Tap into values, feelings and storytelling within your marketing.
2 Segment your audience to identify the best performing customer groups - then optimize.
4 Experimentation grants huge lifts if you have the culture and process.
RECAP AND TAKEAWAYS
3 Retention is king. Follow up with your customers at different life cycle stages to get relevant messaging copy.

LOG IN WITH GOOGLE
Start Your Free Kissmetrics Trial

THANK YOU + Q&A

APPENDIX: COHORT ANALYSIS FOR E-COMMERCE
We start by analyzing the time between a person’s initial purchase and their subsequent/future purchases.

APPENDIX: COHORT ANALYSIS FOR E-COMMERCE
We can segment to breakdown this cohort report to see the retention of different product categories.

APPENDIX: COHORT ANALYSIS FOR E-COMMERCE
You can see which products make people come back and purchase more frequently.

APPENDIX: COHORT ANALYSIS FOR E-COMMERCE
Belts, shoe laces, and pajamas have high rates of repeat customers long term.

APPENDIX: COHORT ANALYSIS FOR E-COMMERCE
Tennis shoes and jeans don’t cause people to come back and purchase again as well as the other categories.