Embed Size (px)
Citation preview

Top Financial Services Digital AdvertisersQ2 2016
Top Financial Services Digital AdvertisersTHE HIGHEST IMPRESSIONS AND SPENDERS ACROSS DESKTOP, MOBILE, VIDEO AND CONTENT
Big Spenders: Why Financial Services Tops Digital Advertising
And they’re not spending peanuts.
According to Pathmatics’ proprietary data, financial services companies spent more than $317 million in the U.S. on desktop digital advertising in Q1 2016, with three companies accounting for a whopping 33 percent of spending and just under 30 percent of impressions. Q2 2016 was no different, with financial services companies spending more than $296 million on digital advertising across desktop alone.
Financial services companies keep the world economy functioning. But they also play a huge role in the digital advertising ecosystem, topping all other industries by number of ad impressions.
There’s a good reason for that: digital advertising is a major acquisition channel for brands selling everything from tax software to insurance policies to credit card offers. Their customers now shop and bank online. And new fintech startups and their technology threaten to disrupt traditional business models.
As part of their multichannel marketing strategies, financial services companies spend tens of millions each quarter on paid and native advertising across sites like Yahoo, Forbes and the Huffington Post.
In fact, eMarketer predicts 2016 as a whole to be a boom year for U.S. financial services digital advertising:
“The US financial services industry will spend $8.37 billion on digital advertising in 2016, a 14.5% gain from 2015. As a result, this sector will be responsible for 12.2% of total US digital ad spending for the year.”
Who are the top advertisers in financial services by impressions and spend? What are the top creatives this money is funding? Which sites are financial services companies advertising on?
Big Spenders: Why Financial Services Tops Digital Advertising
We didn’t want to wait until the end of the year for answers to these questions. So we analyzed Q2 2016 data using Pathmatics’ real-time ad intelligence platform to determine which financial services companies dominated digital advertising from April to June 2016.
Here’s what we found.
Who Topped Financial Services Digital Advertising in Q2 2016?
Pathmatics data can tell us exactly who topped advertising impressions and spend across desktop, mobile and tablet, video and content advertising in Q2 2016. It can also show us where these financial services companies bought advertising and how they bought it (direct or indirect).
This level of reporting certainly makes financial services digital advertising a lot more transparent.
DesktopMobile is quickly becoming the screen of choice for many, but don’t discount desktop. It’s still the lion’s share of where ad dollars go in financial services.
In fact, the top 10 desktop advertisers by impressions in Q2 spent more than $154 million for nearly 23 billion impressions across direct or indirect (SSP, ad network or exchange) channels. Predictably, the desktop big spenders are insurance companies, banks and credit card companies, and the list reads like a who’s who of financial services giants: Progressive, American Express and Capital One feature prominently.
Top Financial Services Digital AdvertisersTHE HIGHEST IMPRESSIONS AND SPENDERS ACROSS DESKTOP, MOBILE, VIDEO AND CONTENT
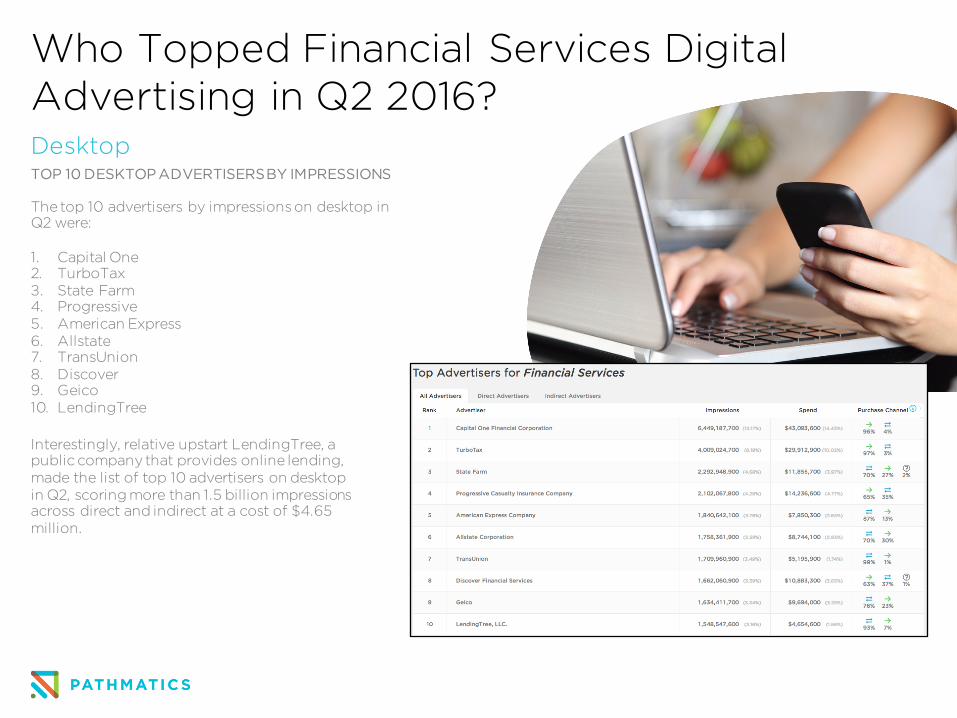
The top 10 advertisers by impressions on desktop in Q2 were:
1. Capital One2. TurboTax3. State Farm4. Progressive5. American Express6. Allstate7. TransUnion8. Discover9. Geico10. LendingTree
Who Topped Financial Services DigitalAdvertising in Q2 2016?
Interestingly, relative upstart LendingTree, a public company that provides online lending, made the list of top 10 advertisers on desktop in Q2, scoring more than 1.5 billion impressions across direct and indirect at a cost of $4.65 million.
TOP 10 DESKTOP ADVERTISERS BY IMPRESSIONS
Desktop
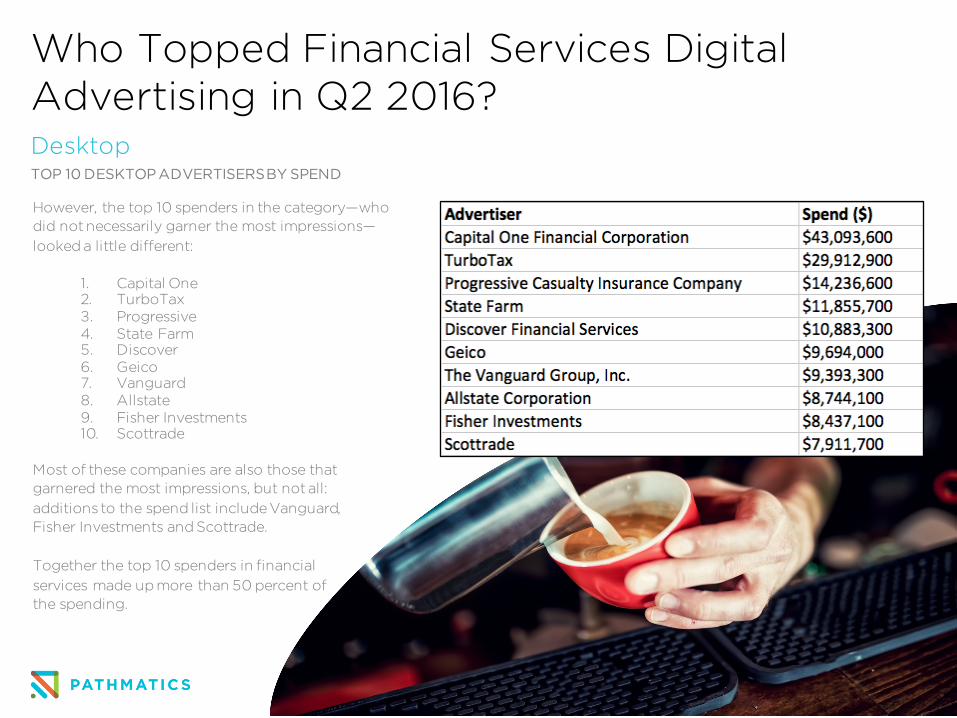
However, the top 10 spenders in the category—who did not necessarily garner the most impressions—looked a little different:
1. Capital One2. TurboTax3. Progressive4. State Farm5. Discover6. Geico7. Vanguard8. Allstate9. Fisher Investments10. Scottrade
Most of these companies are also those that garnered the most impressions, but not all: additions to the spend list include Vanguard, Fisher Investments and Scottrade.
Together the top 10 spenders in financial services made up more than 50 percent of the spending.
Who Topped Financial Services DigitalAdvertising in Q2 2016?DesktopTOP 10 DESKTOP ADVERTISERS BY SPEND
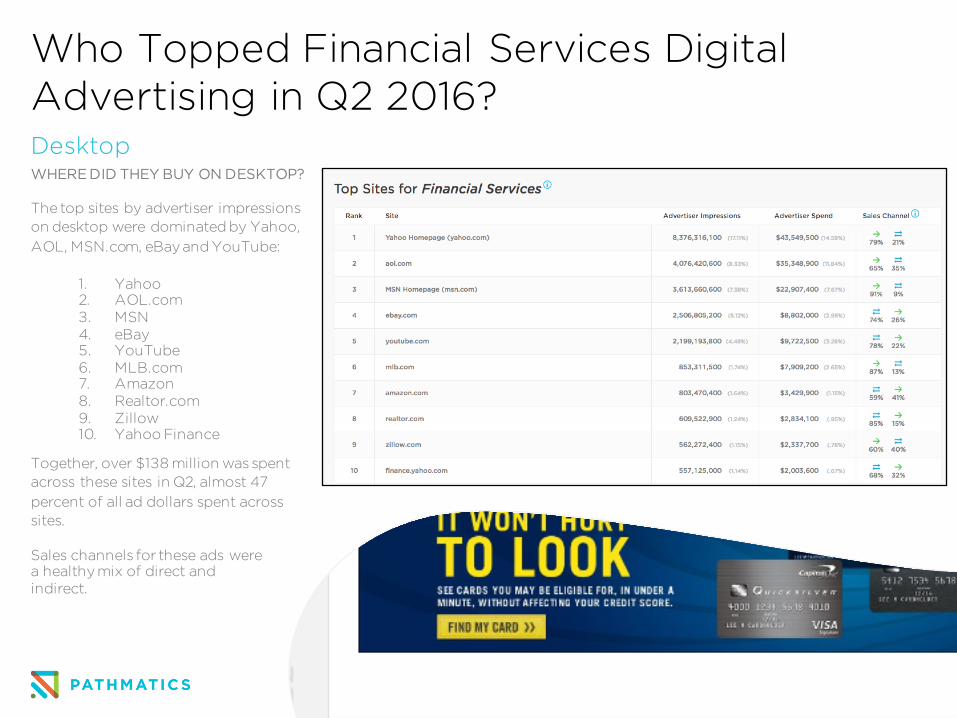
The top sites by advertiser impressions on desktop were dominated by Yahoo, AOL, MSN.com, eBay and YouTube:
1. Yahoo2. AOL.com3. MSN4. eBay5. YouTube6. MLB.com7. Amazon8. Realtor.com9. Zillow10. Yahoo Finance
Sales channels for these ads were a healthy mix of direct and indirect.
Together, over $138 million was spent across these sites in Q2, almost 47 percent of all ad dollars spent across sites.
Who Topped Financial Services DigitalAdvertising in Q2 2016?DesktopWHERE DID THEY BUY ON DESKTOP?
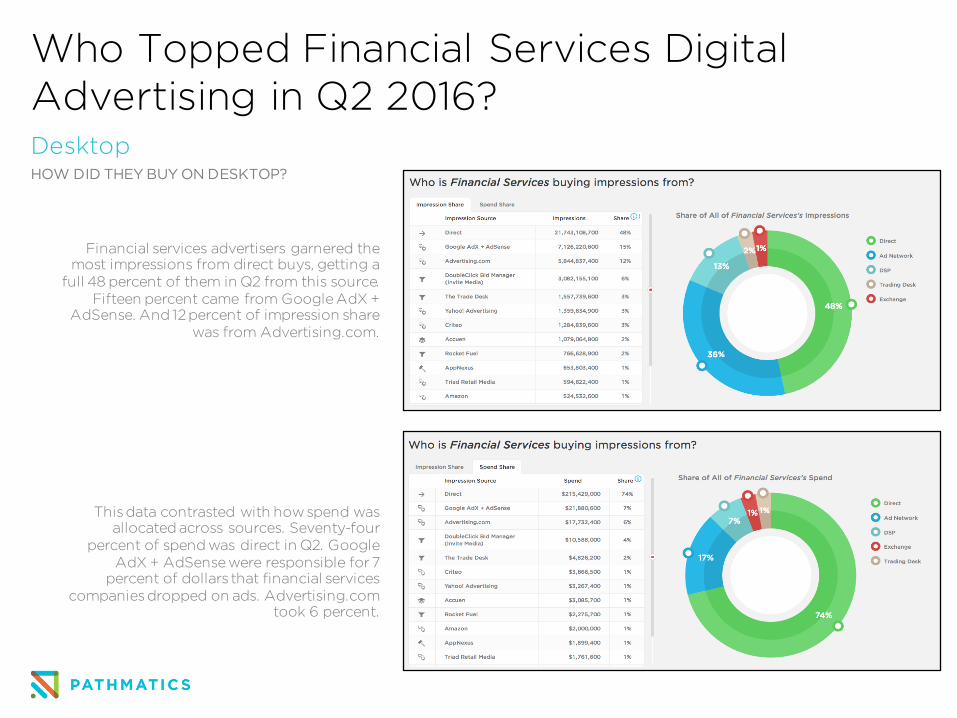
Financial services advertisers garnered the most impressions from direct buys, getting a
full 48 percent of them in Q2 from this source. Fifteen percent came from Google AdX +
AdSense. And 12 percent of impression share was from Advertising.com.
This data contrasted with how spend was allocated across sources. Seventy-four
percent of spend was direct in Q2. Google AdX + AdSense were responsible for 7
percent of dollars that financial services companies dropped on ads. Advertising.com
took 6 percent.
Who Topped Financial Services DigitalAdvertising in Q2 2016?DesktopHOW DID THEY BUY ON DESKTOP?
MobileTOP 10 MOBILE AND TABLET ADVERTISERS BY IMPRESSIONS
The top 10 mobile and tablet advertisers by impressions in Q2 were:
1. Capital One2. TurboTax3. State Farm4. American Express5. Allstate6. Progressive7. Geico8. Discover9. Equifax10. JPMorgan Chase
As goes desktop, so goes mobile and tablet. Eight out of the 10 top desktop advertisers by impressions made the top 10 mobile and tablet advertisers by impressions list, with the exceptions of LendingTree and TransUnion.
The only companies that made the mobile list but not the desktop one were Equifax, a credit reporting agency, and JPMorgan Chase, an investment bank.
Who Topped Financial Services DigitalAdvertising in Q2 2016?
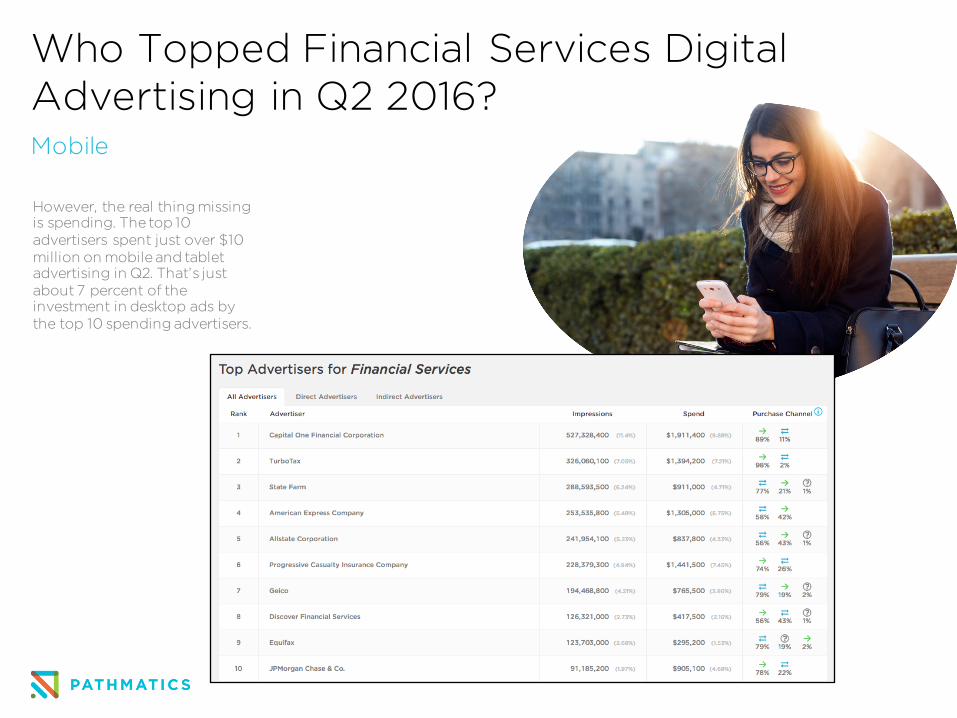
However, the real thing missing is spending. The top 10 advertisers spent just over $10 million on mobile and tablet advertising in Q2. That’s just about 7 percent of the investment in desktop ads by the top 10 spending advertisers.
Who Topped Financial Services DigitalAdvertising in Q2 2016?Mobile
TOP 10 MOBILE AND TABLET ADVERTISERS BY SPEND
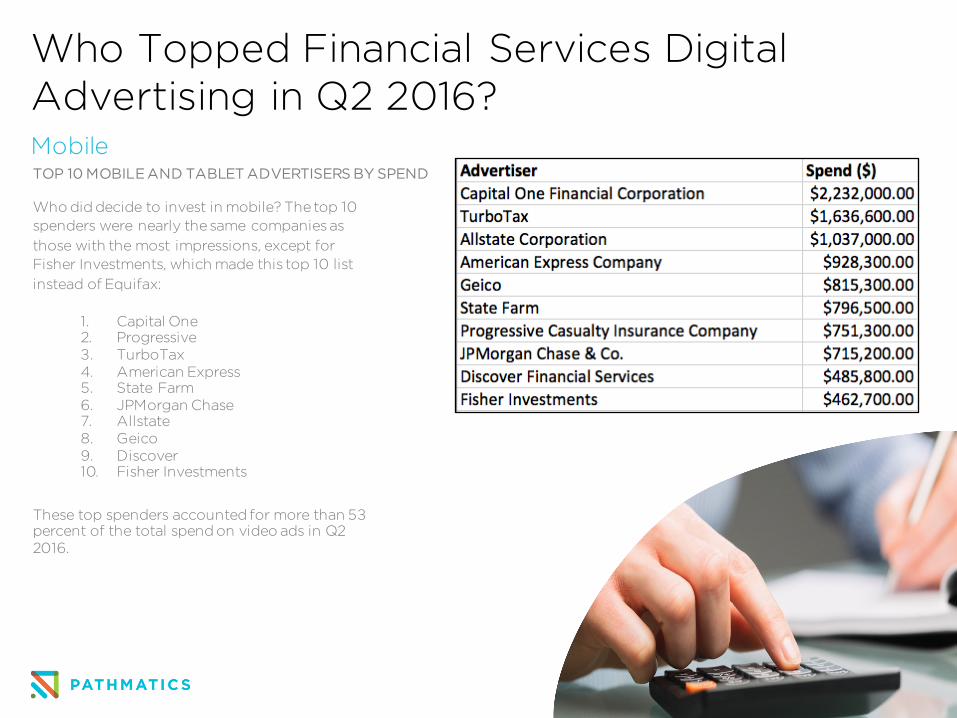
Who did decide to invest in mobile? The top 10 spenders were nearly the same companies as those with the most impressions, except for Fisher Investments, which made this top 10 list instead of Equifax:
1. Capital One2. Progressive3. TurboTax4. American Express5. State Farm6. JPMorgan Chase7. Allstate8. Geico9. Discover10. Fisher Investments
These top spenders accounted for more than 53 percent of the total spend on video ads in Q2 2016.
Who Topped Financial Services DigitalAdvertising in Q2 2016?Mobile
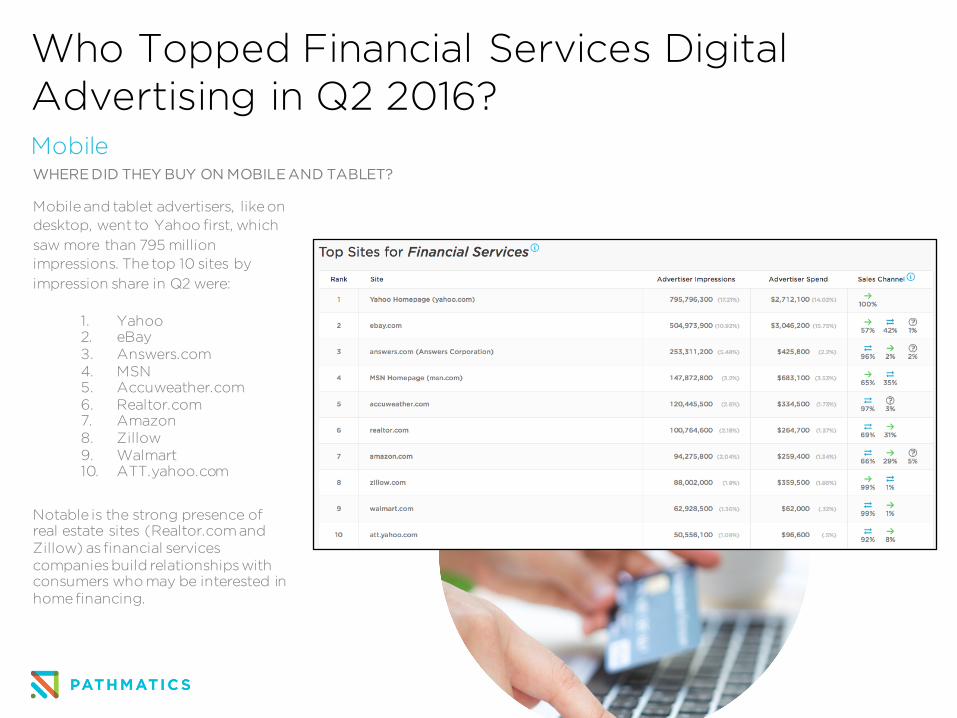
Mobile and tablet advertisers, like on desktop, went to Yahoo first, which saw more than 795 million impressions. The top 10 sites by impression share in Q2 were:
1. Yahoo2. eBay3. Answers.com4. MSN5. Accuweather.com6. Realtor.com7. Amazon8. Zillow9. Walmart10. ATT.yahoo.com
Who Topped Financial Services DigitalAdvertising in Q2 2016?
WHERE DID THEY BUY ON MOBILE AND TABLET?
Notable is the strong presence of real estate sites (Realtor.com and Zillow) as financial services companies build relationships with consumers who may be interested in home financing.
Mobile
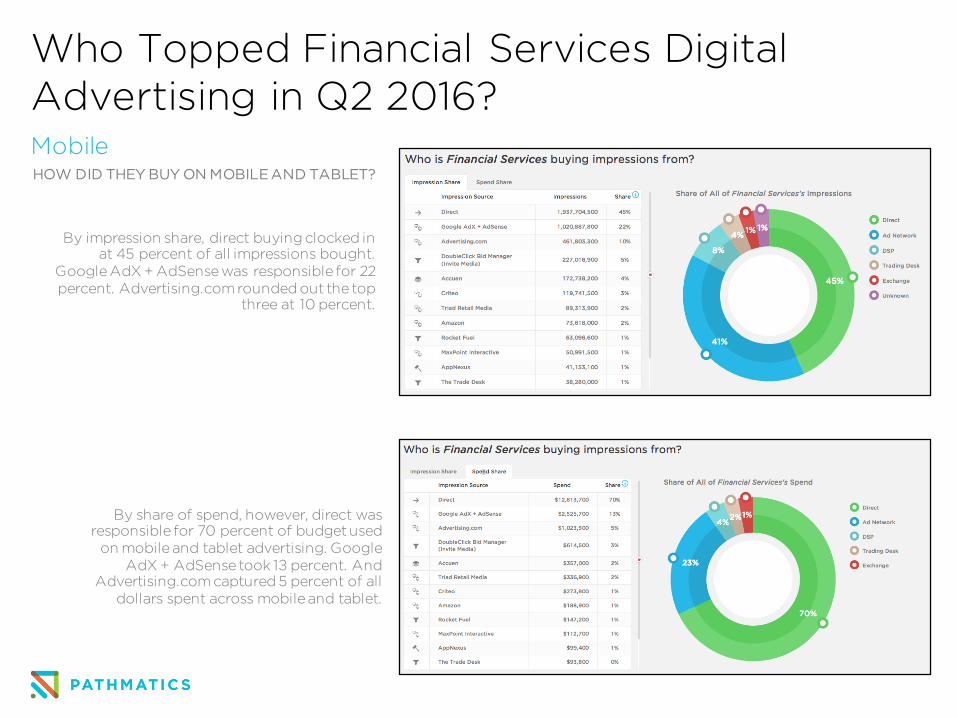
Who Topped Financial Services DigitalAdvertising in Q2 2016?MobileHOW DID THEY BUY ON MOBILE AND TABLET?
By impression share, direct buying clocked in at 45 percent of all impressions bought.
Google AdX + AdSense was responsible for 22 percent. Advertising.com rounded out the top
three at 10 percent.
By share of spend, however, direct was responsible for 70 percent of budget used
on mobile and tablet advertising. Google AdX + AdSense took 13 percent. And
Advertising.com captured 5 percent of all dollars spent across mobile and tablet.
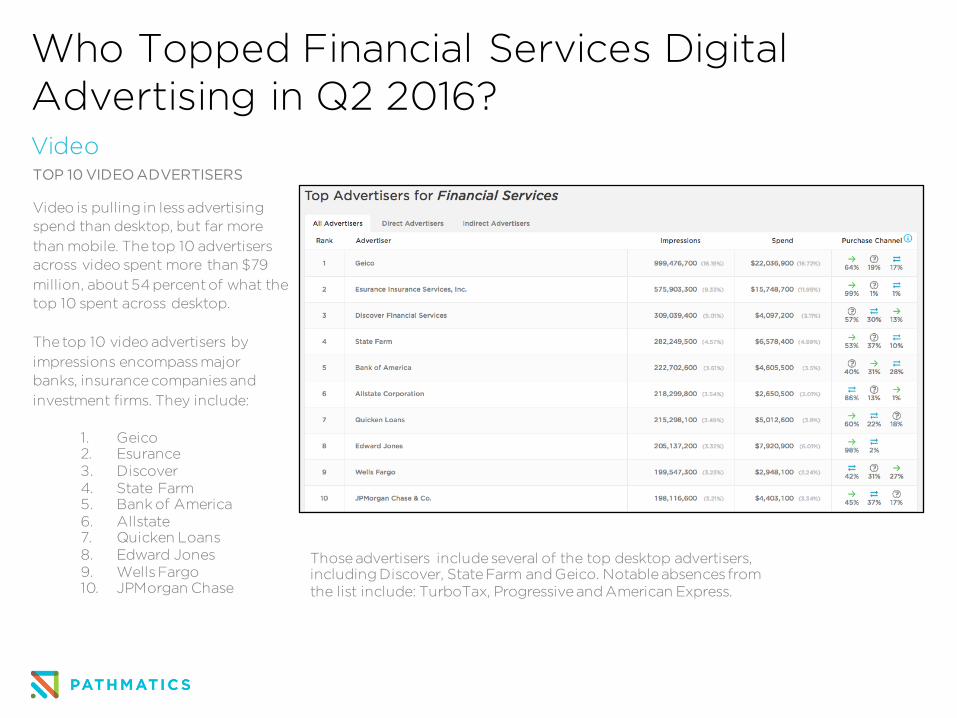
Who Topped Financial Services DigitalAdvertising in Q2 2016?VideoTOP 10 VIDEO ADVERTISERS
Video is pulling in less advertising spend than desktop, but far more than mobile. The top 10 advertisers across video spent more than $79 million, about 54 percent of what the top 10 spent across desktop.
The top 10 video advertisers by impressions encompass major banks, insurance companies and investment firms. They include:
1. Geico2. Esurance3. Discover4. State Farm5. Bank of America6. Allstate7. Quicken Loans8. Edward Jones9. Wells Fargo10. JPMorgan Chase
Those advertisers include several of the top desktop advertisers, including Discover, State Farm and Geico. Notable absences from the list include: TurboTax, Progressive and American Express.
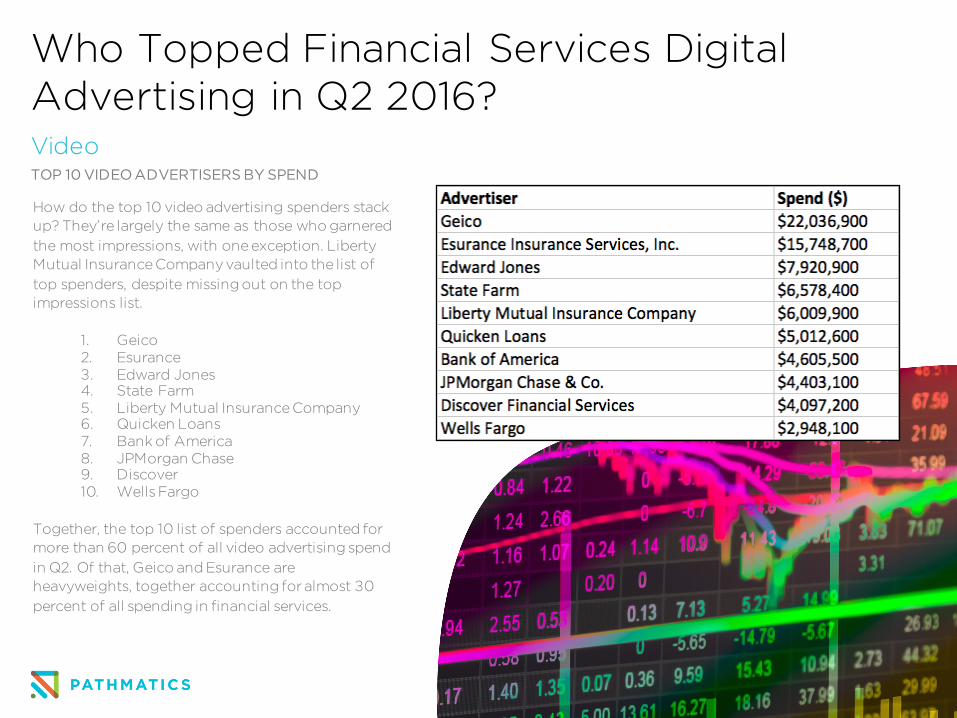
TOP 10 VIDEO ADVERTISERS BY SPEND
Who Topped Financial Services DigitalAdvertising in Q2 2016?Video
How do the top 10 video advertising spenders stack up? They’re largely the same as those who garnered the most impressions, with one exception. Liberty Mutual Insurance Company vaulted into the list of top spenders, despite missing out on the top impressions list.
1. Geico2. Esurance3. Edward Jones4. State Farm5. Liberty Mutual Insurance Company6. Quicken Loans7. Bank of America8. JPMorgan Chase9. Discover10. Wells Fargo
Together, the top 10 list of spenders accounted for more than 60 percent of all video advertising spend in Q2. Of that, Geico and Esurance are heavyweights, together accounting for almost 30 percent of all spending in financial services.
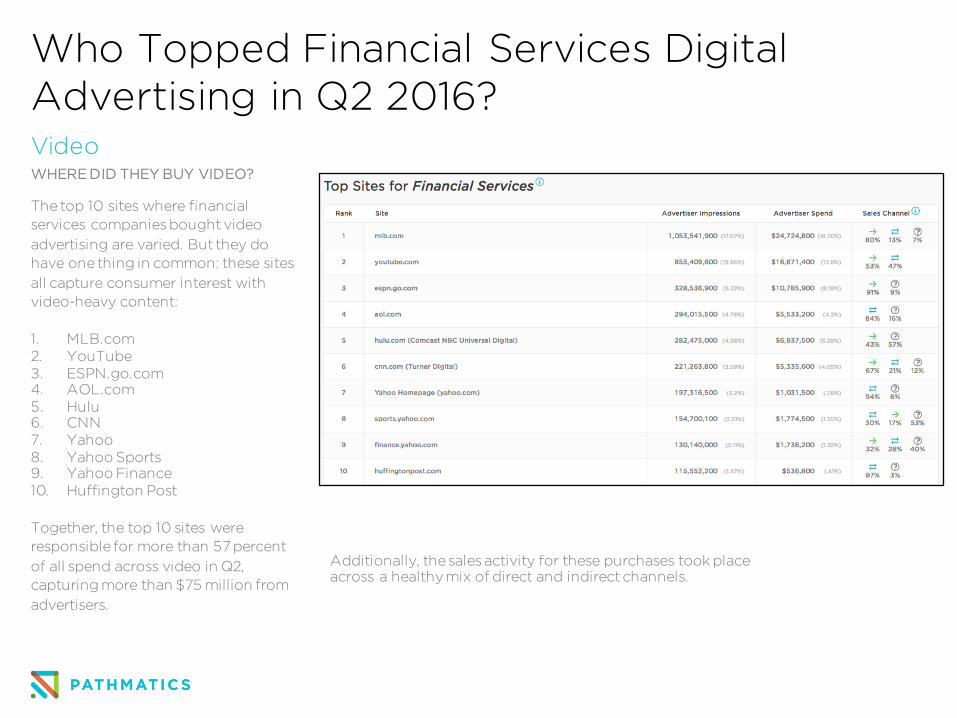
Who Topped Financial Services DigitalAdvertising in Q2 2016?VideoWHERE DID THEY BUY VIDEO?
The top 10 sites where financial services companies bought video advertising are varied. But they do have one thing in common: these sites all capture consumer interest with video-heavy content:
1. MLB.com2. YouTube3. ESPN.go.com4. AOL.com5. Hulu6. CNN7. Yahoo8. Yahoo Sports9. Yahoo Finance10. Huffington Post
Together, the top 10 sites were responsible for more than 57 percent of all spend across video in Q2, capturing more than $75 million from advertisers.
Additionally, the sales activity for these purchases took place across a healthy mix of direct and indirect channels.
Who Topped Financial Services DigitalAdvertising in Q2 2016?
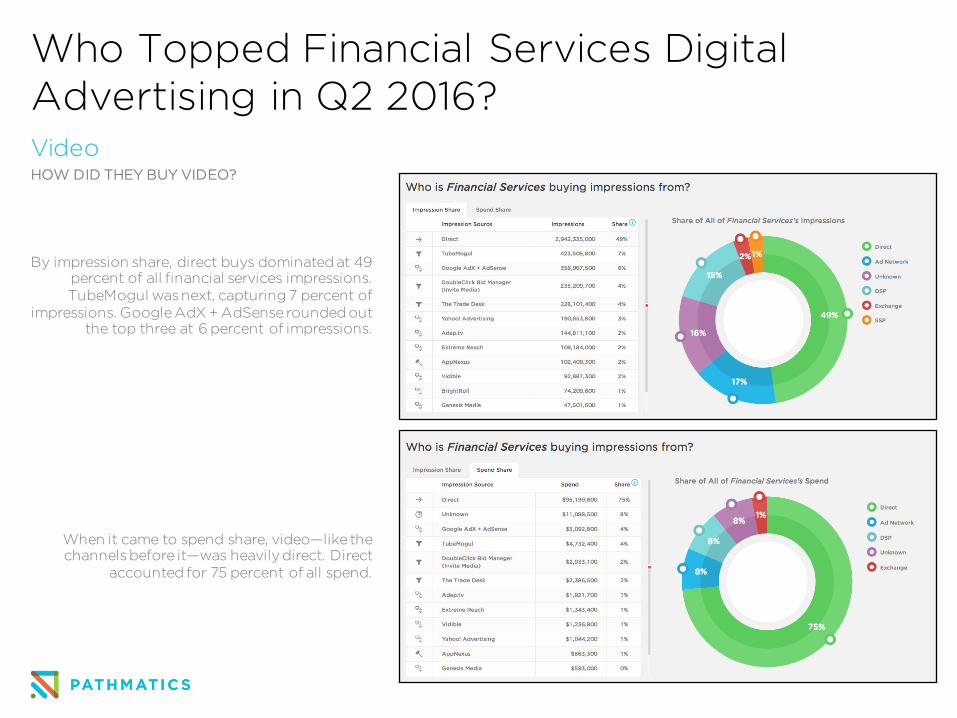
HOW DID THEY BUY VIDEO?
By impression share, direct buys dominated at 49 percent of all financial services impressions. TubeMogul was next, capturing 7 percent of
impressions. Google AdX + AdSense rounded out the top three at 6 percent of impressions.
When it came to spend share, video—like the channels before it—was heavily direct. Direct
accounted for 75 percent of all spend.
Video
Who Topped Financial Services DigitalAdvertising in Q2 2016?ContentTOP 10 CONTENT ADVERTISERS
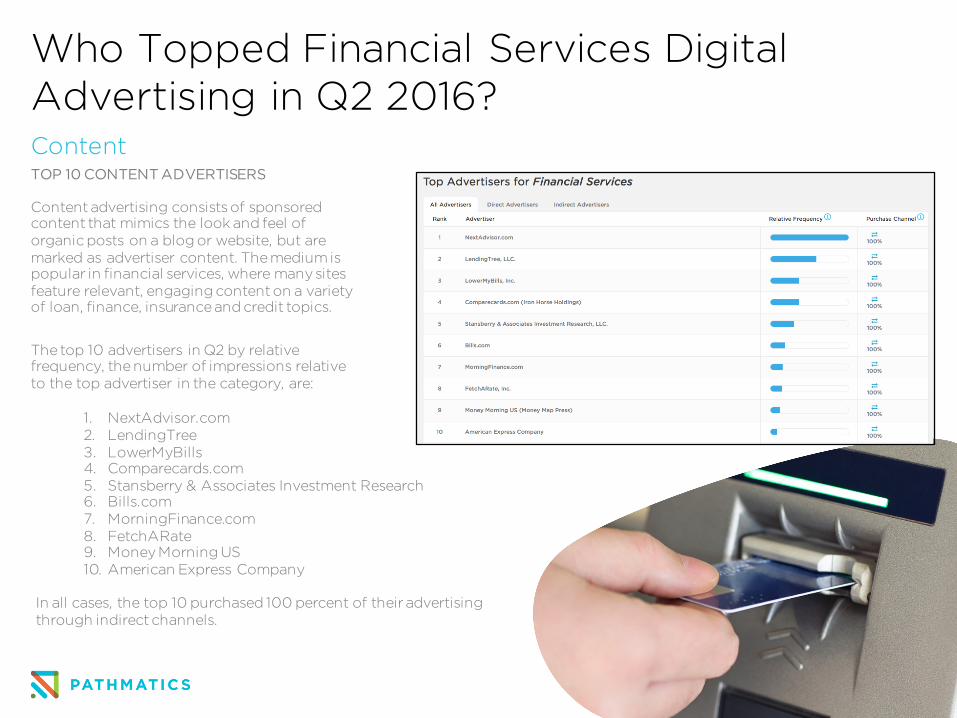
Content advertising consists of sponsored content that mimics the look and feel of organic posts on a blog or website, but are marked as advertiser content. The medium is popular in financial services, where many sites feature relevant, engaging content on a variety of loan, finance, insurance and credit topics.
1. NextAdvisor.com2. LendingTree3. LowerMyBills4. Comparecards.com5. Stansberry & Associates Investment Research6. Bills.com7. MorningFinance.com8. FetchARate9. Money Morning US10. American Express Company
In all cases, the top 10 purchased 100 percent of their advertising through indirect channels.
The top 10 advertisers in Q2 by relative frequency, the number of impressions relative to the top advertiser in the category, are:
Who Topped Financial Services DigitalAdvertising in Q2 2016?ContentTOP 10 SITES FOR CONTENT ADVERTISERS
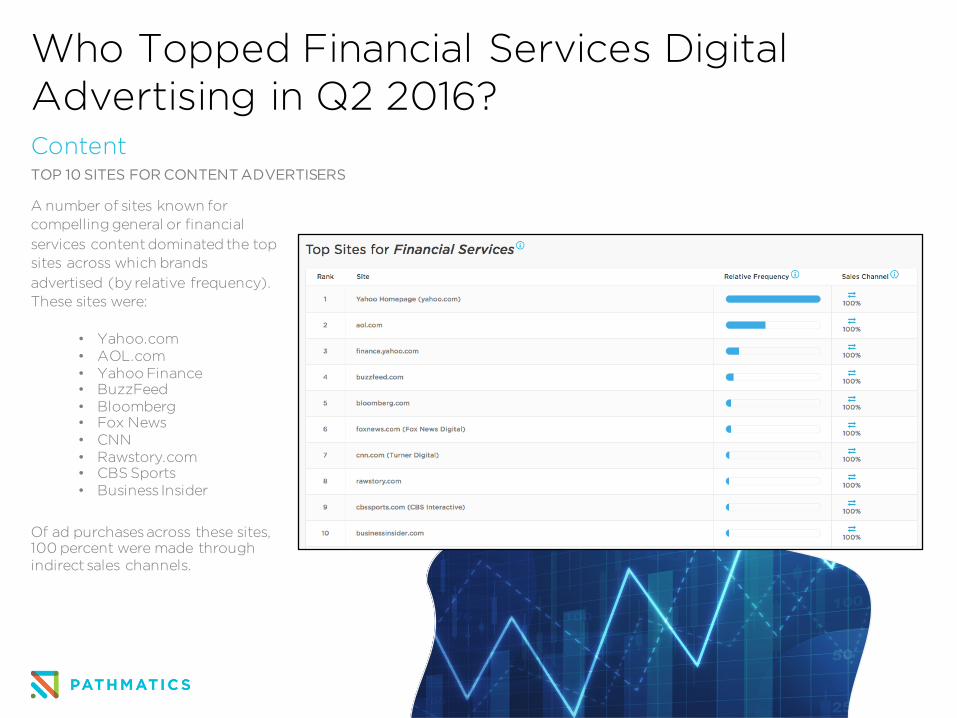
A number of sites known for compelling general or financial services content dominated the top sites across which brands advertised (by relative frequency). These sites were:
• Yahoo.com• AOL.com• Yahoo Finance• BuzzFeed• Bloomberg• Fox News• CNN• Rawstory.com• CBS Sports• Business Insider
Of ad purchases across these sites, 100 percent were made through indirect sales channels.
Who Topped Financial Services DigitalAdvertising in Q2 2016?ContentTOP PURCHASE CHANNELS FOR CONTENT ADVERTISERS
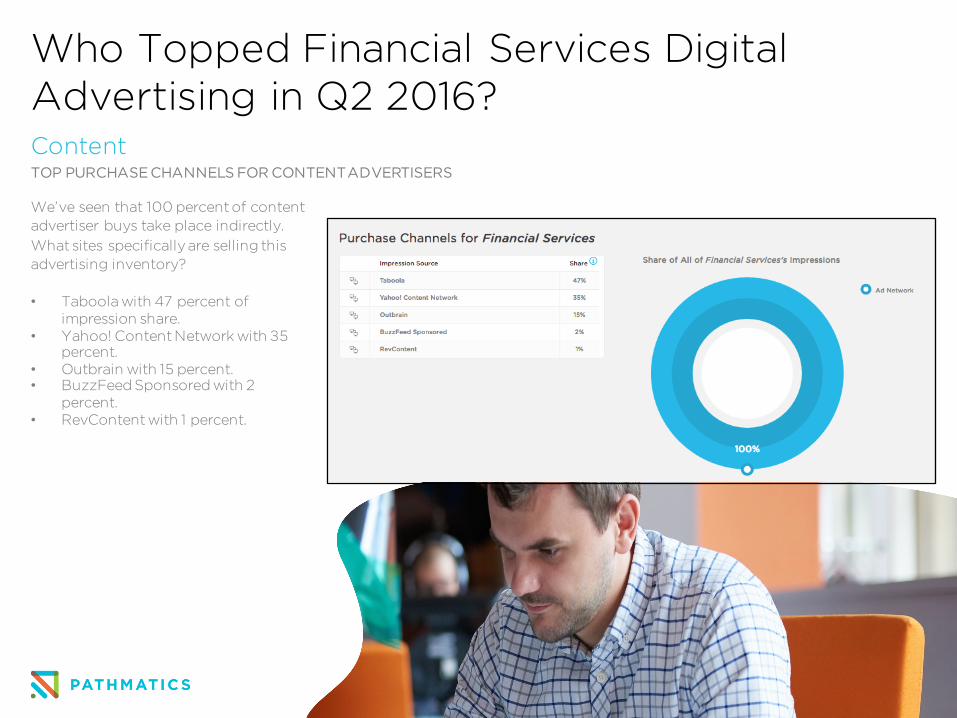
We’ve seen that 100 percent of content advertiser buys take place indirectly. What sites specifically are selling this advertising inventory?
• Taboola with 47 percent of impression share.
• Yahoo! Content Network with 35 percent.
• Outbrain with 15 percent.• BuzzFeed Sponsored with 2
percent.• RevContentwith 1 percent.
Top Financial Services Digital AdvertisersTHE HIGHEST IMPRESSIONS AND SPENDERS ACROSS DESKTOP, MOBILE, VIDEO AND CONTENT
Financial Services Creatives in Q2 2016
The Pathmatics ad intelligence platform also analyzes the exact creatives used by the top financial services companies profiled here.
Continue exploring this report to see what ads the top 3 companies in each category used, how many creatives they ran, and how the three leaders stacked up against one another across desktop, mobile and tablet, video and content.
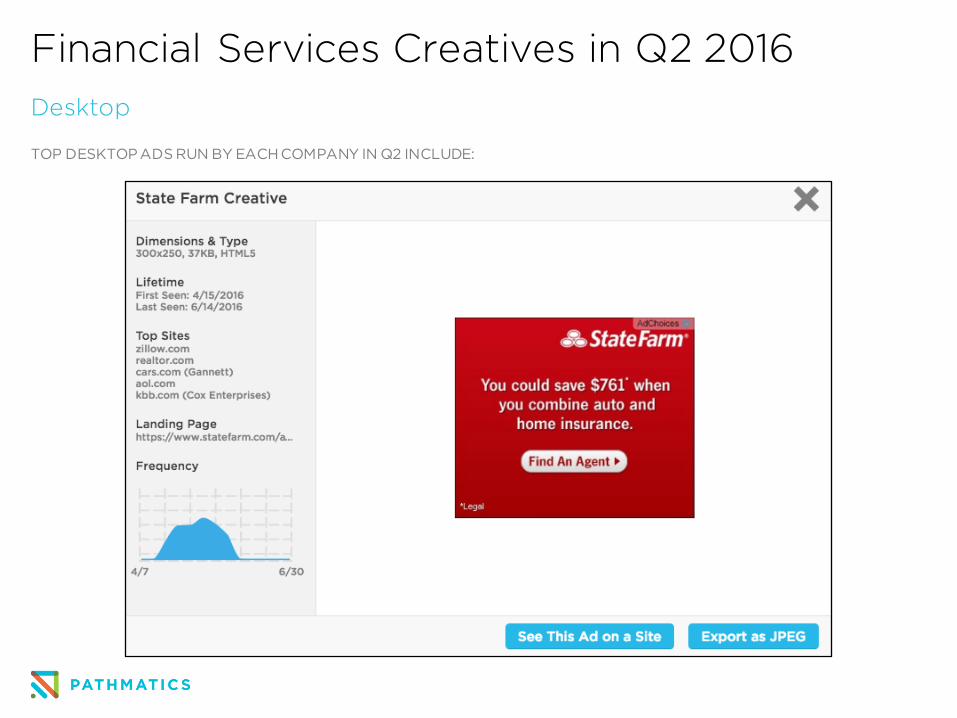
Financial Services Creatives in Q2 2016Desktop
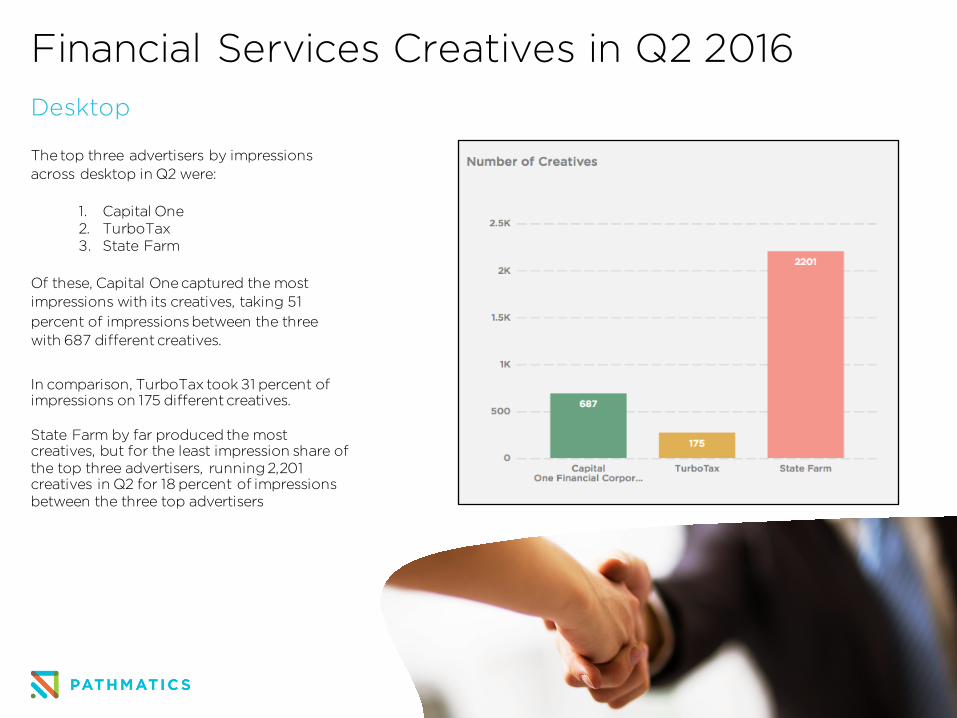
The top three advertisers by impressions across desktop in Q2 were:
1. Capital One2. TurboTax3. State Farm
Of these, Capital One captured the most impressions with its creatives, taking 51 percent of impressions between the three with 687 different creatives.
In comparison, TurboTax took 31 percent of impressions on 175 different creatives.
State Farm by far produced the most creatives, but for the least impression share of the top three advertisers, running 2,201 creatives in Q2 for 18 percent of impressions between the three top advertisers
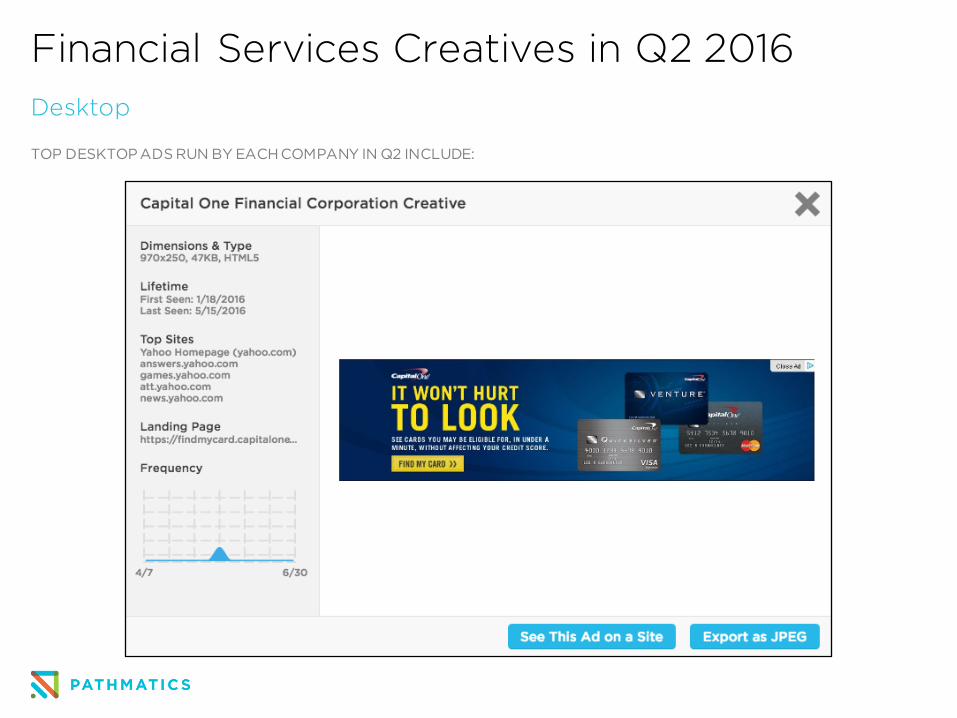
TOP DESKTOP ADS RUN BY EACH COMPANY IN Q2 INCLUDE:
Financial Services Creatives in Q2 2016Desktop
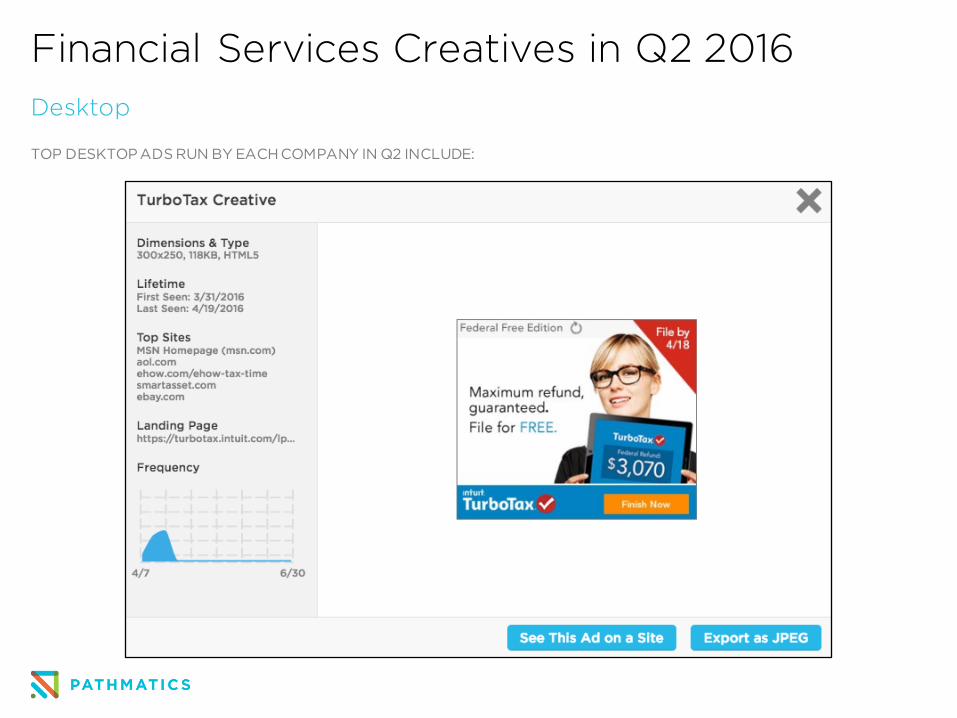
TOP DESKTOP ADS RUN BY EACH COMPANY IN Q2 INCLUDE:
Financial Services Creatives in Q2 2016Desktop
TOP DESKTOP ADS RUN BY EACH COMPANY IN Q2 INCLUDE:
Financial Services Creatives in Q2 2016Desktop
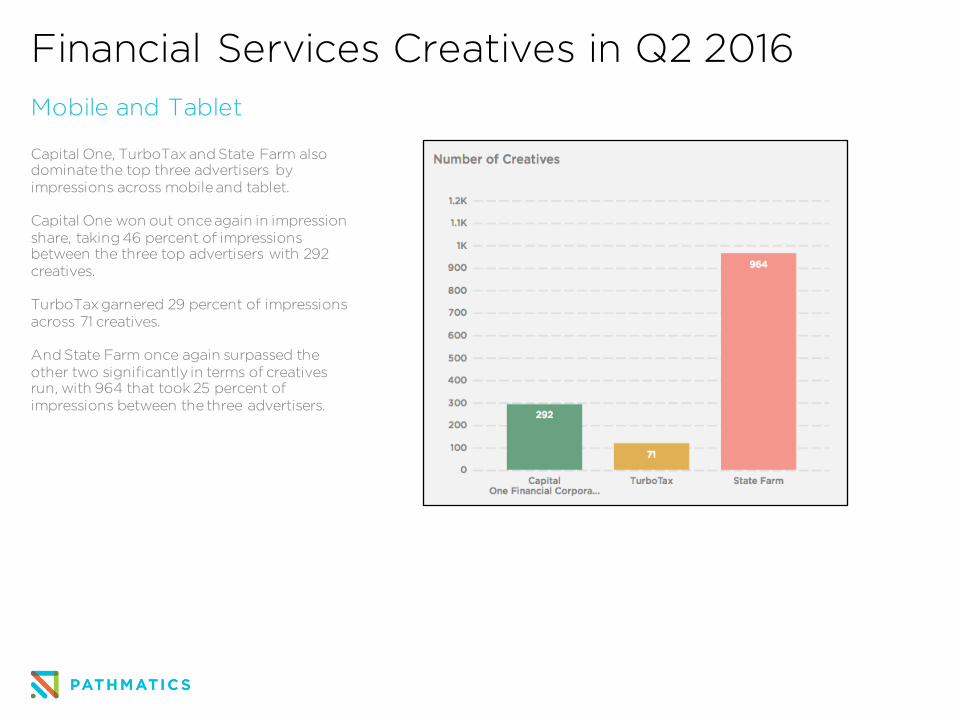
Financial Services Creatives in Q2 2016Mobile and Tablet
Capital One, TurboTax and State Farm also dominate the top three advertisers by impressions across mobile and tablet.
Capital One won out once again in impression share, taking 46 percent of impressions between the three top advertisers with 292 creatives.
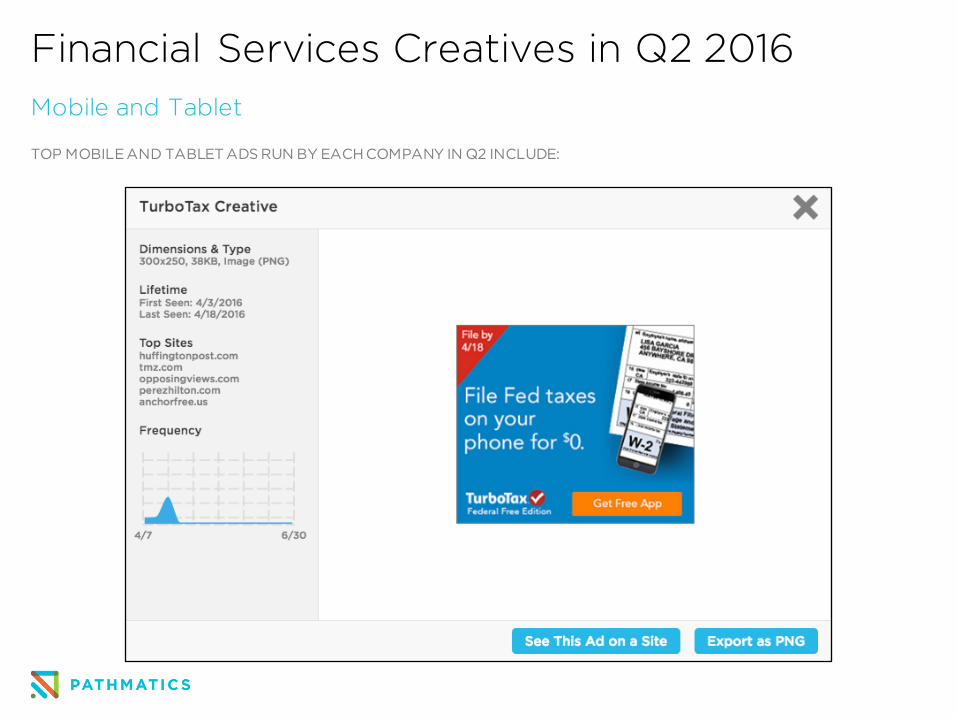
TurboTax garnered 29 percent of impressions across 71 creatives.
And State Farm once again surpassed the other two significantly in terms of creatives run, with 964 that took 25 percent of impressions between the three advertisers.
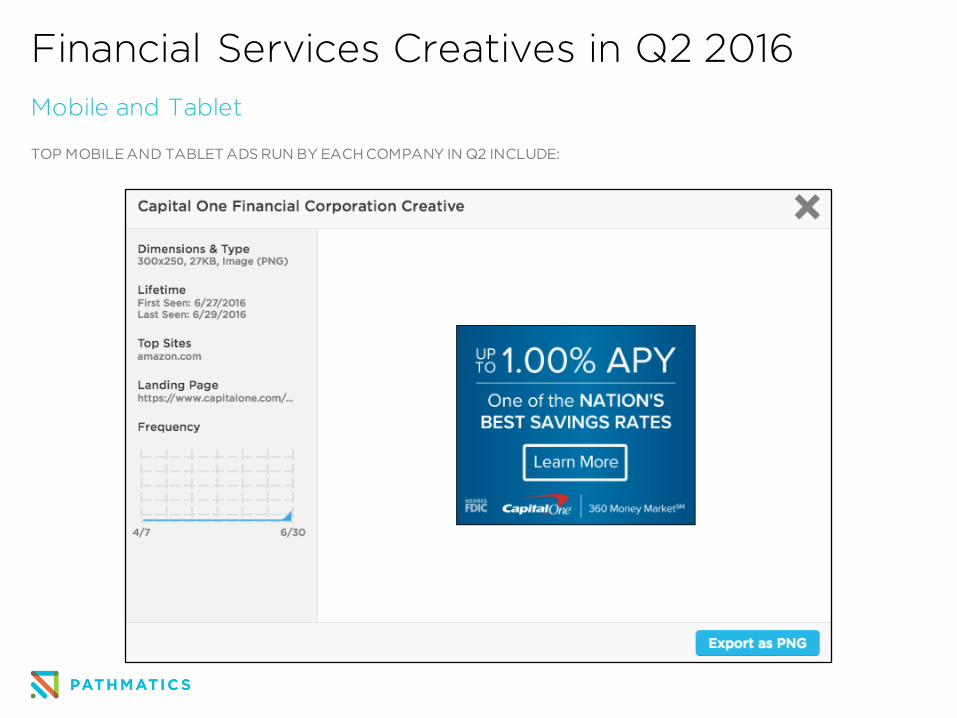
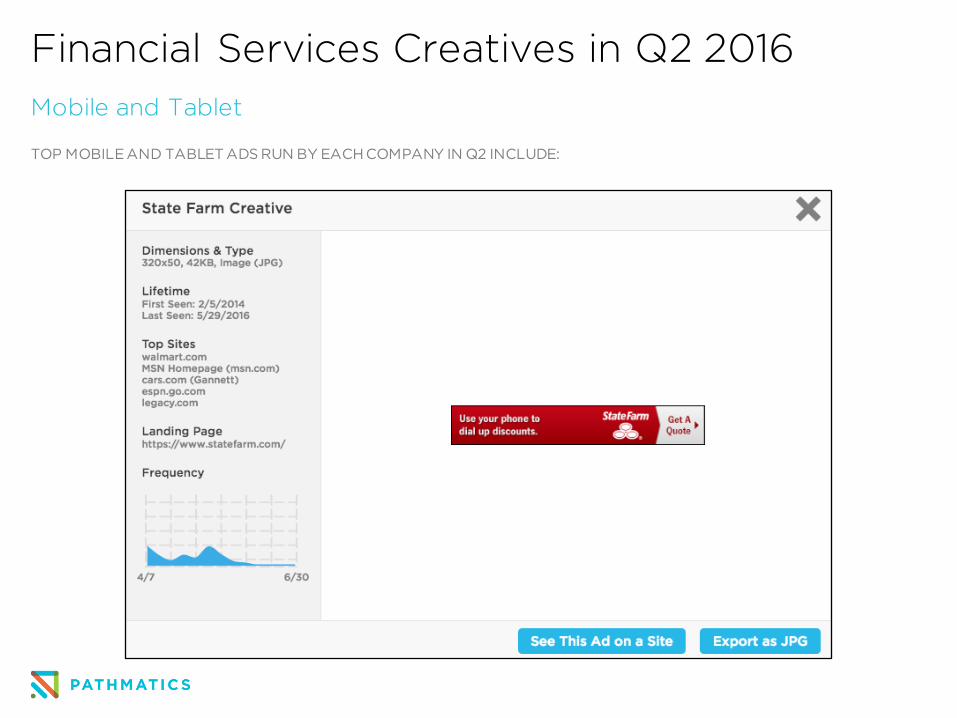
TOP MOBILE AND TABLET ADS RUN BY EACH COMPANY IN Q2 INCLUDE:
Financial Services Creatives in Q2 2016Mobile and Tablet
Financial Services Creatives in Q2 2016Mobile and Tablet
TOP MOBILE AND TABLET ADS RUN BY EACH COMPANY IN Q2 INCLUDE:
TOP MOBILE AND TABLET ADS RUN BY EACH COMPANY IN Q2 INCLUDE:
Financial Services Creatives in Q2 2016Mobile and Tablet
Financial Services Creatives in Q2 2016Video
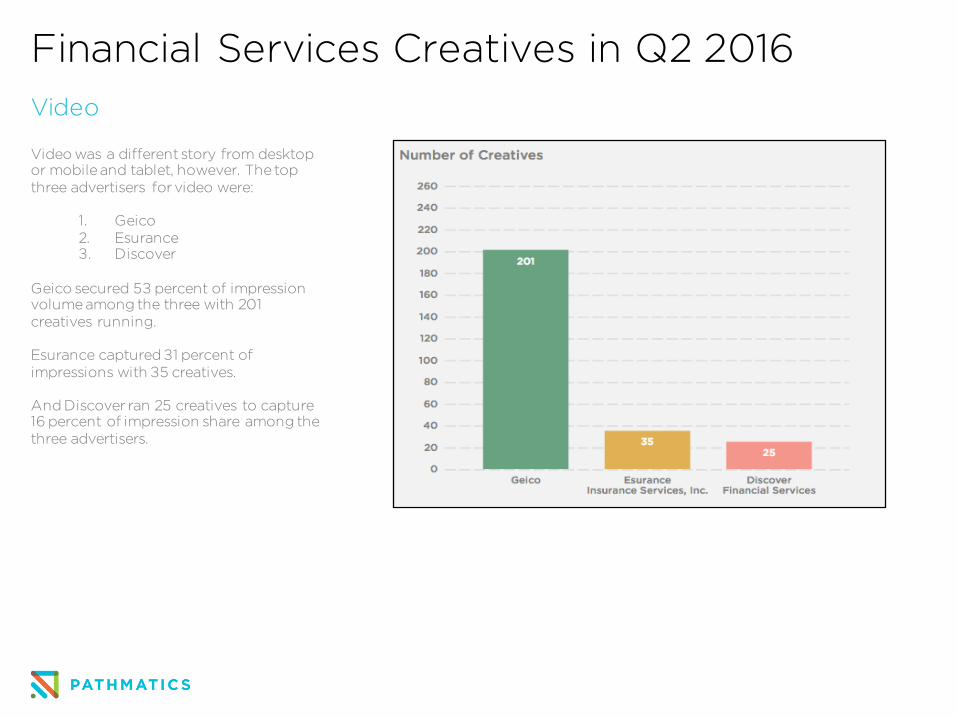
Video was a different story from desktop or mobile and tablet, however. The top three advertisers for video were:
1. Geico2. Esurance3. Discover
Geico secured 53 percent of impression volume among the three with 201 creatives running.
Esurance captured 31 percent of impressions with 35 creatives.
And Discover ran 25 creatives to capture 16 percent of impression share among the three advertisers.
Financial Services Creatives in Q2 2016Video
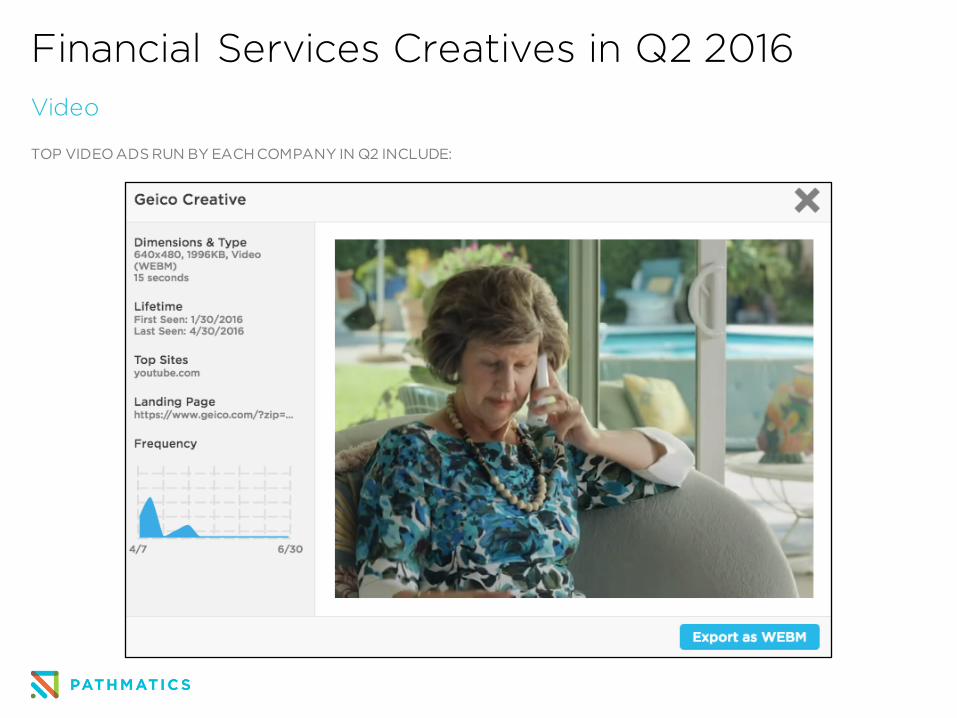
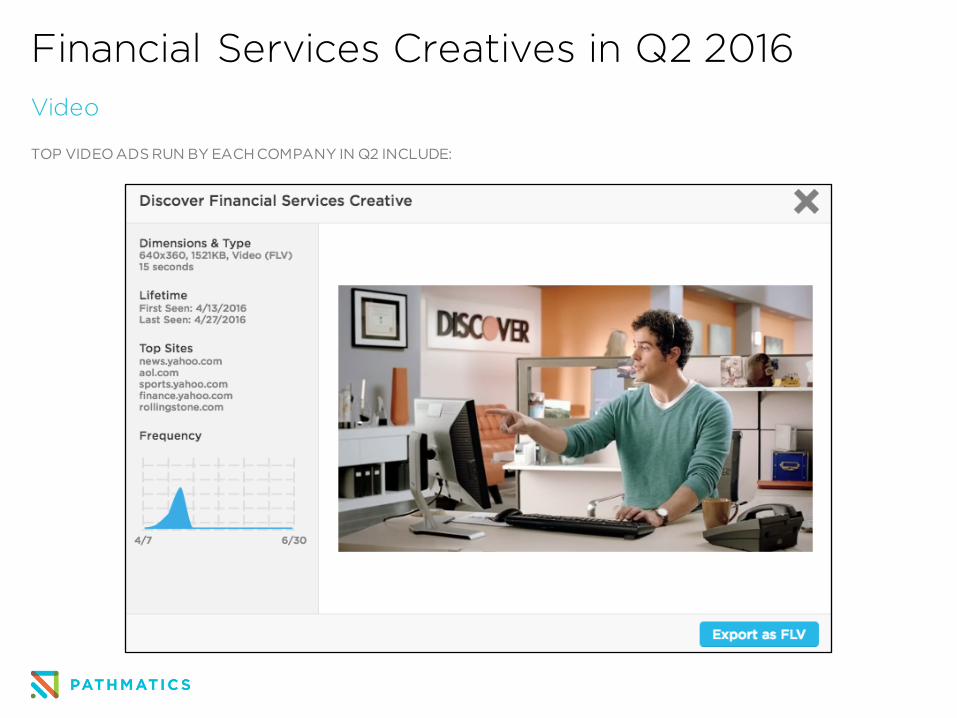
TOP VIDEO ADS RUN BY EACH COMPANY IN Q2 INCLUDE:
Financial Services Creatives in Q2 2016Video
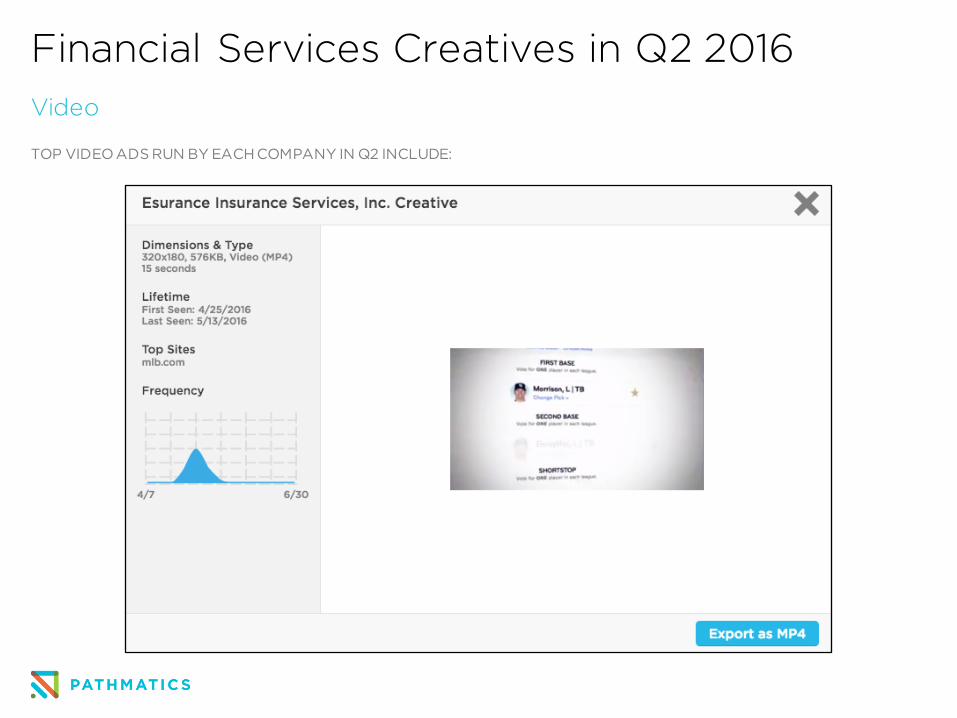
TOP VIDEO ADS RUN BY EACH COMPANY IN Q2 INCLUDE:
Financial Services Creatives in Q2 2016Video
TOP VIDEO ADS RUN BY EACH COMPANY IN Q2 INCLUDE:
Financial Services Creatives in Q2 2016Content
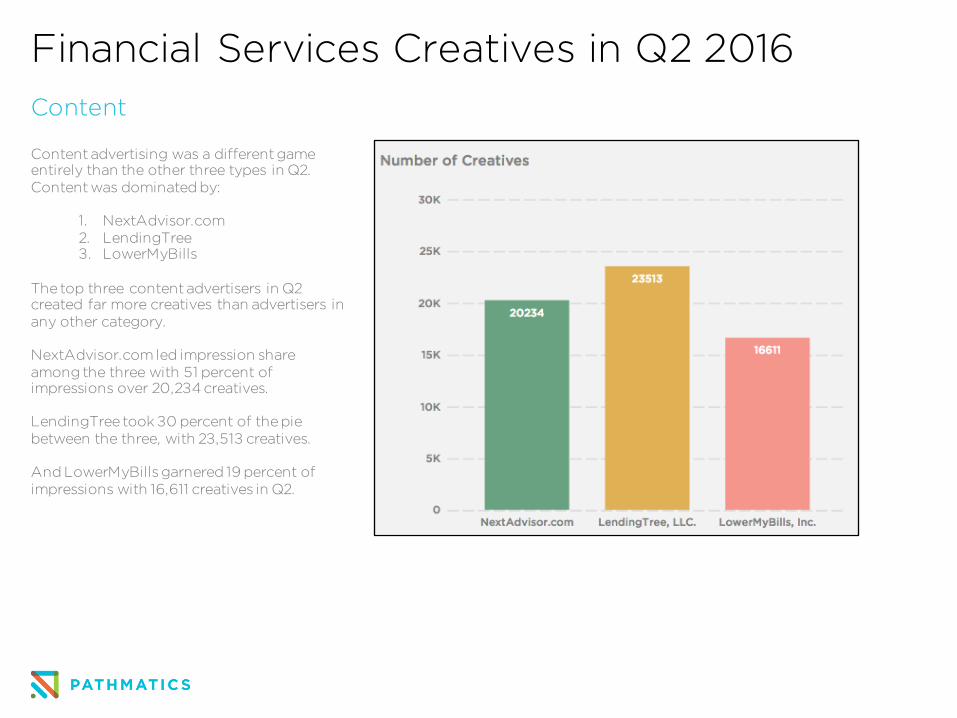
Content advertising was a different game entirely than the other three types in Q2. Content was dominated by:
1. NextAdvisor.com2. LendingTree3. LowerMyBills
The top three content advertisers in Q2 created far more creatives than advertisers in any other category.
NextAdvisor.com led impression share among the three with 51 percent of impressions over 20,234 creatives.
LendingTree took 30 percent of the pie between the three, with 23,513 creatives.
And LowerMyBillsgarnered 19 percent of impressions with 16,611 creatives in Q2.
Financial Services Creatives in Q2 2016Content
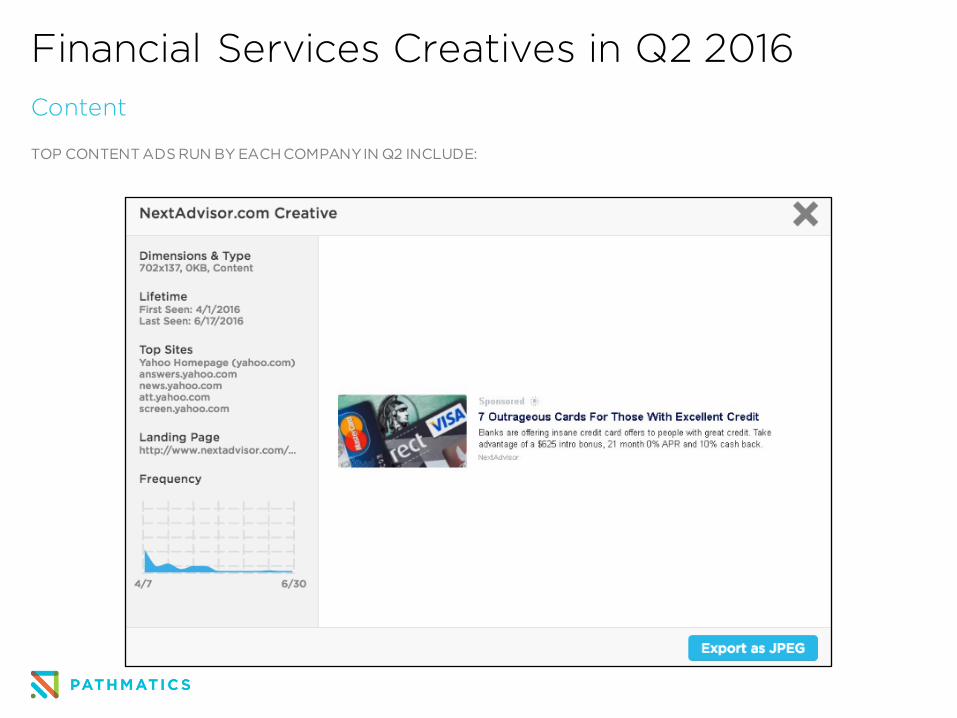
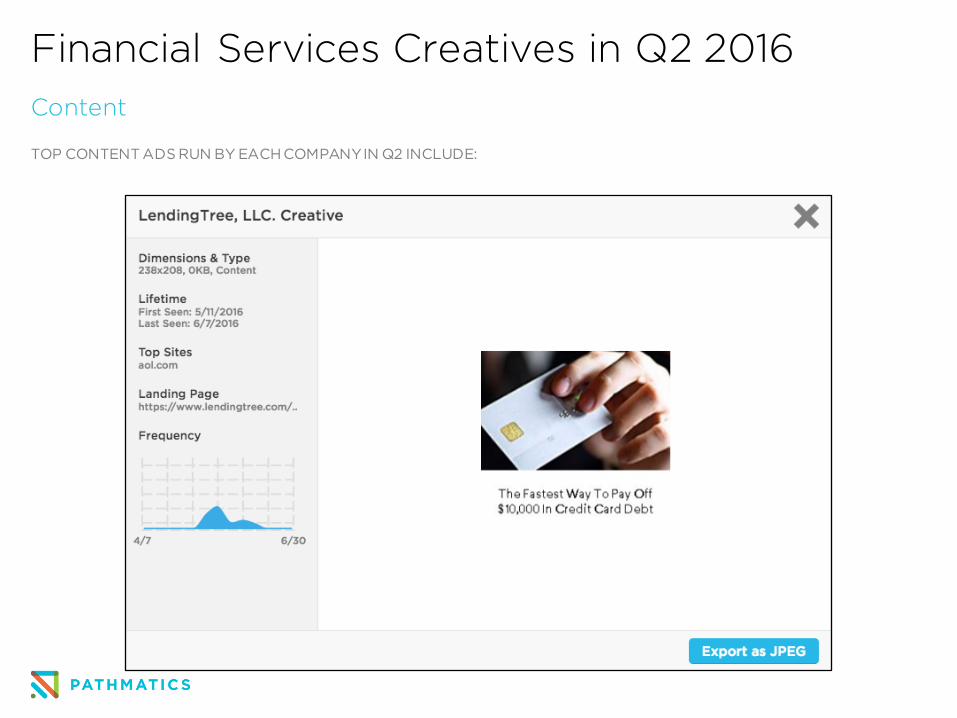
TOP CONTENT ADS RUN BY EACH COMPANY IN Q2 INCLUDE:
Financial Services Creatives in Q2 2016Content
TOP CONTENT ADS RUN BY EACH COMPANY IN Q2 INCLUDE:
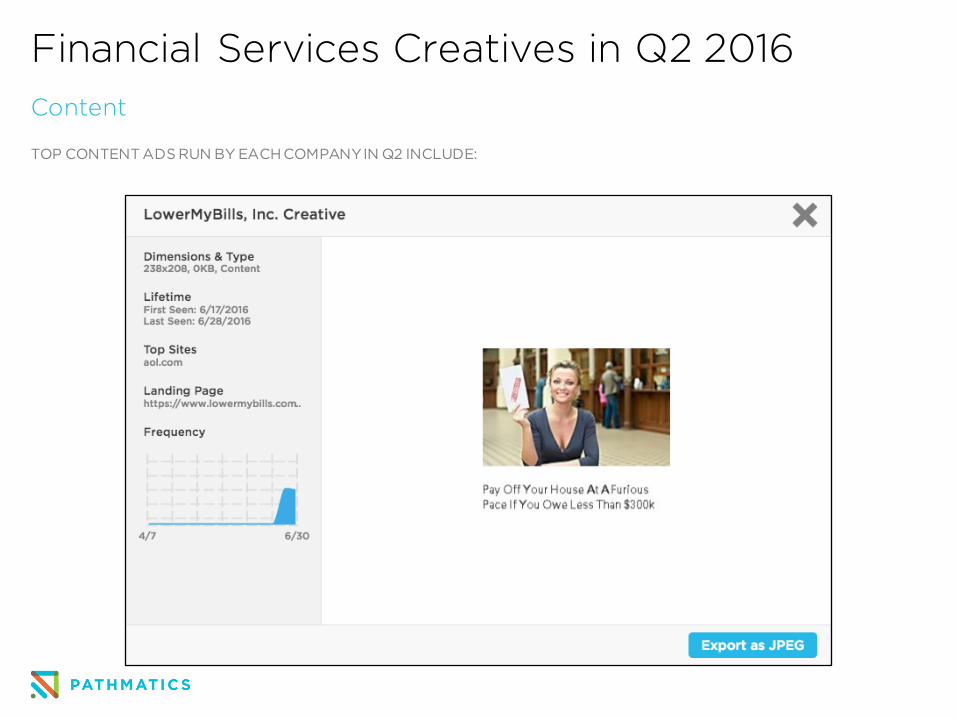
Financial Services Creatives in Q2 2016Content
TOP CONTENT ADS RUN BY EACH COMPANY IN Q2 INCLUDE:
How to Use This Financial Services Datafor Your Digital Ad Strategy
We’ve seen how the right ad intelligence can tell financial services companies exactly what their competitors and partners are doing across desktop, mobile and tablet, video and content. Now, see what having full access to this data can do for you—schedule a Pathmatics demo.
Pathmatics powers both the buy and sell side to help you make more confident, data-driven decisions using real-time insights.
Spend and Impression Data● Access desktop, mobile and tablet, video and content data.
Real-Time Data● Available within 24 hours of flight.
Programmatic Transparency● From placement to availability.
U.S. and International Tracking● U.S, U.K., Canada, Australia, United Kingdom, and Germany.
Schedule a free demo today to start looking into the digital advertising playbook of your competitors using Pathmatics’ proprietary ad intelligence.