Embed Size (px)
Citation preview
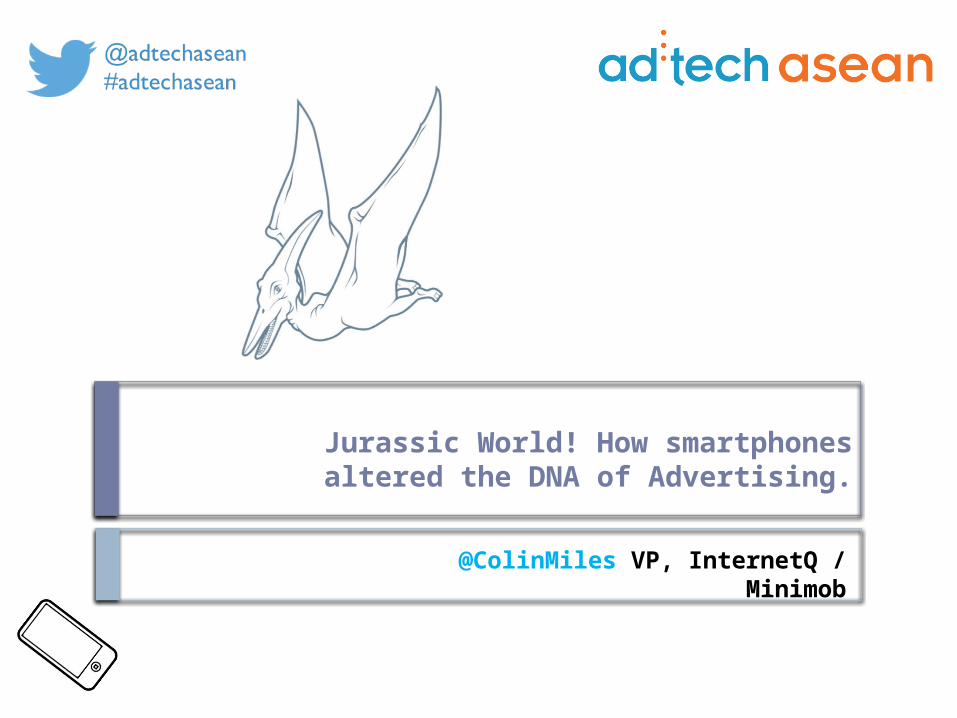
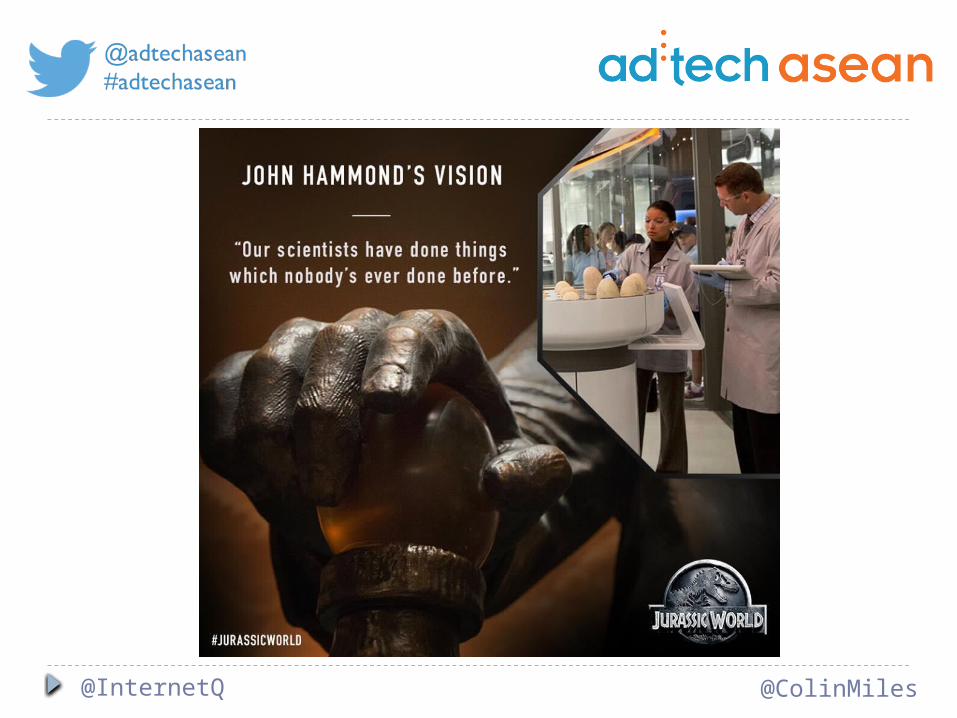
Jurassic World! How smartphones altered the DNA of Advertising.
@ColinMiles VP, InternetQ / Minimob
@InternetQ @ColinMiles
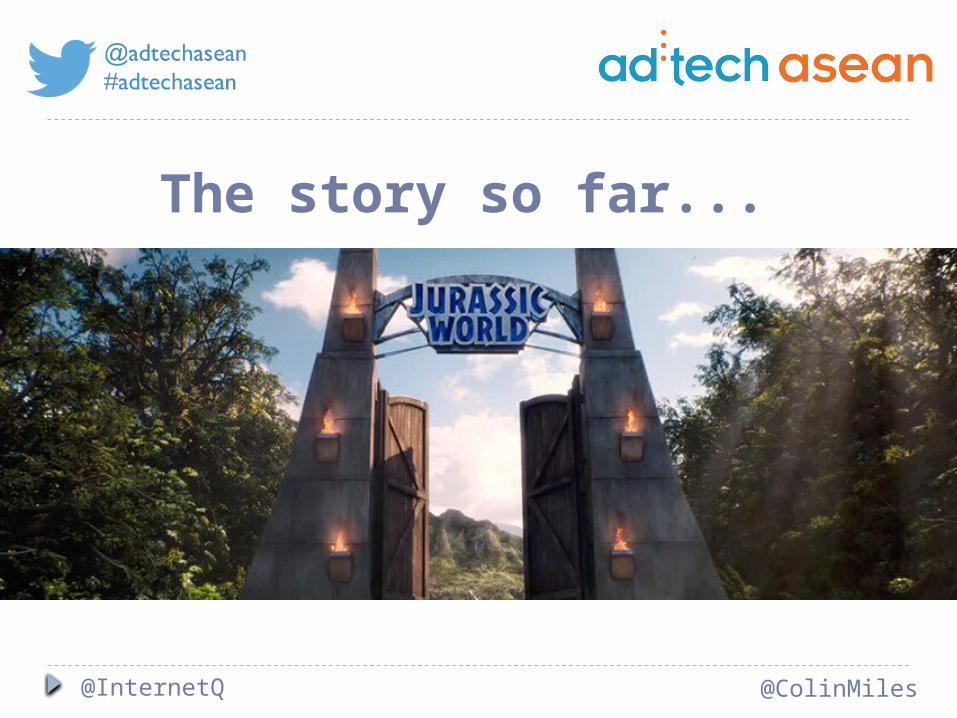
The story so far...
@InternetQ @ColinMiles
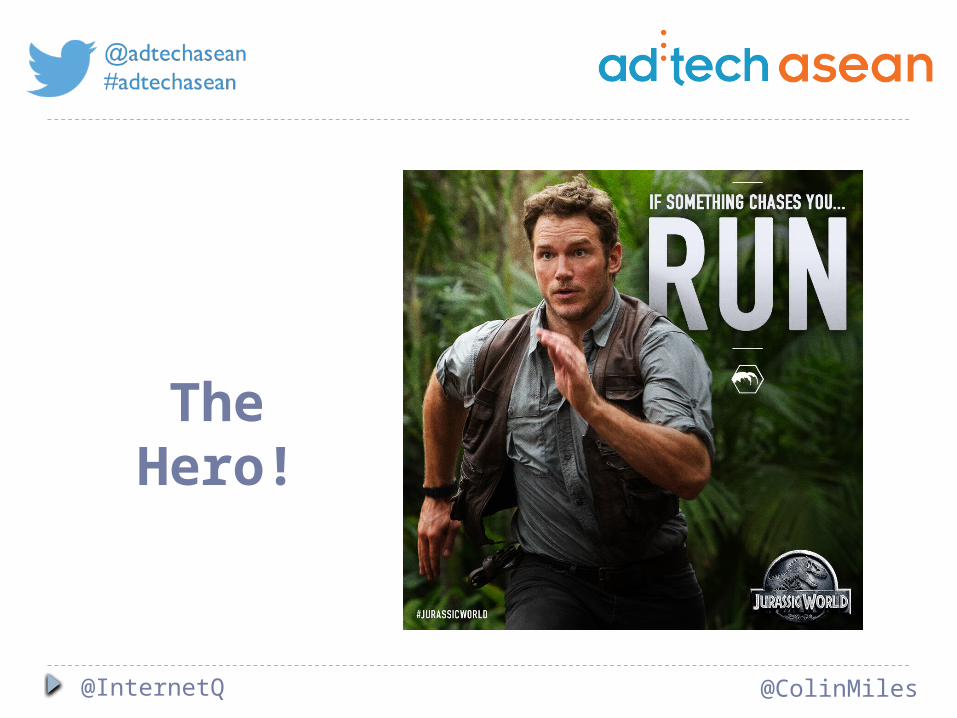
The Hero!
@InternetQ @ColinMiles
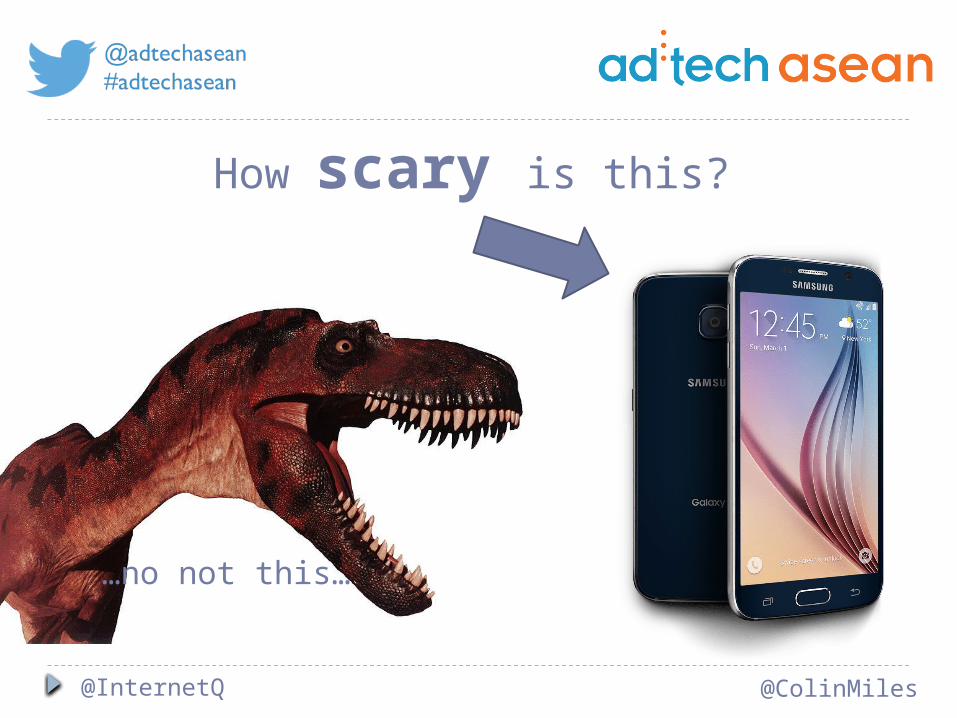
How scary is this?
…no not this…
@InternetQ @ColinMiles
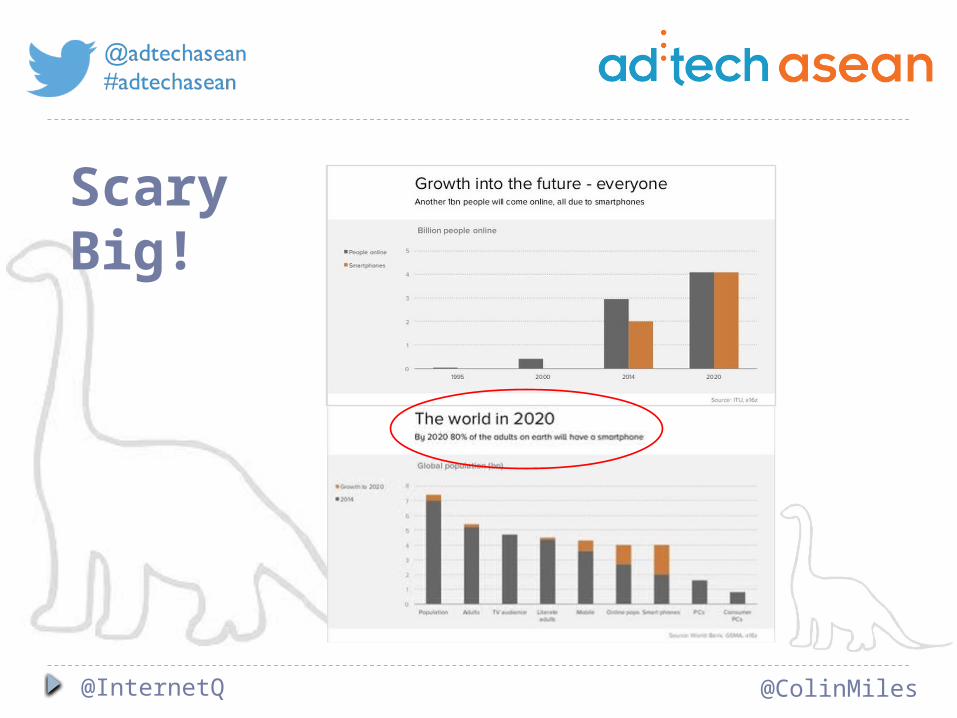
Scary Big!
@InternetQ @ColinMiles
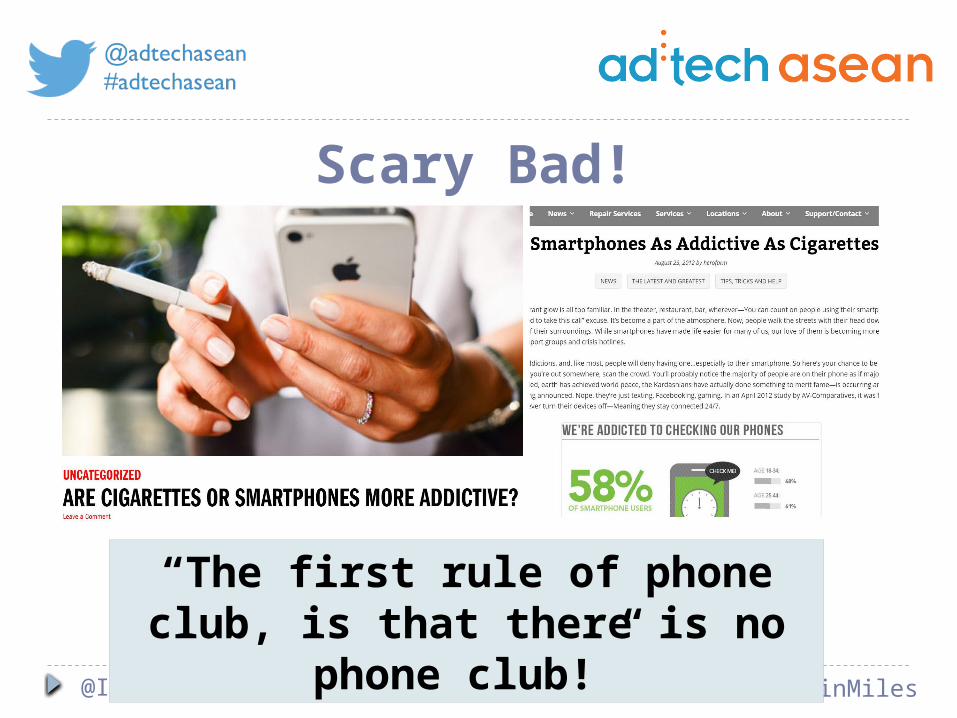
Scary Bad!
“The first rule of phone club, is that there is no
phone club!”
@InternetQ @ColinMiles
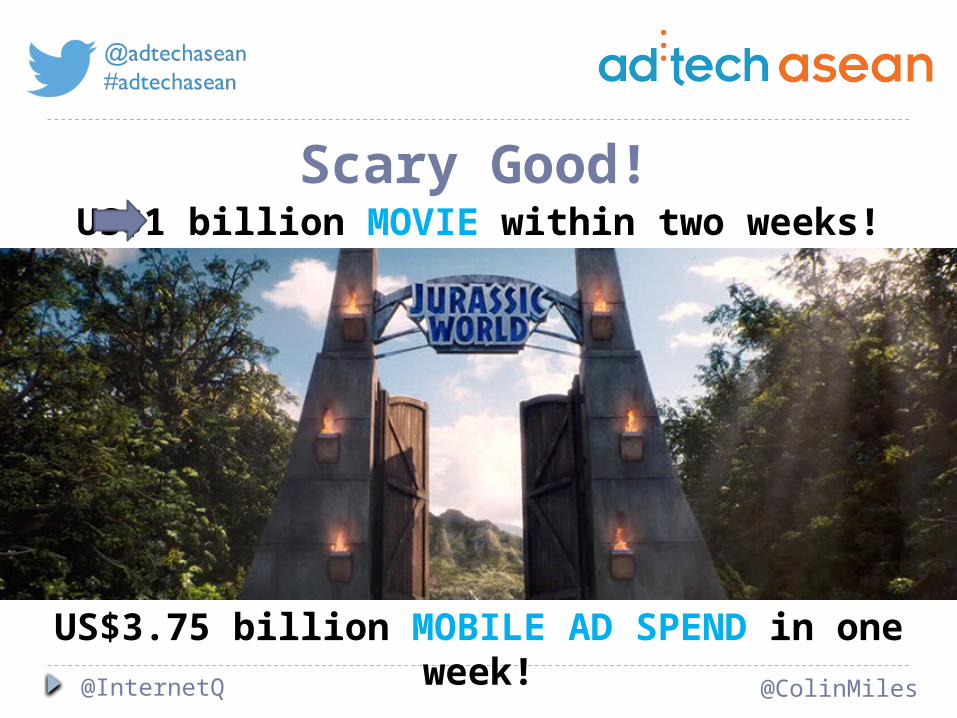
US$1 billion MOVIE within two weeks!
US$3.75 billion MOBILE AD SPEND in one week!
Scary Good!
@InternetQ @ColinMiles
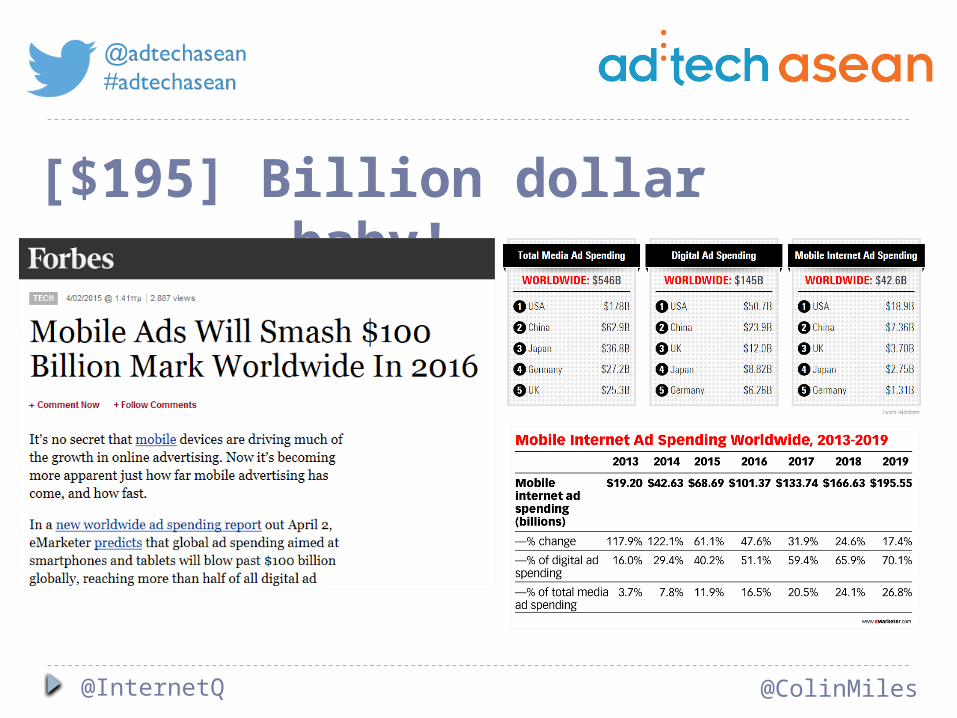
[$195] Billion dollar baby!
@InternetQ @ColinMiles
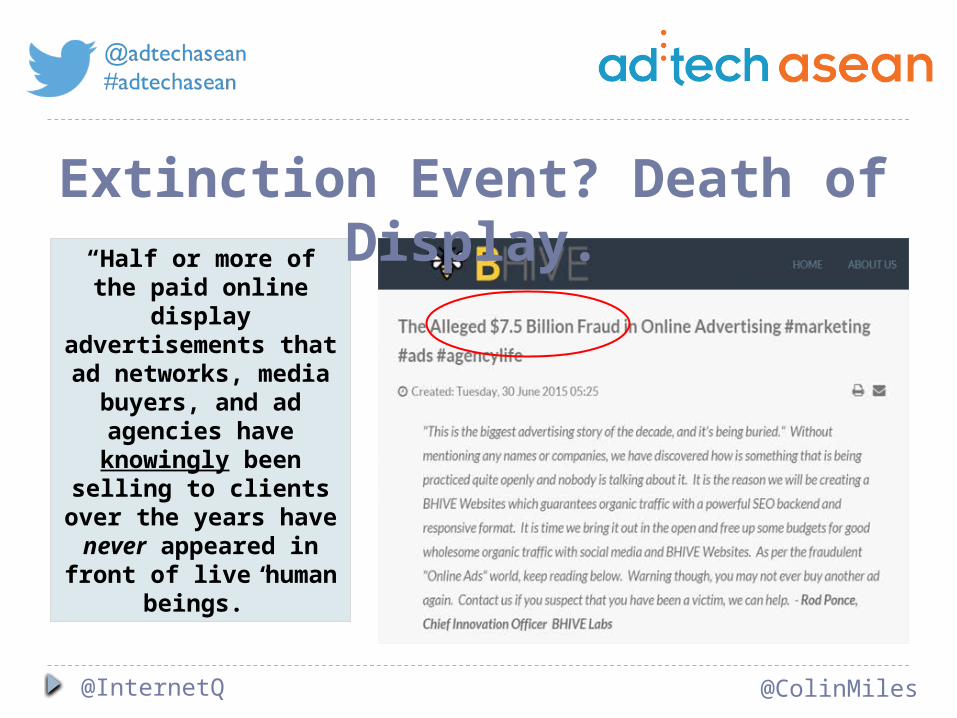
“Half or more of the paid online display
advertisements that ad networks, media
buyers, and ad agencies have
knowingly been selling to clients
over the years have never appeared in front of live human
beings.”
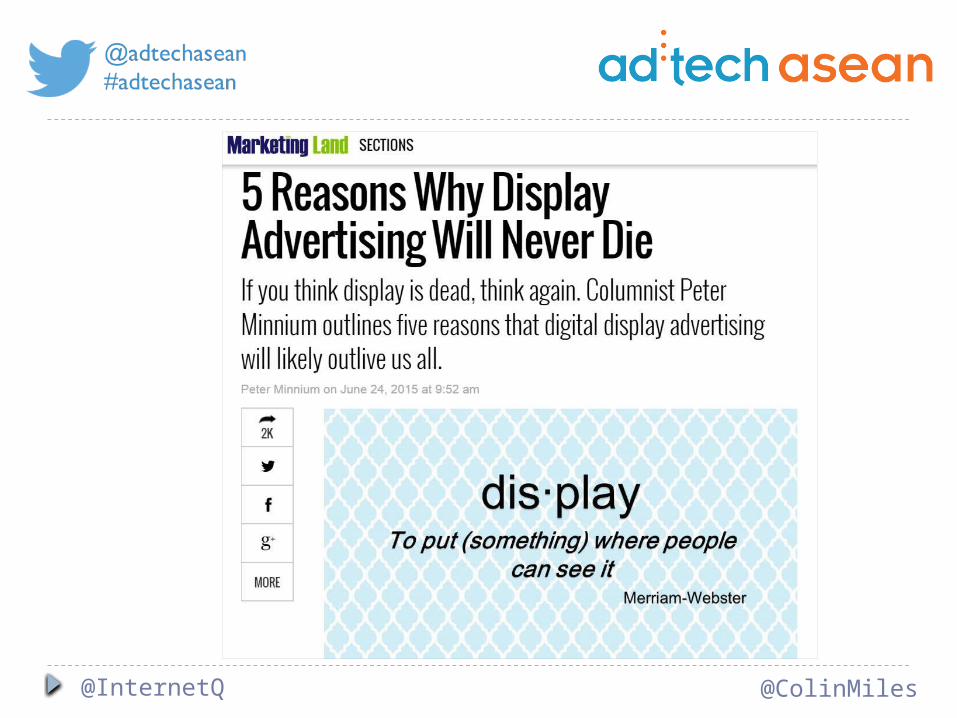
Extinction Event? Death of Display.
@InternetQ @ColinMiles
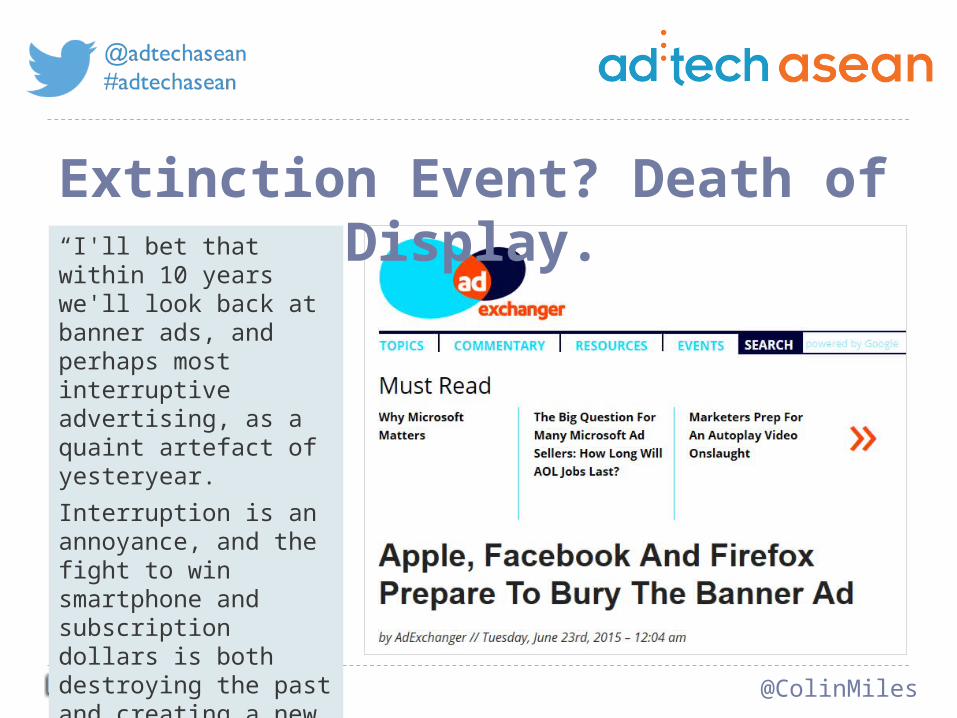
“I'll bet that within 10 years we'll look back at banner ads, and perhaps most interruptive advertising, as a quaint artefact of yesteryear.
Interruption is an annoyance, and the fight to win smartphone and subscription dollars is both destroying the past and creating a new future.
I can't wait.” Bob Gilbreath, co-founder and president of Ahalogy.
Extinction Event? Death of Display.
@InternetQ @ColinMiles
@InternetQ @ColinMiles
@InternetQ @ColinMiles
@InternetQ @ColinMiles
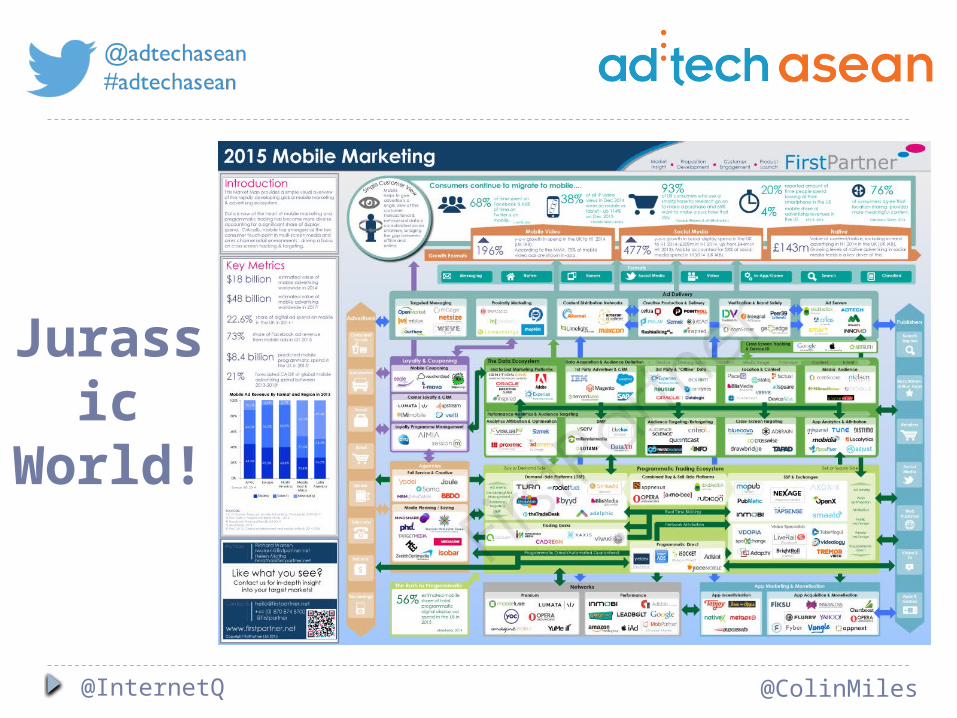
Jurassic
World!
@InternetQ @ColinMiles
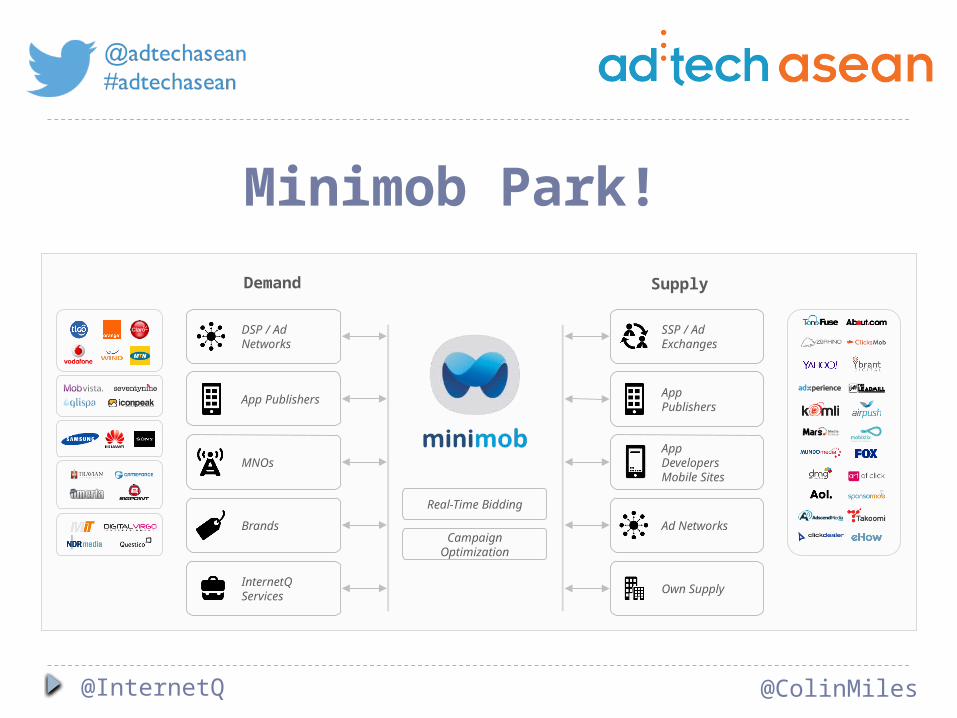
Minimob Park!
Demand Supply
DSP / Ad Networks
App Publishers
MNOs
Brands
InternetQ Services
SSP / Ad Exchanges
App Publishers
App DevelopersMobile Sites
Ad Networks
Own Supply
Real-Time Bidding
Campaign Optimization
@InternetQ @ColinMiles
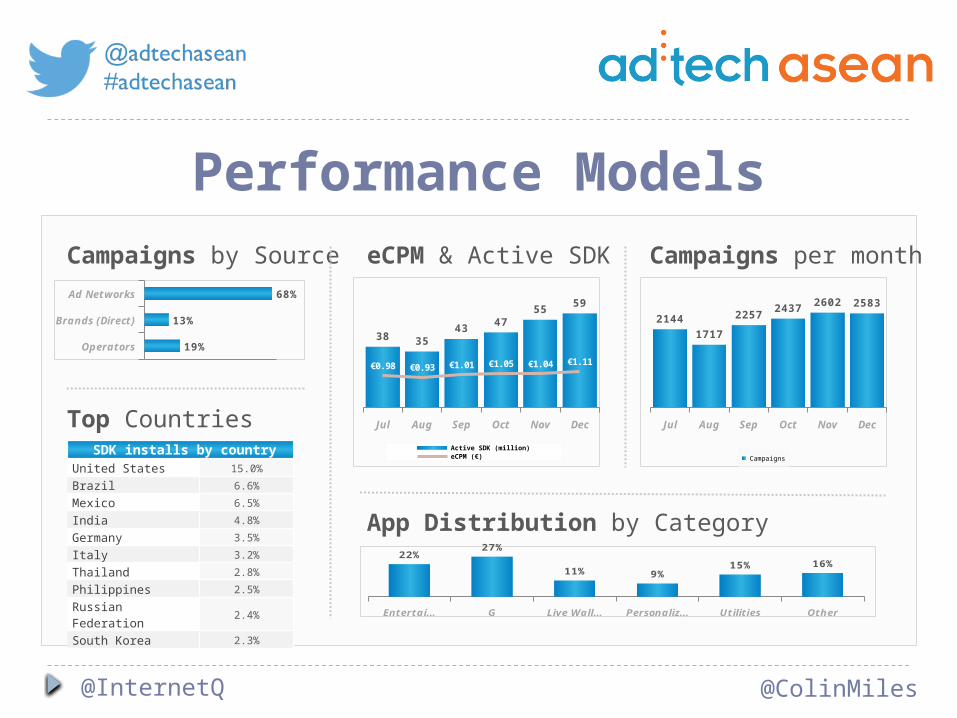
SDK installs by countryUnited States 15.0%
Brazil 6.6%
Mexico 6.5%
India 4.8%
Germany 3.5%
Italy 3.2%
Thailand 2.8%
Philippines 2.5%
Russian Federation 2.4%
South Korea 2.3%
Campaigns by Source
Top Countries
22%
27%
11% 9%
15%
16%
App Distribution by Category
Jul Aug Sep Oct Nov Dec
38 3543
4755
59
€0.98 €0.93 €1.01 €1.05 €1.04 €1.11
Active SDK (million)eCPM (€)
eCPM & Active SDK
Operators
Brands (Direct)
Ad Networks
19%
13%
68%
Campaigns per month
Jul Aug Sep Oct Nov Dec
2144
1717
22572437 2602 2583
Campaigns
Performance Models
@InternetQ @ColinMiles
@InternetQ @ColinMiles
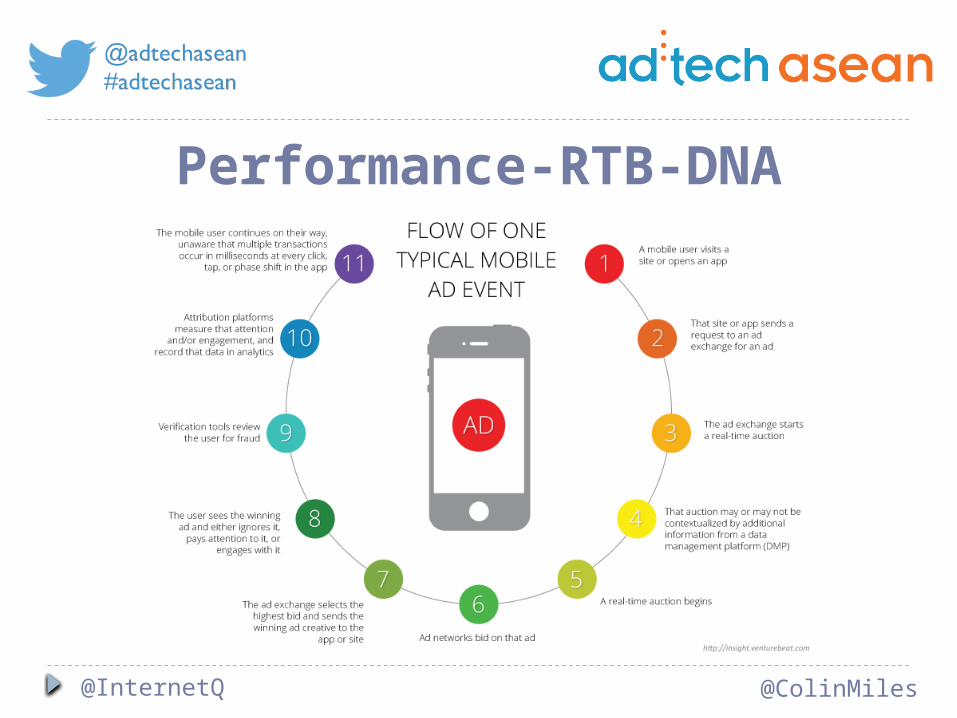
Performance-RTB-DNA
@InternetQ @ColinMiles
@InternetQ @ColinMiles
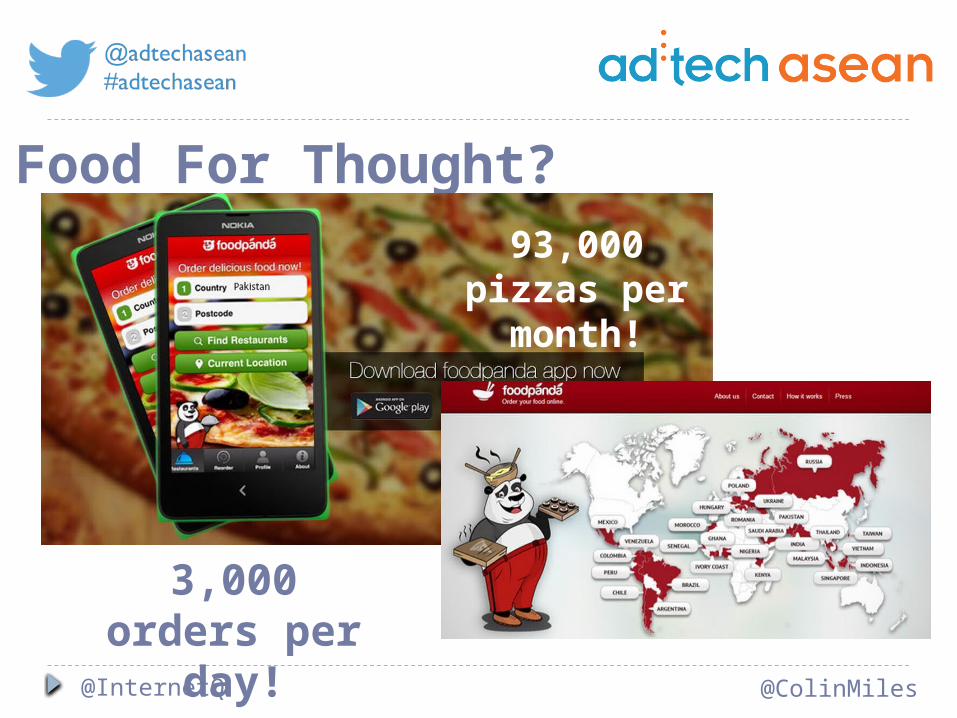
Food For Thought?
3,000 orders per
day!
93,000 pizzas per
month!
@InternetQ @ColinMiles
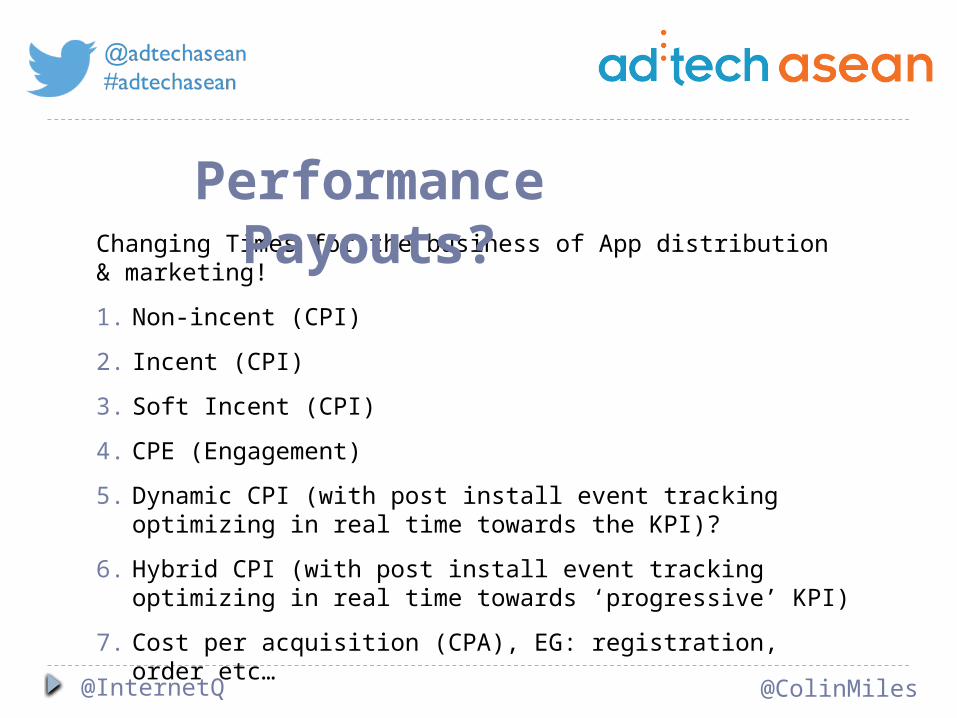
Changing Times for the business of App distribution & marketing!
1. Non-incent (CPI)
2. Incent (CPI)
3. Soft Incent (CPI)
4. CPE (Engagement)
5. Dynamic CPI (with post install event tracking optimizing in real time towards the KPI)?
6. Hybrid CPI (with post install event tracking optimizing in real time towards ‘progressive’ KPI)
7. Cost per acquisition (CPA), EG: registration, order etc…
Performance Payouts?
@InternetQ @ColinMiles
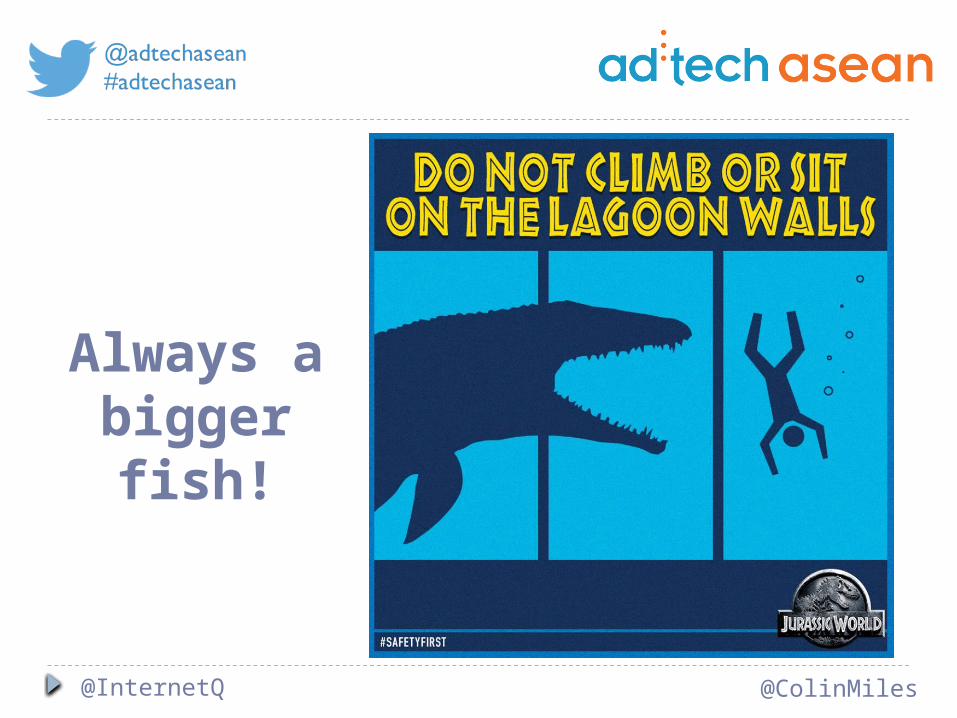
Always a bigger fish!
@InternetQ @ColinMiles
Welcome!
(Behind You!)