Embed Size (px)
Citation preview
Hartford Police Department
2008YEAR END REPORT
JANUARY 1, 2008 - December 31, 2008
\
Service - Relationships - Safety
CITY OF HARTFORD POLICE DEPARTMENT -- DARYL K. ROBERTS, CHIEF OF POLICE
11,000
12,000
13,000
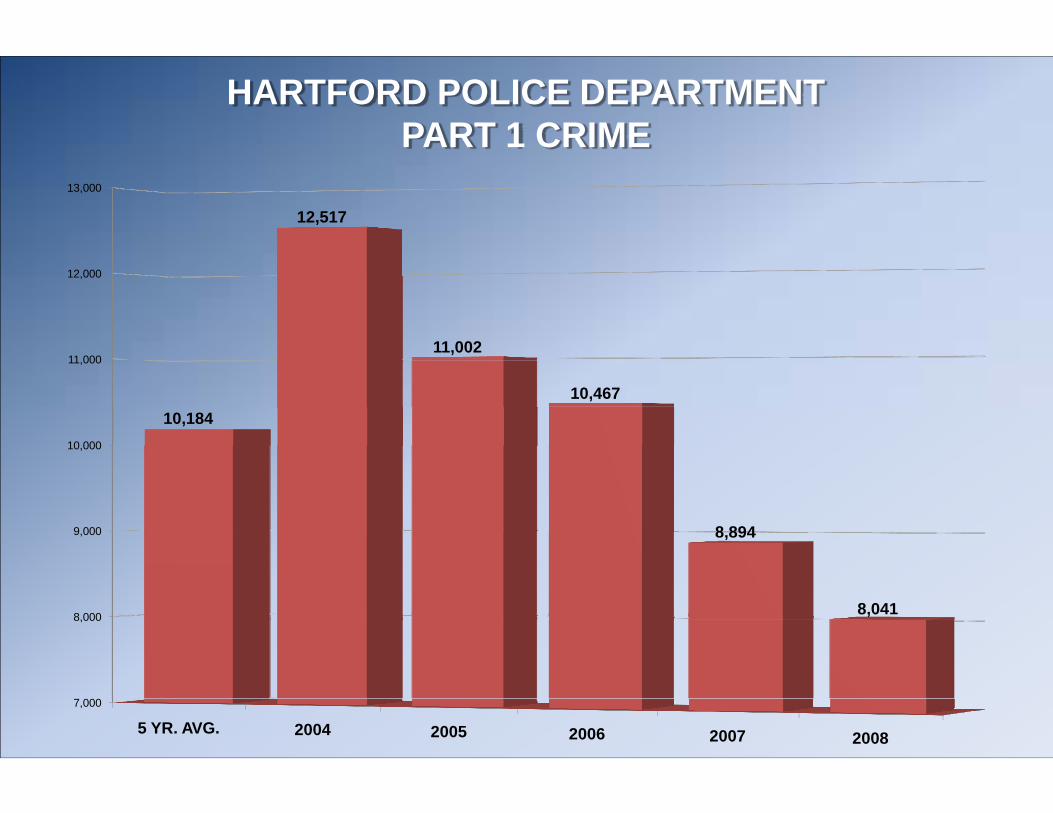
12,517
11,002
10,467
HARTFORD POLICE DEPARTMENTPART 1 CRIME
7,000
8,000
9,000
10,000
5 YR. AVG. 2004 2005 2006 2007 2008
10,184
8,894
8,041
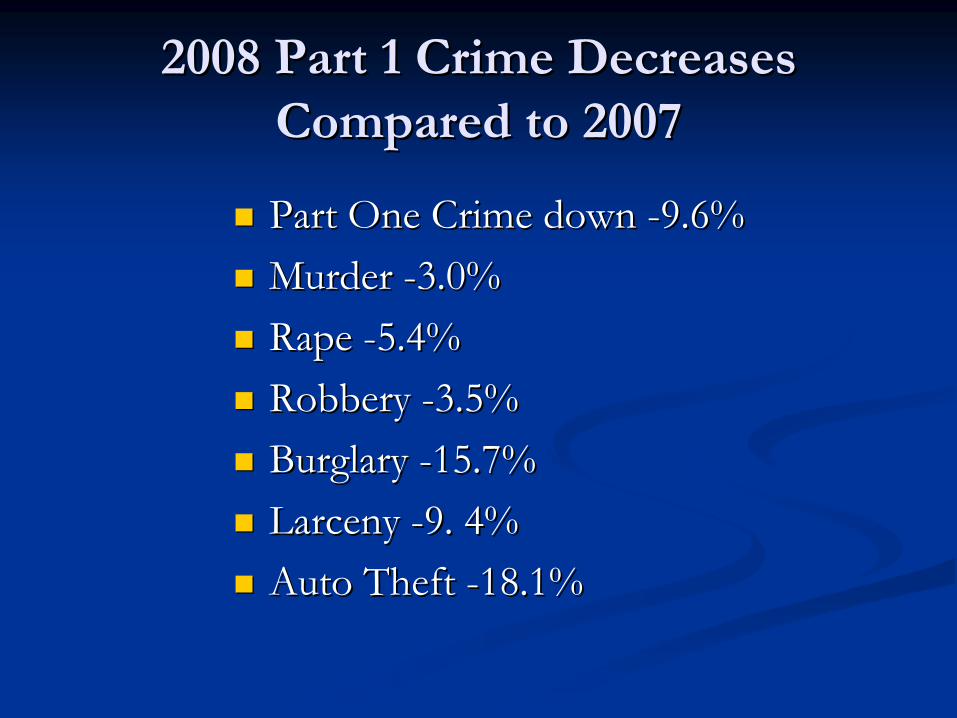
2008 Part 1 Crime Decreases 2008 Part 1 Crime Decreases Compared to 2007Compared to 2007
Part One Crime down Part One Crime down --9.6% 9.6% Murder Murder --3.0%3.0%Rape Rape --5.4%5.4%Robbery Robbery --3.5%3.5%Burglary Burglary --15.7%15.7%Larceny Larceny --9. 4%9. 4%Auto Theft Auto Theft --18.1%18.1%
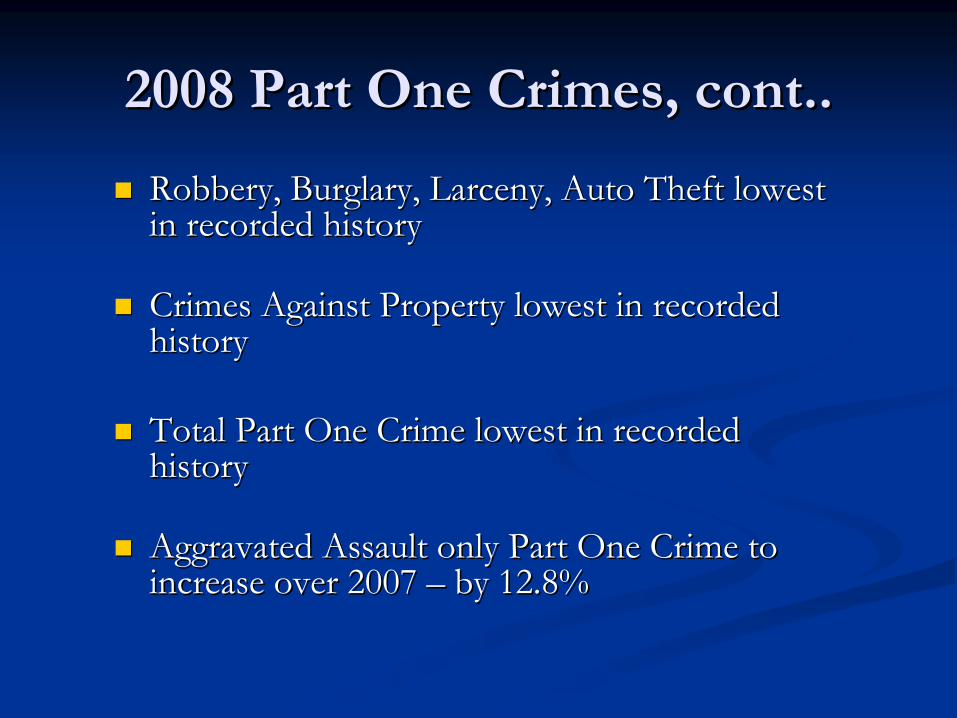
2008 Part One Crimes, cont..2008 Part One Crimes, cont..
Robbery, Burglary, Larceny, Auto Theft lowest Robbery, Burglary, Larceny, Auto Theft lowest in recorded historyin recorded history
Crimes Against Property lowest in recorded Crimes Against Property lowest in recorded historyhistory
Total Part One Crime lowest in recorded Total Part One Crime lowest in recorded historyhistory
Aggravated Assault only Part One Crime to Aggravated Assault only Part One Crime to increase over 2007 increase over 2007 –– by 12.8%by 12.8%
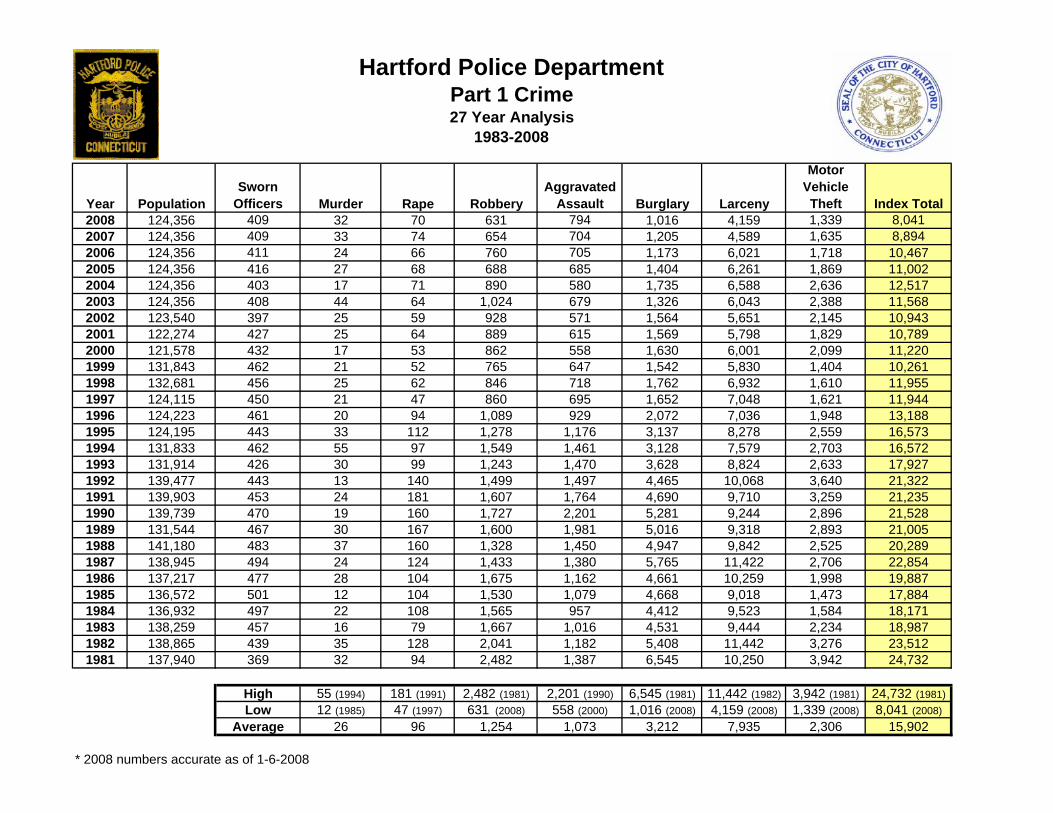
Year PopulationSworn
Officers Murder Rape RobberyAggravated
Assault Burglary Larceny
Motor Vehicle Theft Index Total
2008 124,356 409 32 70 631 794 1,016 4,159 1,339 8,0412007 124,356 409 33 74 654 704 1,205 4,589 1,635 8,8942006 124,356 411 24 66 760 705 1,173 6,021 1,718 10,4672005 124,356 416 27 68 688 685 1,404 6,261 1,869 11,0022004 124,356 403 17 71 890 580 1,735 6,588 2,636 12,5172003 124,356 408 44 64 1,024 679 1,326 6,043 2,388 11,5682002 123,540 397 25 59 928 571 1,564 5,651 2,145 10,9432001 122,274 427 25 64 889 615 1,569 5,798 1,829 10,7892000 121,578 432 17 53 862 558 1,630 6,001 2,099 11,2201999 131,843 462 21 52 765 647 1,542 5,830 1,404 10,2611998 132,681 456 25 62 846 718 1,762 6,932 1,610 11,9551997 124,115 450 21 47 860 695 1,652 7,048 1,621 11,9441996 124,223 461 20 94 1,089 929 2,072 7,036 1,948 13,1881995 124,195 443 33 112 1,278 1,176 3,137 8,278 2,559 16,5731994 131,833 462 55 97 1,549 1,461 3,128 7,579 2,703 16,5721993 131,914 426 30 99 1,243 1,470 3,628 8,824 2,633 17,9271992 139,477 443 13 140 1,499 1,497 4,465 10,068 3,640 21,3221991 139,903 453 24 181 1,607 1,764 4,690 9,710 3,259 21,2351990 139,739 470 19 160 1,727 2,201 5,281 9,244 2,896 21,5281989 131,544 467 30 167 1,600 1,981 5,016 9,318 2,893 21,0051988 141,180 483 37 160 1,328 1,450 4,947 9,842 2,525 20,2891987 138,945 494 24 124 1,433 1,380 5,765 11,422 2,706 22,8541986 137,217 477 28 104 1,675 1,162 4,661 10,259 1,998 19,8871985 136,572 501 12 104 1,530 1,079 4,668 9,018 1,473 17,8841984 136,932 497 22 108 1,565 957 4,412 9,523 1,584 18,1711983 138,259 457 16 79 1,667 1,016 4,531 9,444 2,234 18,9871982 138,865 439 35 128 2,041 1,182 5,408 11,442 3,276 23,5121981 137,940 369 32 94 2,482 1,387 6,545 10,250 3,942 24,732
High 55 (1994) 181 (1991) 2,482 (1981) 2,201 (1990) 6,545 (1981) 11,442 (1982) 3,942 (1981) 24,732 (1981)Low 12 (1985) 47 (1997) 631 (2008) 558 (2000) 1,016 (2008) 4,159 (2008) 1,339 (2008) 8,041 (2008)
Average 26 96 1,254 1,073 3,212 7,935 2,306 15,902 * 2008 numbers accurate as of 1-6-2008
Hartford Police DepartmentPart 1 Crime27 Year Analysis
1983-2008
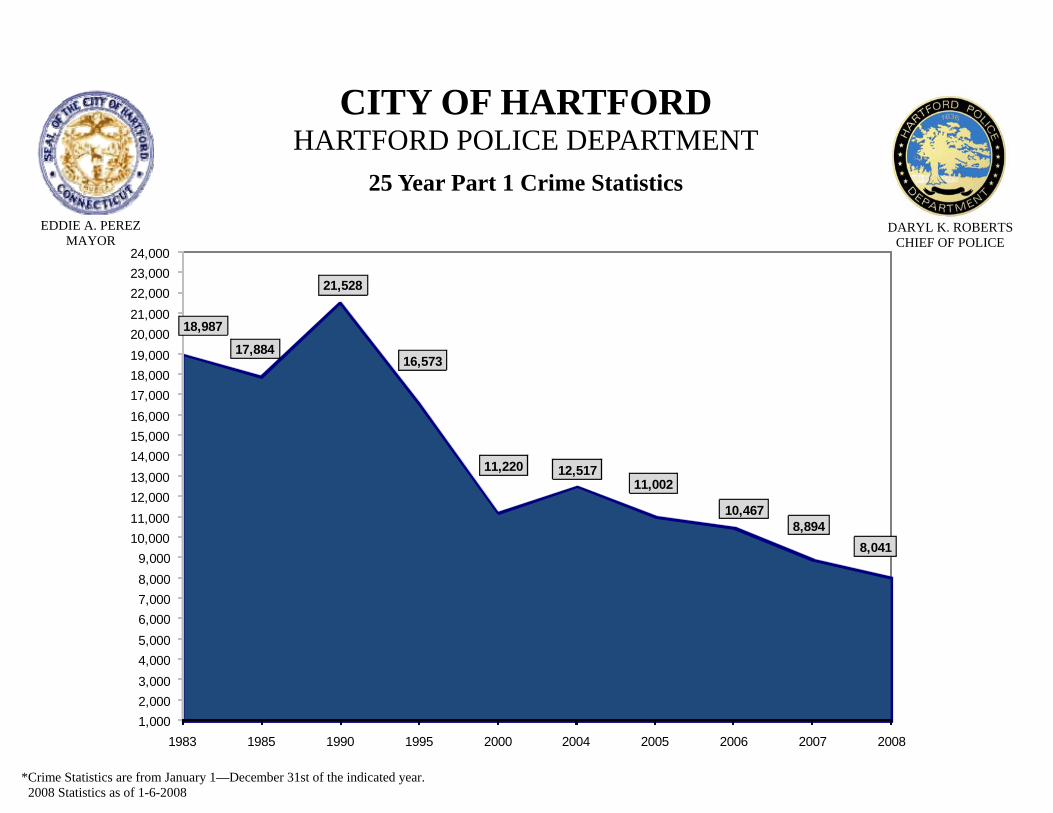
18,987
17,884
21,528
16,573
11,220 12,51711,002
10,4678,894
8,041
1,0002,0003,0004,0005,0006,0007,0008,0009,000
10,00011,00012,00013,00014,00015,00016,00017,00018,00019,00020,00021,00022,00023,00024,000
1983 1985 1990 1995 2000 2004 2005 2006 2007 2008
*Crime Statistics are from January 1—December 31st of the indicated year. 2008 Statistics as of 1-6-2008
CITY OF HARTFORD HARTFORD POLICE DEPARTMENT
25 Year Part 1 Crime Statistics
DARYL K. ROBERTS
CHIEF OF POLICE
EDDIE A. PEREZ MAYOR
Chief Daryl K. Roberts
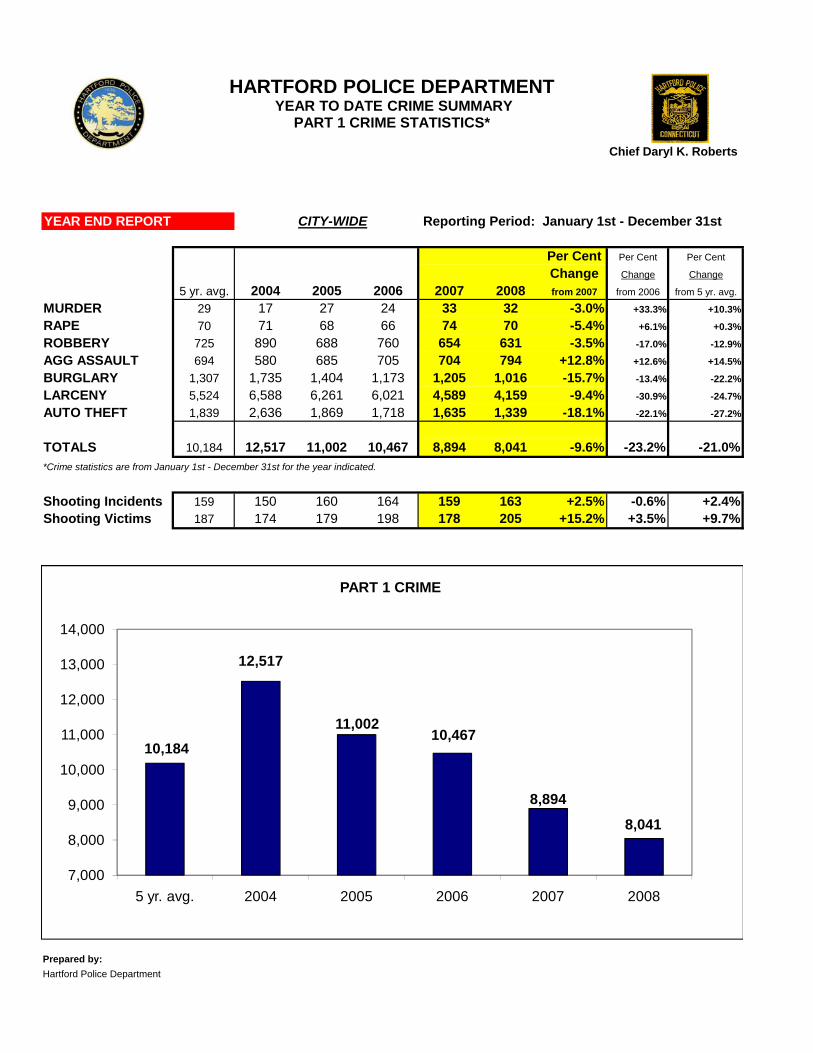
YEAR END REPORT CITY-WIDE Reporting Period: January 1st - December 31st
Per Cent Per Cent Per Cent
Change Change Change
5 yr. avg. 2004 2005 2006 2007 2008 from 2007 from 2006 from 5 yr. avg.
MURDER 29 17 27 24 33 32 -3.0% +33.3% +10.3%
RAPE 70 71 68 66 74 70 -5.4% +6.1% +0.3%
ROBBERY 725 890 688 760 654 631 -3.5% -17.0% -12.9%
AGG ASSAULT 694 580 685 705 704 794 +12.8% +12.6% +14.5%
BURGLARY 1,307 1,735 1,404 1,173 1,205 1,016 -15.7% -13.4% -22.2%
LARCENY 5,524 6,588 6,261 6,021 4,589 4,159 -9.4% -30.9% -24.7%
AUTO THEFT 1,839 2,636 1,869 1,718 1,635 1,339 -18.1% -22.1% -27.2%
TOTALS 10,184 12,517 11,002 10,467 8,894 8,041 -9.6% -23.2% -21.0%*Crime statistics are from January 1st - December 31st for the year indicated.
HARTFORD POLICE DEPARTMENTYEAR TO DATE CRIME SUMMARY
PART 1 CRIME STATISTICS*
Shooting Incidents 159 150 160 164 159 163 +2.5% -0.6% +2.4%Shooting Victims 187 174 179 198 178 205 +15.2% +3.5% +9.7%
Prepared by:Hartford Police DepartmentC i A l i U i
10,184
12,517
11,00210,467
8,894
8,041
7,000
8,000
9,000
10,000
11,000
12,000
13,000
14,000
5 yr. avg. 2004 2005 2006 2007 2008
PART 1 CRIME
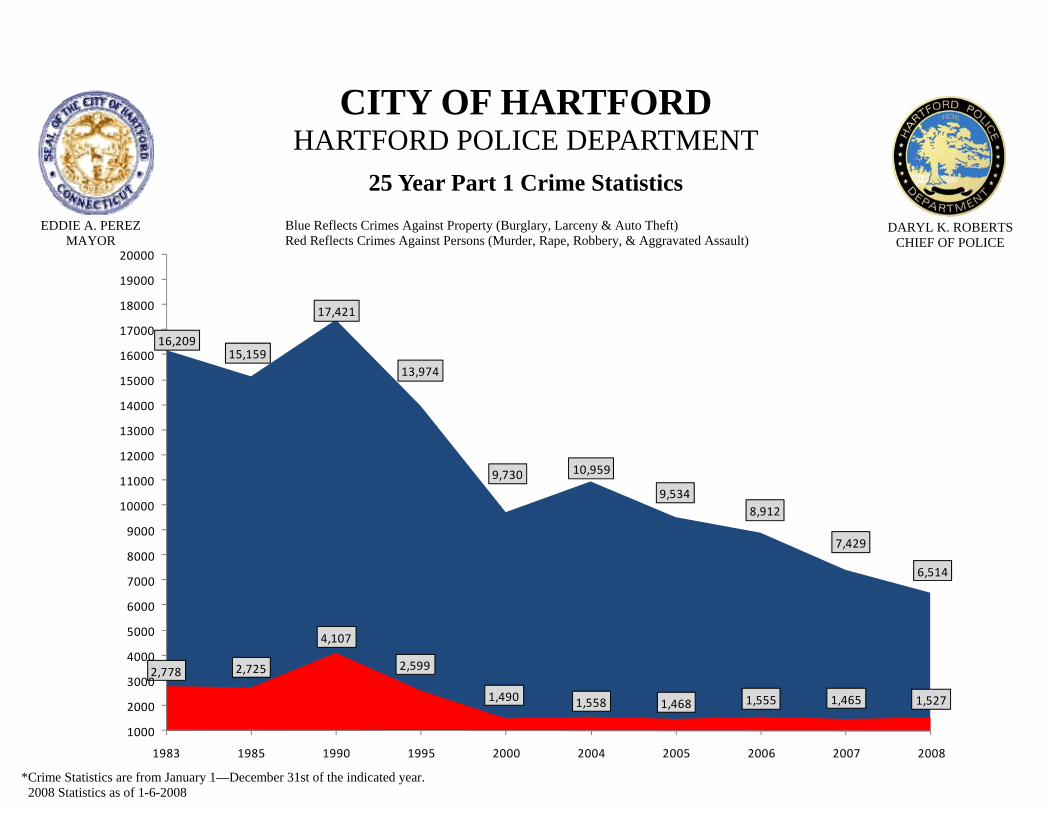
16,20915,159
17,421
13,974
9,730 10,959
9,5348,912
7,429
6,514
2,778 2,725
4,107
2,599
1,490 1,558 1,468 1,555 1,465 1,527
1000
2000
3000
4000
5000
6000
7000
8000
9000
10000
11000
12000
13000
14000
15000
16000
17000
18000
19000
20000
1983 1985 1990 1995 2000 2004 2005 2006 2007 2008
*Crime Statistics are from January 1—December 31st of the indicated year. 2008 Statistics as of 1-6-2008
CITY OF HARTFORD HARTFORD POLICE DEPARTMENT
25 Year Part 1 Crime Statistics
DARYL K. ROBERTS
CHIEF OF POLICE
EDDIE A. PEREZ MAYOR
Blue Reflects Crimes Against Property (Burglary, Larceny & Auto Theft) Red Reflects Crimes Against Persons (Murder, Rape, Robbery, & Aggravated Assault)
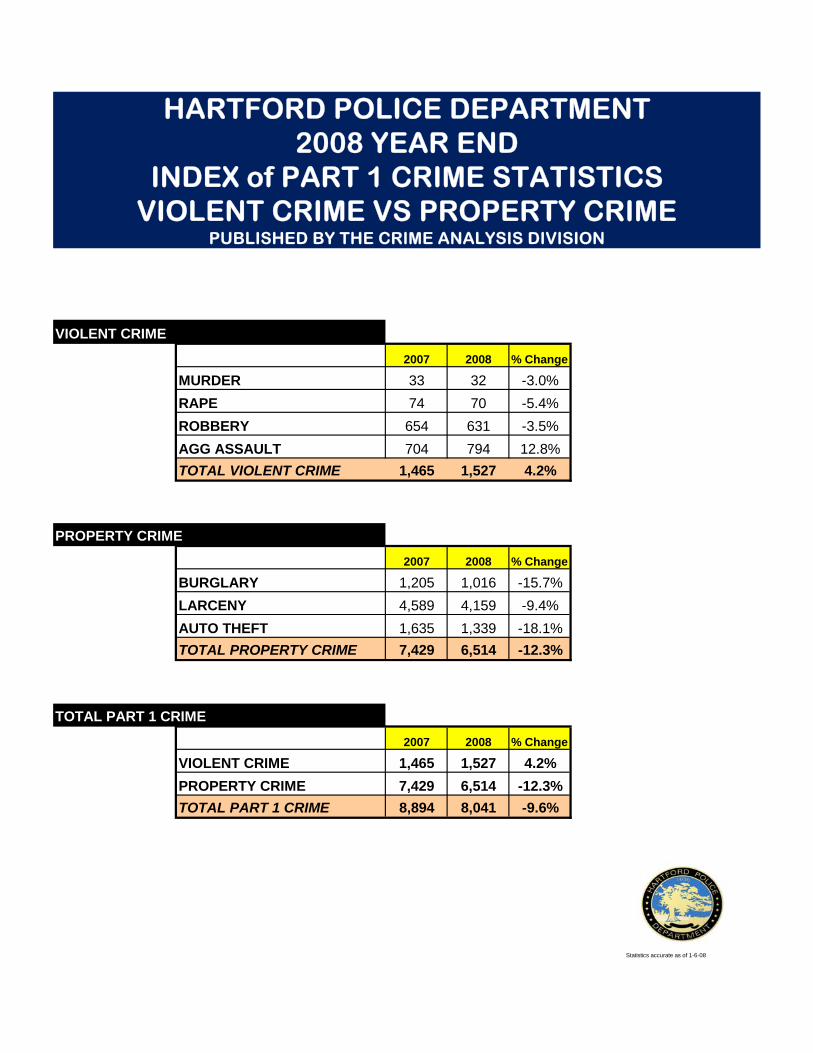
HARTFORD POLICE DEPARTMENT2008 YEAR END
INDEX of PART 1 CRIME STATISTICSVIOLENT CRIME VS PROPERTY CRIME
PUBLISHED BY THE CRIME ANALYSIS DIVISION
VIOLENT CRIME
2007 2008 % Change
MURDER 33 32 -3.0%RAPE 74 70 -5.4%ROBBERY 654 631 -3.5%AGG ASSAULT 704 794 12.8%TOTAL VIOLENT CRIME 1,465 1,527 4.2%
PROPERTY CRIME
2007 2008 % Change
BURGLARY 1,205 1,016 -15.7%LARCENY 4,589 4,159 -9.4%AUTO THEFT 1,635 1,339 -18.1%TOTAL PROPERTY CRIME 7,429 6,514 -12.3%
TOTAL PART 1 CRIME
2007 2008 % Change
VIOLENT CRIME 1,465 1,527 4.2%PROPERTY CRIME 7,429 6,514 -12.3%TOTAL PART 1 CRIME 8,894 8,041 -9.6%
Statistics accurate as of 1-6-08
HomicidesHomicides
Most homicides are not random acts Most homicides are not random acts of violenceof violenceVictims and Perpetrators known to Victims and Perpetrators known to each othereach otherArguments/fights that escalate to use Arguments/fights that escalate to use of guns to resolve conflictsof guns to resolve conflicts

Homicides of Males Homicides of Males Between 14Between 14--2525
60% or 19 minority males 60% or 19 minority males between 14between 14--252541% or 13 Black males between 41% or 13 Black males between 1414--252519% or 6 Hispanic males 19% or 6 Hispanic males between 14between 14--2525
Youth ViolenceYouth Violence
Hartford trend Mirrors national trend of Hartford trend Mirrors national trend of increase in gun violence among minority increase in gun violence among minority youth between 16 and 25 sinceyouth between 16 and 25 sincePer Northeast University study Per Northeast University study –– since since 2002 gun killings have climbed 13% 2002 gun killings have climbed 13% overall overall –– but 42% among teens and 71% but 42% among teens and 71% among black teenage malesamong black teenage males
Gun ViolenceGun Violence
Of the 32 homicides, 24 Of the 32 homicides, 24 or 75% involved a gunor 75% involved a gunHPD seized 400 guns in HPD seized 400 guns in 20082008Made 228 firearm related Made 228 firearm related arrestsarrests
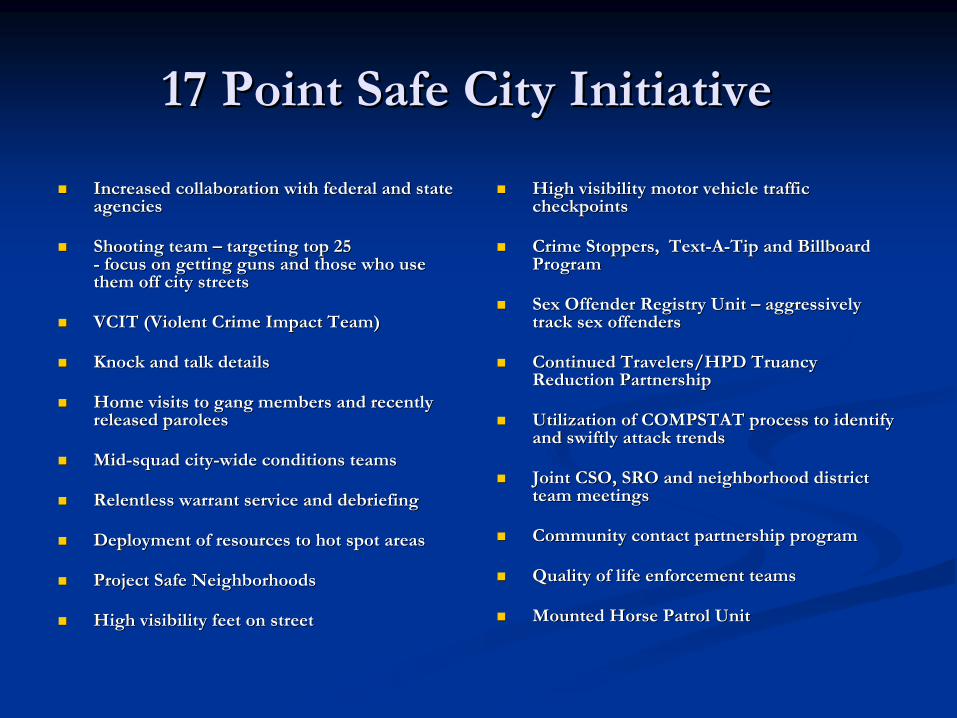
17 Point Safe City Initiative17 Point Safe City Initiative
Increased collaboration with federal and state Increased collaboration with federal and state agenciesagencies
Shooting team Shooting team –– targeting top 25targeting top 25-- focus on getting guns and those who use focus on getting guns and those who use them off city streetsthem off city streets
VCIT (Violent Crime Impact Team)VCIT (Violent Crime Impact Team)
Knock and talk detailsKnock and talk details
Home visits to gang members and recently Home visits to gang members and recently released paroleesreleased parolees
MidMid--squad citysquad city--wide conditions teamswide conditions teams
Relentless warrant service and debriefingRelentless warrant service and debriefing
Deployment of resources to hot spot areasDeployment of resources to hot spot areas
Project Safe NeighborhoodsProject Safe Neighborhoods
High visibility feet on street High visibility feet on street
High visibility motor vehicle traffic High visibility motor vehicle traffic checkpointscheckpoints
Crime Stoppers, TextCrime Stoppers, Text--AA--Tip and Billboard Tip and Billboard ProgramProgram
Sex Offender Registry Unit Sex Offender Registry Unit –– aggressively aggressively track sex offenderstrack sex offenders
Continued Travelers/HPD Truancy Continued Travelers/HPD Truancy Reduction PartnershipReduction Partnership
Utilization of COMPSTAT process to identify Utilization of COMPSTAT process to identify and swiftly attack trendsand swiftly attack trends
Joint CSO, SRO and neighborhood district Joint CSO, SRO and neighborhood district team meetingsteam meetings
Community contact partnership programCommunity contact partnership program
Quality of life enforcement teamsQuality of life enforcement teams
Mounted Horse Patrol UnitMounted Horse Patrol Unit
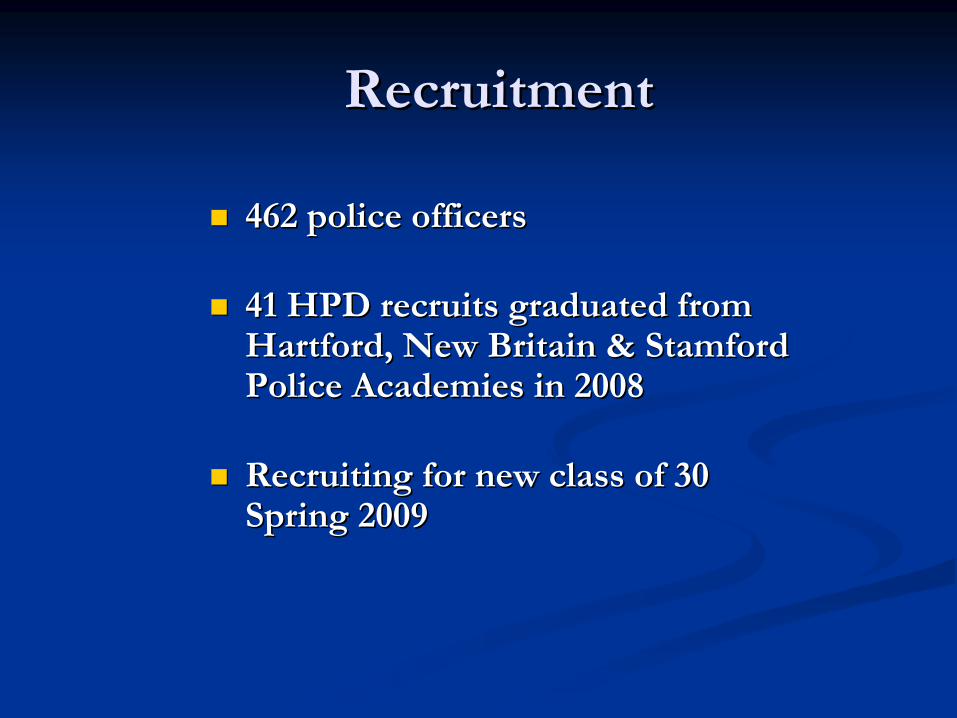
RecruitmentRecruitment
462 police officers462 police officers
41 HPD recruits graduated from 41 HPD recruits graduated from Hartford, New Britain & Stamford Hartford, New Britain & Stamford Police Academies in 2008Police Academies in 2008
Recruiting for new class of 30 Recruiting for new class of 30 Spring 2009Spring 2009

HARTFORD POLICE DEPARTMENT 2008 YEAR END REPORTCITYWIDE
Crime ActivityPART 1 CRIME YEAR TO DATE 2 YR 3 YR 4 YR
2007 2008 % change 2006 % change 2005 % change 2004 % changeMURDER 33 32 -3.0% 24 33.3% 27 18.5% 17 88.2%RAPE 74 70 -5.4% 66 6.1% 68 2.9% 71 -1.4%ROBBERY 654 631 -3.5% 760 -17.0% 688 -8.3% 890 -29.1%AGG ASSAULT 704 794 12.8% 705 12.6% 685 15.9% 580 36.9%BURGLARY 1205 1016 -15.7% 1173 -13.4% 1404 -27.6% 1735 -41.4%LARCENY 4589 4159 -9.4% 6021 -30.9% 6261 -33.6% 6588 -36.9%AUTO THEFT 1635 1339 -18.1% 1718 -22.1% 1869 -28.4% 2636 -49.2%
TOTALS 8894 8041 -9.6% 10467 -23.2% 11002 -26.9% 12517 -35.8%SHOOT INCIDENTS 159 163 2.5% 164 -0.6% 160 1.9% 150 8.7%SHOOTING VICTIMS 178 205 15 2% 198 3 5% 179 14 5% 174 17 8%SHOOTING VICTIMS 178 205 15.2% 198 3.5% 179 14.5% 174 17.8%
ARREST ACTIVITY
YEAR TO DATE 2 YR 3 YR 4 YR2007 2008 % change 2006 % change 2005 % change 2004 % change
MURDER 37 60 62.2% 42 42.9% 46 30.4% 46 30.4%RAPE 29 46 58.6% 48 -4.2% 38 21.1% 59 -22.0%ROBBERY 220 211 -4.1% 179 17.9% 171 23.4% 193 9.3%AGG ASSAULT 354 427 20.6% 407 4.9% 376 13.6% 467 -8.6%BURGLARY 287 258 -10.1% 255 1.2% 267 -3.4% 286 -9.8%LARCENY 862 871 1.0% 1062 -18.0% 717 21.5% 829 5.1%AUTO THEFT 188 156 -17.0% 149 4.7% 150 4.0% 181 -13.8%
TOTAL PT I ARRESTS 1977 2029 2.6% 2142 -5.3% 1765 15.0% 2061 -1.6%SIMPLE ASST 3561 3320 -6.8% 3823 -13.2% 3441 -3.5% 3812 -12.9%GUN 261 257 -1.5% 272 -5.5% 212 21.2% 217 18.4%PROSTITUTION 114 139 21.9% 131 6.1% 89 56.2% 188 -26.1%NARCOTICS 3021 3448 14.1% 3237 6.5% 2689 28.2% 3224 6.9%D/C - BOP 2320 2028 -12.6% 2364 -14.2% 2235 -9.3% 2322 -12.7%OTHER 4283 4233 -1.2% 4170 1.5% 3431 23.4% 3781 12.0%
TOTAL ALL ARRESTS. 15537 15454 -0.5% 16139 -4.2% 13862 11.5% 15605 -1.0%
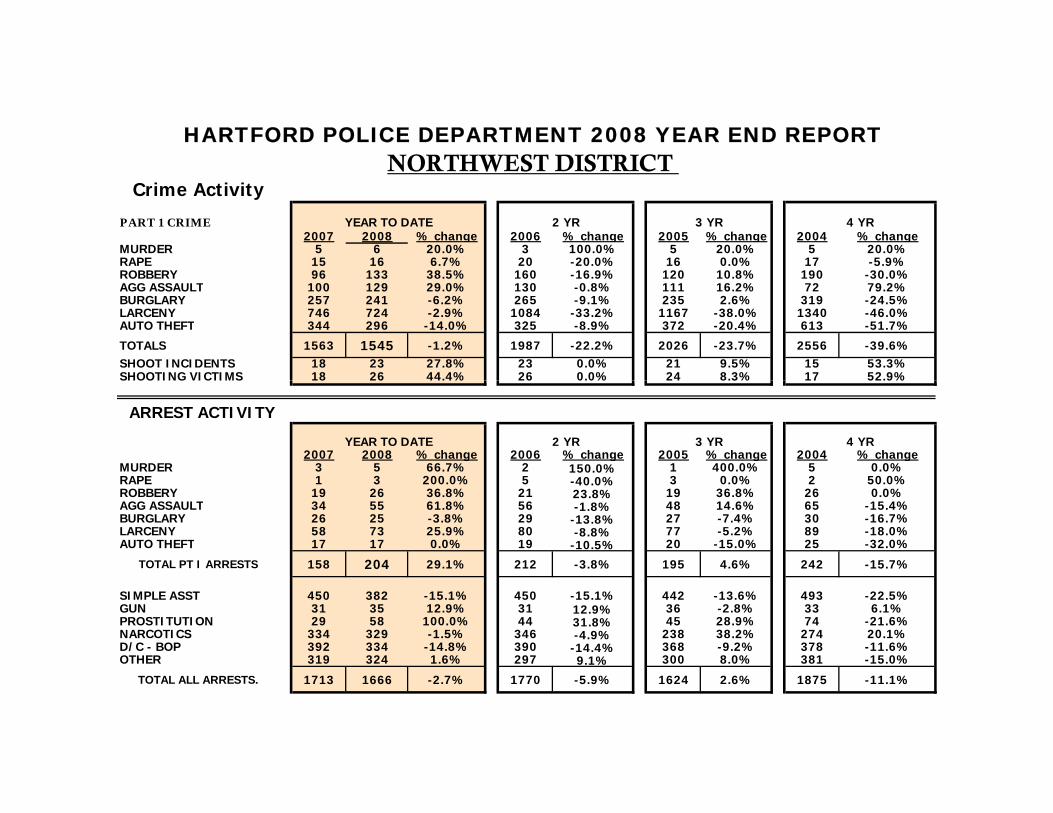
HARTFORD POLICE DEPARTMENT 2008 YEAR END REPORTNORTHWEST DISTRICT
Crime Activity
PART 1 CRIME YEAR TO DATE 2 YR 3 YR 4 YR2007 2008 % change 2006 % change 2005 % change 2004 % change
MURDER 5 6 20.0% 3 100.0% 5 20.0% 5 20.0%RAPE 15 16 6.7% 20 -20.0% 16 0.0% 17 -5.9%ROBBERY 96 133 38.5% 160 -16.9% 120 10.8% 190 -30.0%AGG ASSAULT 100 129 29.0% 130 -0.8% 111 16.2% 72 79.2%BURGLARY 257 241 -6.2% 265 -9.1% 235 2.6% 319 -24.5%LARCENY 746 724 -2.9% 1084 -33.2% 1167 -38.0% 1340 -46.0%AUTO THEFT 344 296 -14.0% 325 -8.9% 372 -20.4% 613 -51.7%
TOTALS 1563 1545 -1.2% 1987 -22.2% 2026 -23.7% 2556 -39.6%SHOOT INCIDENTS 18 23 27.8% 23 0.0% 21 9.5% 15 53.3%SHOOTING VICTIMS 18 26 44.4% 26 0.0% 24 8.3% 17 52.9%SHOOTING VICTIMS 18 26 44.4% 26 0.0% 24 8.3% 17 52.9%
ARREST ACTIVITY
YEAR TO DATE 2 YR 3 YR 4 YR2007 2008 % change 2006 % change 2005 % change 2004 % change
MURDER 3 5 66.7% 2 150.0% 1 400.0% 5 0.0%RAPE 1 3 200.0% 5 -40.0% 3 0.0% 2 50.0%ROBBERY 19 26 36.8% 21 23.8% 19 36.8% 26 0.0%AGG ASSAULT 34 55 61.8% 56 -1.8% 48 14.6% 65 -15.4%BURGLARY 26 25 -3.8% 29 -13.8% 27 -7.4% 30 -16.7%LARCENY 58 73 25.9% 80 -8.8% 77 -5.2% 89 -18.0%AUTO THEFT 17 17 0.0% 19 -10.5% 20 -15.0% 25 -32.0%
TOTAL PT I ARRESTS 158 204 29.1% 212 -3.8% 195 4.6% 242 -15.7%
SIMPLE ASST 450 382 -15.1% 450 -15.1% 442 -13.6% 493 -22.5%GUN 31 35 12.9% 31 12.9% 36 -2.8% 33 6.1%PROSTITUTION 29 58 100.0% 44 31.8% 45 28.9% 74 -21.6%NARCOTICS 334 329 -1.5% 346 -4.9% 238 38.2% 274 20.1%D/C - BOP 392 334 -14.8% 390 -14.4% 368 -9.2% 378 -11.6%OTHER 319 324 1.6% 297 9.1% 300 8.0% 381 -15.0%
TOTAL ALL ARRESTS. 1713 1666 -2.7% 1770 -5.9% 1624 2.6% 1875 -11.1%
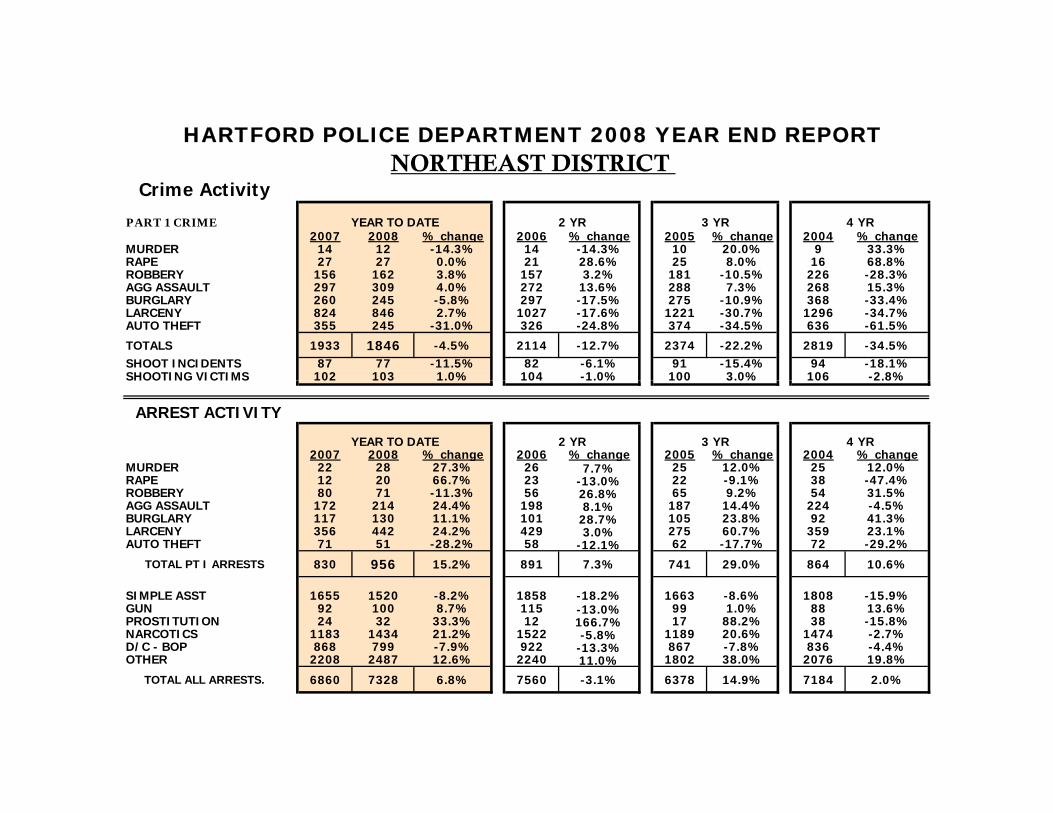
HARTFORD POLICE DEPARTMENT 2008 YEAR END REPORTNORTHEAST DISTRICT
Crime Activity
PART 1 CRIME YEAR TO DATE 2 YR 3 YR 4 YR2007 2008 % change 2006 % change 2005 % change 2004 % change
MURDER 14 12 -14.3% 14 -14.3% 10 20.0% 9 33.3%RAPE 27 27 0.0% 21 28.6% 25 8.0% 16 68.8%ROBBERY 156 162 3.8% 157 3.2% 181 -10.5% 226 -28.3%AGG ASSAULT 297 309 4.0% 272 13.6% 288 7.3% 268 15.3%BURGLARY 260 245 -5.8% 297 -17.5% 275 -10.9% 368 -33.4%LARCENY 824 846 2.7% 1027 -17.6% 1221 -30.7% 1296 -34.7%AUTO THEFT 355 245 -31.0% 326 -24.8% 374 -34.5% 636 -61.5%
TOTALS 1933 1846 -4.5% 2114 -12.7% 2374 -22.2% 2819 -34.5%SHOOT INCIDENTS 87 77 -11.5% 82 -6.1% 91 -15.4% 94 -18.1%SHOOTING VICTIMS 102 103 1.0% 104 -1.0% 100 3.0% 106 -2.8%SHOOTING VICTIMS 102 103 1.0% 104 1.0% 100 3.0% 106 2.8%
ARREST ACTIVITY
YEAR TO DATE 2 YR 3 YR 4 YR2007 2008 % change 2006 % change 2005 % change 2004 % change
MURDER 22 28 27.3% 26 7.7% 25 12.0% 25 12.0%RAPE 12 20 66.7% 23 -13.0% 22 -9.1% 38 -47.4%ROBBERY 80 71 -11.3% 56 26.8% 65 9.2% 54 31.5%AGG ASSAULT 172 214 24.4% 198 8.1% 187 14.4% 224 -4.5%BURGLARY 117 130 11.1% 101 28.7% 105 23.8% 92 41.3%LARCENY 356 442 24.2% 429 3.0% 275 60.7% 359 23.1%AUTO THEFT 71 51 -28.2% 58 -12.1% 62 -17.7% 72 -29.2%
TOTAL PT I ARRESTS 830 956 15.2% 891 7.3% 741 29.0% 864 10.6%
SIMPLE ASST 1655 1520 -8.2% 1858 -18.2% 1663 -8.6% 1808 -15.9%GUN 92 100 8.7% 115 -13.0% 99 1.0% 88 13.6%PROSTITUTION 24 32 33.3% 12 166.7% 17 88.2% 38 -15.8%NARCOTICS 1183 1434 21.2% 1522 -5.8% 1189 20.6% 1474 -2.7%D/C - BOP 868 799 -7.9% 922 -13.3% 867 -7.8% 836 -4.4%OTHER 2208 2487 12.6% 2240 11.0% 1802 38.0% 2076 19.8%
TOTAL ALL ARRESTS. 6860 7328 6.8% 7560 -3.1% 6378 14.9% 7184 2.0%
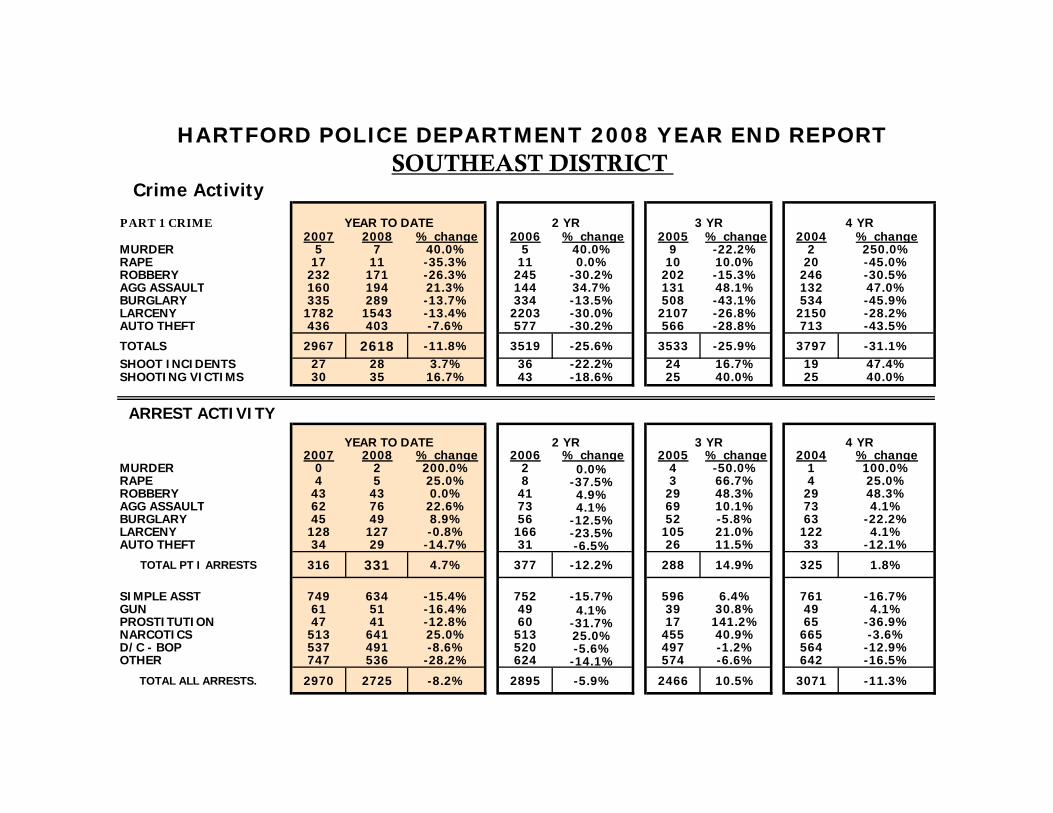
HARTFORD POLICE DEPARTMENT 2008 YEAR END REPORTSOUTHEAST DISTRICT
Crime Activity
PART 1 CRIME YEAR TO DATE 2 YR 3 YR 4 YR2007 2008 % change 2006 % change 2005 % change 2004 % change
MURDER 5 7 40.0% 5 40.0% 9 -22.2% 2 250.0%RAPE 17 11 -35.3% 11 0.0% 10 10.0% 20 -45.0%ROBBERY 232 171 -26.3% 245 -30.2% 202 -15.3% 246 -30.5%AGG ASSAULT 160 194 21.3% 144 34.7% 131 48.1% 132 47.0%BURGLARY 335 289 -13.7% 334 -13.5% 508 -43.1% 534 -45.9%LARCENY 1782 1543 -13.4% 2203 -30.0% 2107 -26.8% 2150 -28.2%AUTO THEFT 436 403 -7.6% 577 -30.2% 566 -28.8% 713 -43.5%
TOTALS 2967 2618 -11.8% 3519 -25.6% 3533 -25.9% 3797 -31.1%SHOOT INCIDENTS 27 28 3.7% 36 -22.2% 24 16.7% 19 47.4%SHOOTING VICTIMS 30 35 16.7% 43 -18.6% 25 40.0% 25 40.0%
ARREST ACTIVITY
YEAR TO DATE 2 YR 3 YR 4 YR2007 2008 % change 2006 % change 2005 % change 2004 % change
MURDER 0 2 200.0% 2 0.0% 4 -50.0% 1 100.0%RAPE 4 5 25.0% 8 -37.5% 3 66.7% 4 25.0%ROBBERY 43 43 0.0% 41 4.9% 29 48.3% 29 48.3%AGG ASSAULT 62 76 22.6% 73 4.1% 69 10.1% 73 4.1%BURGLARY 45 49 8.9% 56 -12.5% 52 -5.8% 63 -22.2%LARCENY 128 127 -0.8% 166 -23.5% 105 21.0% 122 4.1%AUTO THEFT 34 29 -14.7% 31 -6.5% 26 11.5% 33 -12.1%
TOTAL PT I ARRESTS 316 331 4.7% 377 -12.2% 288 14.9% 325 1.8%
SIMPLE ASST 749 634 -15.4% 752 -15.7% 596 6.4% 761 -16.7%GUN 61 51 -16.4% 49 4.1% 39 30.8% 49 4.1%PROSTITUTION 47 41 -12.8% 60 -31.7% 17 141.2% 65 -36.9%NARCOTICS 513 641 25.0% 513 25.0% 455 40.9% 665 -3.6%D/C - BOP 537 491 -8.6% 520 -5.6% 497 -1.2% 564 -12.9%OTHER 747 536 -28.2% 624 -14.1% 574 -6.6% 642 -16.5%
TOTAL ALL ARRESTS. 2970 2725 -8.2% 2895 -5.9% 2466 10.5% 3071 -11.3%
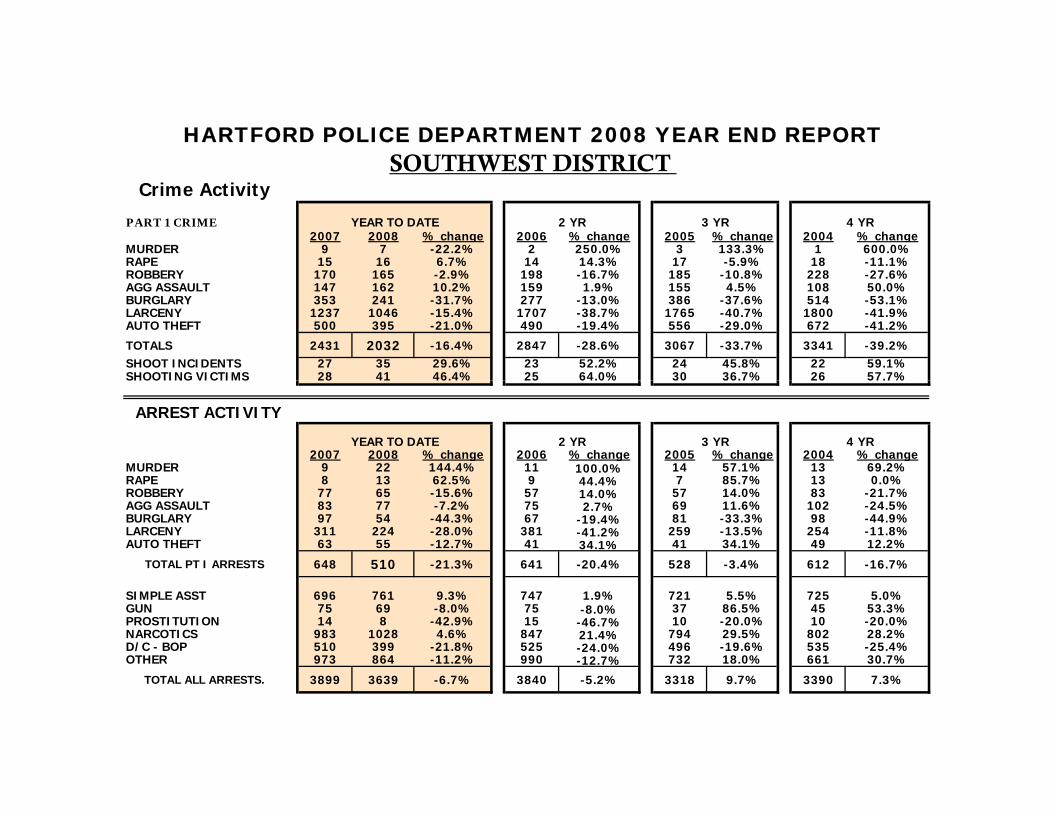
HARTFORD POLICE DEPARTMENT 2008 YEAR END REPORTSOUTHWEST DISTRICT
Crime Activity
PART 1 CRIME YEAR TO DATE 2 YR 3 YR 4 YR2007 2008 % change 2006 % change 2005 % change 2004 % change
MURDER 9 7 -22.2% 2 250.0% 3 133.3% 1 600.0%RAPE 15 16 6.7% 14 14.3% 17 -5.9% 18 -11.1%ROBBERY 170 165 -2.9% 198 -16.7% 185 -10.8% 228 -27.6%AGG ASSAULT 147 162 10.2% 159 1.9% 155 4.5% 108 50.0%BURGLARY 353 241 -31.7% 277 -13.0% 386 -37.6% 514 -53.1%LARCENY 1237 1046 -15.4% 1707 -38.7% 1765 -40.7% 1800 -41.9%AUTO THEFT 500 395 -21.0% 490 -19.4% 556 -29.0% 672 -41.2%
TOTALS 2431 2032 -16.4% 2847 -28.6% 3067 -33.7% 3341 -39.2%SHOOT INCIDENTS 27 35 29.6% 23 52.2% 24 45.8% 22 59.1%SHOOTING VICTIMS 28 41 46.4% 25 64.0% 30 36.7% 26 57.7%SHOOTING VICTIMS 28 41 46.4% 25 64.0% 30 36.7% 26 57.7%
ARREST ACTIVITY
YEAR TO DATE 2 YR 3 YR 4 YR2007 2008 % change 2006 % change 2005 % change 2004 % change
MURDER 9 22 144.4% 11 100.0% 14 57.1% 13 69.2%RAPE 8 13 62.5% 9 44.4% 7 85.7% 13 0.0%ROBBERY 77 65 -15.6% 57 14.0% 57 14.0% 83 -21.7%AGG ASSAULT 83 77 -7.2% 75 2.7% 69 11.6% 102 -24.5%BURGLARY 97 54 -44.3% 67 -19.4% 81 -33.3% 98 -44.9%LARCENY 311 224 -28.0% 381 -41.2% 259 -13.5% 254 -11.8%AUTO THEFT 63 55 -12.7% 41 34.1% 41 34.1% 49 12.2%
TOTAL PT I ARRESTS 648 510 -21.3% 641 -20.4% 528 -3.4% 612 -16.7%
SIMPLE ASST 696 761 9.3% 747 1.9% 721 5.5% 725 5.0%GUN 75 69 -8.0% 75 -8.0% 37 86.5% 45 53.3%PROSTITUTION 14 8 -42.9% 15 -46.7% 10 -20.0% 10 -20.0%NARCOTICS 983 1028 4.6% 847 21.4% 794 29.5% 802 28.2%D/C - BOP 510 399 -21.8% 525 -24.0% 496 -19.6% 535 -25.4%OTHER 973 864 -11.2% 990 -12.7% 732 18.0% 661 30.7%
TOTAL ALL ARRESTS. 3899 3639 -6.7% 3840 -5.2% 3318 9.7% 3390 7.3%