Embed Size (px)
Citation preview
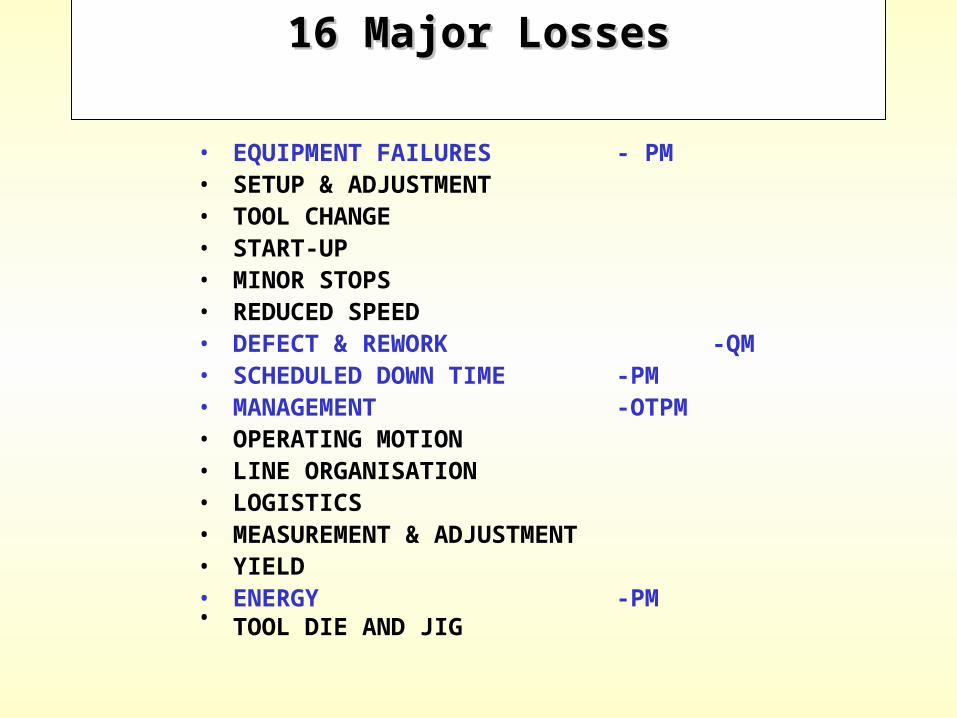
• EQUIPMENT FAILURES - PM• SETUP & ADJUSTMENT• TOOL CHANGE• START-UP• MINOR STOPS• REDUCED SPEED• DEFECT & REWORK -QM• SCHEDULED DOWN TIME -PM• MANAGEMENT -OTPM• OPERATING MOTION• LINE ORGANISATION• LOGISTICS• MEASUREMENT & ADJUSTMENT• YIELD• ENERGY -PM• TOOL DIE AND JIG
16 Major Losses16 Major Losses
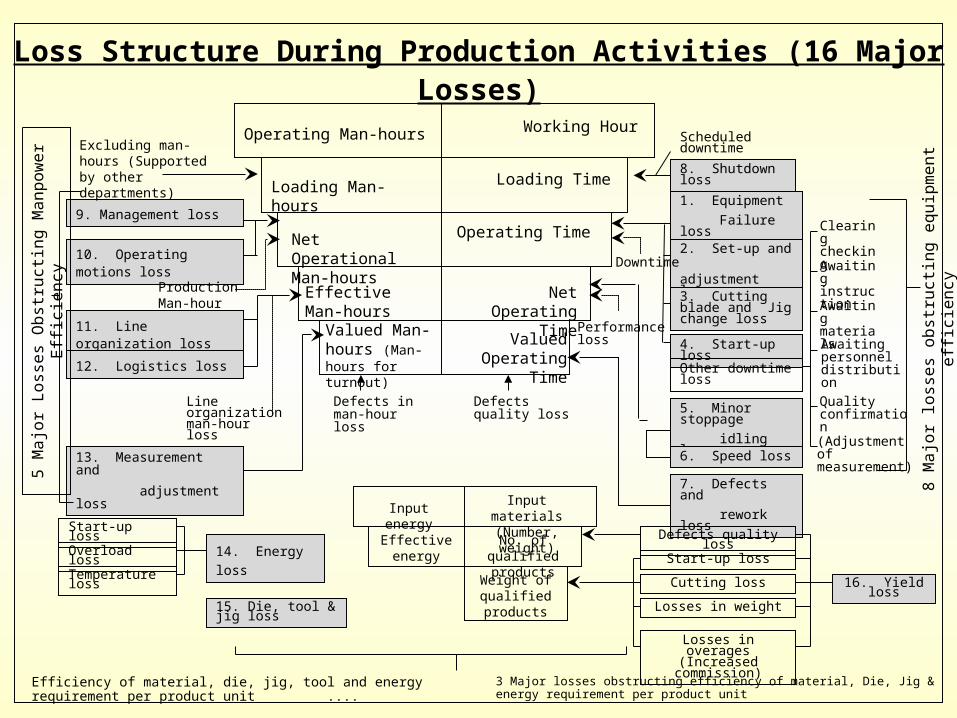
Loss Structure During Production Activities (16 Major Losses)
Operating Man-hours
Net Operational Man-hours
Effective Man-hours
Valued Man-hours (Man-hours for turnout)
Loading Man-hours
Working Hour
Operating Time
Net Operating Time
Valued Operating Time
Loading Time
9. Management loss
10. Operating motions loss
11. Line organization loss
12. Logistics loss
13. Measurement and adjustment loss5
Maj
or L
osse
s O
bstru
ctin
g M
anpo
wer
Effi
cien
cy Excluding man-hours (Supported by other departments)
Production Man-hour
Line organization man-hour loss
Defects in man-hour loss
Defects quality loss
8. Shutdown loss
1. Equipment Failure loss
2. Set-up and adjustment loss
3. Cutting blade and Jig change loss
4. Start-up loss
5. Minor stoppage idling loss
6. Speed loss
7. Defects and rework loss
Other downtime loss
Clearing checking
Awaiting instruction
Awaiting materials
Awaiting personnel distribution
Quality confirmation
(Adjustment of measurement)
8 M
ajor
loss
es o
bstru
ctin
g eq
uipm
ent e
ffici
ency
Scheduled downtime
Downtime
Performance loss
Start-up loss
Overload loss
Temperature loss
14. Energy loss
Input energy
Effective energy
No. of qualified products
Input materials (Number, weight)
Weight of qualified products
Defects quality loss
Start-up loss
Cutting loss
Losses in weight
Losses in overages (Increased
commission)
16. Yield loss
15. Die, tool & jig loss
Efficiency of material, die, jig, tool and energy requirement per product unit ....
3 Major losses obstructing efficiency of material, Die, Jig & energy requirement per product unit
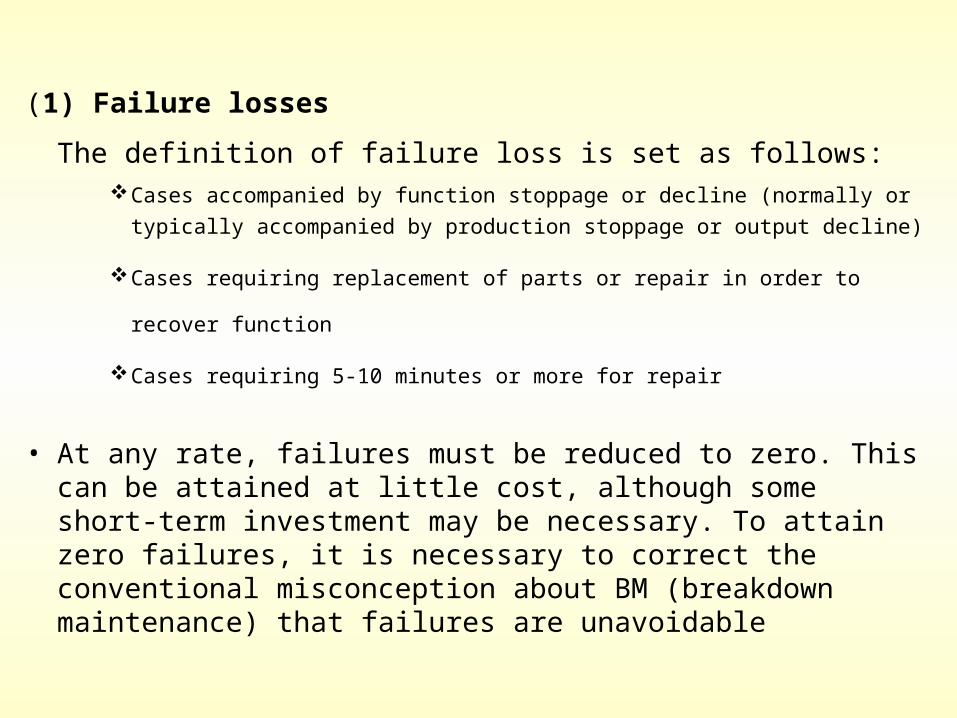
(1) Failure losses
The definition of failure loss is set as follows:Cases accompanied by function stoppage or decline (normally or typically
accompanied by production stoppage or output decline)
Cases requiring replacement of parts or repair in order to recover function
Cases requiring 5-10 minutes or more for repair
• At any rate, failures must be reduced to zero. This can be attained
at little cost, although some short-term investment may be necessary. To attain zero failures, it is necessary to correct the conventional misconception about BM (breakdown maintenance) that failures are unavoidable
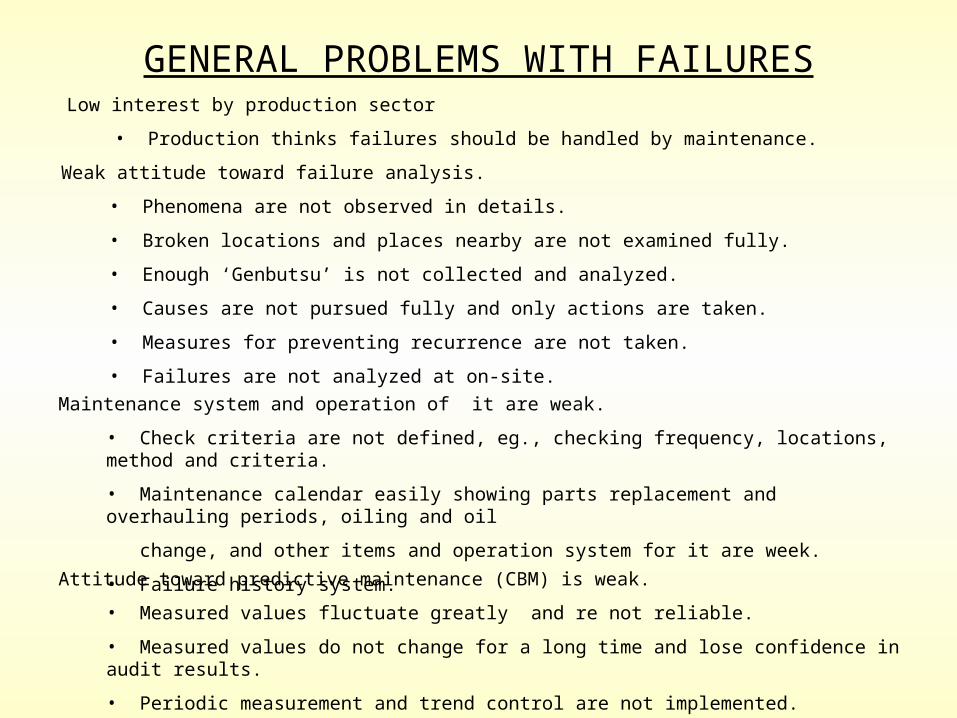
GENERAL PROBLEMS WITH FAILURESLow interest by production sector
• Production thinks failures should be handled by maintenance.
Weak attitude toward failure analysis.
• Phenomena are not observed in details.
• Broken locations and places nearby are not examined fully.
• Enough ‘Genbutsu’ is not collected and analyzed.
• Causes are not pursued fully and only actions are taken.
• Measures for preventing recurrence are not taken.
• Failures are not analyzed at on-site.Maintenance system and operation of it are weak.
• Check criteria are not defined, eg., checking frequency, locations, method and criteria.
• Maintenance calendar easily showing parts replacement and overhauling periods, oiling and oil
change, and other items and operation system for it are week.
• Failure history system.Attitude toward predictive maintenance (CBM) is weak.
• Measured values fluctuate greatly and re not reliable.
• Measured values do not change for a long time and lose confidence in audit results.
• Periodic measurement and trend control are not implemented.
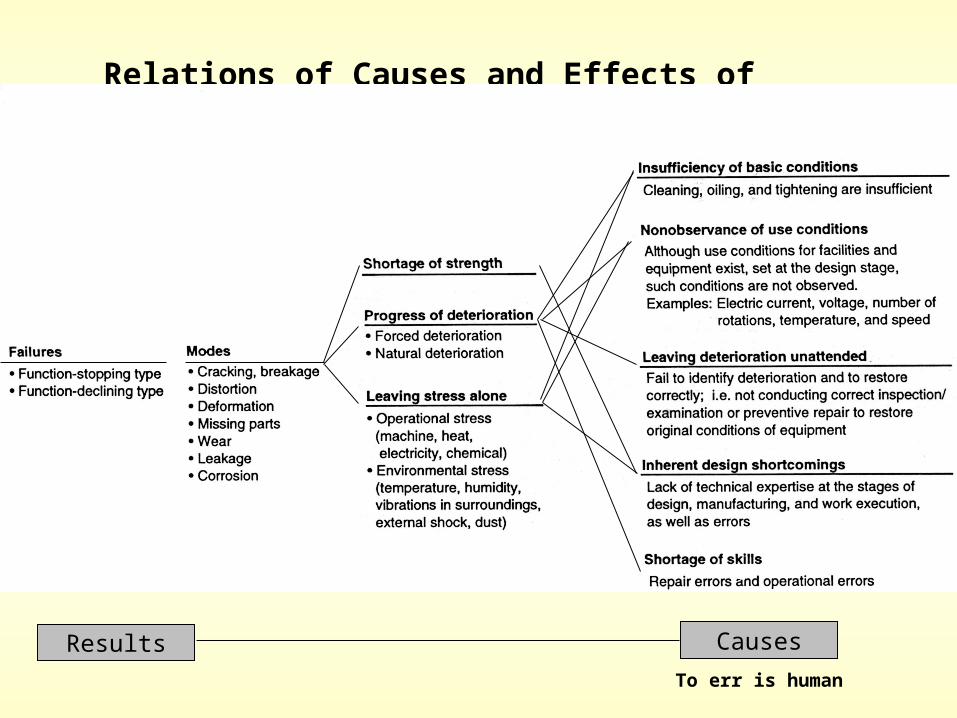
Relations of Causes and Effects of Failures
Results CausesTo err is human
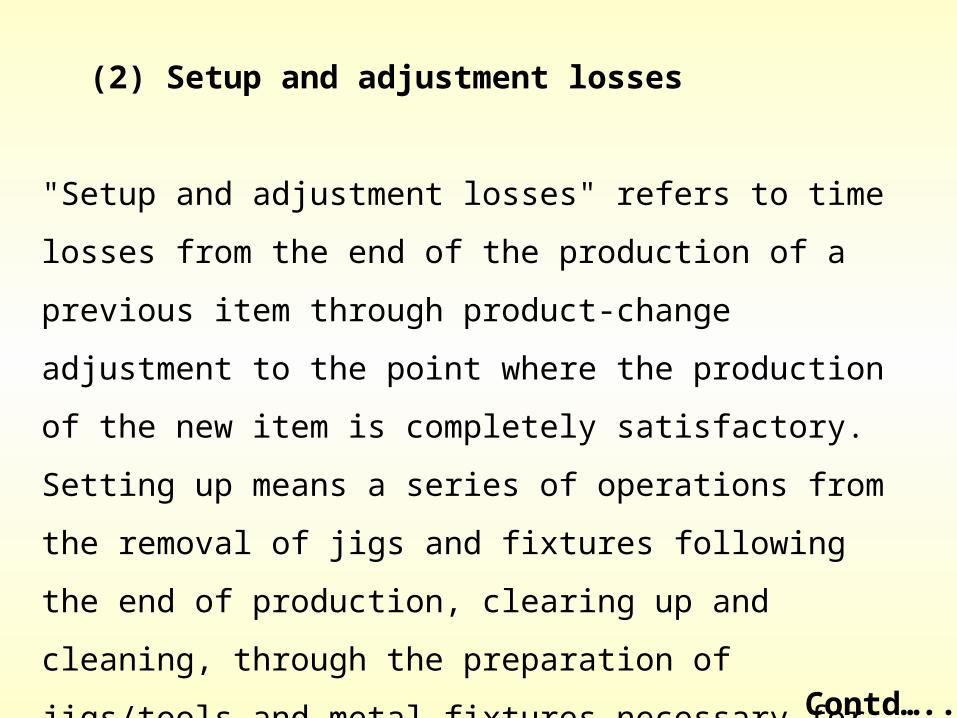
(2) Setup and adjustment losses
"Setup and adjustment losses" refers to time losses from the end of the
production of a previous item through product-change adjustment to the
point where the production of the new item is completely satisfactory.
Setting up means a series of operations from the removal of jigs and
fixtures following the end of production, clearing up and cleaning, through
the preparation of jigs/tools and metal fixtures necessary for the next
product, to their attachment, adjustment, trial processing, readjustment,
measurement, production, and finally the ability to produce excellent
productsContd…..
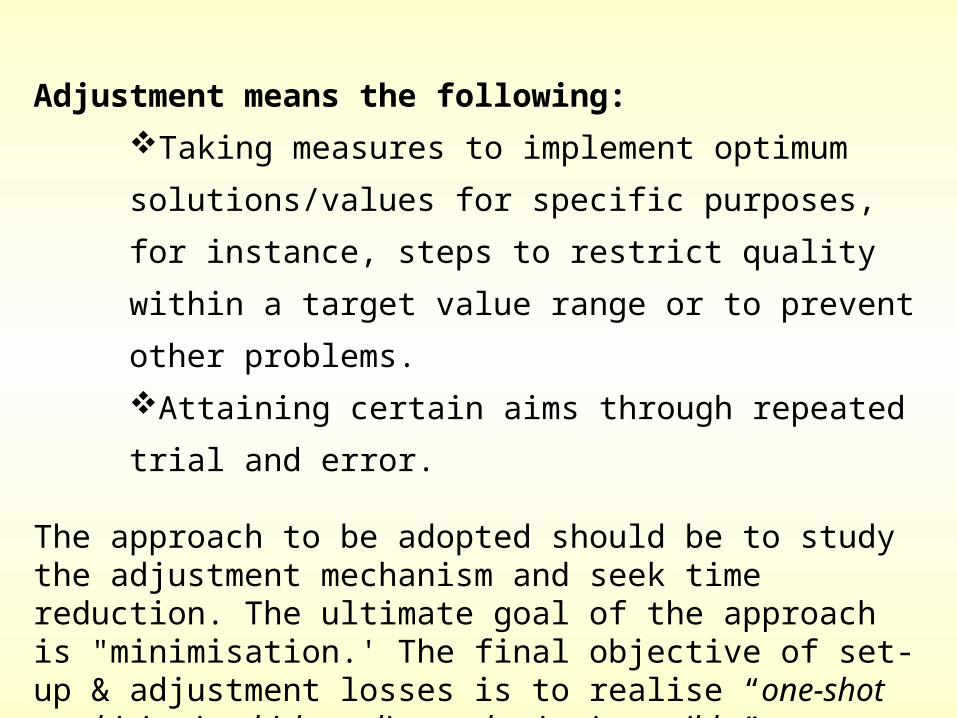
Adjustment means the following:Taking measures to implement optimum solutions/values
for specific purposes, for instance, steps to restrict quality
within a target value range or to prevent other problems. Attaining certain aims through repeated trial and error.
The approach to be adopted should be to study the adjustment mechanism and seek time reduction. The ultimate goal of the approach is "minimisation.' The final objective of set-up & adjustment losses is to realise “one-shot machining in which quality production is possible ”. To realize one-shot arrangements, it is essential to reduce adjustment to zero.
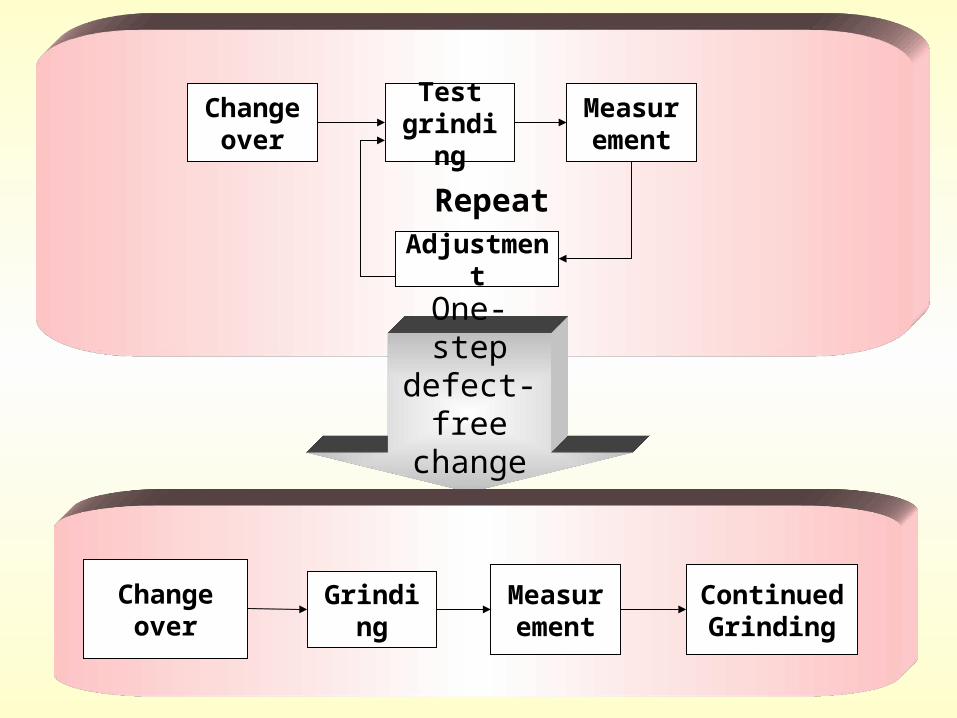
Change over
Test grinding
Measurement
Adjustment
Repeat
One-step defect-free
change over
Change over Grinding Measure
mentContinued Grinding
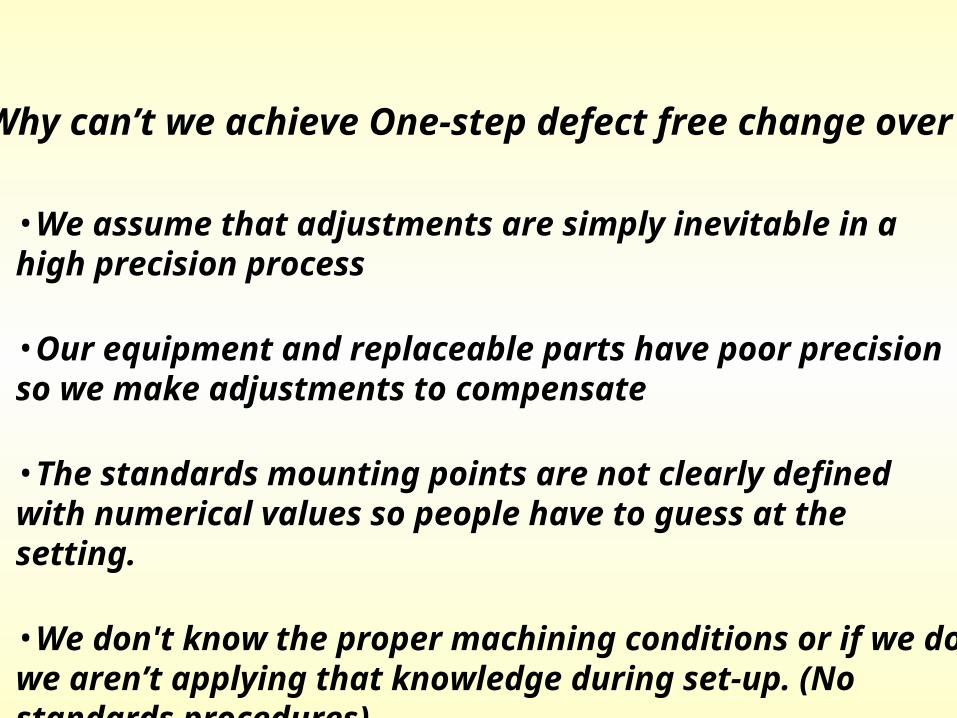
Why can’t we achieve One-step defect free change over ?
•We assume that adjustments are simply inevitable in a high precision process
•Our equipment and replaceable parts have poor precision so we make adjustments to compensate
•The standards mounting points are not clearly defined with numerical values so people have to guess at the setting.
•We don't know the proper machining conditions or if we do we aren’t applying that knowledge during set-up. (No standards procedures)
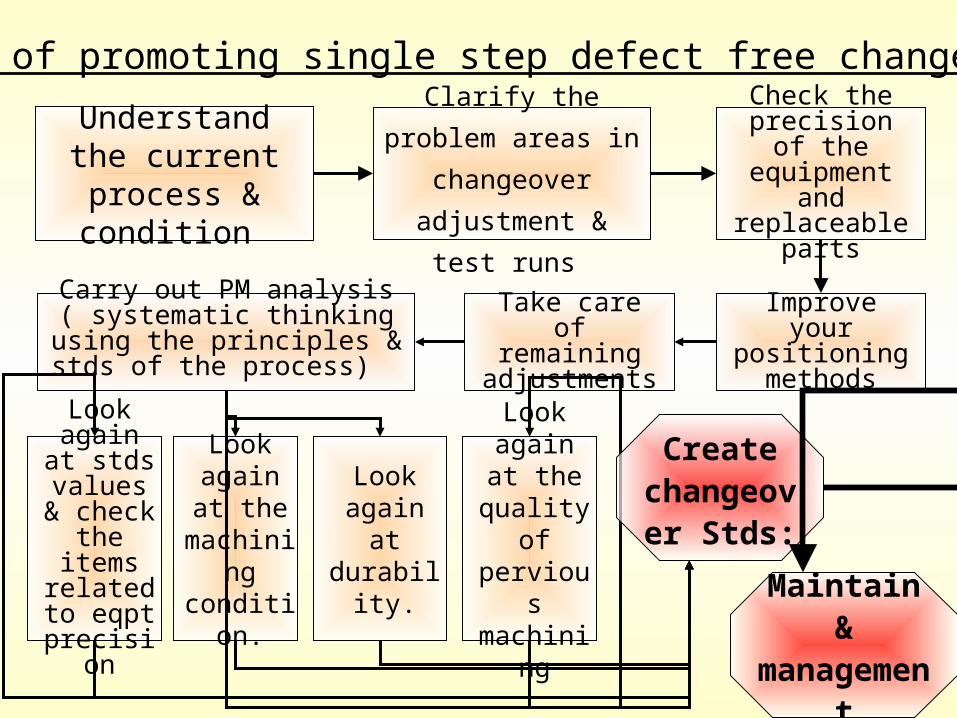
Steps of promoting single step defect free change over
Understand the current process &
condition
Clarify the problem areas in changeover
adjustment & test runs
Check the precision of the equipment and
replaceable parts
Improve your positioning
methods
Take care of remaining
adjustments
Carry out PM analysis ( systematic thinking using the
principles & stds of the process)
Look again at stds
values & check the
items related to
eqpt precision
Look again at
the machining condition.
Look again at
durability.
Look again at the
quality of pervious
machining
Create changeover
Stds:
Maintain & management


(3) Cutting-blade losses
These are time losses due to regular cutting-blade exchanges and
extraordinary replacement necessitated by blade damage and volume
losses (defects and rework) that arise before and after blade replacement.
Cutting-blade losses are dropping due to material and shape studies
yielding longer blade life, but they still pose a problem requiring further
study.
In the case of transfer machines, cutting- blade losses may account for 10% to 12% of overall efficiency impedance, because the number of operators is few in relation to the number of the machines.
The reduction of cutting-blade losses requires study in both the fields of relevant technology (material changes, shape alteration, etc.) and software (vibration measurement and pursuit of optimum cutting conditions). The target is the maximisation of blade life
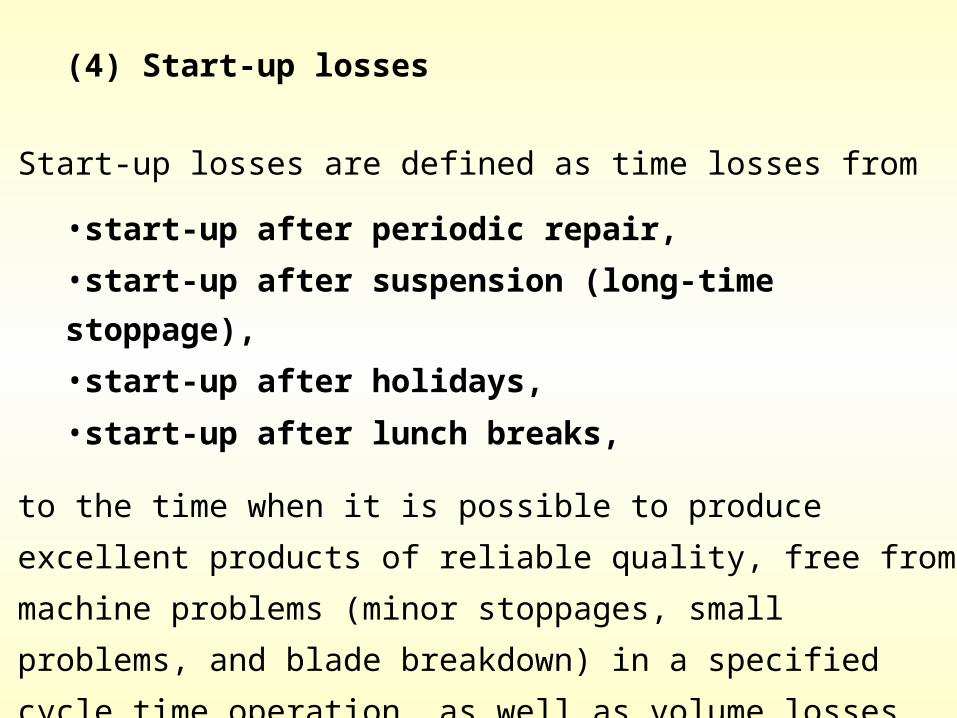
(4) Start-up losses
Start-up losses are defined as time losses from
•start-up after periodic repair,•start-up after suspension (long-time stoppage),•start-up after holidays,•start-up after lunch breaks,
to the time when it is possible to produce excellent products of reliable quality,
free from machine problems (minor stoppages, small problems, and blade
breakdown) in a specified cycle time operation, as.well as volume losses
(defects/ rework) that arise during that period.
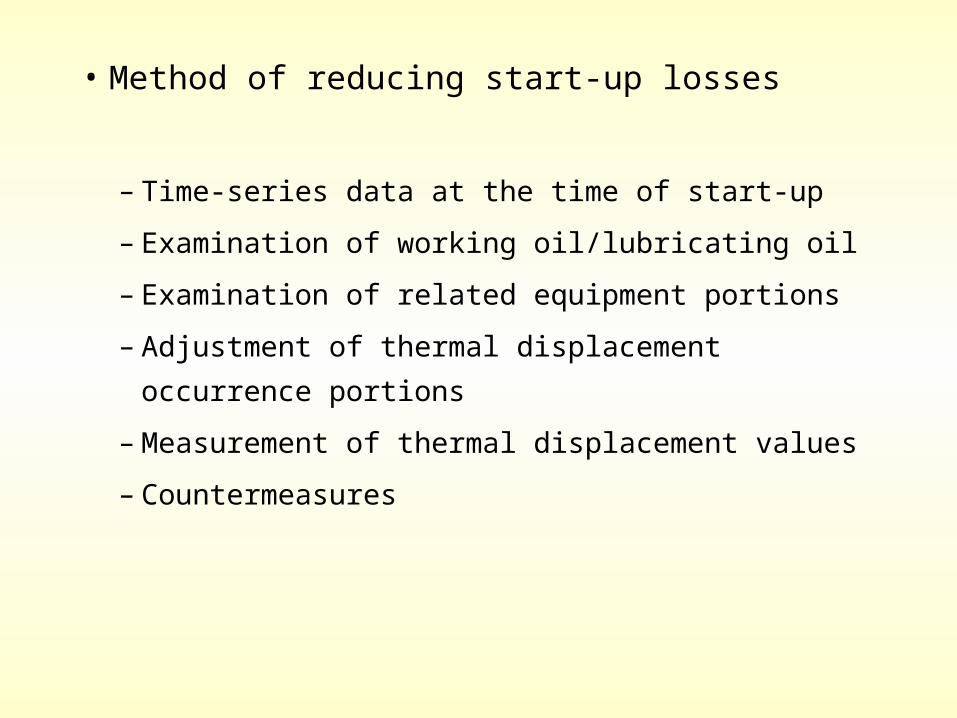
• Method of reducing start-up losses
– Time-series data at the time of start-up
– Examination of working oil/lubricating oil
– Examination of related equipment portions
– Adjustment of thermal displacement occurrence portions
– Measurement of thermal displacement values
– Countermeasures
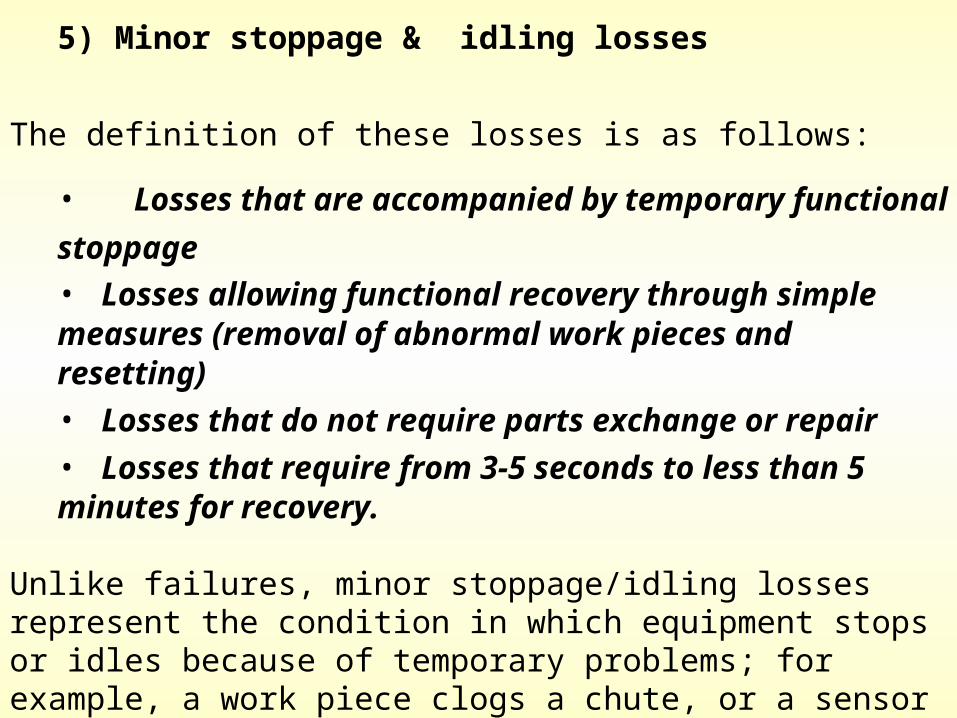
5) Minor stoppage & idling losses
The definition of these losses is as follows:
• Losses that are accompanied by temporary functional stoppage• Losses allowing functional recovery through simple measures (removal of abnormal work pieces and resetting)• Losses that do not require parts exchange or repair• Losses that require from 3-5 seconds to less than 5 minutes for recovery.
Unlike failures, minor stoppage/idling losses represent the condition in which equipment stops or idles because of temporary problems; for example, a work piece clogs a chute, or a sensor is triggered by a quality defect, temporarily stopping the machine. In this case, if the work piece is removed and resetting is done, the machine will operate normally. Thus, this condition is different in character from equipment failure
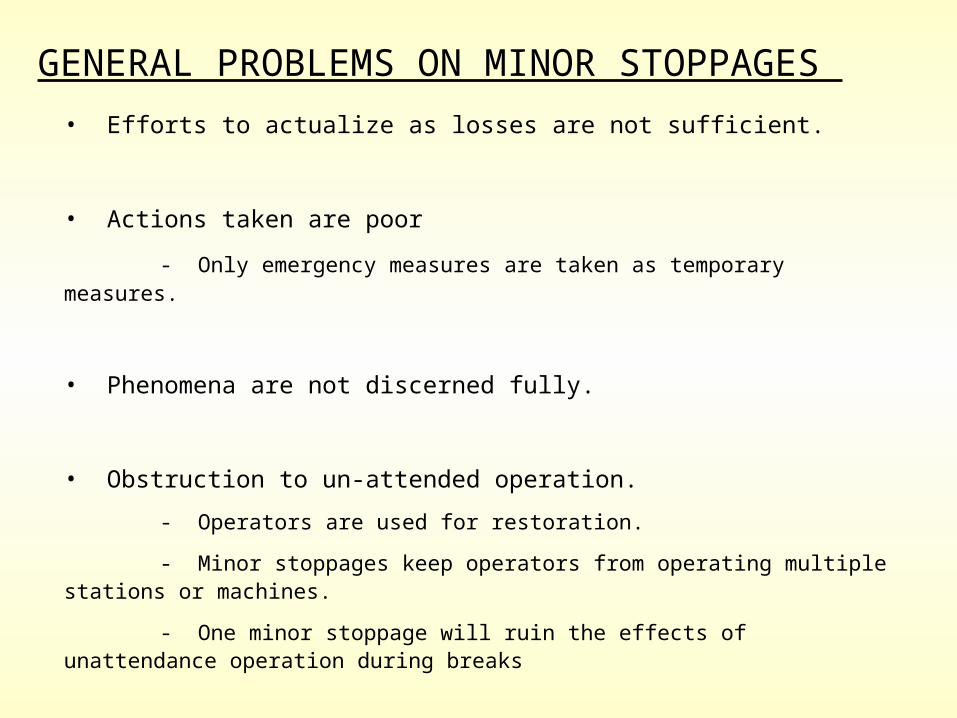
GENERAL PROBLEMS ON MINOR STOPPAGES • Efforts to actualize as losses are not sufficient.
• Actions taken are poor
- Only emergency measures are taken as temporary measures.
• Phenomena are not discerned fully.
• Obstruction to un-attended operation.
- Operators are used for restoration.
- Minor stoppages keep operators from operating multiple stations or machines.
- One minor stoppage will ruin the effects of unattendance operation during breaks
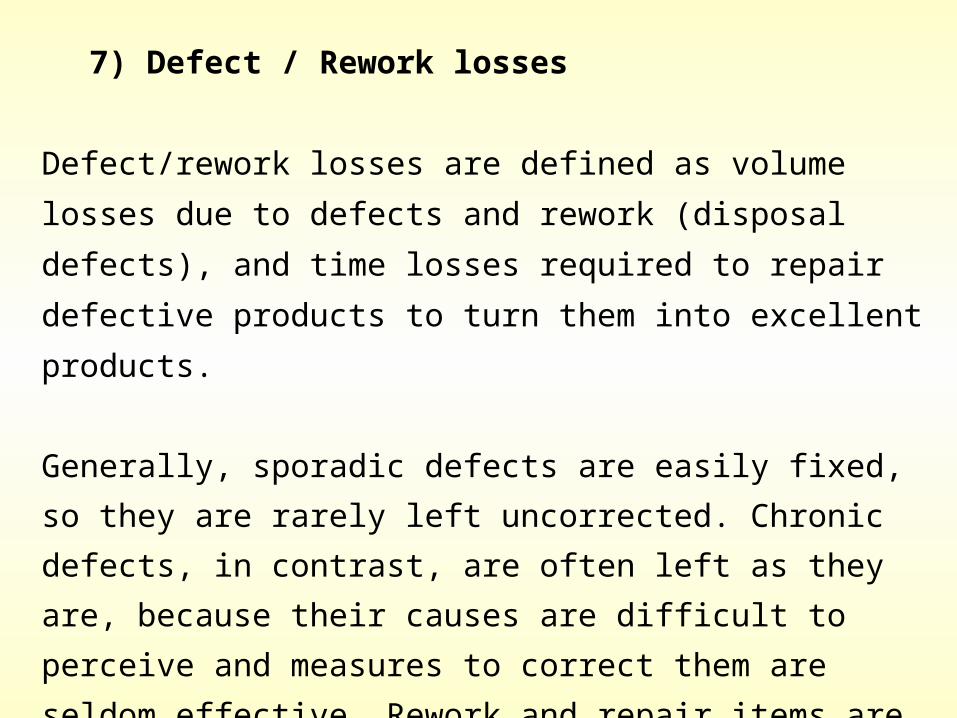
7) Defect / Rework losses
Defect/rework losses are defined as volume losses due to defects and rework (disposal defects), and time losses required to repair defective products to turn them into excellent products.
Generally, sporadic defects are easily fixed, so they are rarely left uncorrected. Chronic defects, in contrast, are often left as they are, because their causes are difficult to perceive and measures to correct them are seldom effective. Rework and repair items are also regarded as chronic defects, because modification worker-hours are required


Basic principle of quality maintenance
Quality DefectsDefects due to
equipment precision
Defects due to Machining conditions
Defects due to People
involved
Creation of equipment that doesn’t produce defects
Train operators who know their equipment well
Setting std: conditions for equipment that doesn’t
produce defects
Fostering maintenance management ability
Management of std: condition that doesn’t produce defects
Zero defects
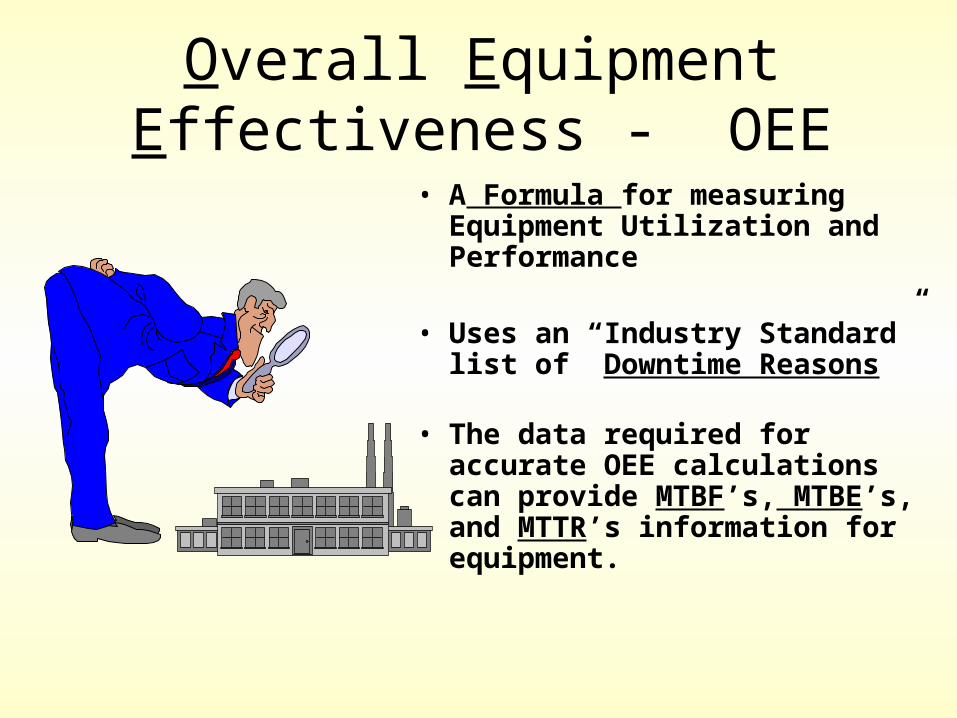
Overall Equipment Effectiveness - OEE
• A Formula for measuring Equipment Utilization and Performance
• Uses an “Industry Standard” list of Downtime Reasons
• The data required for accurate OEE calculations can provide MTBF’s, MTBE’s, and MTTR’s information for equipment.
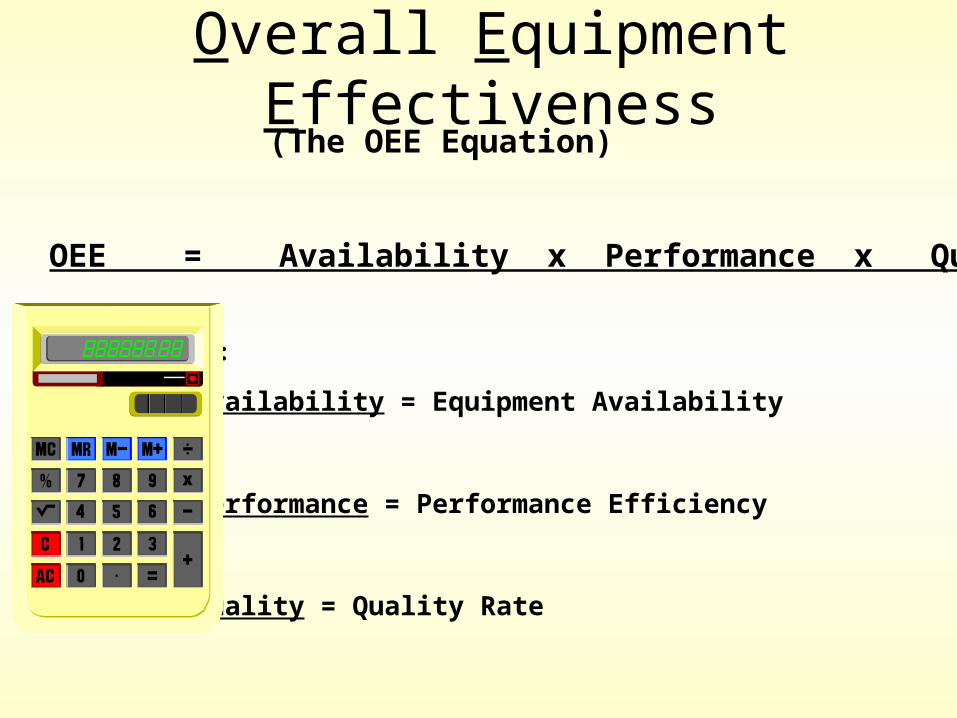
Overall Equipment Effectiveness
OEE = Availability x Performance x Quality
where:
Availability = Equipment Availability
Performance = Performance Efficiency
Quality = Quality Rate
(The OEE Equation)
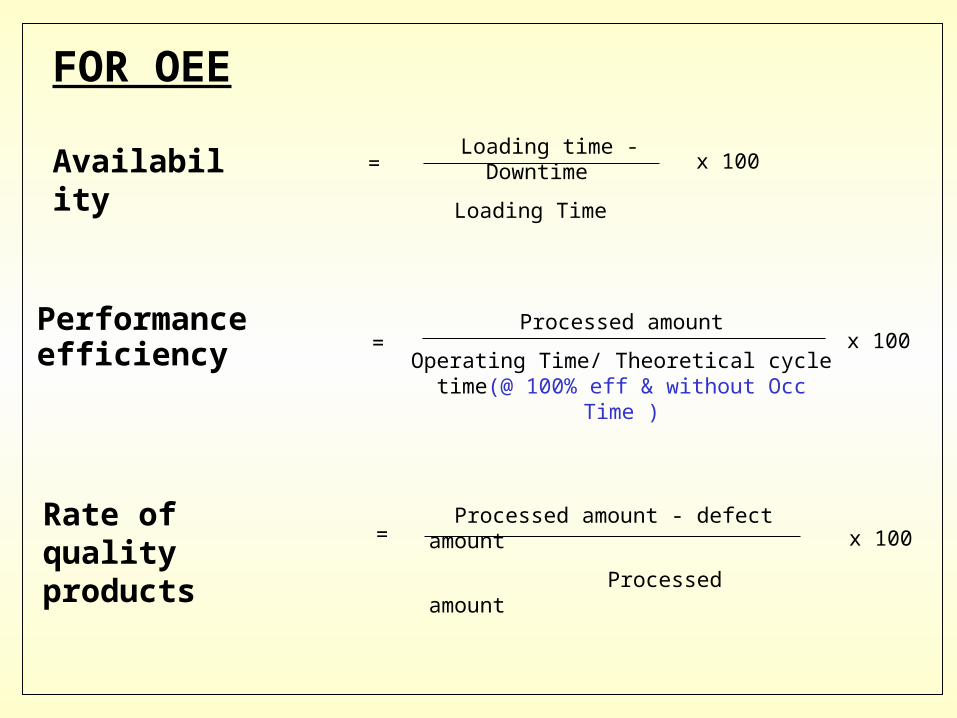
Loading time - Downtime
Loading Time = x 100 Availability
Performance efficiency
Processed amount
Operating Time/ Theoretical cycle time(@ 100% eff & without Occ Time )
x 100 =
Rate of quality products
Processed amount - defect amount
Processed amount = x 100
FOR OEE
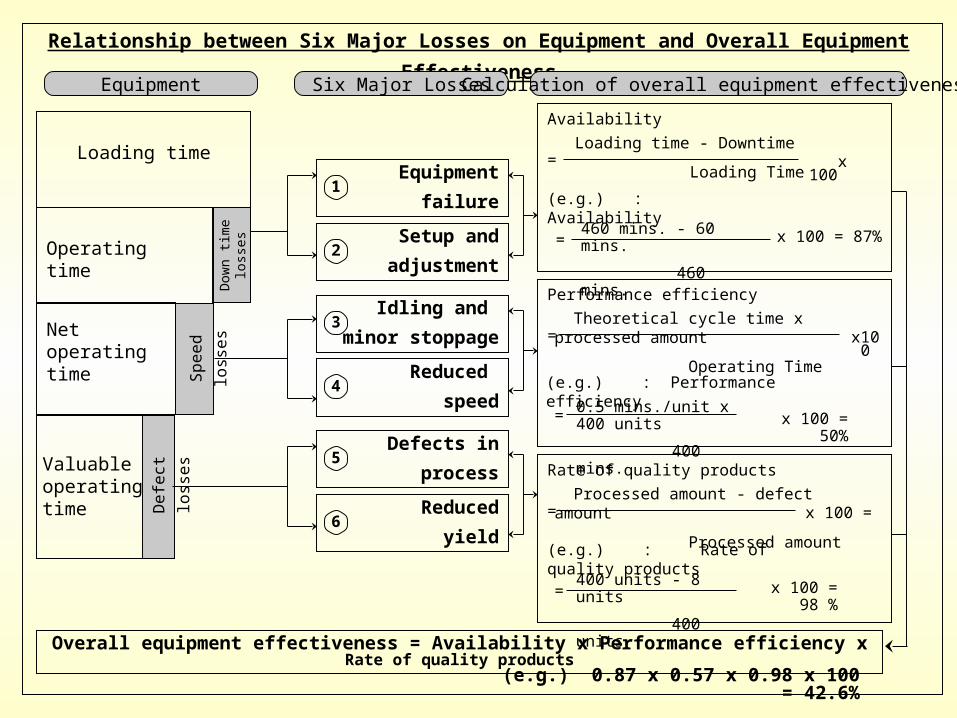
Relationship between Six Major Losses on Equipment and Overall Equipment Effectiveness
Availability Loading time - Downtime
Loading Time = x 100
= x 100 = 87%460 mins. - 60 mins.
460 mins.
(e.g.) : Availability
Performance efficiency Theoretical cycle time x processed amount
Operating Time = x100
= x 100 = 50%0.5 mins./unit x 400 units
400 mins.
(e.g.) : Performance efficiency
Rate of quality products Processed amount - defect amount
Processed amount = x 100 =
= x 100 = 98 %
400 units - 8 units
400 units
(e.g.) : Rate of quality products
Overall equipment effectiveness = Availability x Performance efficiency x Rate of quality products
(e.g.) 0.87 x 0.57 x 0.98 x 100 = 42.6%
Equipment failure
1
Operating timeD
own
time
loss
es
Net operating time S
peed
lo
sses
Valuable operating time
Def
ect l
osse
sLoading time
Setup andadjustment
2
Idling and minor stoppage
3
Reduced speed
4
Defects inprocess
5
Reducedyield
6
Equipment Six Major Losses Calculation of overall equipment effectiveness
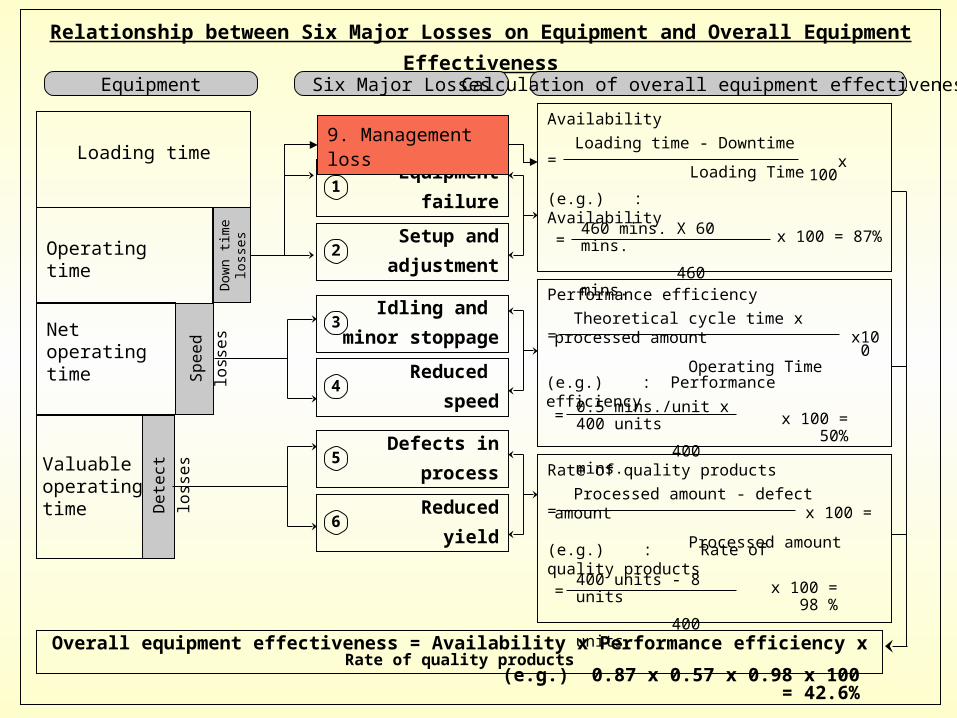
Relationship between Six Major Losses on Equipment and Overall Equipment Effectiveness
Availability Loading time - Downtime
Loading Time = x 100
= x 100 = 87%460 mins. X 60 mins.
460 mins.
(e.g.) : Availability
Performance efficiency Theoretical cycle time x processed amount
Operating Time = x100
= x 100 = 50%0.5 mins./unit x 400 units
400 mins.
(e.g.) : Performance efficiency
Rate of quality products Processed amount - defect amount
Processed amount = x 100 =
= x 100 = 98 %
400 units - 8 units
400 units
(e.g.) : Rate of quality products
Overall equipment effectiveness = Availability x Performance efficiency x Rate of quality products
(e.g.) 0.87 x 0.57 x 0.98 x 100 = 42.6%
Equipment failure
1
Operating timeD
own
time
loss
es
Net operating time S
peed
lo
sses
Valuable operating time
Det
ect l
osse
sLoading time
Setup andadjustment
2
Idling and minor stoppage
3
Reduced speed
4
Defects inprocess
5
Reducedyield
6
Equipment Six Major Losses Calculation of overall equipment effectiveness
9. Management loss

Overall Equipment Effectiveness =
A x P x Q
Processed amount - defect amount
Loading Time/ Theoretical cycle time(@ 100% eff & without Occ Time )

For Calculating the OEE for the line,
the line is considered as one entity (machine)
1 32 4
5 76 8IN
OUT
Std output of the line is taken

Overall Planned effectiveness
Availability Loading time - Downtime
Loading Time = x 100
= x 100
(e.g.) : Availability
Performance efficiency
Actual average Production
Standard production= x
100
= x 100
(e.g.) : Performance efficiency
Rate of quality products
Production - 7 8
Production = x 100 =
= x 100
(e.g.) : Rate of quality products
Overall planned effectiveness = Availability x Performance efficiency x Rate of quality products
Planned Maintenance & Equipment
failure1
Running B Hours Lo
ss b
y S
uspe
nsio
n
Operation C Hours
Loss
by
stop
page
Net Operation HoursD Lo
ss B
y C
apac
ityCalander Hours
A
Production control
2
Equipment breakdown3
Process breakdown4
Regular Production5
Irregular production6
Equipment Six Major Losses Calculation of overall equipment effectiveness
Valu
able
op
erat
ing
time
E
Loss
By
Def
icie
ncy
Process deficiency
7
Reprocessing8
CA
CD
DE
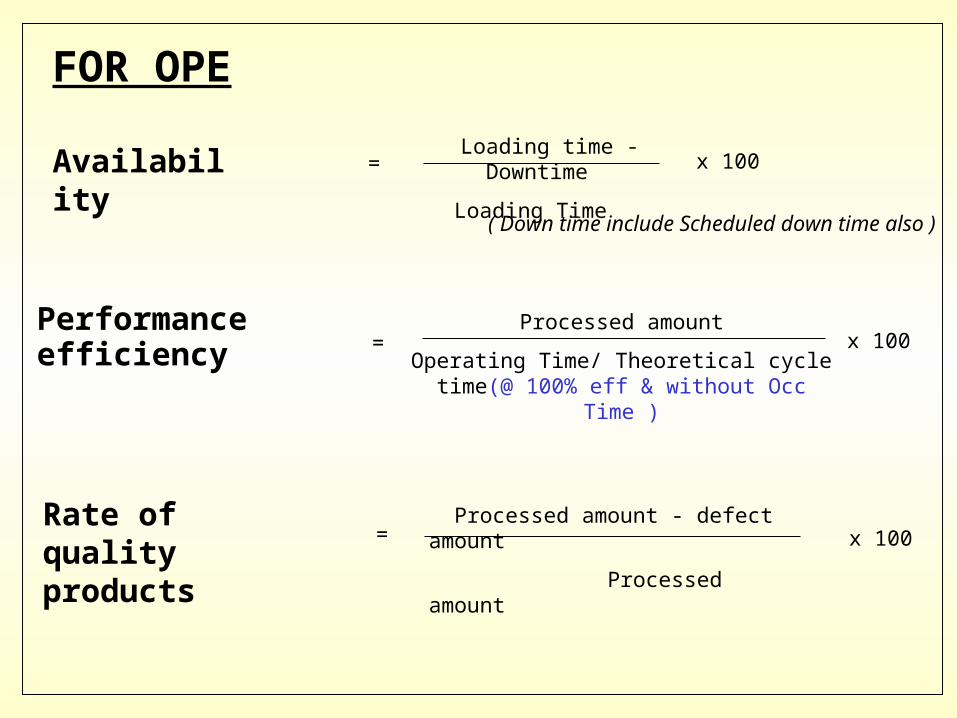
Loading time - Downtime
Loading Time = x 100 Availability
Performance efficiency
Processed amount
Operating Time/ Theoretical cycle time(@ 100% eff & without Occ Time )
x 100 =
Rate of quality products
Processed amount - defect amount
Processed amount = x 100
FOR OPE
( Down time include Scheduled down time also )

PRODUCTIVITYMEASUREMENT SYSTEM
Performance Efficiency
OEE
Quality Rate
Setup AdjustBreakdowns Tooling
Availability
Startup Losses
•Maintenance repair histories
•Operator log sheets
•Equipment failure reports
•Process Controllers
Examples:•Wear Part failure•Utility failure•Equipment jam•Lubrication failure
•Process Controllers
•Production schedules
•Setup log sheets
•Tool changeover report
•Production control system
Examples:•Part Changeover•Die Change•Tooling Change•Limit Switch adjust•Set point Adjustment•Running of test Parts
•Process Controllers
•Production log sheets
•FMEA
Examples:•Cutting tool wearout•Injection Mold failure•Stamping Die failure
•Operator log sheet
•Process Controllers
•Production count
•Start meters
Examples:•Injection Molding machine partial full on initial run.
Idling & Minor Stoppages
Speed Losses
•Process Controllers
•Operator log sheet
Examples:•Running at less than
design speed to meet quality specifications
•Not knowing the capability of a machine or line.
•Operator check off document
•Process Controllers
Examples:•Machine Jam•Manual adjustment•Material misalignment•Machine reset
•Production Reports
•Quality Control Charts
•Reject rates
Quality Defects
Major Losses
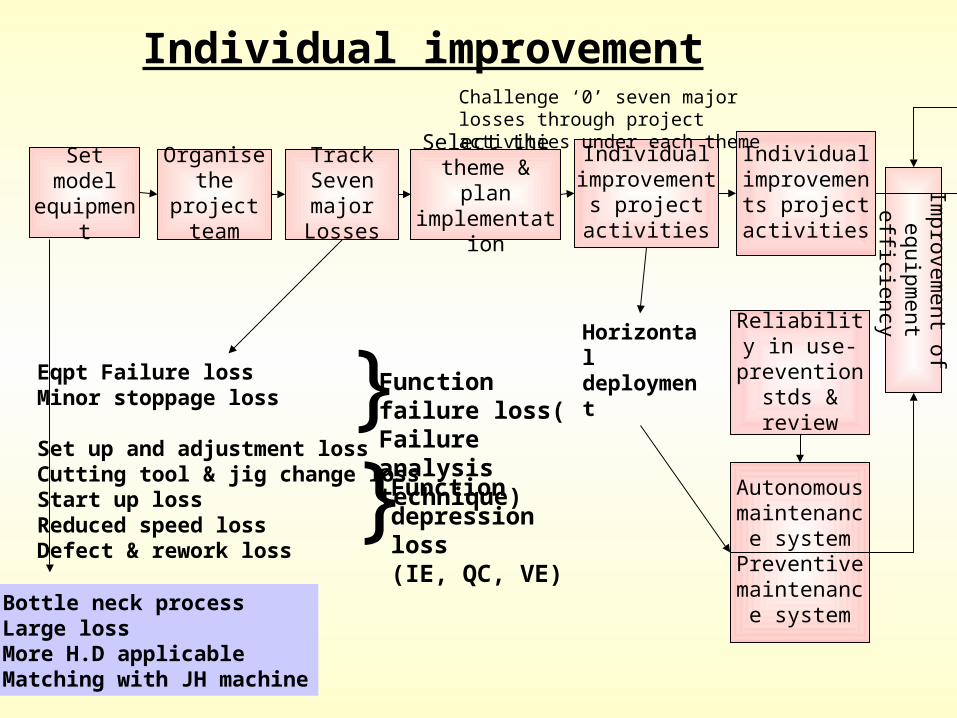
Set model equipment
Organise the project team Im
provement of
equipment efficiency
Track Seven major Losses
Select the theme & plan
implementation
Individual improvements
project activities
Individual improvements
project activities
Reliability in use- prevention stds & review
Autonomous maintenance
systemPreventive
maintenance system
Horizontal deployment
Bottle neck processLarge lossMore H.D applicableMatching with JH machine
Eqpt Failure lossMinor stoppage loss
Set up and adjustment lossCutting tool & jig change lossStart up lossReduced speed lossDefect & rework loss
}}
Function failure loss( Failure analysis technique)
Function depression loss(IE, QC, VE)
Challenge ‘0’ seven major losses through project activities under each theme
Individual improvement

Sporadic & chronic losses
Division Sporadic loss Chronic loss
Loss Mode
Entirely new phenomenon suddenly occurs. Phenomenon occurs suddenly after exceeding a certain dispersion range
Phenomenon occurs within a certain dispersion range -Repeated in short cycles -Phenomenon always occurs with certain quantitative dispersions
Actualization Recognized as loss compared with present level.
Actualize as loss compared between maximum value and technical level
CauseCasual sequence is relatively monotonous. Can be guessed by past experience and intuition in many cases
Casual sequence is not clear and cause system is compounding. Past experience and intuition do not work.
CountermeasureMost cases can be solved on the spot. Restorative measures will work.
Cannot be solved even if various actions are taken. Renovating countermeasure are needed.
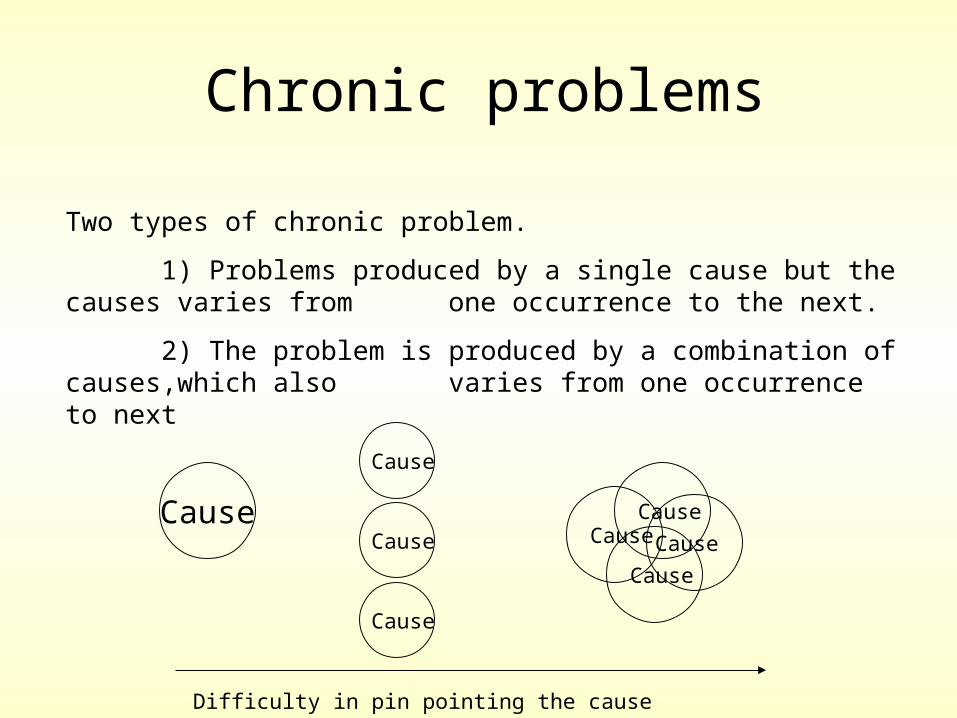
Chronic problems
Two types of chronic problem.
1) Problems produced by a single cause but the causes varies from one occurrence to the next.
2) The problem is produced by a combination of causes,which also varies from one occurrence to next
Cause
Cause Cause
Cause
CauseCause
CauseCause
Difficulty in pin pointing the cause
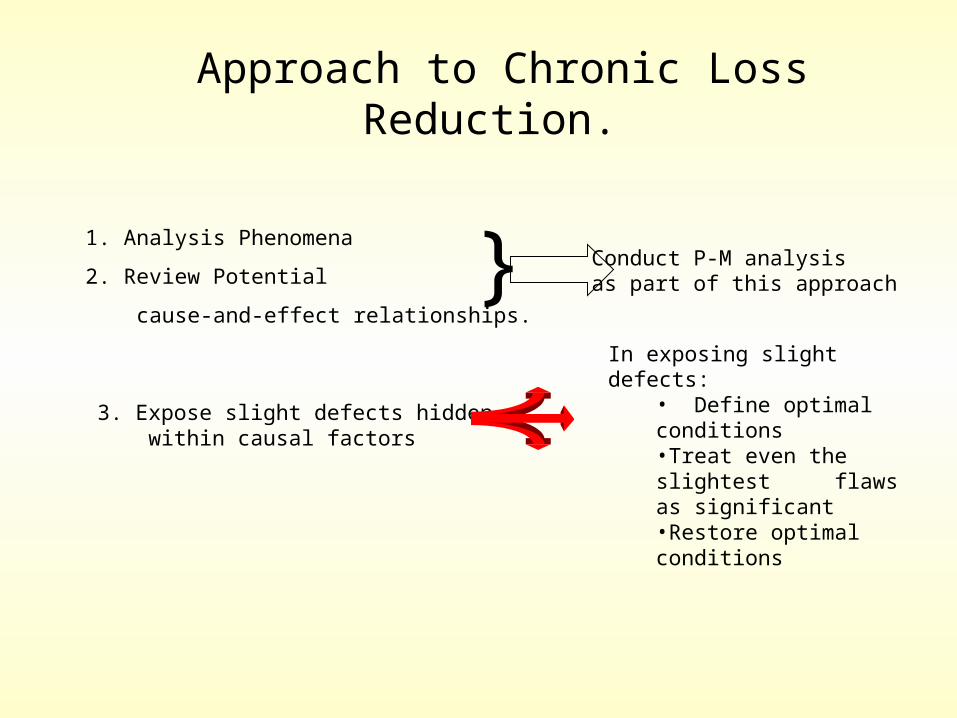
Approach to Chronic Loss Reduction.
1. Analysis Phenomena
2. Review Potential
cause-and-effect relationships.} Conduct P-M analysis
as part of this approach
3. Expose slight defects hidden within causal factors
In exposing slight defects:• Define optimal conditions•Treat even the slightest flaws as significant•Restore optimal conditions