Embed Size (px)
Citation preview
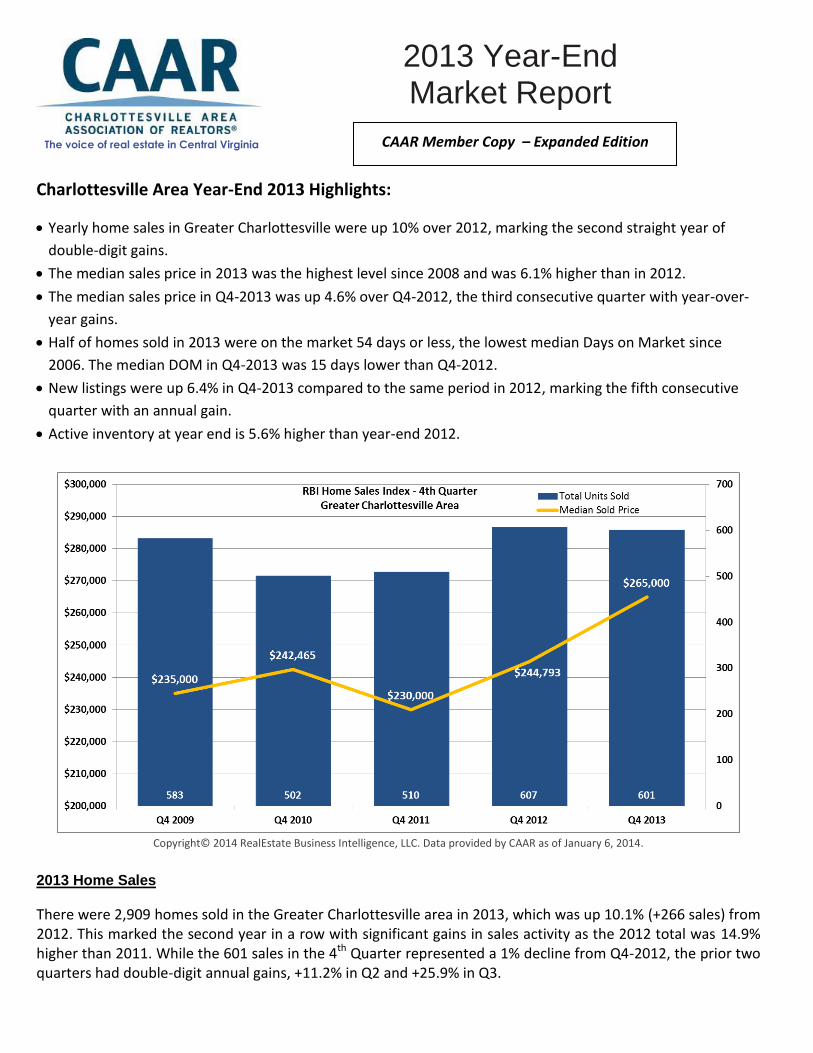
Charlottesville Area Year-End 2013 Highlights:
Yearly home sales in Greater Charlottesville were up 10% over 2012, marking the second straight year of
double-digit gains.
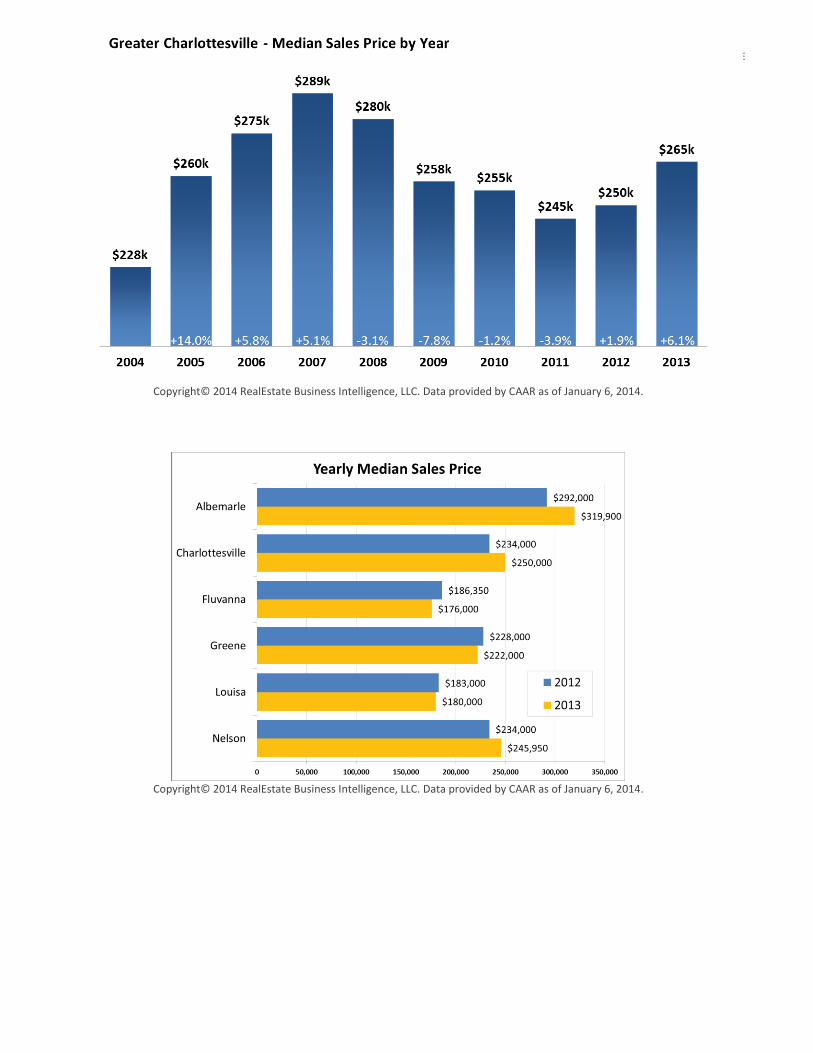
The median sales price in 2013 was the highest level since 2008 and was 6.1% higher than in 2012.
The median sales price in Q4-2013 was up 4.6% over Q4-2012, the third consecutive quarter with year-over-
year gains.
Half of homes sold in 2013 were on the market 54 days or less, the lowest median Days on Market since
2006. The median DOM in Q4-2013 was 15 days lower than Q4-2012.
New listings were up 6.4% in Q4-2013 compared to the same period in 2012, marking the fifth consecutive
quarter with an annual gain.
Active inventory at year end is 5.6% higher than year-end 2012.
Copyright© 2014 RealEstate Business Intelligence, LLC. Data provided by CAAR as of January 6, 2014.
2013 Home Sales
There were 2,909 homes sold in the Greater Charlottesville area in 2013, which was up 10.1% (+266 sales) from 2012. This marked the second year in a row with significant gains in sales activity as the 2012 total was 14.9% higher than 2011. While the 601 sales in the 4th Quarter represented a 1% decline from Q4-2012, the prior two quarters had double-digit annual gains, +11.2% in Q2 and +25.9% in Q3.
The voice of real estate in Central Virginia
2013 Year-End Market Report
2011 Year End Market Report Market ReportReport
CAAR Member Copy – Expanded Edition
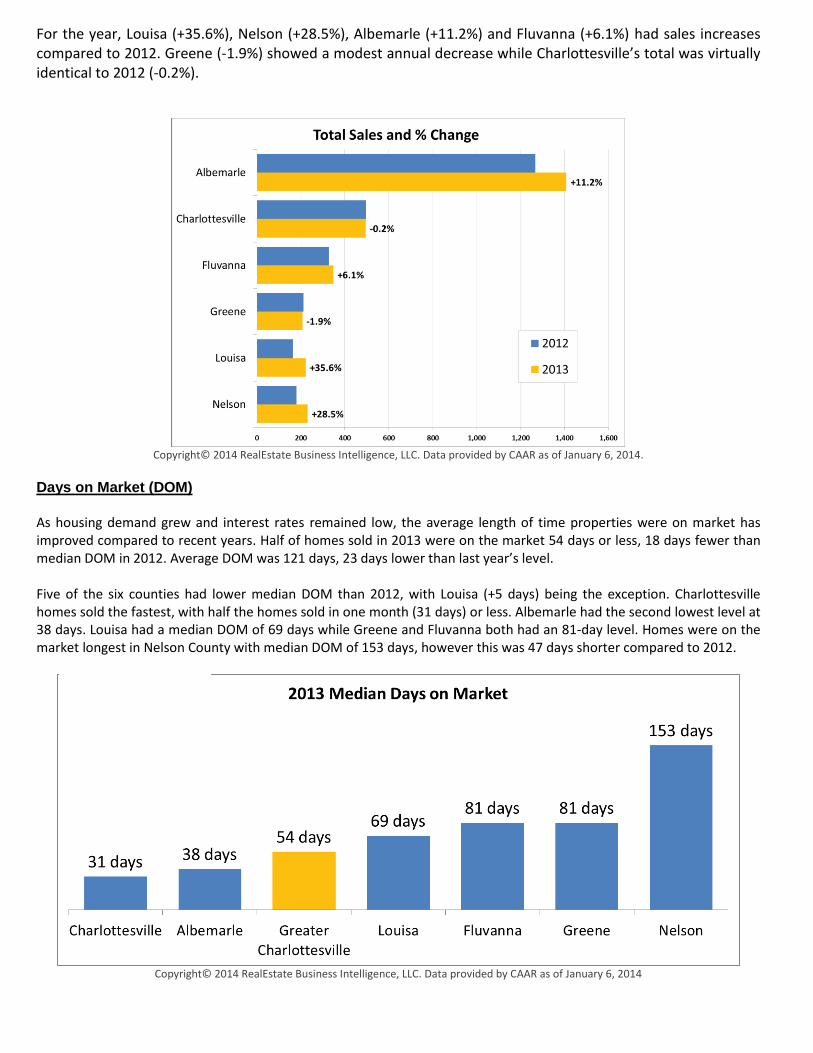
For the year, Louisa (+35.6%), Nelson (+28.5%), Albemarle (+11.2%) and Fluvanna (+6.1%) had sales increases compared to 2012. Greene (-1.9%) showed a modest annual decrease while Charlottesville’s total was virtually identical to 2012 (-0.2%).
Copyright© 2014 RealEstate Business Intelligence, LLC. Data provided by CAAR as of January 6, 2014.
Days on Market (DOM) As housing demand grew and interest rates remained low, the average length of time properties were on market has improved compared to recent years. Half of homes sold in 2013 were on the market 54 days or less, 18 days fewer than median DOM in 2012. Average DOM was 121 days, 23 days lower than last year’s level. Five of the six counties had lower median DOM than 2012, with Louisa (+5 days) being the exception. Charlottesville homes sold the fastest, with half the homes sold in one month (31 days) or less. Albemarle had the second lowest level at 38 days. Louisa had a median DOM of 69 days while Greene and Fluvanna both had an 81-day level. Homes were on the market longest in Nelson County with median DOM of 153 days, however this was 47 days shorter compared to 2012.
Copyright© 2014 RealEstate Business Intelligence, LLC. Data provided by CAAR as of January 6, 2014
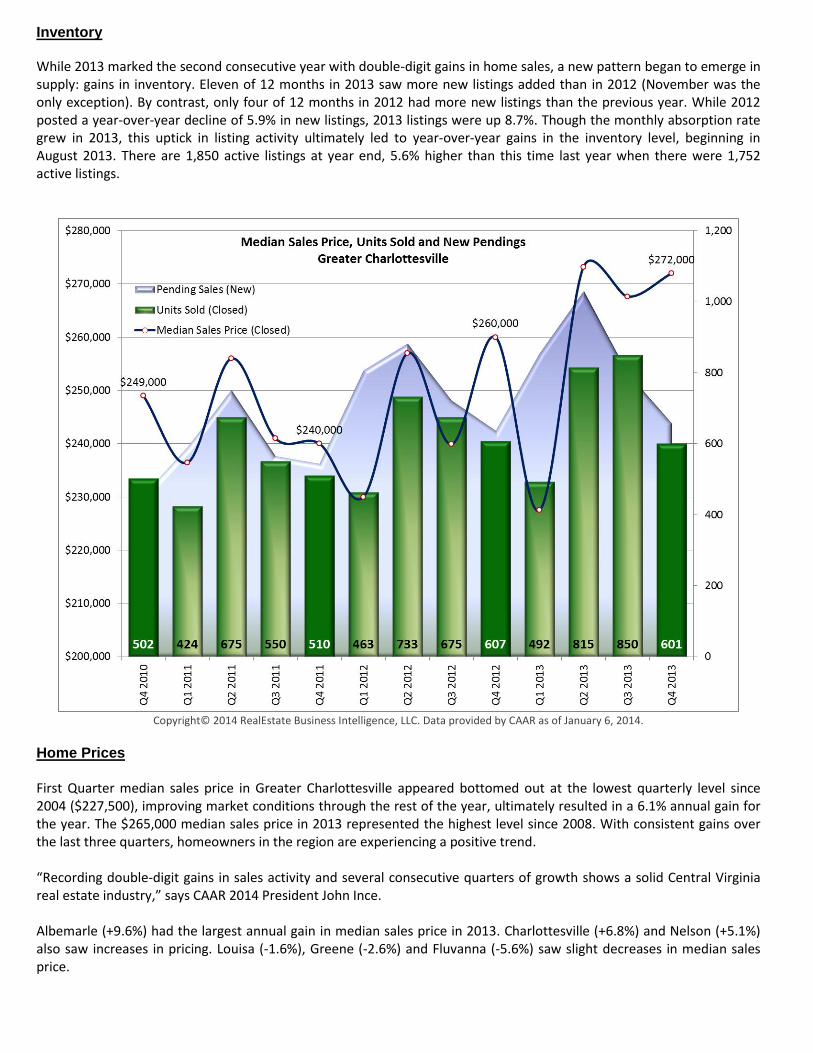
Inventory
While 2013 marked the second consecutive year with double-digit gains in home sales, a new pattern began to emerge in supply: gains in inventory. Eleven of 12 months in 2013 saw more new listings added than in 2012 (November was the only exception). By contrast, only four of 12 months in 2012 had more new listings than the previous year. While 2012 posted a year-over-year decline of 5.9% in new listings, 2013 listings were up 8.7%. Though the monthly absorption rate grew in 2013, this uptick in listing activity ultimately led to year-over-year gains in the inventory level, beginning in August 2013. There are 1,850 active listings at year end, 5.6% higher than this time last year when there were 1,752 active listings.
Copyright© 2014 RealEstate Business Intelligence, LLC. Data provided by CAAR as of January 6, 2014.
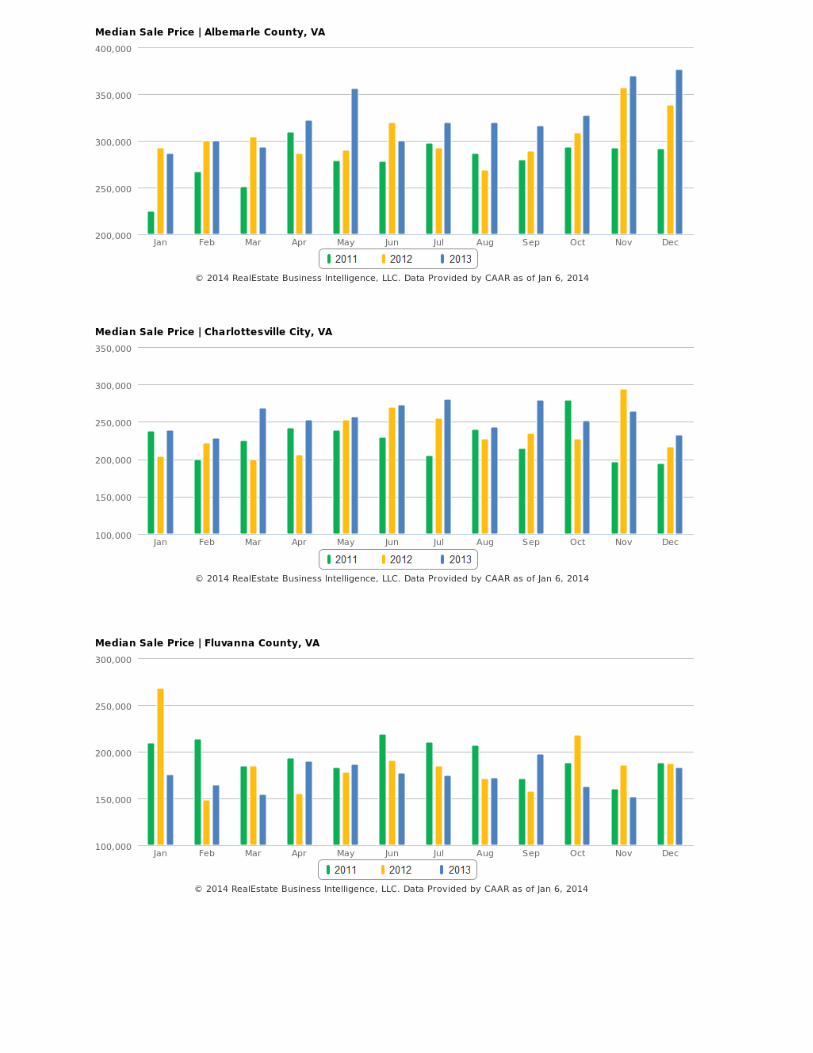
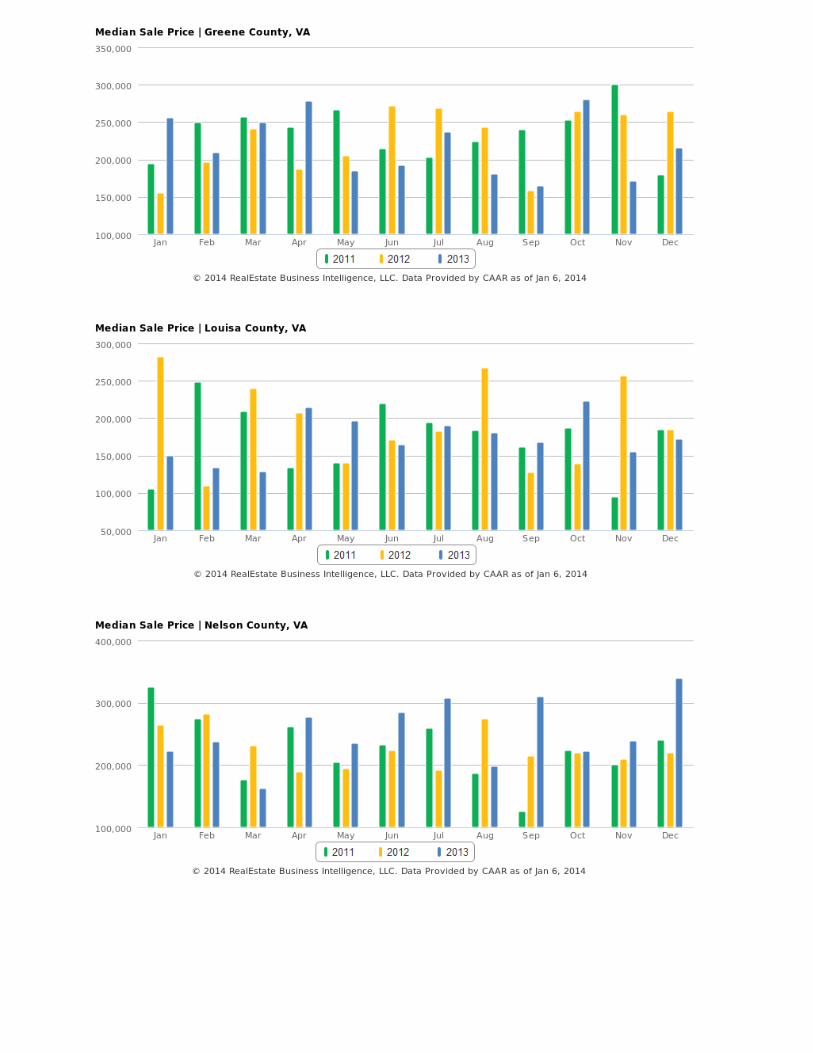
Home Prices First Quarter median sales price in Greater Charlottesville appeared bottomed out at the lowest quarterly level since 2004 ($227,500), improving market conditions through the rest of the year, ultimately resulted in a 6.1% annual gain for the year. The $265,000 median sales price in 2013 represented the highest level since 2008. With consistent gains over the last three quarters, homeowners in the region are experiencing a positive trend. “Recording double-digit gains in sales activity and several consecutive quarters of growth shows a solid Central Virginia real estate industry,” says CAAR 2014 President John Ince. Albemarle (+9.6%) had the largest annual gain in median sales price in 2013. Charlottesville (+6.8%) and Nelson (+5.1%) also saw increases in pricing. Louisa (-1.6%), Greene (-2.6%) and Fluvanna (-5.6%) saw slight decreases in median sales price.
Copyright© 2014 RealEstate Business Intelligence, LLC. Data provided by CAAR as of January 6, 2014.
Copyright© 2014 RealEstate Business Intelligence, LLC. Data provided by CAAR as of January 6, 2014.
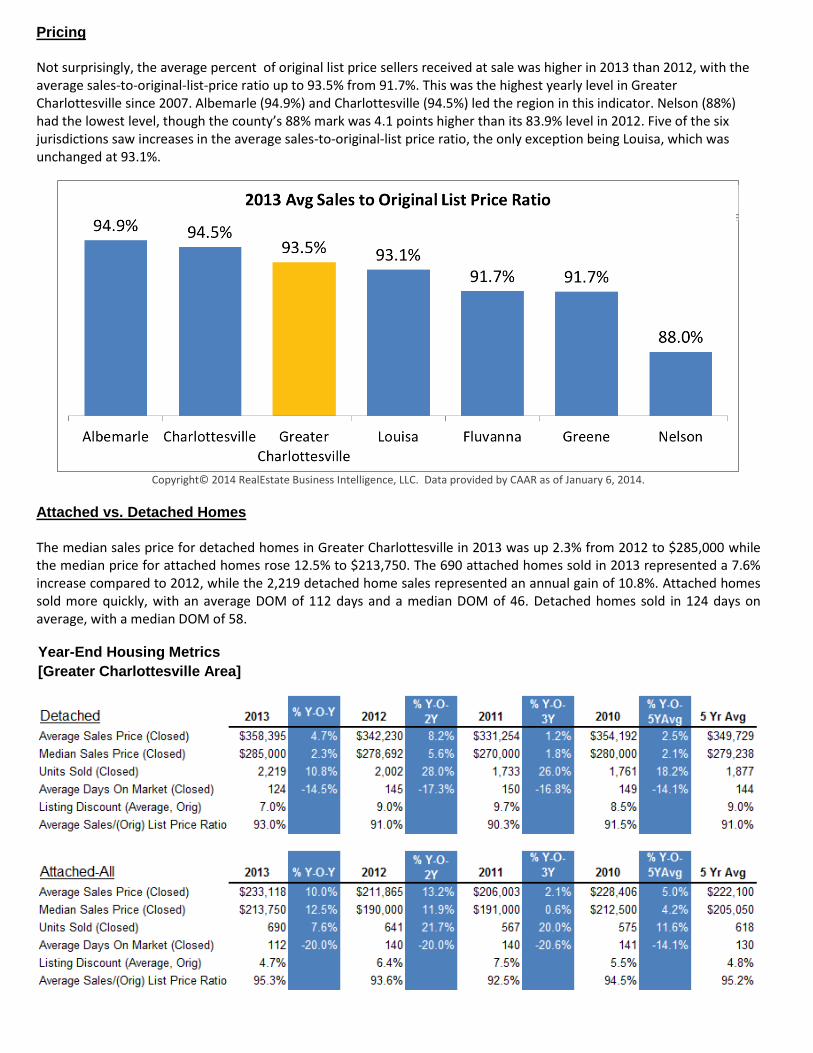
Pricing Not surprisingly, the average percent of original list price sellers received at sale was higher in 2013 than 2012, with the average sales-to-original-list-price ratio up to 93.5% from 91.7%. This was the highest yearly level in Greater Charlottesville since 2007. Albemarle (94.9%) and Charlottesville (94.5%) led the region in this indicator. Nelson (88%) had the lowest level, though the county’s 88% mark was 4.1 points higher than its 83.9% level in 2012. Five of the six jurisdictions saw increases in the average sales-to-original-list price ratio, the only exception being Louisa, which was unchanged at 93.1%.
Copyright© 2014 RealEstate Business Intelligence, LLC. Data provided by CAAR as of January 6, 2014.
Attached vs. Detached Homes
The median sales price for detached homes in Greater Charlottesville in 2013 was up 2.3% from 2012 to $285,000 while the median price for attached homes rose 12.5% to $213,750. The 690 attached homes sold in 2013 represented a 7.6% increase compared to 2012, while the 2,219 detached home sales represented an annual gain of 10.8%. Attached homes sold more quickly, with an average DOM of 112 days and a median DOM of 46. Detached homes sold in 124 days on average, with a median DOM of 58.
Year-End Housing Metrics
[Greater Charlottesville Area]
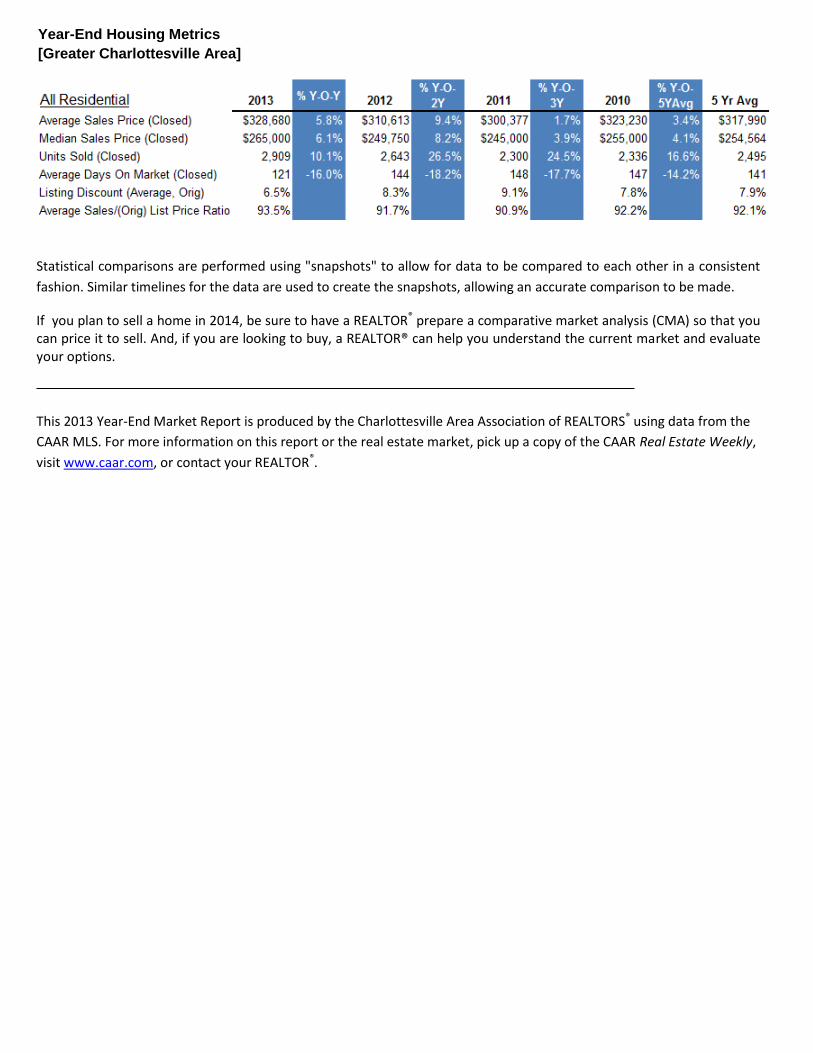
Statistical comparisons are performed using "snapshots" to allow for data to be compared to each other in a consistent
fashion. Similar timelines for the data are used to create the snapshots, allowing an accurate comparison to be made.
If you plan to sell a home in 2014, be sure to have a REALTOR® prepare a comparative market analysis (CMA) so that you can price it to sell. And, if you are looking to buy, a REALTOR® can help you understand the current market and evaluate your options.
This 2013 Year-End Market Report is produced by the Charlottesville Area Association of REALTORS® using data from the
CAAR MLS. For more information on this report or the real estate market, pick up a copy of the CAAR Real Estate Weekly,
visit www.caar.com, or contact your REALTOR®.
Year-End Housing Metrics
[Greater Charlottesville Area]