Embed Size (px)
Citation preview

EXECUTIVE SUMMARY
MIXED USE LAND DEVELOPMENT
JL. DAAN MOGOT KM 12,8
JAKARTA BARAT
January 2017

Land Location Jl. Daan Mogot Km 12,8 Kel. Rawa Buaya Kec. Cengkareng , Jakarta Barat

LAND LOCATION
Administratively, land location located in Rawa Buayadistrict. Cengkareng, West Jakarta, precisely located at Jl.Daan Mogot (south side) and Jl. Kembangan Baru (westside), so this land has a beneficial interest related to itsaccessibility as it can be accessed through Jl. Daan Mogot(main access) and Jl. Kembangan Baru (secondary access) asshown in Figure 1.
This land location can also be accessed via the Outer RingToll road which is only about 2 km from the land location. Inthe presence of toll roads is relatively close to the landlocation, then the achievement of the location andotherwise to a new sub urban development (new town) andto CBD (Central Business District) at northern region (PantaiIndah Kapuk, reclamation area coast) including theobjective to Soekarno Hatta Airport and southern regions(Bumi Serpong Damai), CBD Jakarta will be easier.
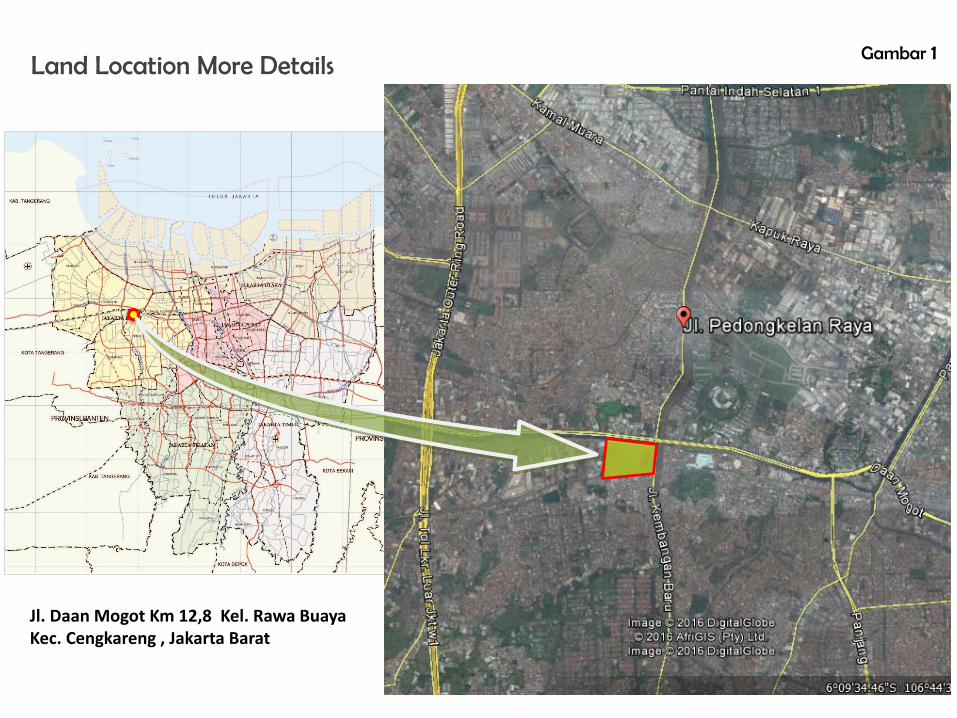
Land Location More Details
Jl. Daan Mogot Km 12,8 Kel. Rawa Buaya Kec. Cengkareng , Jakarta Barat
Gambar 1

LAND INTENSITY & LEGALITY
In accordance with DKI Jakarta ProvincialRegulation No. 1 Year 2014 on Detailed SpatialPlan (RDTR) and Zoning Regulations (PZ) is amixed use land use (Residential & Commercial)with the intensity of land as the following Table
Legality Land: Clear & Clean.
Land Intensity Regulation
Development Area 17,2 Ha
Building Floor Area Ratio (FAR) 3,5
Building Coverage Ratio 45%
Building Height 16 Floors
Green Area Ratio 30%
Basement Footprint Ratio 55%
Land Use : Mixed Use (Residential & Commercial)

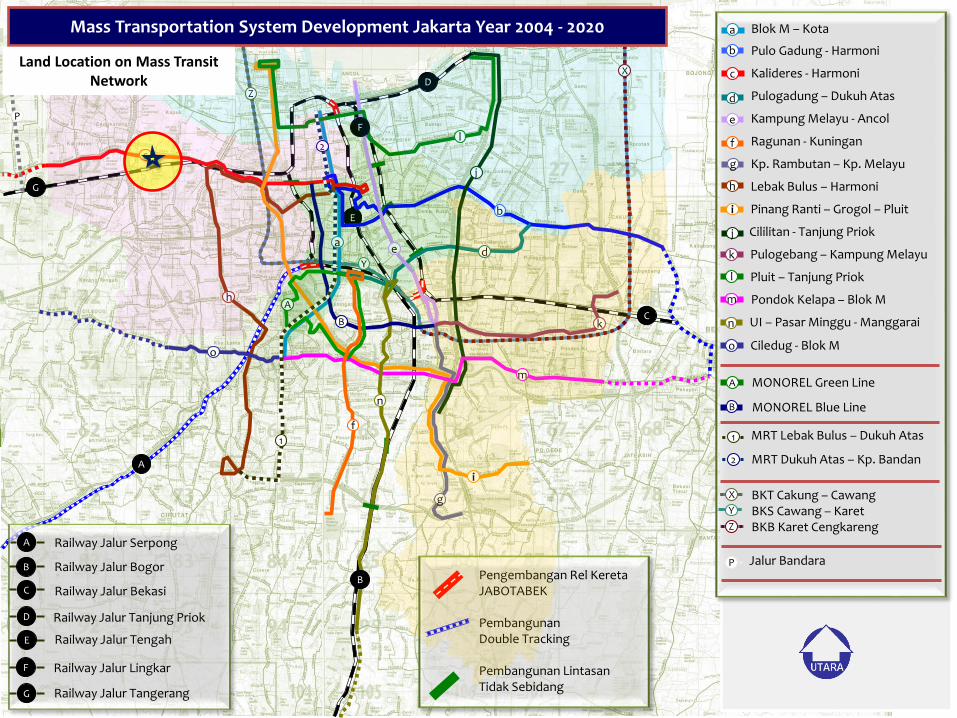
LAND LOCATION ON THE MASS TRANSPORT NETWORK
Jakarta as a metropolitan city where the daily movement about 25.4 million tripsincluding trips Bodetabek (Bogor, Depok, Tangerang and Bekasi). From the totaltrips (25.4 million trips), only about 19% of trips using public transport, includingTransjakarta buses, large buses, medium and small and trains, while most of thetrip (over 80%) use private transport modes.
In the next few years, the intensity of the density of development in Jakarta willcontinue to grow. It can be seen from the number of integrated areadevelopment plan that has a high skyscraper and the main land-use mix.Obviously this will have an impact on increasing the number of trips thatoccurred in the city and the higher the level of congestion.
In seeking a solution to the congestion problem above, the Jakarta ProvincialGovernment and the Central Government has been doing development basedmass transport modes road and rail (Busway, LRT, MRT). With the integration ofmodes of mass transportation is later coupled with traffic restrictions (trafficrestraint), the government's target in 2030 is 60% of public transport users and40% of private transport.
Thus the land that is supported by good mass transportation which is aSTARTEGIC and PROFITABLE land to be developed.

LAND LOCATION ON THE MASS TRANSPORT NETWORK
The location of land offered is very strategically and advantageous because it is supported by a good masstransportation as follows:
Relatively close to Bojong Indah stations (station distance by land only about 650 meters) which is thenode switching between modes of mass transit (Commuter Line Jakarta-Tangerang and Soekarno HattaAirport Train).
Crossed Busway Corridor 3 Kalideres - Harmoni (existing busway) Close to the LRT (Ligh Rail Transit) station of Jakarta government LRT future plan (Corridor 5 from Pesing
to Kelapa Gading) Close to the MRT plan of East - West (Tangerang - Cikarang)
Mass transit network plan as shown in the following picture
Additional benefits of this land is close to the planned of six (6) segments elevated toll road (Semanan -Sunter) which is connected to the toll road network that already includes future plans
LAND PRICE
With the potential of land and profits derived from landdevelopment as stated previously, the price of land and thepayment system is as follows:
Land Price: USD 654 / sqmThe payment system is set later on aggreement between thebuyer and the owner
D
Eb
l
c
m
i
g
d
f
h
o
k
e
j
n
A
B
P
Z
Y
X
1
a
2
F
C
A
G
MONOREL Green Line
MONOREL Blue Line
MRT Lebak Bulus – Dukuh Atas
BKT Cakung – CawangBKS Cawang – KaretBKB Karet Cengkareng
Jalur Bandara
Lebak Bulus – Harmoni
Pinang Ranti – Grogol – Pluit
Cililitan - Tanjung Priok
Blok M – Kota
Pulo Gadung - Harmoni
Kalideres - Harmoni
Pulogadung – Dukuh Atas
Kampung Melayu - Ancol
Ragunan - Kuningan
Kp. Rambutan – Kp. Melayu
MRT Dukuh Atas – Kp. Bandan
Pulogebang – Kampung Melayu
Pluit – Tanjung Priok
Pondok Kelapa – Blok M
UI – Pasar Minggu - Manggarai
Ciledug - Blok M
a
b
c
d
e
f
g
h
i
j
k
l
m
n
o
A
B
1
2
X
Y
Z
P
Railway Jalur Serpong
Railway Jalur Bogor
Railway Jalur Bekasi
Railway Jalur Tanjung Priok
Railway Jalur Tengah
Railway Jalur Lingkar
Railway Jalur Tangerang
A
B
C
D
E
F
G
Pengembangan Rel Kereta JABOTABEK
PembangunanDouble Tracking
Pembangunan Lintasan Tidak Sebidang
B
Mass Transportation System Development Jakarta Year 2004 - 2020
Land Location on Mass Transit Network

Mass Public Transportation in Cengkareng Districts
Land LocationJl. Daan Mogot Km 12,8
+650 m
Bojong IndahTrain Station
Airport Train

Land LocationJl. Daan Mogot Km 12,8
COMMUTER LINE

Ligh Rail Transit (LRT) Plan
Land LocationJl. Daan Mogot Km 12,8
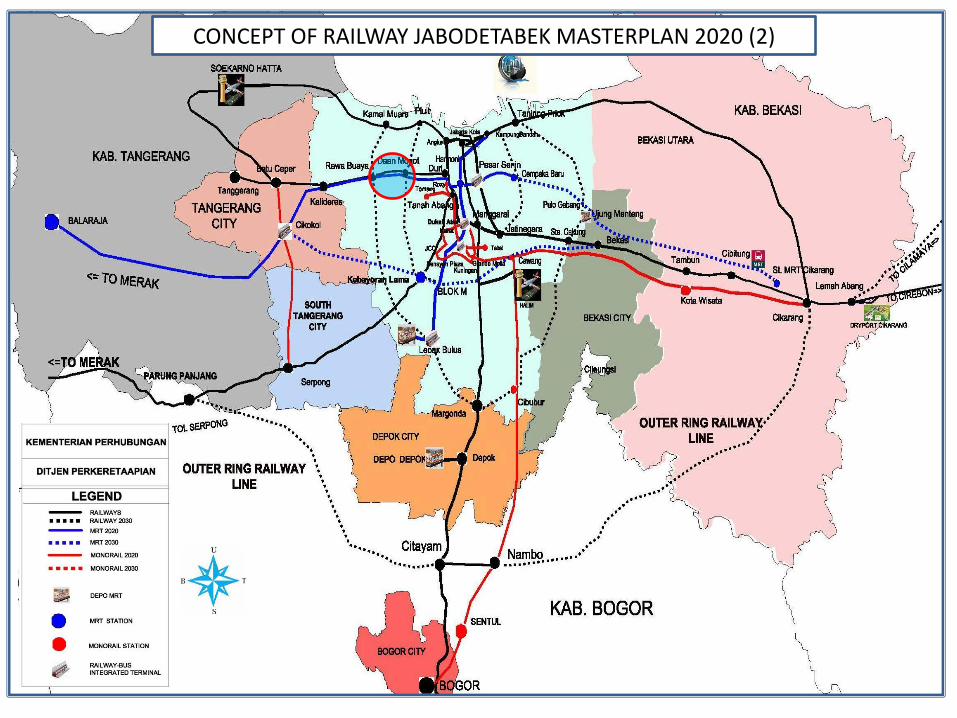
CONCEPT OF RAILWAY JABODETABEK MASTERPLAN 2020 (2)

Lokasi Lahan Jl. Daan Mogot Km 12,8
AIRPORT RAILWAY PLAN

Mass Public Transport Development Plan (MRT)
Land Location on MRT Plan

Airport
Tangerang
ke Merak
Serpong
ke Bogor
ke Bekasi/Cikampek
ke Bekasi
Pulo Gebang KampungMelayu
Cawang
PasarMinggu
Ulujami
Tomang
Pluit
Kemayoran
Sunter
Taman Mini
Eksisting
Lingkar Luar(Penyelesaian)
Akses Tanjung Priok(Rencana)
6 Ruas Jalan Tol(Rencana)
Depok - Antasari
Toll Road Network Systems Development Year 2004 - 2020
1
2
6
5
4
3
Rawa Buaya

TRANSIT ORIENTED DEVELOPMENT (TOD)
With a land area that is large enough (17.2 ha) and is supported mass transit,with Bojong Indah stations that were located relatively close to land, then theland has the potential to be developed into a regional TOD,
TOD is one of the government's policy to reduce congestion.
Supported by mass transit to this area it is possible to optimize or increasethe existing of the Floor Area Ratio (FAR) from 3,5 to 6
TODTransit Oriented Development

Brief Overview of
FINANCIAL FEASIBILITY

Proposed Development
Proposed Land Use Composition
Minimum Parking Requirement
Lots
Apartment 301.000 3.655 1 : 2 1.828
Office 180.600 1 : 100 1.806
Commercial Area 120.400 1 : 60 2.007
Total 602.000 5.640
Land Use SGFA (m2)Room
(Unit)
Minimum Parking Requirement
Parking Ratio
% sqm unit
Apartement 50% 301.000 85% 255.850 3.655
Office 30% 180.600 85% 153.510
Commercial Area 20% 120.400 70% 84.280
Total 602.000 493.640 3.655
Leasable AreaLand Use % SGFA (sqm)
Development Area
Luas Daeran Perencanaan
Building Coverage Ratio
Koefisien Dasar Bangunan (KDB)
Building Floor Area Ratio (Plot Area)
Koefisien Luas Bangunan (KLB)
Building Coverage Area
Luas Lantai Dasar
FAR Area (SGFA)
Luas Lantai Dasar
Minimum Parking Area
Luas Parkir Minimum
FAR Maximum/ 80% for MEP (GFA)
Luas Area Maximum/ 80% MEP
Maximum GFA (100% of GFA)
Luas Lantai Total
Building Height
Ketinggian Bangunan
Green Area Ratio
Koefisien Dasar Hijau (KDH)
Basement Footprint Ratio
Koefisien Tapak Basement (KTB)
Minimum Parking Numbers
Jumlah Parkir Minimum
PROPOSED DESIGN
Based on Permit
Requirement
172.000 sqm
45%
3,5
77.400 sqm
602.000 sqm
169.205 sqm
752.500 sqm
921.705 sqm
5.640 cars
16 floors
30% 51.600,00 sqm
55% 94.600,00 sqm

Assumptions
1. The Land price : USD 654 /sqm
2. Construction Cost :
3. The l icensing cost, planning, construction management (CM) : 8% x construction cost
4. Marketing costs : 3% x sales revenue
5. Routine maintenance cost : (2.5%/year x construction cost), and periodic
maintenance cost or replacement for every 5 years : (5% x the cost of construction)
6. Sources of f inancing :
7. Lending rate : 11.5% per year, and loan time : 10 Years
8. Income (revenue) obtained from the sel l ing price of unit apartment/ off ice/
commercial area and service charge (SC). The sel l ing price of the apartment / off ice/
commercial area and SC per sqm attached. The increase in SC by 5% per year.
9. Income tax (VAT) : 25%
10. Time for bui lding management : 25 Years
No. Land Use Area (sqm)Const. Cost
(USD/sqm)
1 Apartment 301.000 687
2 Office 180.600 654
3 Commercial Area 120.400 670
4 Parking (Basement/Podium) 141.004 458
5 MEP 150.500 458
6 Public & Social Facilities 30.100 196
No. Description Owner's Equity Bank Loans
1 Purchase of Land 70% 30%
2
Construction cost of building, licensing,
planning, construction management (CM)
and marketing
30% 70%

Investment Cost Estimation & Financing Schedule
1 2 3 4 5 6 7 8 9
1 Purchase of land sqm 172.000 654 112,49 112,49
2 Building construction (GFA)
2.1 Apartment sqm 301.000 687 206,70 41,34 45,47 47,54 49,61 22,74
2.2 Office sqm 180.600 654 118,11 23,62 25,98 27,17 28,35 12,99
2.3 Commercial Area sqm 120.400 670 80,71 16,14 17,76 18,56 19,37 8,88
2.4 Parking (Basement/Podium) sqm 141.004 458 64,55 12,91 14,20 14,85 15,49 7,10
2.5 MEP sqm 150.500 458 68,90 13,78 15,16 15,85 16,54 7,58
2.6 Public & Social Facilities sqm 30.100 196 5,91 1,18 1,30 1,36 1,42 0,65
TOTAL (2) 923.604 544,88 108,98 119,87 125,32 130,77 59,94
3Licensing, Planning, Construction
Management (CM)
3.1 Licensing lumpsum 1 13,62 13,62 5,45 8,17
3.2 Planning lumpsum 1 13,62 13,62 2,72 10,90
3.3 Construction Management (CM) lumpsum 1 16,35 16,35 3,27 3,60 3,76 3,92 1,80
TOTAL (3) 43,59 8,17 19,07 3,27 3,60 3,76 3,92 1,80
4 Marketing lumpsum 1 37,69 37,69 0,00 4,01 4,25 5,11 6,25 6,17 5,09 4,20 2,60
TOTAL OF INVESTMENT COST 738,64 120,66 23,08 116,50 128,58 135,33 140,87 66,83 4,20 2,60
Land Aquisition &
Design/ Planning
Description QuantityUnit Price
(USD)
Total Cost
(Million USD)UnitNo.
Construction
Marketing/ Shelling
Year

Operating Cost Estimation & Schedule Uses
16 17 18 19 20 21 22 23 24 25 26 27 28 29 30 31 32
Operating Cost (millionUSD) 13,09 13,74 14,43 15,15 15,91 16,71 17,54 18,42 19,34 20,31 21,32 22,39 23,51 24,68 25,92 27,21 28,57
Instalment Bank & bank interest (millionUSD) 16,81 5,65 0,53 0,20 0,00 0,00 0,00 0,00 0,00 0,00 0,00 0,00 0,00 0,00 0,00 0,00 0,00
Routine & periodic maintenance (millionUSD) 13,62 27,24 13,62 13,62 13,62 13,62 27,24 13,62 13,62 13,62 13,62 27,24 13,62 13,62 13,62 13,62 27,24
TOTAL OPERATING COST 43,52 46,64 28,58 28,97 29,53 30,33 44,78 32,04 32,96 33,93 34,94 49,63 37,13 38,30 39,54 40,83 55,82
YearDescription
COST ESTIMATION (MillionUSD)
1 2 3 4 5 6 7 8 9 10 11 12 13 14 15
Operating Cost (millionUSD) 30% 0,00 0,00 0,00 0,00 3,83 5,55 7,03 8,33 9,30 9,77 10,26 10,77 11,31 11,87 12,47
Instalment Bank & bank interest (millionUSD) 0,00 7,35 10,02 24,73 40,31 55,99 71,58 76,67 73,19 69,47 65,40 57,38 52,03 40,28 28,40
Routine & periodic maintenance (millionUSD) 0,00 0,00 2,72 5,72 8,85 12,12 27,24 13,62 13,62 13,62 13,62 27,24 13,62 13,62 13,62
TOTAL OPERATING COST 100% 0,00 7,35 12,74 30,45 52,99 73,66 105,85 98,62 96,11 92,86 89,27 95,39 76,96 65,78 54,48
Year
PLand Aquisition &
Design/ Planning
Description
Construction

Revenue Estimation
1 2 3 4 5 6 7 8 9 10 11 12 13 14 15
1 Sale Progress 10% 11% 13% 16% 19% 14% 11% 6%
2 Leaseble Area (m2)
2.1 Apartment 255.850 25.585 28.144 33.772 40.527 48.632 36.474 27.355 15.361
2.2 Office 153.510 15.351 16.886 20.263 24.316 29.179 21.884 16.413 9.217
2.3 Commercial Area 90.300 9.030 9.933 11.920 14.304 17.164 12.873 9.655 5.422
3 Cumulative Leaseble Area (m2)
3.1 Apartment 128.027 176.659 213.133 240.489 255.850 255.850 255.850 255.850 255.850 255.850 255.850
3.2 Office 76.816 105.996 127.880 144.293 153.510 153.510 153.510 153.510 153.510 153.510 153.510
3.3 Commercial Area 45.186 62.350 75.224 84.878 90.300 90.300 90.300 90.300 90.300 90.300 90.300
4 The selling price per sqm (USD)
4.1 Apartment 10% 1.385 1.385 1.524 1.676 1.843 2.028 2.231 2.454
4.2 Office 10% 2.692 2.692 2.961 3.257 3.583 3.941 4.335 4.769
4.3 Commercial Area 10% 2.308 2.308 2.539 2.793 3.072 3.379 3.717 4.089
5 Service Charge (SC) USD/sqm/month
5.1 Apartment 5% 3,435 3,607 3,787 3,976 4,175 4,384 4,603 4,833 5,075 5,329 5,595
5.2 Office 5% 5,496 5,771 6,059 6,362 6,680 7,014 7,365 7,733 8,120 8,526 8,952
5.3 Commercial Area 5% 4,466 4,689 4,923 5,169 5,428 5,699 5,984 6,283 6,598 6,927 7,274
6 Building Sales Revenue (Million USD)
4.1 Apartment 35,44 38,98 51,45 67,92 89,65 73,96 61,02 37,69
4.2 Office 41,32 45,46 60,00 79,20 104,55 86,25 71,16 43,96
4.3 Commercial Area 20,84 22,93 30,26 39,95 52,73 43,50 35,89 22,17
Total Building Sales Revenue (Million USD) 97,60 107,36 141,72 187,07 246,93 203,72 168,07 103,81
7 SC Revenue (Million USD)
5.1 Apartment 5,28 7,65 9,69 11,48 12,82 13,46 14,13 14,84 15,58 16,36 17,18
5.2 Office 5,07 7,34 9,30 11,02 12,31 12,92 13,57 14,25 14,96 15,71 16,49
5.3 Commercial Area 2,42 3,51 4,44 5,27 5,88 6,18 6,48 6,81 7,15 7,51 7,88
TOTAL Revenue SC 12,76 18,49 23,43 27,76 31,01 32,56 34,18 35,89 37,69 39,57 41,55
TOTAL Revenue (Building Sales + SC) 97,60 107,36 141,72 199,83 265,42 227,14 195,82 134,82 32,56 34,18 35,89 37,69 39,57 41,55
No. Description
Land Aquisition & Design/
Planning
Year
Construction

Financial Feasibility
Revenue Estimation
16 17 18 19 20 21 22 23 24 25 26 27 28 29 30 31 32
1 Sale Progress
2 Leaseble Area (m2)
2.1 Apartment 255.850
2.2 Office 153.510
2.3 Commercial Area 90.300
3 Cumulative Leaseble Area (m2)
3.1 Apartment 255.850 255.850 255.850 255.850 255.850 255.850 255.850 255.850 255.850 255.850 255.850 255.850 255.850 255.850 255.850 255.850 255.850
3.2 Office 153.510 153.510 153.510 153.510 153.510 153.510 153.510 153.510 153.510 153.510 153.510 153.510 153.510 153.510 153.510 153.510 153.510
3.3 Commercial Area 90.300 90.300 90.300 90.300 90.300 90.300 90.300 90.300 90.300 90.300 90.300 90.300 90.300 90.300 90.300 90.300 90.300
4 The selling price per sqm (USD)
4.1 Apartment 10%
4.2 Office 10%
4.3 Commercial Area 10%
5 Service Charge (SC) USD/sqm/month
5.1 Apartment 5% 5,875 6,169 6,477 6,801 7,141 7,498 7,873 8,267 8,680 9,114 9,570 10,048 10,551 11,078 11,632 12,214 12,824
5.2 Office 5% 9,400 9,870 10,364 10,882 11,426 11,997 12,597 13,227 13,888 14,583 15,312 16,077 16,881 17,725 18,611 19,542 20,519
5.3 Commercial Area 5% 7,638 8,019 8,420 8,841 9,283 9,748 10,235 10,747 11,284 11,848 12,441 13,063 13,716 14,402 15,122 15,878 16,672
6 Building Sales Revenue (Million USD)
4.1 Apartment
4.2 Office
4.3 Commercial Area
Total Building Sales Revenue (Million USD)
7 SC Revenue (Million USD)
5.1 Apartment 18,04 18,94 19,89 20,88 21,92 23,02 24,17 25,38 26,65 27,98 29,38 30,85 32,39 34,01 35,71 37,50 39,37
5.2 Office 17,32 18,18 19,09 20,05 21,05 22,10 23,21 24,37 25,58 26,86 28,21 29,62 31,10 32,65 34,28 36,00 37,80
5.3 Commercial Area 8,28 8,69 9,12 9,58 10,06 10,56 11,09 11,65 12,23 12,84 13,48 14,15 14,86 15,61 16,39 17,21 18,07
TOTAL Revenue SC 43,63 45,81 48,10 50,51 53,03 55,68 58,47 61,39 64,46 67,68 71,07 74,62 78,35 82,27 86,38 90,70 95,24
TOTAL Revenue (Building Sales + SC) 43,63 45,81 48,10 50,51 53,03 55,68 58,47 61,39 64,46 67,68 71,07 74,62 78,35 82,27 86,38 90,70 95,24
No.Year
Description
NPV (Million USD) 160
IRR 66,10%
B/C Ratio 1,79

Conclusions & Recommendation
1. From the results of the study can be summarized as follows:
Land location is very strategic area, good accessibility because it is located on Jl. Daan Mogot(main access) and Jl. Kembangan Baru (secondary access)
Land Status : Clear & Clean, the legality of land Complete
The added value of the land is the mixed use (residential and commercial). Floor area ratio (FAR) value are quite large and Building Coverage Ratio are quite adequate.
Land location is supported by mass public transportation that allows visitors to and leaving the project site
Bojong Indah station which is the node displacement of mass transport modes is relatively close to land, it is still possible to accomplish just by walking.
The land could be developed as a TOD area and supported by mass transit, it is possible to optimize or increase the existing of the Floor Area Ratio (FAR) from 3,5 to 6
Financial feasibility is feasible
2. Suggestions to buyer is as follows:
Purchase of land for mixed use (apartments, offices and commercial area) with supporting facilities eligible for consideration
Future demand for apartment and commercial area (office space, hotel, retail, shopping mall etc.) is still quite high

![Untitled-1 [s3-ap-southeast-1.amazonaws.com] · 2018. 9. 7. · Daan Mogot Gading Serpong Alam Sutera Lippo Karawaci Soekarno Hatta International Airport BSD City West Jakarta 5](https://img.pdfslide.net/doc/110x75/61461e688f9ff81254200edb/untitled-1-s3-ap-southeast-1-2018-9-7-daan-mogot-gading-serpong-alam-sutera.jpg)