Embed Size (px)
Citation preview
MARKET UPDATEParis911 Intel Reports
· Current Real Estate Market Conditions for Condos & Townhomes· Trends in Pricing· Current Levels of Supply and Demand· Value Metrics
· Report for the week ofApril 13, 2015
· Presented by Connor and Paris MacIvor / REMAX of Santa Clarita CAREMAX of Valencia CA / The Paris911 Teamwww.Paris911.com / [email protected]
CANYON COUNTRY, CA
Powered by Altos Research LLC | www.altosresearch.com | Copyright ©2005-2014 Altos Research LLC

Median List Price
49.1
Percent Relisted (reset DOM)
1096
2.0
3 %
Median Number of Bathrooms
88
Inventory of Properties Listed
$ 233
Percent Flip (price increased)
Median House Size (sq ft)
$ 251,900
24 %
2.0
Market Action Index
Median Number of Bedrooms
Asking Price Per Square Foot
6 %
Percent of Properties with Price Decrease
Strong Seller's
≠≠
±+
±+
≠≠
=
Altos Research Value Statistics
Most Expensive Listing
Average Days on Market (DoM)
Bottom/Fourth
Lower/Third
Upper/Second
Top/First
This Week Real-Time Market Profile Trend
The Market Action Index answers the question "How's the Market?" by measuringthe current rate of sale versus the amount of the inventory. Index above 30implies a seller's advantage. Below 30, conditions give the advantage to thebuyer.
Supply and Demand
Characteristics per Quartile
14 11666
932.0 31
2.0
1
68
2.0 9
152
2
1
30
$ 249,900
1
3
9
2.8
22.0
848
8
$ 219,900
2.5
32
$ 267,000
4.0$ 412,500
30
3
1127
Inventory is tightening and days-on-market is falling. The Market ActionIndex shows demand heating up.These are relatively bullish signs forprices.
Monday April 13, 2015
The Paris911 Team | www.Paris911.com | 661-400-1720
8
1078
2.0
The median list price in CANYONCOUNTRY, CA this week is $251,900.The 34 properties have been on themarket for an average of 88 days.
Most expensive 25% of properties
Upper-middle 25% of properties
Lower-middle 25% of properties
Least expensive 25% of properties
Quartile Median Price Beds Baths Age Inventory New Absorbed DOMSq. Ft.
No change
Strong upward trend Strong downward trend
Slight upward trend Slight downward trend±+
== ≠≠
≠=
CANYONCOUNTRY, CA
City Overview
Least Expensive Listing
Average List Price
Average Age of Listing
34
$ 650,000
$ 180,000
$ 288,256
29
Trend Key:
While the Market Action Index showssome strengthening in the last fewweeks, prices have not seemed tomove from their plateau. Should theupward trend in sales relative toinventory continue, expect prices toresume an upward climb in tandemwith the MAI.
Page 2 of 6
Condos & Townhomes in

The Paris911 Team | www.Paris911.com | 661-400-1720
City OverviewCANYON
COUNTRY, CA
Monday April 13, 2015
Median PriceThe market appears to be hovering around this plateau. Look for a persistent change in the Market Action Index before we seeprices deviate from these levels.
90-day Average7-day Average
Quartile PricesPrices have generally settled at a plateau, although Quartile 1 is on a bit of an up trend in recent weeks. We'll need to see apersistent shift in the Market Action Index before we see prices across the board move from these levels.
First/Top Second/Upper Third/Lower Fourth/Bottom
Page 3 of 6
Condos & Townhomes in

The Paris911 Team | www.Paris911.com | 661-400-1720
City OverviewCANYON
COUNTRY, CA
Monday April 13, 2015
Price per Square FootThe market plateau is seen across the price and value. The price per square foot and median list price have both beenreasonably stagnant. Watch the Market Action Index for persistent changes as a leading indicator before the market moves fromthese levels.
90-day Average7-day Average
Inventory of Properties Listed for SaleInventory has been falling in recent weeks. Note that declining inventory alone does not signal a strengthening market. Look tothe Market Action Index and Days on Market trends to gauge whether buyer interest is changing with the available supply.
90-day Average7-day Average
Page 4 of 6
Condos & Townhomes in
The Paris911 Team | www.Paris911.com | 661-400-1720
City OverviewCANYON
COUNTRY, CA
Monday April 13, 2015
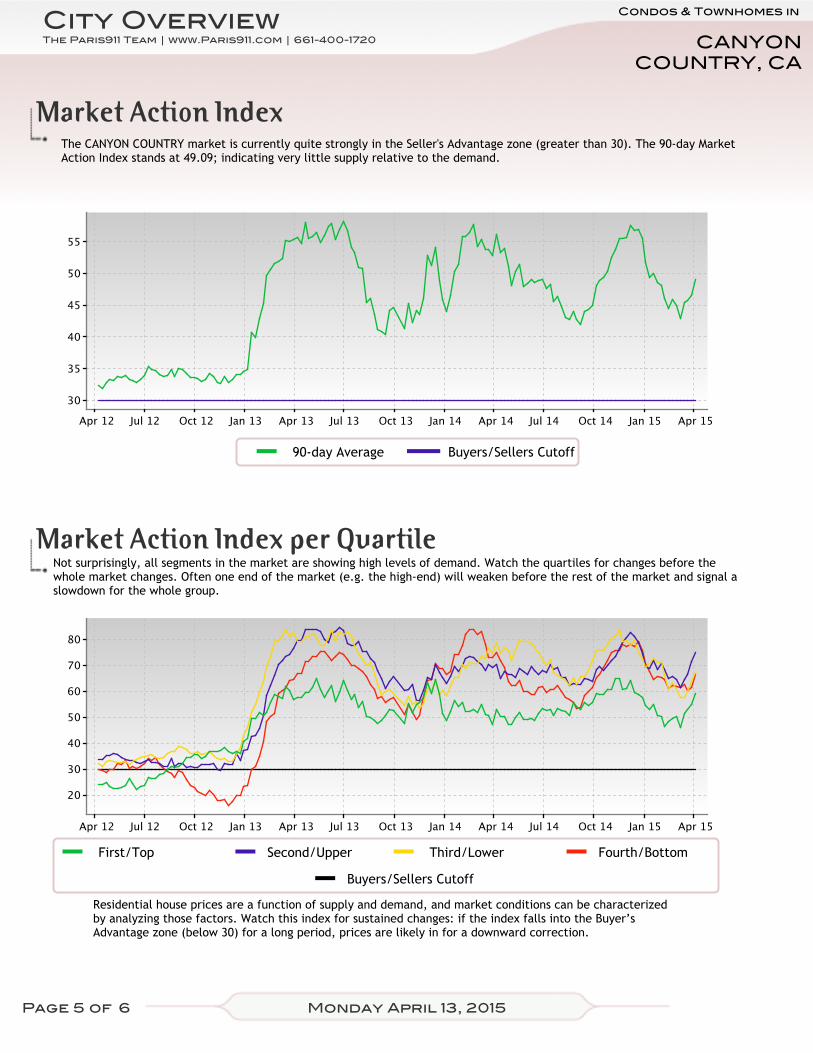
Market Action IndexThe CANYON COUNTRY market is currently quite strongly in the Seller's Advantage zone (greater than 30). The 90-day MarketAction Index stands at 49.09; indicating very little supply relative to the demand.
Buyers/Sellers Cutoff90-day Average
Market Action Index per QuartileNot surprisingly, all segments in the market are showing high levels of demand. Watch the quartiles for changes before thewhole market changes. Often one end of the market (e.g. the high-end) will weaken before the rest of the market and signal aslowdown for the whole group.
First/Top Second/Upper Third/Lower Fourth/Bottom
Buyers/Sellers Cutoff
Residential house prices are a function of supply and demand, and market conditions can be characterizedby analyzing those factors. Watch this index for sustained changes: if the index falls into the Buyer’sAdvantage zone (below 30) for a long period, prices are likely in for a downward correction.
Page 5 of 6
Condos & Townhomes in

The Paris911 Team | www.Paris911.com | 661-400-1720
City OverviewCANYON
COUNTRY, CA
Monday April 13, 2015
Days on MarketThe properties have been on the market for an average of 88 days. Half of the listings have come newly on the market in thepast 38 or so days.
90-day Average7-day Average
Days on Market per QuartileIt is not uncommon for the higher priced homes in an area to take longer to sell than those in the lower quartiles.
First/Top Second/Upper Third/Lower Fourth/Bottom
Page 6 of 6
Condos & Townhomes in

MARKET UPDATEParis911 Intel Reports
· Current Real Estate Market Conditions for Condos & Townhomes· Trends in Pricing· Current Levels of Supply and Demand· Value Metrics
· Report for the week ofApril 13, 2015
· Presented by Connor and Paris MacIvor / REMAX of Santa Clarita CAREMAX of Valencia CA / The Paris911 Teamwww.Paris911.com / [email protected]
CASTAIC, CA
Powered by Altos Research LLC | www.altosresearch.com | Copyright ©2005-2014 Altos Research LLC

Median List Price
30.9
Percent Relisted (reset DOM)
1667
3.0
0 %
Median Number of Bathrooms
94
Inventory of Properties Listed
$ 227
Percent Flip (price increased)
Median House Size (sq ft)
$ 395,000
40 %
3.0
Market Action Index
Median Number of Bedrooms
Asking Price Per Square Foot
0 %
Percent of Properties with Price Decrease
Seller's Advantage
==
±+
±+
=
=
Altos Research Value Statistics
Most Expensive Listing
Average Days on Market (DoM)
Bottom/Fourth
Lower/Third
Upper/Second
Top/First
This Week Real-Time Market Profile Trend
The Market Action Index answers the question "How's the Market?" by measuringthe current rate of sale versus the amount of the inventory. Index above 30implies a seller's advantage. Below 30, conditions give the advantage to thebuyer.
Supply and Demand
Characteristics per Quartile
8 01932
1193.0 8
2.5
0
28
3.0 1
28
0
0
20
$ 395,000
2
0
2
3.0
02.5
1574
1
$ 316,950
3.0
266
$ 428,000
3.0$ 439,000
8
1
1667
The Market Action Index has beentrending down lately, while inventoryand days-on-market are climbing. Thetrends imply a weakening market.
Monday April 13, 2015
The Paris911 Team | www.Paris911.com | 661-400-1720
1
1667
2.8
The median list price in CASTAIC, CAthis week is $395,000. The 5properties have been on the marketfor an average of 94 days.
Most expensive 25% of properties
Upper-middle 25% of properties
Lower-middle 25% of properties
Least expensive 25% of properties
Quartile Median Price Beds Baths Age Inventory New Absorbed DOMSq. Ft.
No change
Strong upward trend Strong downward trend
Slight upward trend Slight downward trend±+
== ≠≠
≠=
CASTAIC, CACity Overview
Least Expensive Listing
Average List Price
Average Age of Listing
5
$ 439,000
$ 249,900
$ 379,180
13
Trend Key:
In the last few weeks, the MarketAction Index has resumed a climb.Despite the fact that we're in aSeller's market, prices have not yetresumed upward momentum.However, it is likely that given theseconditions, prices will at least leveloff very soon. If the increasingtrend continues, expect that pricescould shift higher quickly.
Page 2 of 6
Condos & Townhomes in
The Paris911 Team | www.Paris911.com | 661-400-1720
City OverviewCASTAIC, CA
Monday April 13, 2015
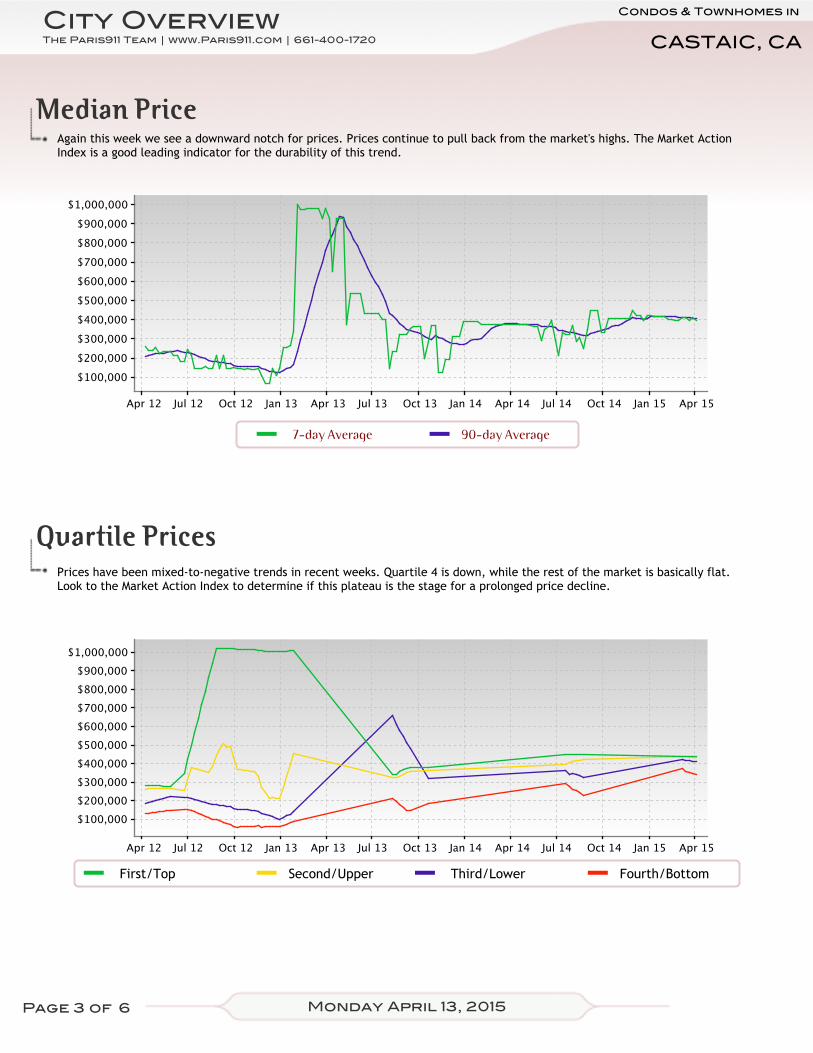
Median PriceAgain this week we see a downward notch for prices. Prices continue to pull back from the market's highs. The Market ActionIndex is a good leading indicator for the durability of this trend.
90-day Average7-day Average
Quartile PricesPrices have been mixed-to-negative trends in recent weeks. Quartile 4 is down, while the rest of the market is basically flat.Look to the Market Action Index to determine if this plateau is the stage for a prolonged price decline.
First/Top Second/Upper Third/Lower Fourth/Bottom
Page 3 of 6
Condos & Townhomes in

The Paris911 Team | www.Paris911.com | 661-400-1720
City OverviewCASTAIC, CA
Monday April 13, 2015
Price per Square FootDespite recently falling prices, the price per square foot has stayed reasonably flat. This implies that there's a portion of themarket being priced at a premium. You can investigate this condition in the quartile details.
90-day Average7-day Average
Inventory of Properties Listed for SaleInventory has been climbing lately. Note that rising inventory alone does not signal a weakening market. Look to the MarketAction Index and Days on Market trends to gauge whether buyer interest is keeping up with available supply.
90-day Average7-day Average
Page 4 of 6
Condos & Townhomes in

The Paris911 Team | www.Paris911.com | 661-400-1720
City OverviewCASTAIC, CA
Monday April 13, 2015
Market Action IndexThe CASTAIC market is currently in the Seller's Advantage zone (greater than 30). The 90-day Market Action Index stands at30.89 which indicates that demand is strong and available supply of homes gets snapped up relatively quickly.
Buyers/Sellers Cutoff90-day Average
Market Action Index per QuartileThe higher end of the market (Quartiles 1 and 2) is in the Buyer's Market zone with several months of inventory given thecurrent rate of demand for homes in the quartile. The low-end of the market is where buyers are focusing more of theirattention. Notice that Quartiles 1 and 2 (the higher half of the market) have a Market Action Index below 30 (Buyer's Market).
First/Top Second/Upper Third/Lower Fourth/Bottom
Buyers/Sellers Cutoff
Residential house prices are a function of supply and demand, and market conditions can be characterizedby analyzing those factors. Watch this index for sustained changes: if the index falls into the Buyer’sAdvantage zone (below 30) for a long period, prices are likely in for a downward correction.
Page 5 of 6
Condos & Townhomes in

The Paris911 Team | www.Paris911.com | 661-400-1720
City OverviewCASTAIC, CA
Monday April 13, 2015
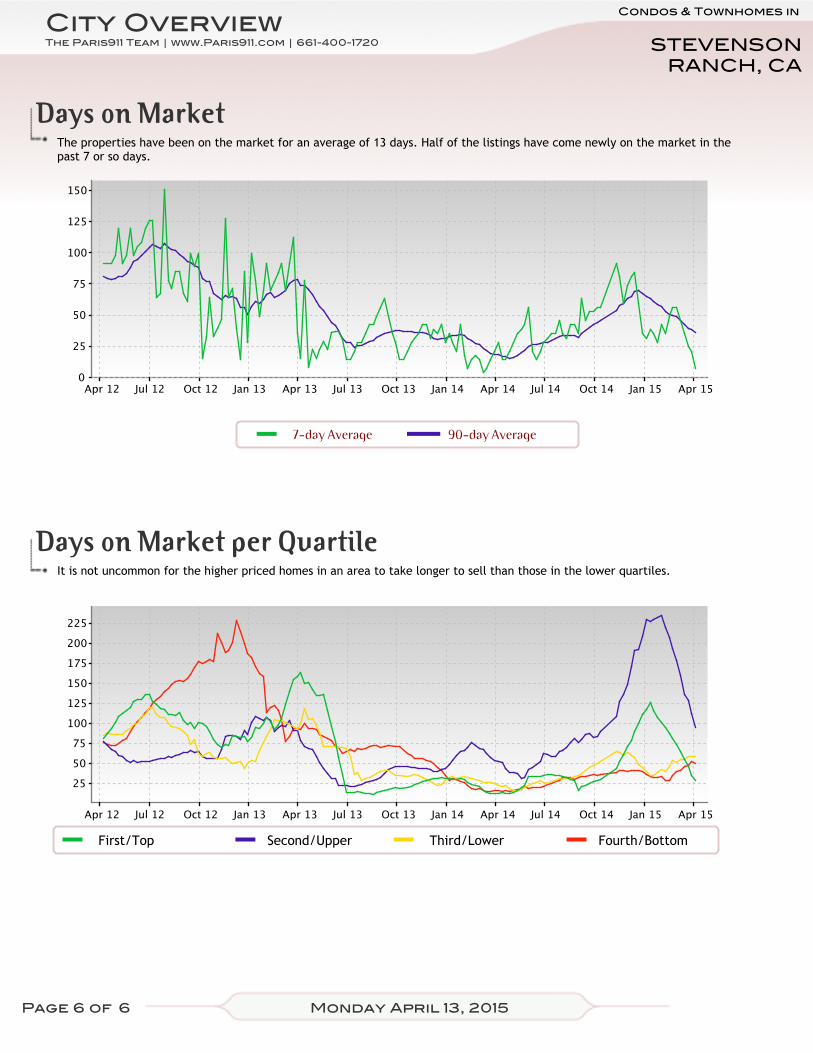
Days on MarketThe properties have been on the market for an average of 94 days. Half of the listings have come newly on the market in thepast 56 or so days.
90-day Average7-day Average
Days on Market per QuartileIt is not uncommon for the higher priced homes in an area to take longer to sell than those in the lower quartiles.
First/Top Second/Upper Third/Lower Fourth/Bottom
Page 6 of 6
Condos & Townhomes in

MARKET UPDATEParis911 Intel Reports
· Current Real Estate Market Conditions for Condos & Townhomes· Trends in Pricing· Current Levels of Supply and Demand· Value Metrics
· Report for the week ofApril 13, 2015
· Presented by Connor and Paris MacIvor / REMAX of Santa Clarita CAREMAX of Valencia CA / The Paris911 Teamwww.Paris911.com / [email protected]
NEWHALL, CA
Powered by Altos Research LLC | www.altosresearch.com | Copyright ©2005-2014 Altos Research LLC

Median List Price
57.5
Percent Relisted (reset DOM)
967
2.0
6 %
Median Number of Bathrooms
66
Inventory of Properties Listed
$ 231
Percent Flip (price increased)
Median House Size (sq ft)
$ 239,000
9 %
2.0
Market Action Index
Median Number of Bedrooms
Asking Price Per Square Foot
6 %
Percent of Properties with Price Decrease
Strong Seller's
==
±+
±+
≠≠
==
Altos Research Value Statistics
Most Expensive Listing
Average Days on Market (DoM)
Bottom/Fourth
Lower/Third
Upper/Second
Top/First
This Week Real-Time Market Profile Trend
The Market Action Index answers the question "How's the Market?" by measuringthe current rate of sale versus the amount of the inventory. Index above 30implies a seller's advantage. Below 30, conditions give the advantage to thebuyer.
Supply and Demand
Characteristics per Quartile
40 01411
1122.0 41
2.0
2
32
2.0 8
47
4
1
51
$ 226,500
3
4
9
2.0
02.0
864
8
$ 175,000
2.0
76
$ 297,974
2.5$ 364,300
45
1
1266
Inventory is up and Market Action istrending down recently. While days-on-market appears to be trendinglower, the overall conditions areweakening a bit.
Monday April 13, 2015
The Paris911 Team | www.Paris911.com | 661-400-1720
8
858
1.0
The median list price in NEWHALL, CAthis week is $239,000. The 33properties have been on the marketfor an average of 66 days.
Most expensive 25% of properties
Upper-middle 25% of properties
Lower-middle 25% of properties
Least expensive 25% of properties
Quartile Median Price Beds Baths Age Inventory New Absorbed DOMSq. Ft.
No change
Strong upward trend Strong downward trend
Slight upward trend Slight downward trend±+
== ≠≠
≠=
NEWHALL, CACity Overview
Least Expensive Listing
Average List Price
Average Age of Listing
33
$ 415,000
$ 129,950
$ 255,683
40
Trend Key:
Home sales continue to outstripsupply and the Market Action Indexhas been moving higher for severalweeks. This is a Seller's market sowatch for upward pricing pressure inthe near future if the trendcontinues.
Page 2 of 6
Condos & Townhomes in
The Paris911 Team | www.Paris911.com | 661-400-1720
City OverviewNEWHALL, CA
Monday April 13, 2015
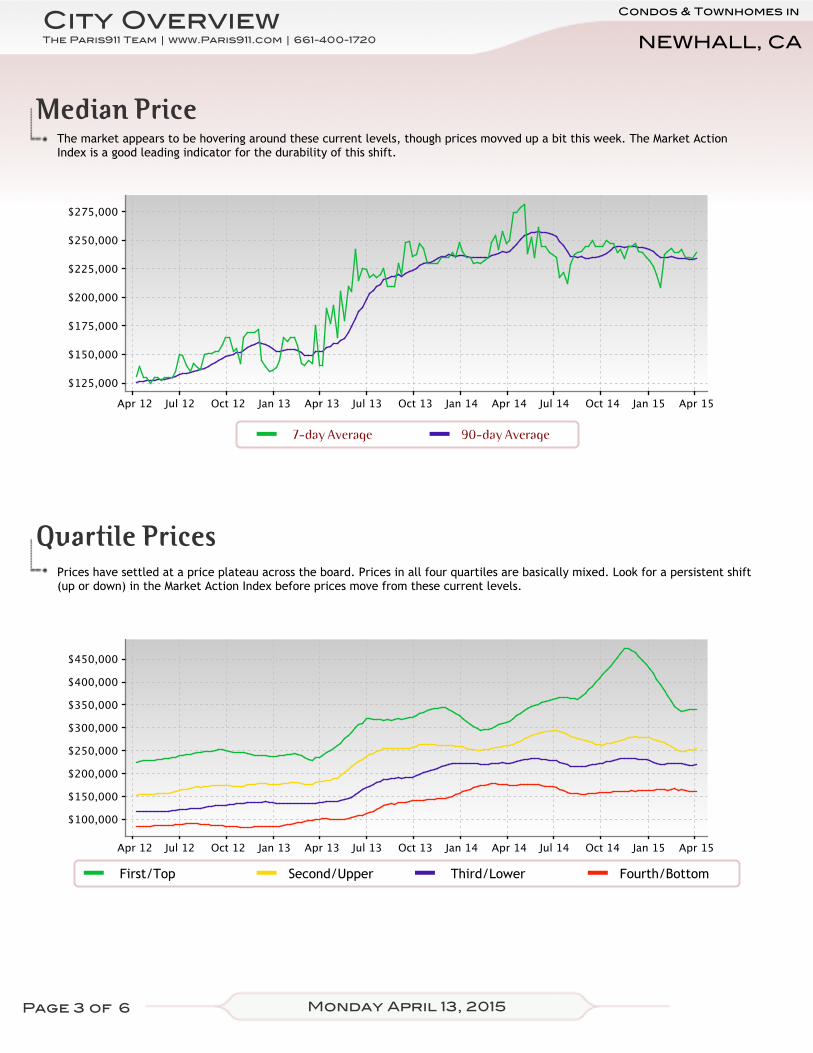
Median PriceThe market appears to be hovering around these current levels, though prices movved up a bit this week. The Market ActionIndex is a good leading indicator for the durability of this shift.
90-day Average7-day Average
Quartile PricesPrices have settled at a price plateau across the board. Prices in all four quartiles are basically mixed. Look for a persistent shift(up or down) in the Market Action Index before prices move from these current levels.
First/Top Second/Upper Third/Lower Fourth/Bottom
Page 3 of 6
Condos & Townhomes in

The Paris911 Team | www.Paris911.com | 661-400-1720
City OverviewNEWHALL, CA
Monday April 13, 2015
Price per Square FootThe market plateau is seen across the price and value. The price per square foot and median list price have both beenreasonably stagnant. Watch the Market Action Index for persistent changes as a leading indicator before the market moves fromthese levels.
90-day Average7-day Average
Inventory of Properties Listed for SaleInventory has been climbing lately. Note that rising inventory alone does not signal a weakening market. Look to the MarketAction Index and Days on Market trends to gauge whether buyer interest is keeping up with available supply.
90-day Average7-day Average
Page 4 of 6
Condos & Townhomes in
The Paris911 Team | www.Paris911.com | 661-400-1720
City OverviewNEWHALL, CA
Monday April 13, 2015
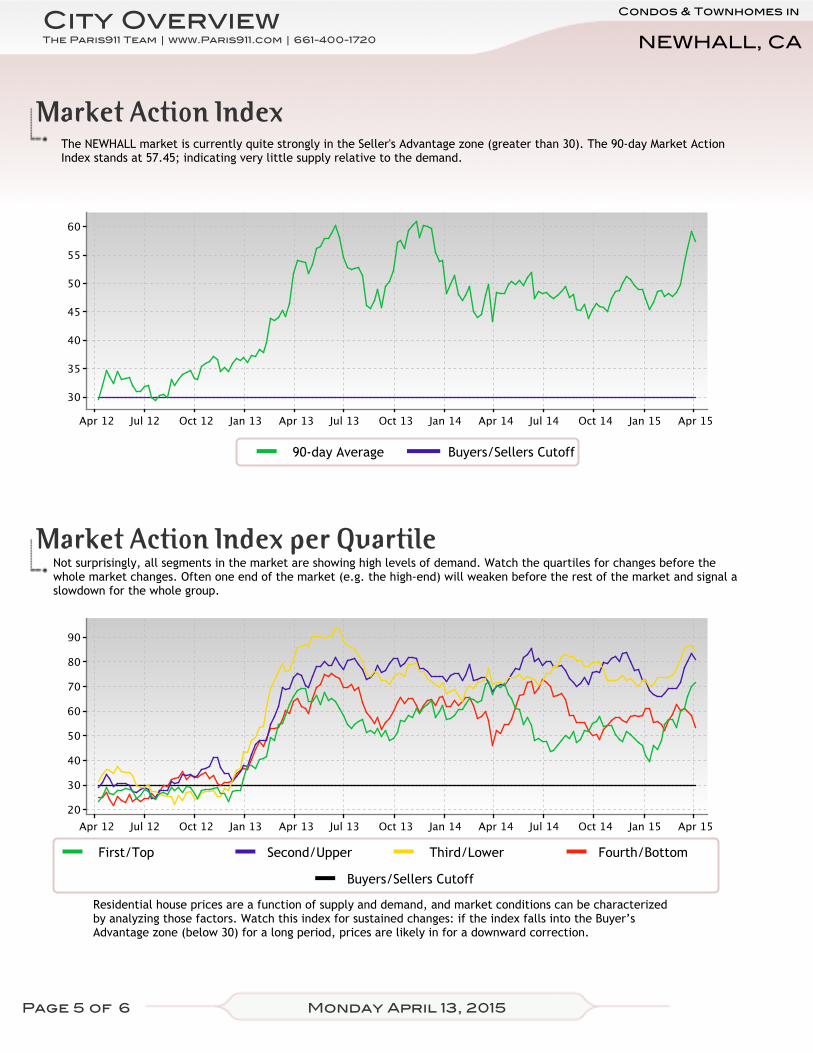
Market Action IndexThe NEWHALL market is currently quite strongly in the Seller's Advantage zone (greater than 30). The 90-day Market ActionIndex stands at 57.45; indicating very little supply relative to the demand.
Buyers/Sellers Cutoff90-day Average
Market Action Index per QuartileNot surprisingly, all segments in the market are showing high levels of demand. Watch the quartiles for changes before thewhole market changes. Often one end of the market (e.g. the high-end) will weaken before the rest of the market and signal aslowdown for the whole group.
First/Top Second/Upper Third/Lower Fourth/Bottom
Buyers/Sellers Cutoff
Residential house prices are a function of supply and demand, and market conditions can be characterizedby analyzing those factors. Watch this index for sustained changes: if the index falls into the Buyer’sAdvantage zone (below 30) for a long period, prices are likely in for a downward correction.
Page 5 of 6
Condos & Townhomes in

The Paris911 Team | www.Paris911.com | 661-400-1720
City OverviewNEWHALL, CA
Monday April 13, 2015
Days on MarketThe properties have been on the market for an average of 66 days. Half of the listings have come newly on the market in thepast 14 or so days.
90-day Average7-day Average
Days on Market per QuartileIt is not uncommon for the higher priced homes in an area to take longer to sell than those in the lower quartiles.
First/Top Second/Upper Third/Lower Fourth/Bottom
Page 6 of 6
Condos & Townhomes in

MARKET UPDATEParis911 Intel Reports
· Current Real Estate Market Conditions for Condos & Townhomes· Trends in Pricing· Current Levels of Supply and Demand· Value Metrics
· Report for the week ofApril 13, 2015
· Presented by Connor and Paris MacIvor / REMAX of Santa Clarita CAREMAX of Valencia CA / The Paris911 Teamwww.Paris911.com / [email protected]
SANTA CLARITA, CA
Powered by Altos Research LLC | www.altosresearch.com | Copyright ©2005-2014 Altos Research LLC

Median List Price
60.4
Percent Relisted (reset DOM)
1602
3.0
8 %
Median Number of Bathrooms
71
Inventory of Properties Listed
$ 238
Percent Flip (price increased)
Median House Size (sq ft)
$ 380,000
25 %
3.0
Market Action Index
Median Number of Bedrooms
Asking Price Per Square Foot
0 %
Percent of Properties with Price Decrease
Strong Seller's
≠≠
±+
≠≠
≠≠
==
Altos Research Value Statistics
Most Expensive Listing
Average Days on Market (DoM)
Bottom/Fourth
Lower/Third
Upper/Second
Top/First
This Week Real-Time Market Profile Trend
The Market Action Index answers the question "How's the Market?" by measuringthe current rate of sale versus the amount of the inventory. Index above 30implies a seller's advantage. Below 30, conditions give the advantage to thebuyer.
Supply and Demand
Characteristics per Quartile
1 02542
1282.0 10
2.0
2
16
2.0 3
28
1
4
30
$ 314,900
1
0
3
4.0
33.0
870
3
$ 236,900
3.0
112
$ 410,000
5.0$ 495,672
10
2
1710
Inventory is tightening and days-on-market is falling. The Market ActionIndex shows demand heating up.These are relatively bullish signs forprices.
Monday April 13, 2015
The Paris911 Team | www.Paris911.com | 661-400-1720
3
1121
1.0
The median list price in SANTACLARITA, CA this week is $380,000.The 12 properties have been on themarket for an average of 71 days.
Most expensive 25% of properties
Upper-middle 25% of properties
Lower-middle 25% of properties
Least expensive 25% of properties
Quartile Median Price Beds Baths Age Inventory New Absorbed DOMSq. Ft.
No change
Strong upward trend Strong downward trend
Slight upward trend Slight downward trend±+
== ≠≠
≠=
SANTA CLARITA, CACity Overview
Least Expensive Listing
Average List Price
Average Age of Listing
12
$ 496,997
$ 215,500
$ 369,256
14
Trend Key:
The market continues to get hotter.More sales demand and fewer homeslisted have contributed to arelatively long run of increasingprices. Current supply and demandlevels show no sign of priceschanging from their current trend.
Page 2 of 6
Condos & Townhomes in

The Paris911 Team | www.Paris911.com | 661-400-1720
City OverviewSANTA CLARITA, CA
Monday April 13, 2015
Median PricePrices hit another all time high this week. Given current conditions, prices continue to march higher. A persistent drop of theMarket Action Index into the Buyer's zone will be a leading indicator of the price strength subsiding.
90-day Average7-day Average
Quartile PricesPrices have been mixed-to-negative trends in recent weeks. Quartile 4 is down, while the rest of the market is basically flat.Look to the Market Action Index to determine if this plateau is the stage for a prolonged price decline.
First/Top Second/Upper Third/Lower Fourth/Bottom
Page 3 of 6
Condos & Townhomes in

The Paris911 Team | www.Paris911.com | 661-400-1720
City OverviewSANTA CLARITA, CA
Monday April 13, 2015
Price per Square FootThis is a market where watching the value metrics (like price per square foot) can provide insight that you don't get at firstglance. Despite the fact that home prices are rising fairly consistently, the price per square foot of homes listed is declining.Often this can be attributed to new and remodeled homes on the market. Buyers in the area are paying more but also gettingmore for their money.
90-day Average7-day Average
Inventory of Properties Listed for SaleInventory has been falling in recent weeks. Note that declining inventory alone does not signal a strengthening market. Look tothe Market Action Index and Days on Market trends to gauge whether buyer interest is changing with the available supply.
90-day Average7-day Average
Page 4 of 6
Condos & Townhomes in

The Paris911 Team | www.Paris911.com | 661-400-1720
City OverviewSANTA CLARITA, CA
Monday April 13, 2015
Market Action IndexThe SANTA CLARITA market is currently quite strongly in the Seller's Advantage zone (greater than 30). The 90-day MarketAction Index stands at 60.43; indicating very little supply relative to the demand.
Buyers/Sellers Cutoff90-day Average
Market Action Index per QuartileNot surprisingly, all segments in the market are showing high levels of demand. Watch the quartiles for changes before thewhole market changes. Often one end of the market (e.g. the high-end) will weaken before the rest of the market and signal aslowdown for the whole group.
First/Top Second/Upper Third/Lower Fourth/Bottom
Buyers/Sellers Cutoff
Residential house prices are a function of supply and demand, and market conditions can be characterizedby analyzing those factors. Watch this index for sustained changes: if the index falls into the Buyer’sAdvantage zone (below 30) for a long period, prices are likely in for a downward correction.
Page 5 of 6
Condos & Townhomes in

The Paris911 Team | www.Paris911.com | 661-400-1720
City OverviewSANTA CLARITA, CA
Monday April 13, 2015
Days on MarketThe properties have been on the market for an average of 71 days. Half of the listings have come newly on the market in thepast 35 or so days.
90-day Average7-day Average
Days on Market per QuartileIt is not uncommon for the higher priced homes in an area to take longer to sell than those in the lower quartiles.
First/Top Second/Upper Third/Lower Fourth/Bottom
Page 6 of 6
Condos & Townhomes in

MARKET UPDATEParis911 Intel Reports
· Current Real Estate Market Conditions for Condos & Townhomes· Trends in Pricing· Current Levels of Supply and Demand· Value Metrics
· Report for the week ofApril 13, 2015
· Presented by Connor and Paris MacIvor / REMAX of Santa Clarita CAREMAX of Valencia CA / The Paris911 Teamwww.Paris911.com / [email protected]
STEVENSON RANCH,CA
Powered by Altos Research LLC | www.altosresearch.com | Copyright ©2005-2014 Altos Research LLC

Median List Price
58.9
Percent Relisted (reset DOM)
1259
2.0
0 %
Median Number of Bathrooms
13
Inventory of Properties Listed
$ 284
Percent Flip (price increased)
Median House Size (sq ft)
$ 357,500
10 %
3.0
Market Action Index
Median Number of Bedrooms
Asking Price Per Square Foot
0 %
Percent of Properties with Price Decrease
Strong Seller's
±+
±+
±+
≠≠
==
Altos Research Value Statistics
Most Expensive Listing
Average Days on Market (DoM)
Bottom/Fourth
Lower/Third
Upper/Second
Top/First
This Week Real-Time Market Profile Trend
The Market Action Index answers the question "How's the Market?" by measuringthe current rate of sale versus the amount of the inventory. Index above 30implies a seller's advantage. Below 30, conditions give the advantage to thebuyer.
Supply and Demand
Characteristics per Quartile
12 01838
232.5 25
2.0
0
7
3.0 3
0
1
1
24
$ 350,000
3
0
3
2.5
02.0
1035
2
$ 344,900
3.5
21
$ 382,000
3.0$ 569,950
20
0
1465
The Market Action Index has beentrending down recently, but as days-on-market decreases also, there arenot strong signals for the direction ofthe market.
Monday April 13, 2015
The Paris911 Team | www.Paris911.com | 661-400-1720
2
1232
2.0
The median list price in STEVENSONRANCH, CA this week is $357,500. The10 properties have been on themarket for an average of 13 days.
Most expensive 25% of properties
Upper-middle 25% of properties
Lower-middle 25% of properties
Least expensive 25% of properties
Quartile Median Price Beds Baths Age Inventory New Absorbed DOMSq. Ft.
No change
Strong upward trend Strong downward trend
Slight upward trend Slight downward trend±+
== ≠≠
≠=
STEVENSONRANCH, CA
City Overview
Least Expensive Listing
Average List Price
Average Age of Listing
10
$ 585,000
$ 319,000
$ 397,780
21
Trend Key:
Home sales have been exceedingnew inventory for several weeks.However prices have not yet stoppedfalling. Since the market is alreadyin the Seller's zone, expect prices tolevel off very soon. Should the salestrend continue expect that pricescould climb from there.
Page 2 of 6
Condos & Townhomes in

The Paris911 Team | www.Paris911.com | 661-400-1720
City OverviewSTEVENSON
RANCH, CA
Monday April 13, 2015
Median PriceAgain this week we see a downward notch for prices. Pricing has been weak in recent weeks and versus their absolute-highlevel. The Market Action Index is a good leading indicator for the durability of this trend.
90-day Average7-day Average
Quartile PricesPrices have settled at a price plateau across the board. Prices in all four quartiles are basically mixed. Look for a persistent shift(up or down) in the Market Action Index before prices move from these current levels.
First/Top Second/Upper Third/Lower Fourth/Bottom
Page 3 of 6
Condos & Townhomes in

The Paris911 Team | www.Paris911.com | 661-400-1720
City OverviewSTEVENSON
RANCH, CA
Monday April 13, 2015
Price per Square FootDespite recently falling prices, the price per square foot has stayed reasonably flat. This implies that there's a portion of themarket being priced at a premium. You can investigate this condition in the quartile details.
90-day Average7-day Average
Inventory of Properties Listed for SaleInventory has been relatively steady around these levels in recent weeks.
90-day Average7-day Average
Page 4 of 6
Condos & Townhomes in

The Paris911 Team | www.Paris911.com | 661-400-1720
City OverviewSTEVENSON
RANCH, CA
Monday April 13, 2015
Market Action IndexThe STEVENSON RANCH market is currently quite strongly in the Seller's Advantage zone (greater than 30). The 90-day MarketAction Index stands at 58.95; indicating very little supply relative to the demand.
Buyers/Sellers Cutoff90-day Average
Market Action Index per QuartileNot surprisingly, all segments in the market are showing high levels of demand. Watch the quartiles for changes before thewhole market changes. Often one end of the market (e.g. the high-end) will weaken before the rest of the market and signal aslowdown for the whole group.
First/Top Second/Upper Third/Lower Fourth/Bottom
Buyers/Sellers Cutoff
Residential house prices are a function of supply and demand, and market conditions can be characterizedby analyzing those factors. Watch this index for sustained changes: if the index falls into the Buyer’sAdvantage zone (below 30) for a long period, prices are likely in for a downward correction.
Page 5 of 6
Condos & Townhomes in
The Paris911 Team | www.Paris911.com | 661-400-1720
City OverviewSTEVENSON
RANCH, CA
Monday April 13, 2015
Days on MarketThe properties have been on the market for an average of 13 days. Half of the listings have come newly on the market in thepast 7 or so days.
90-day Average7-day Average
Days on Market per QuartileIt is not uncommon for the higher priced homes in an area to take longer to sell than those in the lower quartiles.
First/Top Second/Upper Third/Lower Fourth/Bottom
Page 6 of 6
Condos & Townhomes in

MARKET UPDATEParis911 Intel Reports
· Current Real Estate Market Conditions for Condos & Townhomes· Trends in Pricing· Current Levels of Supply and Demand· Value Metrics
· Report for the week ofApril 13, 2015
· Presented by Connor and Paris MacIvor / REMAX of Santa Clarita CAREMAX of Valencia CA / The Paris911 Teamwww.Paris911.com / [email protected]
VALENCIA, CA
Powered by Altos Research LLC | www.altosresearch.com | Copyright ©2005-2014 Altos Research LLC

Median List Price
53.5
Percent Relisted (reset DOM)
1212
2.0
2 %
Median Number of Bathrooms
37
Inventory of Properties Listed
$ 283
Percent Flip (price increased)
Median House Size (sq ft)
$ 344,950
15 %
2.0
Market Action Index
Median Number of Bedrooms
Asking Price Per Square Foot
4 %
Percent of Properties with Price Decrease
Strong Seller's
==
±+
±+
≠≠
==
Altos Research Value Statistics
Most Expensive Listing
Average Days on Market (DoM)
Bottom/Fourth
Lower/Third
Upper/Second
Top/First
This Week Real-Time Market Profile Trend
The Market Action Index answers the question "How's the Market?" by measuringthe current rate of sale versus the amount of the inventory. Index above 30implies a seller's advantage. Below 30, conditions give the advantage to thebuyer.
Supply and Demand
Characteristics per Quartile
14 11844
642.0 20
1.0
0
22
2.0 14
28
3
1
12
$ 325,000
7
3
14
2.5
12.0
780
14
$ 250,720
2.0
34
$ 357,000
3.0$ 466,100
30
2
1252
Inventory is up and Market Action istrending down recently. While days-on-market appears to be trendinglower, the overall conditions areweakening a bit.
Monday April 13, 2015
The Paris911 Team | www.Paris911.com | 661-400-1720
13
1120
1.0
The median list price in VALENCIA, CAthis week is $344,950. The 55properties have been on the marketfor an average of 37 days.
Most expensive 25% of properties
Upper-middle 25% of properties
Lower-middle 25% of properties
Least expensive 25% of properties
Quartile Median Price Beds Baths Age Inventory New Absorbed DOMSq. Ft.
No change
Strong upward trend Strong downward trend
Slight upward trend Slight downward trend±+
== ≠≠
≠=
VALENCIA, CACity Overview
Least Expensive Listing
Average List Price
Average Age of Listing
55
$ 549,999
$ 152,000
$ 345,521
22
Trend Key:
Home sales continue to outstripsupply and the Market Action Indexhas been moving higher for severalweeks. This is a Seller's market sowatch for upward pricing pressure inthe near future if the trendcontinues.
Page 2 of 6
Condos & Townhomes in

The Paris911 Team | www.Paris911.com | 661-400-1720
City OverviewVALENCIA, CA
Monday April 13, 2015
Median PriceThe market appears to be hovering around this plateau. This week prices eased down a bit. The Market Action Index is a goodleading indicator for the durability of this shift.
90-day Average7-day Average
Quartile PricesPrices have settled at a price plateau across the board. Prices in all four quartiles are basically mixed. Look for a persistent shift(up or down) in the Market Action Index before prices move from these current levels.
First/Top Second/Upper Third/Lower Fourth/Bottom
Page 3 of 6
Condos & Townhomes in

The Paris911 Team | www.Paris911.com | 661-400-1720
City OverviewVALENCIA, CA
Monday April 13, 2015
Price per Square FootThe market plateau is seen across the price and value. The price per square foot and median list price have both beenreasonably stagnant. Watch the Market Action Index for persistent changes as a leading indicator before the market moves fromthese levels.
90-day Average7-day Average
Inventory of Properties Listed for SaleInventory has been climbing lately. Note that rising inventory alone does not signal a weakening market. Look to the MarketAction Index and Days on Market trends to gauge whether buyer interest is keeping up with available supply.
90-day Average7-day Average
Page 4 of 6
Condos & Townhomes in

The Paris911 Team | www.Paris911.com | 661-400-1720
City OverviewVALENCIA, CA
Monday April 13, 2015
Market Action IndexThe VALENCIA market is currently quite strongly in the Seller's Advantage zone (greater than 30). The 90-day Market ActionIndex stands at 53.52; indicating very little supply relative to the demand.
Buyers/Sellers Cutoff90-day Average
Market Action Index per QuartileNot surprisingly, all segments in the market are showing high levels of demand. Watch the quartiles for changes before thewhole market changes. Often one end of the market (e.g. the high-end) will weaken before the rest of the market and signal aslowdown for the whole group.
First/Top Second/Upper Third/Lower Fourth/Bottom
Buyers/Sellers Cutoff
Residential house prices are a function of supply and demand, and market conditions can be characterizedby analyzing those factors. Watch this index for sustained changes: if the index falls into the Buyer’sAdvantage zone (below 30) for a long period, prices are likely in for a downward correction.
Page 5 of 6
Condos & Townhomes in

The Paris911 Team | www.Paris911.com | 661-400-1720
City OverviewVALENCIA, CA
Monday April 13, 2015
Days on MarketThe properties have been on the market for an average of 37 days. Half of the listings have come newly on the market in thepast 14 or so days.
90-day Average7-day Average
Days on Market per QuartileIt is not uncommon for the higher priced homes in an area to take longer to sell than those in the lower quartiles.
First/Top Second/Upper Third/Lower Fourth/Bottom
Page 6 of 6
Condos & Townhomes in

MARKET UPDATEParis911 Intel Reports
· Current Real Estate Market Conditions for Single Family Homes· Trends in Pricing· Current Levels of Supply and Demand· Value Metrics
· Report for the week ofApril 13, 2015
· Presented by Connor and Paris MacIvor / REMAX of Santa Clarita CAREMAX of Valencia CA / The Paris911 Teamwww.Paris911.com / [email protected]
ACTON, CA
Powered by Altos Research LLC | www.altosresearch.com | Copyright ©2005-2014 Altos Research LLC

Median List Price
Median Lot Size
32.0
Percent Relisted (reset DOM)
2259
2.2
2 %
Median Number of Bathrooms
155
Inventory of Properties Listed
$ 220
Percent Flip (price increased)
1.0 - 2.5 acres
Median House Size (sq ft)
$ 512,450
32 %
3.5
Market Action Index
Median Number of Bedrooms
Asking Price Per Square Foot
23 %
Percent of Properties with Price Decrease
Seller's Advantage
≠≠
±+
±+
≠
==
Altos Research Value Statistics
Most Expensive Listing
Average Days on Market (DoM)
Bottom/Fourth
Lower/Third
Upper/Second
Top/First
This Week Real-Time Market Profile Trend
The Market Action Index answers the question "How's the Market?" by measuringthe current rate of sale versus the amount of the inventory. Index above 30implies a seller's advantage. Below 30, conditions give the advantage to thebuyer.
Supply and Demand
Characteristics per Quartile
18 03312
1322.0 29
3.0
2
200
3.0 11
83
2
1
5.0 - 10acres
34
$ 449,900
2
1
11
4.0
1.0 - 2.5acres
13.0
1404 1.0 - 2.5acres
11
$ 259,900
4.0
206
1.0 - 2.5acres$ 599,999
4.0$ 750,000
15
2
2625
Inventory is tightening and days-on-market is falling. But demand asmeasured by the Market Action Indexis also trending down. The market isnot giving strong up or down signalsfrom these data.
Monday April 13, 2015
The Paris911 Team | www.Paris911.com | 661-400-1720
11
1949
2.0
The median list price in ACTON, CAthis week is $512,450. The 44properties have been on the marketfor an average of 155 days.
Most expensive 25% of properties
Upper-middle 25% of properties
Lower-middle 25% of properties
Least expensive 25% of properties
Quartile Median Price Lot Size Beds Baths Age Inventory New Absorbed DOMSq. Ft.
No change
Strong upward trend Strong downward trend
Slight upward trend Slight downward trend±+
== ≠≠
≠=
ACTON, CACity Overview
Least Expensive Listing
Average List Price
Average Age of Listing
44
$ 999,000
$ 140,000
$ 521,578
27
Trend Key:
Home sales continue to outstripsupply and the Market Action Indexhas been moving higher for severalweeks. This is a Seller's market sowatch for upward pricing pressure inthe near future if the trendcontinues.
Page 2 of 6
Single Family Homes in

The Paris911 Team | www.Paris911.com | 661-400-1720
City OverviewACTON, CA
Monday April 13, 2015
Median PricePrice trends continued their recent uptrend this week. While still below the market's price high-point, we've seen a nice runrecently.
90-day Average7-day Average
Quartile PricesPrices have settled at a price plateau across the board. Prices in all four quartiles are basically mixed. Look for a persistent shift(up or down) in the Market Action Index before prices move from these current levels.
First/Top Second/Upper Third/Lower Fourth/Bottom
Page 3 of 6
Single Family Homes in

The Paris911 Team | www.Paris911.com | 661-400-1720
City OverviewACTON, CA
Monday April 13, 2015
Price per Square FootIn a market where prices are rising fairly consistently, price per square foot is essentially flat. This often implies that newhomes coming on the market are pricier, and also larger than older homes. As a result the value one can buy stays the same.
90-day Average7-day Average
Inventory of Properties Listed for SaleInventory has been falling in recent weeks. Note that declining inventory alone does not signal a strengthening market. Look tothe Market Action Index and Days on Market trends to gauge whether buyer interest is changing with the available supply.
90-day Average7-day Average
Page 4 of 6
Single Family Homes in

The Paris911 Team | www.Paris911.com | 661-400-1720
City OverviewACTON, CA
Monday April 13, 2015
Market Action IndexThe ACTON market is currently in the Seller's Advantage zone (greater than 30). The 90-day Market Action Index stands at 31.96which indicates that demand is strong and available supply of homes gets snapped up relatively quickly.
Buyers/Sellers Cutoff90-day Average
Market Action Index per QuartileNot surprisingly, all segments in the market are showing high levels of demand. Watch the quartiles for changes before thewhole market changes. Often one end of the market (e.g. the high-end) will weaken before the rest of the market and signal aslowdown for the whole group.
First/Top Second/Upper Third/Lower Fourth/Bottom
Buyers/Sellers Cutoff
Residential house prices are a function of supply and demand, and market conditions can be characterizedby analyzing those factors. Watch this index for sustained changes: if the index falls into the Buyer’sAdvantage zone (below 30) for a long period, prices are likely in for a downward correction.
Page 5 of 6
Single Family Homes in

The Paris911 Team | www.Paris911.com | 661-400-1720
City OverviewACTON, CA
Monday April 13, 2015
Days on MarketThe properties have been on the market for an average of 155 days. Half of the listings have come newly on the market in thepast 112 or so days.
90-day Average7-day Average
Days on Market per QuartileIt is not uncommon for the higher priced homes in an area to take longer to sell than those in the lower quartiles.
First/Top Second/Upper Third/Lower Fourth/Bottom
Page 6 of 6
Single Family Homes in

MARKET UPDATEParis911 Intel Reports
· Current Real Estate Market Conditions for Single Family Homes· Trends in Pricing· Current Levels of Supply and Demand· Value Metrics
· Report for the week ofApril 13, 2015
· Presented by Connor and Paris MacIvor / REMAX of Santa Clarita CAREMAX of Valencia CA / The Paris911 Teamwww.Paris911.com / [email protected]
CANYON COUNTRY, CA
Powered by Altos Research LLC | www.altosresearch.com | Copyright ©2005-2014 Altos Research LLC

Median List Price
Median Lot Size
47.4
Percent Relisted (reset DOM)
2384
3.0
6 %
Median Number of Bathrooms
85
Inventory of Properties Listed
$ 244
Percent Flip (price increased)
0.25 - 0.50 acre
Median House Size (sq ft)
$ 534,500
26 %
4.0
Market Action Index
Median Number of Bedrooms
Asking Price Per Square Foot
12 %
Percent of Properties with Price Decrease
Strong Seller's
≠
±+
≠
±+
==
Altos Research Value Statistics
Most Expensive Listing
Average Days on Market (DoM)
Bottom/Fourth
Lower/Third
Upper/Second
Top/First
This Week Real-Time Market Profile Trend
The Market Action Index answers the question "How's the Market?" by measuringthe current rate of sale versus the amount of the inventory. Index above 30implies a seller's advantage. Below 30, conditions give the advantage to thebuyer.
Supply and Demand
Characteristics per Quartile
26 14276
463.0 26
3.0
3
59
4.0 25
81
5
7
1.0 - 2.5acres
40
$ 489,900
4
3
25
4.5
0.50 - 1.0acre
43.0
1482 8,001 -10,000 sqft
25
$ 385,000
5.0
153
8,001 -10,000 sqft$ 639,888
5.0$ 1,299,000
13
5
3274
Inventory has been lightening latelyand the Market Action Index has beentrending up. These are mildly positiveindications for the market.
Monday April 13, 2015
The Paris911 Team | www.Paris911.com | 661-400-1720
25
2080
2.0
The median list price in CANYONCOUNTRY, CA this week is $534,500.The 100 properties have been on themarket for an average of 85 days.
Most expensive 25% of properties
Upper-middle 25% of properties
Lower-middle 25% of properties
Least expensive 25% of properties
Quartile Median Price Lot Size Beds Baths Age Inventory New Absorbed DOMSq. Ft.
No change
Strong upward trend Strong downward trend
Slight upward trend Slight downward trend±+
== ≠≠
≠=
CANYONCOUNTRY, CA
City Overview
Least Expensive Listing
Average List Price
Average Age of Listing
100
$ 3,395,000
$ 74,900
$ 709,005
26
Trend Key:
Home sales continue to outstripsupply and the Market Action Indexhas been moving higher for severalweeks. This is a Seller's market sowatch for upward pricing pressure inthe near future if the trendcontinues.
Page 2 of 6
Single Family Homes in

The Paris911 Team | www.Paris911.com | 661-400-1720
City OverviewCANYON
COUNTRY, CA
Monday April 13, 2015
Median PriceDespite this week's up tic, the market seems to have paused around this plateau. The Market Action Index is a good leadingindicator for the durability of this shift.
90-day Average7-day Average
Quartile PricesPrice at the upper end of the market are showing signs of strength. While this strength hasn't percolated through to Quartiles 3and 4 yet, expect the low end of the market to follow up.
First/Top Second/Upper Third/Lower Fourth/Bottom
Page 3 of 6
Single Family Homes in

The Paris911 Team | www.Paris911.com | 661-400-1720
City OverviewCANYON
COUNTRY, CA
Monday April 13, 2015
Price per Square FootWhile prices have been basically flat, the price per square foot has been heading downward. While not a sign of broad strengthin a market, larger homes are coming more available and buyers can see more home for their money.
90-day Average7-day Average
Inventory of Properties Listed for SaleInventory has been falling in recent weeks. Note that declining inventory alone does not signal a strengthening market. Look tothe Market Action Index and Days on Market trends to gauge whether buyer interest is changing with the available supply.
90-day Average7-day Average
Page 4 of 6
Single Family Homes in

The Paris911 Team | www.Paris911.com | 661-400-1720
City OverviewCANYON
COUNTRY, CA
Monday April 13, 2015
Market Action IndexThe CANYON COUNTRY market is currently quite strongly in the Seller's Advantage zone (greater than 30). The 90-day MarketAction Index stands at 47.39; indicating very little supply relative to the demand.
Buyers/Sellers Cutoff90-day Average
Market Action Index per QuartileNot surprisingly, all segments in the market are showing high levels of demand. Watch the quartiles for changes before thewhole market changes. Often one end of the market (e.g. the high-end) will weaken before the rest of the market and signal aslowdown for the whole group.
First/Top Second/Upper Third/Lower Fourth/Bottom
Buyers/Sellers Cutoff
Residential house prices are a function of supply and demand, and market conditions can be characterizedby analyzing those factors. Watch this index for sustained changes: if the index falls into the Buyer’sAdvantage zone (below 30) for a long period, prices are likely in for a downward correction.
Page 5 of 6
Single Family Homes in

The Paris911 Team | www.Paris911.com | 661-400-1720
City OverviewCANYON
COUNTRY, CA
Monday April 13, 2015
Days on MarketThe properties have been on the market for an average of 85 days. Half of the listings have come newly on the market in thepast 35 or so days.
90-day Average7-day Average
Days on Market per QuartileIt is not uncommon for the higher priced homes in an area to take longer to sell than those in the lower quartiles.
First/Top Second/Upper Third/Lower Fourth/Bottom
Page 6 of 6
Single Family Homes in

MARKET UPDATEParis911 Intel Reports
· Current Real Estate Market Conditions for Single Family Homes· Trends in Pricing· Current Levels of Supply and Demand· Value Metrics
· Report for the week ofApril 13, 2015
· Presented by Connor and Paris MacIvor / REMAX of Santa Clarita CAREMAX of Valencia CA / The Paris911 Teamwww.Paris911.com / [email protected]
CASTAIC, CA
Powered by Altos Research LLC | www.altosresearch.com | Copyright ©2005-2014 Altos Research LLC

Median List Price
Median Lot Size
56.5
Percent Relisted (reset DOM)
2052
3.0
4 %
Median Number of Bathrooms
64
Inventory of Properties Listed
$ 229
Percent Flip (price increased)
4,501 - 6,500 sqft
Median House Size (sq ft)
$ 499,950
28 %
3.5
Market Action Index
Median Number of Bedrooms
Asking Price Per Square Foot
2 %
Percent of Properties with Price Decrease
Strong Seller's
=
±+
≠≠
≠≠
==
Altos Research Value Statistics
Most Expensive Listing
Average Days on Market (DoM)
Bottom/Fourth
Lower/Third
Upper/Second
Top/First
This Week Real-Time Market Profile Trend
The Market Action Index answers the question "How's the Market?" by measuringthe current rate of sale versus the amount of the inventory. Index above 30implies a seller's advantage. Below 30, conditions give the advantage to thebuyer.
Supply and Demand
Characteristics per Quartile
21 22744
522.5 15
3.0
5
44
3.0 13
32
4
1
1.0 - 2.5acres
29
$ 449,000
3
3
13
2.8
6,501 -8,000 sqft
13.0
1383 4,501 -6,500 sqft
12
$ 315,000
4.0
130
4,501 -6,500 sqft$ 548,950
4.0$ 807,500
15
2
2700
Inventory is up and Market Action istrending down recently. While days-on-market appears to be trendinglower, the overall conditions areweakening a bit.
Monday April 13, 2015
The Paris911 Team | www.Paris911.com | 661-400-1720
12
1933
2.0
The median list price in CASTAIC, CAthis week is $499,950. The 50properties have been on the marketfor an average of 64 days.
Most expensive 25% of properties
Upper-middle 25% of properties
Lower-middle 25% of properties
Least expensive 25% of properties
Quartile Median Price Lot Size Beds Baths Age Inventory New Absorbed DOMSq. Ft.
No change
Strong upward trend Strong downward trend
Slight upward trend Slight downward trend±+
== ≠≠
≠=
CASTAIC, CACity Overview
Least Expensive Listing
Average List Price
Average Age of Listing
50
$ 2,200,000
$ 200,000
$ 581,990
23
Trend Key:
Home sales continue to outstripsupply and the Market Action Indexhas been moving higher for severalweeks. This is a Seller's market sowatch for upward pricing pressure inthe near future if the trendcontinues.
Page 2 of 6
Single Family Homes in
The Paris911 Team | www.Paris911.com | 661-400-1720
City OverviewCASTAIC, CA
Monday April 13, 2015
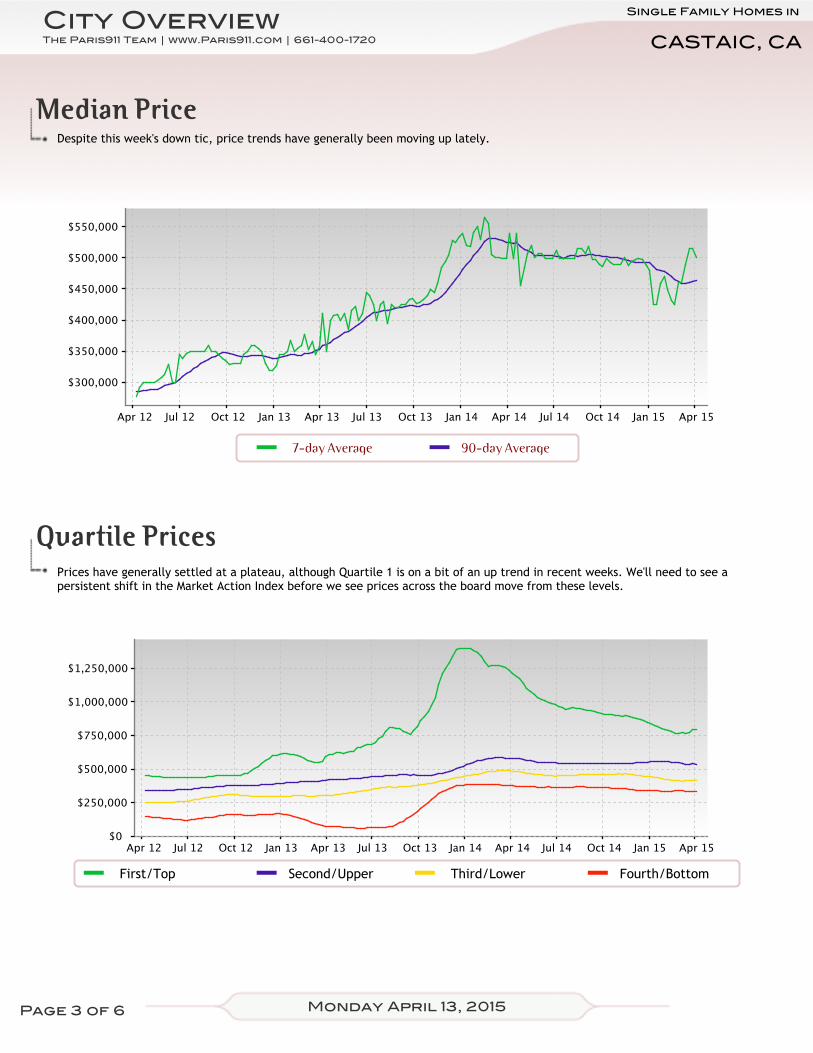
Median PriceDespite this week's down tic, price trends have generally been moving up lately.
90-day Average7-day Average
Quartile PricesPrices have generally settled at a plateau, although Quartile 1 is on a bit of an up trend in recent weeks. We'll need to see apersistent shift in the Market Action Index before we see prices across the board move from these levels.
First/Top Second/Upper Third/Lower Fourth/Bottom
Page 3 of 6
Single Family Homes in

The Paris911 Team | www.Paris911.com | 661-400-1720
City OverviewCASTAIC, CA
Monday April 13, 2015
Price per Square FootThis is a market where watching the value metrics (like price per square foot) can provide insight that you don't get at firstglance. Despite the fact that home prices are rising fairly consistently, the price per square foot of homes listed is declining.Often this can be attributed to new and remodeled homes on the market. Buyers in the area are paying more but also gettingmore for their money.
90-day Average7-day Average
Inventory of Properties Listed for SaleInventory has been climbing lately. Note that rising inventory alone does not signal a weakening market. Look to the MarketAction Index and Days on Market trends to gauge whether buyer interest is keeping up with available supply.
90-day Average7-day Average
Page 4 of 6
Single Family Homes in

The Paris911 Team | www.Paris911.com | 661-400-1720
City OverviewCASTAIC, CA
Monday April 13, 2015
Market Action IndexThe CASTAIC market is currently quite strongly in the Seller's Advantage zone (greater than 30). The 90-day Market Action Indexstands at 56.55; indicating very little supply relative to the demand.
Buyers/Sellers Cutoff90-day Average
Market Action Index per QuartileNot surprisingly, all segments in the market are showing high levels of demand. Watch the quartiles for changes before thewhole market changes. Often one end of the market (e.g. the high-end) will weaken before the rest of the market and signal aslowdown for the whole group.
First/Top Second/Upper Third/Lower Fourth/Bottom
Buyers/Sellers Cutoff
Residential house prices are a function of supply and demand, and market conditions can be characterizedby analyzing those factors. Watch this index for sustained changes: if the index falls into the Buyer’sAdvantage zone (below 30) for a long period, prices are likely in for a downward correction.
Page 5 of 6
Single Family Homes in

The Paris911 Team | www.Paris911.com | 661-400-1720
City OverviewCASTAIC, CA
Monday April 13, 2015
Days on MarketThe properties have been on the market for an average of 64 days. Half of the listings have come newly on the market in thepast 24 or so days.
90-day Average7-day Average
Days on Market per QuartileIt is not uncommon for the higher priced homes in an area to take longer to sell than those in the lower quartiles.
First/Top Second/Upper Third/Lower Fourth/Bottom
Page 6 of 6
Single Family Homes in

MARKET UPDATEParis911 Intel Reports
· Current Real Estate Market Conditions for Single Family Homes· Trends in Pricing· Current Levels of Supply and Demand· Value Metrics
· Report for the week ofApril 13, 2015
· Presented by Connor and Paris MacIvor / REMAX of Santa Clarita CAREMAX of Valencia CA / The Paris911 Teamwww.Paris911.com / [email protected]
NEWHALL, CA
Powered by Altos Research LLC | www.altosresearch.com | Copyright ©2005-2014 Altos Research LLC

Median List Price
Median Lot Size
42.9
Percent Relisted (reset DOM)
2297
2.5
0 %
Median Number of Bathrooms
71
Inventory of Properties Listed
$ 259
Percent Flip (price increased)
8,001 - 10,000 sqft
Median House Size (sq ft)
$ 549,950
24 %
4.0
Market Action Index
Median Number of Bedrooms
Asking Price Per Square Foot
3 %
Percent of Properties with Price Decrease
Seller's Advantage
±+
±+
==
=
==
Altos Research Value Statistics
Most Expensive Listing
Average Days on Market (DoM)
Bottom/Fourth
Lower/Third
Upper/Second
Top/First
This Week Real-Time Market Profile Trend
The Market Action Index answers the question "How's the Market?" by measuringthe current rate of sale versus the amount of the inventory. Index above 30implies a seller's advantage. Below 30, conditions give the advantage to thebuyer.
Supply and Demand
Characteristics per Quartile
30 13088
1032.2 41
4.0
1
48
4.0 8
43
1
1
0.25 - 0.50acre
48
$ 531,250
0
0
9
2.5
8,001 -10,000 sqft
13.0
1506 6,501 -8,000 sqft
8
$ 450,000
4.5
94
8,001 -10,000 sqft$ 627,500
4.0$ 824,950
30
1
2649
The Market Action index has beentrending down lately, while days-on-market is climbing, providing mostlybearish signs for the market.
Monday April 13, 2015
The Paris911 Team | www.Paris911.com | 661-400-1720
8
2028
2.0
The median list price in NEWHALL, CAthis week is $549,950. The 33properties have been on the marketfor an average of 71 days.
Most expensive 25% of properties
Upper-middle 25% of properties
Lower-middle 25% of properties
Least expensive 25% of properties
Quartile Median Price Lot Size Beds Baths Age Inventory New Absorbed DOMSq. Ft.
No change
Strong upward trend Strong downward trend
Slight upward trend Slight downward trend±+
== ≠≠
≠=
NEWHALL, CACity Overview
Least Expensive Listing
Average List Price
Average Age of Listing
33
$ 1,679,000
$ 350,000
$ 628,080
37
Trend Key:
Home sales continue to outstripsupply and the Market Action Indexhas been moving higher for severalweeks. This is a Seller's market sowatch for upward pricing pressure inthe near future if the trendcontinues.
Page 2 of 6
Single Family Homes in

The Paris911 Team | www.Paris911.com | 661-400-1720
City OverviewNEWHALL, CA
Monday April 13, 2015
Median PriceAgain this week we see a downward notch for prices. Pricing has been weak in recent weeks and versus their absolute-highlevels. The Market Action Index is a good leading indicator for the durability of this trend.
90-day Average7-day Average
Quartile PricesPrices have settled at a price plateau across the board. Prices in all four quartiles are basically mixed. Look for a persistent shift(up or down) in the Market Action Index before prices move from these current levels.
First/Top Second/Upper Third/Lower Fourth/Bottom
Page 3 of 6
Single Family Homes in

The Paris911 Team | www.Paris911.com | 661-400-1720
City OverviewNEWHALL, CA
Monday April 13, 2015
Price per Square FootWe're seeing fairly unusual market conditions as prices have been in a downward trend but price per square foot is actuallyincreasing. (Buyers are paying less and getting less home for their money.) Anomalies like these can be attributed to micro-location variables.
90-day Average7-day Average
Inventory of Properties Listed for SaleInventory has been relatively steady around these levels in recent weeks.
90-day Average7-day Average
Page 4 of 6
Single Family Homes in

The Paris911 Team | www.Paris911.com | 661-400-1720
City OverviewNEWHALL, CA
Monday April 13, 2015
Market Action IndexThe NEWHALL market is currently in the Seller's Advantage zone (greater than 30). The 90-day Market Action Index stands at42.86 which indicates that demand is strong and available supply of homes gets snapped up relatively quickly.
Buyers/Sellers Cutoff90-day Average
Market Action Index per QuartileNot surprisingly, all segments in the market are showing high levels of demand. Watch the quartiles for changes before thewhole market changes. Often one end of the market (e.g. the high-end) will weaken before the rest of the market and signal aslowdown for the whole group.
First/Top Second/Upper Third/Lower Fourth/Bottom
Buyers/Sellers Cutoff
Residential house prices are a function of supply and demand, and market conditions can be characterizedby analyzing those factors. Watch this index for sustained changes: if the index falls into the Buyer’sAdvantage zone (below 30) for a long period, prices are likely in for a downward correction.
Page 5 of 6
Single Family Homes in

The Paris911 Team | www.Paris911.com | 661-400-1720
City OverviewNEWHALL, CA
Monday April 13, 2015
Days on MarketThe properties have been on the market for an average of 71 days. Half of the listings have come newly on the market in thepast 56 or so days.
90-day Average7-day Average
Days on Market per QuartileIt is not uncommon for the higher priced homes in an area to take longer to sell than those in the lower quartiles.
First/Top Second/Upper Third/Lower Fourth/Bottom
Page 6 of 6
Single Family Homes in

MARKET UPDATEParis911 Intel Reports
· Current Real Estate Market Conditions for Single Family Homes· Trends in Pricing· Current Levels of Supply and Demand· Value Metrics
· Report for the week ofApril 13, 2015
· Presented by Connor and Paris MacIvor / REMAX of Santa Clarita CAREMAX of Valencia CA / The Paris911 Teamwww.Paris911.com / [email protected]
SANTA CLARITA, CA
Powered by Altos Research LLC | www.altosresearch.com | Copyright ©2005-2014 Altos Research LLC
Median List Price
Median Lot Size
41.9
Percent Relisted (reset DOM)
2268
3.0
5 %
Median Number of Bathrooms
77
Inventory of Properties Listed
$ 242
Percent Flip (price increased)
6,501 - 8,000 sqft
Median House Size (sq ft)
$ 564,950
31 %
4.0
Market Action Index
Median Number of Bedrooms
Asking Price Per Square Foot
6 %
Percent of Properties with Price Decrease
Seller's Advantage
±+
±+
±+
±+
=
Altos Research Value Statistics
Most Expensive Listing
Average Days on Market (DoM)
Bottom/Fourth
Lower/Third
Upper/Second
Top/First
This Week Real-Time Market Profile Trend
The Market Action Index answers the question "How's the Market?" by measuringthe current rate of sale versus the amount of the inventory. Index above 30implies a seller's advantage. Below 30, conditions give the advantage to thebuyer.
Supply and Demand
Characteristics per Quartile
12 13248
563.0 28
3.0
6
72
4.0 30
51
5
5
0.25 - 0.50acre
50
$ 503,500
3
3
30
3.0
6,501 -8,000 sqft
23.0
1456 4,501 -6,500 sqft
30
$ 399,500
4.0
131
8,001 -10,000 sqft$ 620,000
4.5$ 763,900
15
5
2702
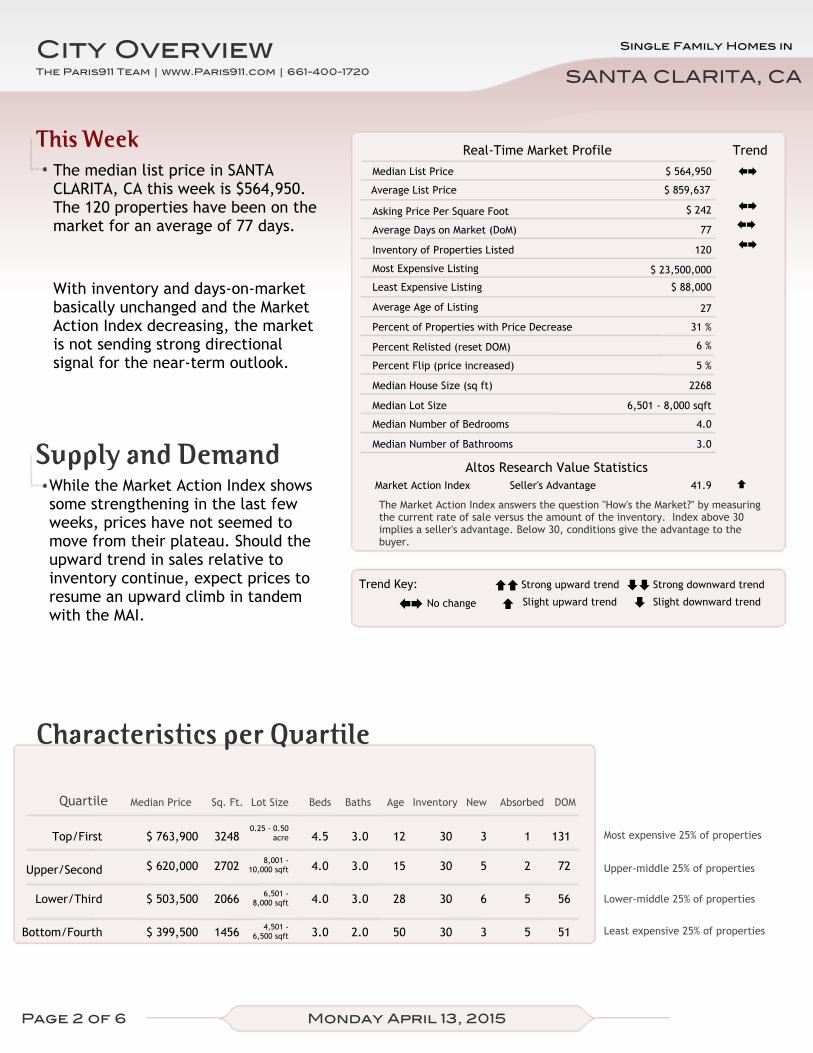
With inventory and days-on-marketbasically unchanged and the MarketAction Index decreasing, the marketis not sending strong directionalsignal for the near-term outlook.
Monday April 13, 2015
The Paris911 Team | www.Paris911.com | 661-400-1720
30
2066
2.0
The median list price in SANTACLARITA, CA this week is $564,950.The 120 properties have been on themarket for an average of 77 days.
Most expensive 25% of properties
Upper-middle 25% of properties
Lower-middle 25% of properties
Least expensive 25% of properties
Quartile Median Price Lot Size Beds Baths Age Inventory New Absorbed DOMSq. Ft.
No change
Strong upward trend Strong downward trend
Slight upward trend Slight downward trend±+
== ≠≠
≠=
SANTA CLARITA, CACity Overview
Least Expensive Listing
Average List Price
Average Age of Listing
120
$ 23,500,000
$ 88,000
$ 859,637
27
Trend Key:
While the Market Action Index showssome strengthening in the last fewweeks, prices have not seemed tomove from their plateau. Should theupward trend in sales relative toinventory continue, expect prices toresume an upward climb in tandemwith the MAI.
Page 2 of 6
Single Family Homes in

The Paris911 Team | www.Paris911.com | 661-400-1720
City OverviewSANTA CLARITA, CA
Monday April 13, 2015
Median PricePrices have moved upward in the last few weeks and are nearing the market's all time high. A persistent drop of the MarketAction Index into the Buyer's zone will be a leading indicator of the price strength subsiding.
90-day Average7-day Average
Quartile PricesPrices have settled at a price plateau across the board. Prices in all four quartiles are basically mixed. Look for a persistent shift(up or down) in the Market Action Index before prices move from these current levels.
First/Top Second/Upper Third/Lower Fourth/Bottom
Page 3 of 6
Single Family Homes in

The Paris911 Team | www.Paris911.com | 661-400-1720
City OverviewSANTA CLARITA, CA
Monday April 13, 2015
Price per Square FootIn a market where prices are rising mildly, price per square foot is essentially flat. This often implies that new homes coming onthe market are pricier, and also larger than older homes. As a result the value one can buy stays the same.
90-day Average7-day Average
Inventory of Properties Listed for SaleInventory has been relatively steady around these levels in recent weeks.
90-day Average7-day Average
Page 4 of 6
Single Family Homes in

The Paris911 Team | www.Paris911.com | 661-400-1720
City OverviewSANTA CLARITA, CA
Monday April 13, 2015
Market Action IndexThe SANTA CLARITA market is currently in the Seller's Advantage zone (greater than 30). The 90-day Market Action Index standsat 41.86 which indicates that demand is strong and available supply of homes gets snapped up relatively quickly.
Buyers/Sellers Cutoff90-day Average
Market Action Index per QuartileNot surprisingly, all segments in the market are showing high levels of demand. Watch the quartiles for changes before thewhole market changes. Often one end of the market (e.g. the high-end) will weaken before the rest of the market and signal aslowdown for the whole group.
First/Top Second/Upper Third/Lower Fourth/Bottom
Buyers/Sellers Cutoff
Residential house prices are a function of supply and demand, and market conditions can be characterizedby analyzing those factors. Watch this index for sustained changes: if the index falls into the Buyer’sAdvantage zone (below 30) for a long period, prices are likely in for a downward correction.
Page 5 of 6
Single Family Homes in

The Paris911 Team | www.Paris911.com | 661-400-1720
City OverviewSANTA CLARITA, CA
Monday April 13, 2015
Days on MarketThe properties have been on the market for an average of 77 days. Half of the listings have come newly on the market in thepast 42 or so days.
90-day Average7-day Average
Days on Market per QuartileIt is not uncommon for the higher priced homes in an area to take longer to sell than those in the lower quartiles.
First/Top Second/Upper Third/Lower Fourth/Bottom
Page 6 of 6
Single Family Homes in

MARKET UPDATEParis911 Intel Reports
· Current Real Estate Market Conditions for Single Family Homes· Trends in Pricing· Current Levels of Supply and Demand· Value Metrics
· Report for the week ofApril 13, 2015
· Presented by Connor and Paris MacIvor / REMAX of Santa Clarita CAREMAX of Valencia CA / The Paris911 Teamwww.Paris911.com / [email protected]
STEVENSON RANCH,CA
Powered by Altos Research LLC | www.altosresearch.com | Copyright ©2005-2014 Altos Research LLC

Median List Price
Median Lot Size
45.5
Percent Relisted (reset DOM)
3147
3.0
2 %
Median Number of Bathrooms
33
Inventory of Properties Listed
$ 271
Percent Flip (price increased)
6,501 - 8,000 sqft
Median House Size (sq ft)
$ 800,000
23 %
5.0
Market Action Index
Median Number of Bedrooms
Asking Price Per Square Foot
0 %
Percent of Properties with Price Decrease
Strong Seller's
==
±+
≠
≠≠
=
Altos Research Value Statistics
Most Expensive Listing
Average Days on Market (DoM)
Bottom/Fourth
Lower/Third
Upper/Second
Top/First
This Week Real-Time Market Profile Trend
The Market Action Index answers the question "How's the Market?" by measuringthe current rate of sale versus the amount of the inventory. Index above 30implies a seller's advantage. Below 30, conditions give the advantage to thebuyer.
Supply and Demand
Characteristics per Quartile
11 25382
213.0 14
4.0
5
20
5.0 11
22
3
2
0.25 - 0.50acre
17
$ 795,000
3
3
11
5.5
6,501 -8,000 sqft
04.0
2215 4,501 -6,500 sqft
11
$ 624,900
5.0
71
8,001 -10,000 sqft$ 895,000
5.0$ 2,087,450
15
1
3260
Inventory is up and Market Action istrending down recently. While days-on-market appears to be trendinglower, the overall conditions areweakening a bit.
Monday April 13, 2015
The Paris911 Team | www.Paris911.com | 661-400-1720
10
3076
3.0
The median list price in STEVENSONRANCH, CA this week is $800,000. The43 properties have been on themarket for an average of 33 days.
Most expensive 25% of properties
Upper-middle 25% of properties
Lower-middle 25% of properties
Least expensive 25% of properties
Quartile Median Price Lot Size Beds Baths Age Inventory New Absorbed DOMSq. Ft.
No change
Strong upward trend Strong downward trend
Slight upward trend Slight downward trend±+
== ≠≠
≠=
STEVENSONRANCH, CA
City Overview
Least Expensive Listing
Average List Price
Average Age of Listing
43
$ 3,600,000
$ 485,000
$ 1,075,550
14
Trend Key:
While the Market Action Index showssome strengthening in the last fewweeks, prices have settled in a bit ofa plateau. We currently in a Seller'smarket so prices will likely resumetheir climb should this trend persist.
Page 2 of 6
Single Family Homes in

The Paris911 Team | www.Paris911.com | 661-400-1720
City OverviewSTEVENSON
RANCH, CA
Monday April 13, 2015
Median PriceDespite this week's down tic, the market seems to have paused around this plateau. The Market Action Index is a good leadingindicator for the durability of this shift.
90-day Average7-day Average
Quartile PricesPrices have generally settled at a plateau, although Quartile 1 is on a bit of an up trend in recent weeks. We'll need to see apersistent shift in the Market Action Index before we see prices across the board move from these levels.
First/Top Second/Upper Third/Lower Fourth/Bottom
Page 3 of 6
Single Family Homes in

The Paris911 Team | www.Paris911.com | 661-400-1720
City OverviewSTEVENSON
RANCH, CA
Monday April 13, 2015
Price per Square FootWhile prices have been basically flat, the price per square foot has been heading downward. While not a sign of broad strengthin a market, larger homes are coming more available and buyers can see more home for their money.
90-day Average7-day Average
Inventory of Properties Listed for SaleInventory has been climbing lately. Note that rising inventory alone does not signal a weakening market. Look to the MarketAction Index and Days on Market trends to gauge whether buyer interest is keeping up with available supply.
90-day Average7-day Average
Page 4 of 6
Single Family Homes in

The Paris911 Team | www.Paris911.com | 661-400-1720
City OverviewSTEVENSON
RANCH, CA
Monday April 13, 2015
Market Action IndexThe STEVENSON RANCH market is currently quite strongly in the Seller's Advantage zone (greater than 30). The 90-day MarketAction Index stands at 45.48; indicating very little supply relative to the demand.
Buyers/Sellers Cutoff90-day Average
Market Action Index per QuartileThree of the four quartiles of the market are in the Seller's Market zone with relatively low amounts of inventory given thecurrent rate of demand for homes in the quartile. Notice that Quartile 1 (the highest-end price group) is showing weakerdemand than the others. It's not uncommon that the premium segment of the market takes longer to sell than the rest of thegroup.
First/Top Second/Upper Third/Lower Fourth/Bottom
Buyers/Sellers Cutoff
Residential house prices are a function of supply and demand, and market conditions can be characterizedby analyzing those factors. Watch this index for sustained changes: if the index falls into the Buyer’sAdvantage zone (below 30) for a long period, prices are likely in for a downward correction.
Page 5 of 6
Single Family Homes in

The Paris911 Team | www.Paris911.com | 661-400-1720
City OverviewSTEVENSON
RANCH, CA
Monday April 13, 2015
Days on MarketThe properties have been on the market for an average of 33 days. Half of the listings have come newly on the market in thepast 14 or so days.
90-day Average7-day Average
Days on Market per QuartileIt is not uncommon for the higher priced homes in an area to take longer to sell than those in the lower quartiles.
First/Top Second/Upper Third/Lower Fourth/Bottom
Page 6 of 6
Single Family Homes in

MARKET UPDATEParis911 Intel Reports
· Current Real Estate Market Conditions for Single Family Homes· Trends in Pricing· Current Levels of Supply and Demand· Value Metrics
· Report for the week ofApril 13, 2015
· Presented by Connor and Paris MacIvor / REMAX of Santa Clarita CAREMAX of Valencia CA / The Paris911 Teamwww.Paris911.com / [email protected]
VALENCIA, CA
Powered by Altos Research LLC | www.altosresearch.com | Copyright ©2005-2014 Altos Research LLC

Median List Price
Median Lot Size
64.1
Percent Relisted (reset DOM)
2190
3.0
6 %
Median Number of Bathrooms
54
Inventory of Properties Listed
$ 259
Percent Flip (price increased)
4,501 - 6,500 sqft
Median House Size (sq ft)
$ 573,000
19 %
4.0
Market Action Index
Median Number of Bedrooms
Asking Price Per Square Foot
5 %
Percent of Properties with Price Decrease
Strong Seller's
=
±+
±+
≠≠
==
Altos Research Value Statistics
Most Expensive Listing
Average Days on Market (DoM)
Bottom/Fourth
Lower/Third
Upper/Second
Top/First
This Week Real-Time Market Profile Trend
The Market Action Index answers the question "How's the Market?" by measuringthe current rate of sale versus the amount of the inventory. Index above 30implies a seller's advantage. Below 30, conditions give the advantage to thebuyer.
Supply and Demand
Characteristics per Quartile
18 13530
462.0 31
3.0
6
64
4.0 21
29
6
6
6,501 -8,000 sqft
36
$ 519,000
3
7
21
4.0
4,501 -6,500 sqft
73.0
1558 6,501 -8,000 sqft
21
$ 450,000
4.0
79
4,501 -6,500 sqft$ 639,000
5.0$ 785,000
19
8
2279
Inventory is up and Market Action istrending down recently. While days-on-market appears to be trendinglower, the overall conditions areweakening a bit.
Monday April 13, 2015
The Paris911 Team | www.Paris911.com | 661-400-1720
21
2141
2.0
The median list price in VALENCIA, CAthis week is $573,000. The 84properties have been on the marketfor an average of 54 days.
Most expensive 25% of properties
Upper-middle 25% of properties
Lower-middle 25% of properties
Least expensive 25% of properties
Quartile Median Price Lot Size Beds Baths Age Inventory New Absorbed DOMSq. Ft.
No change
Strong upward trend Strong downward trend
Slight upward trend Slight downward trend±+
== ≠≠
≠=
VALENCIA, CACity Overview
Least Expensive Listing
Average List Price
Average Age of Listing
84
$ 1,025,000
$ 410,000
$ 603,837
24
Trend Key:
Home sales continue to outstripsupply and the Market Action Indexhas been moving higher for severalweeks. This is a Seller's market sowatch for upward pricing pressure inthe near future if the trendcontinues.
Page 2 of 6
Single Family Homes in

The Paris911 Team | www.Paris911.com | 661-400-1720
City OverviewVALENCIA, CA
Monday April 13, 2015
Median PriceThis week's up tic in prices has moved us a bit closer to the high-point of the market, but doesn't break us out of the downwardtrend over the last few weeks.
90-day Average7-day Average
Quartile PricesPrices have settled at a price plateau across the board. Prices in all four quartiles are basically mixed. Look for a persistent shift(up or down) in the Market Action Index before prices move from these current levels.
First/Top Second/Upper Third/Lower Fourth/Bottom
Page 3 of 6
Single Family Homes in

The Paris911 Team | www.Paris911.com | 661-400-1720
City OverviewVALENCIA, CA
Monday April 13, 2015
Price per Square FootDespite recently falling prices, the price per square foot has stayed reasonably flat. This implies that there's a portion of themarket being priced at a premium. You can investigate this condition in the quartile details.
90-day Average7-day Average
Inventory of Properties Listed for SaleInventory has been climbing lately. Note that rising inventory alone does not signal a weakening market. Look to the MarketAction Index and Days on Market trends to gauge whether buyer interest is keeping up with available supply.
90-day Average7-day Average
Page 4 of 6
Single Family Homes in

The Paris911 Team | www.Paris911.com | 661-400-1720
City OverviewVALENCIA, CA
Monday April 13, 2015
Market Action IndexThe VALENCIA market is currently quite strongly in the Seller's Advantage zone (greater than 30). The 90-day Market ActionIndex stands at 64.14; indicating very little supply relative to the demand.
Buyers/Sellers Cutoff90-day Average
Market Action Index per QuartileNot surprisingly, all segments in the market are showing high levels of demand. Watch the quartiles for changes before thewhole market changes. Often one end of the market (e.g. the high-end) will weaken before the rest of the market and signal aslowdown for the whole group.
First/Top Second/Upper Third/Lower Fourth/Bottom
Buyers/Sellers Cutoff
Residential house prices are a function of supply and demand, and market conditions can be characterizedby analyzing those factors. Watch this index for sustained changes: if the index falls into the Buyer’sAdvantage zone (below 30) for a long period, prices are likely in for a downward correction.
Page 5 of 6
Single Family Homes in

The Paris911 Team | www.Paris911.com | 661-400-1720
City OverviewVALENCIA, CA
Monday April 13, 2015
Days on MarketThe properties have been on the market for an average of 54 days. Half of the listings have come newly on the market in thepast 21 or so days.
90-day Average7-day Average
Days on Market per QuartileIt is not uncommon for the higher priced homes in an area to take longer to sell than those in the lower quartiles.
First/Top Second/Upper Third/Lower Fourth/Bottom
Page 6 of 6
Single Family Homes in