Embed Size (px)
DESCRIPTION
Citation preview
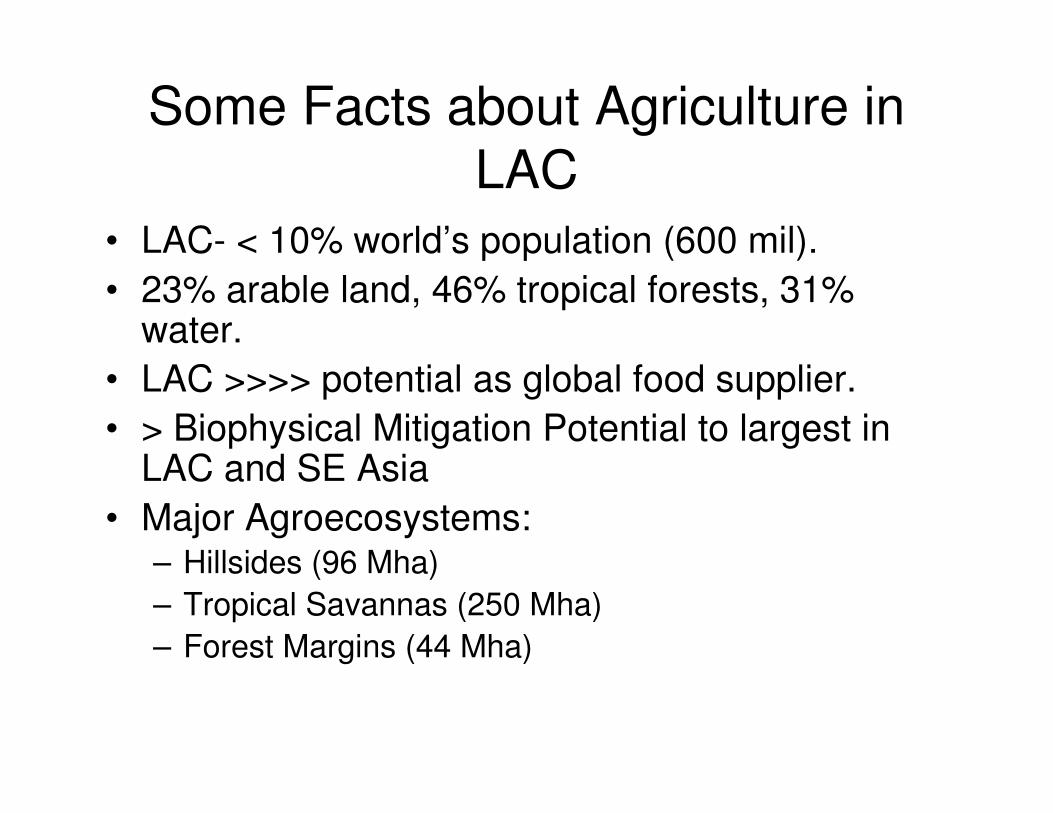
Some Facts about Agriculture in
LAC
• LAC- < 10% world’s population (600 mil).
• 23% arable land, 46% tropical forests, 31% water.
• LAC >>>> potential as global food supplier.
• > Biophysical Mitigation Potential to largest in LAC and SE Asia
• Major Agroecosystems:– Hillsides (96 Mha)
– Tropical Savannas (250 Mha)
– Forest Margins (44 Mha)
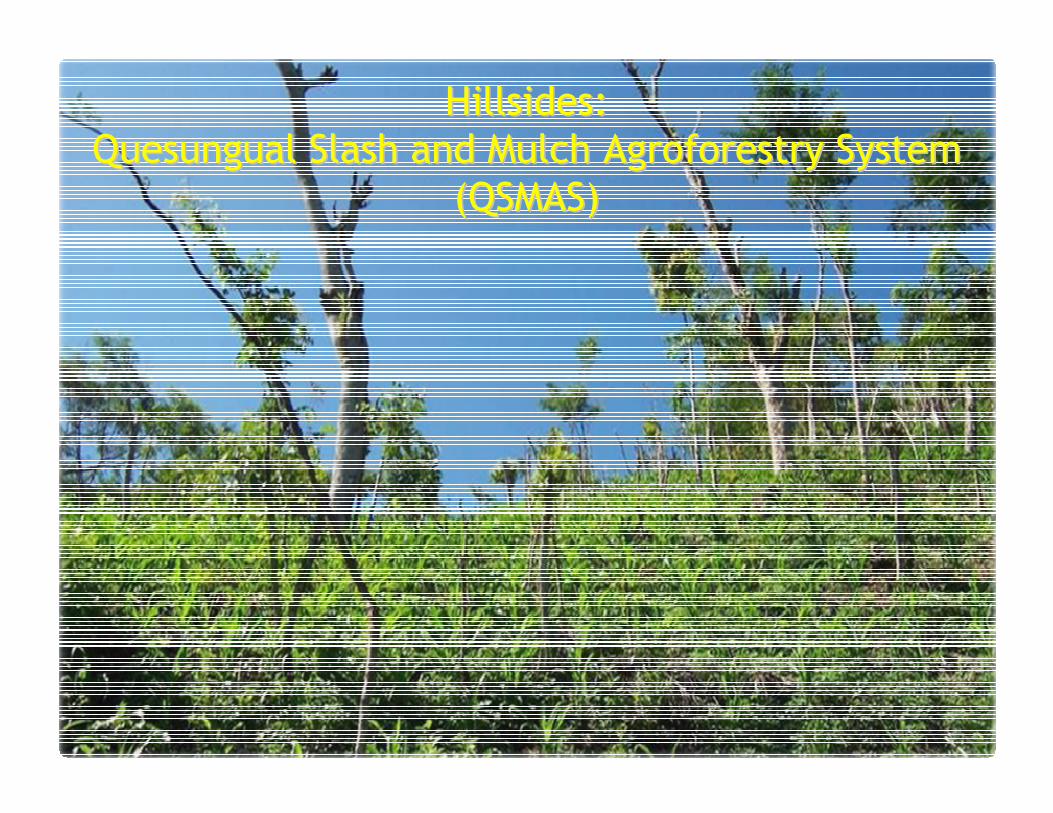
Hillsides:Hillsides:
QuesungualQuesungual Slash and Mulch Slash and Mulch AgroforestryAgroforestry System System
(QSMAS)(QSMAS)
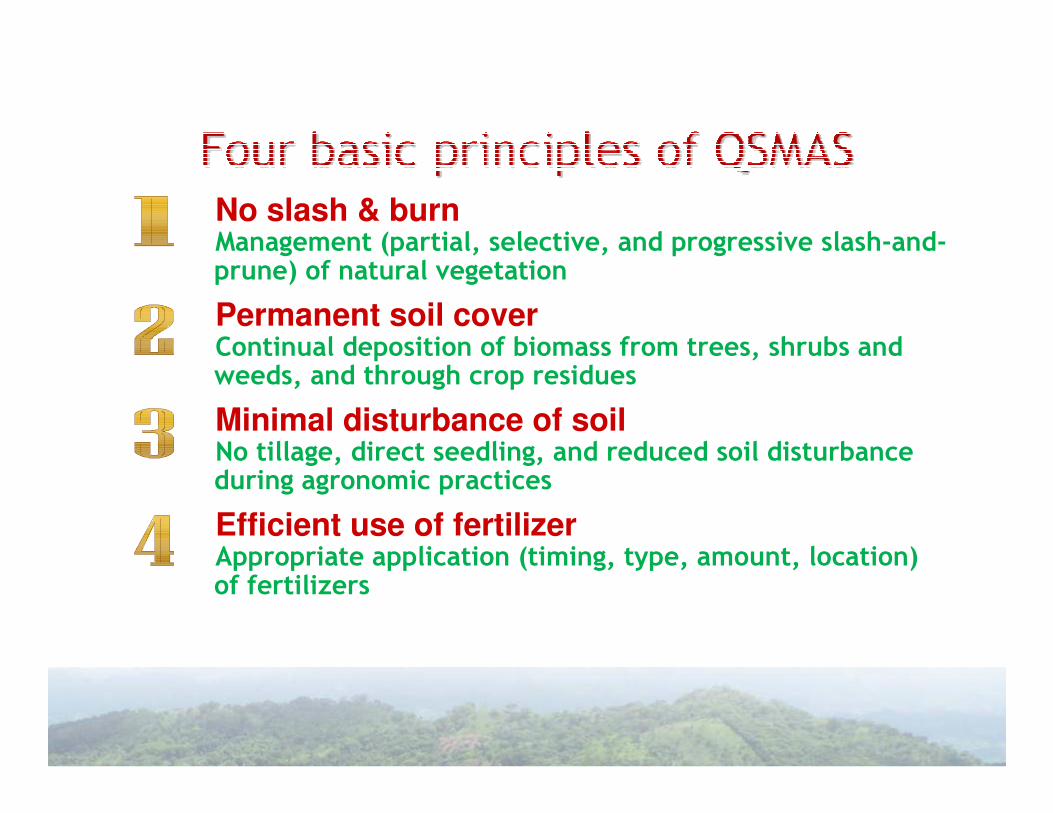
No slash & burnManagement (partial, selective, and progressive slash-and-prune) of natural vegetation
Permanent soil coverContinual deposition of biomass from trees, shrubs and weeds, and through crop residues
Minimal disturbance of soilNo tillage, direct seedling, and reduced soil disturbance during agronomic practices
Efficient use of fertilizerAppropriate application (timing, type, amount, location) of fertilizers
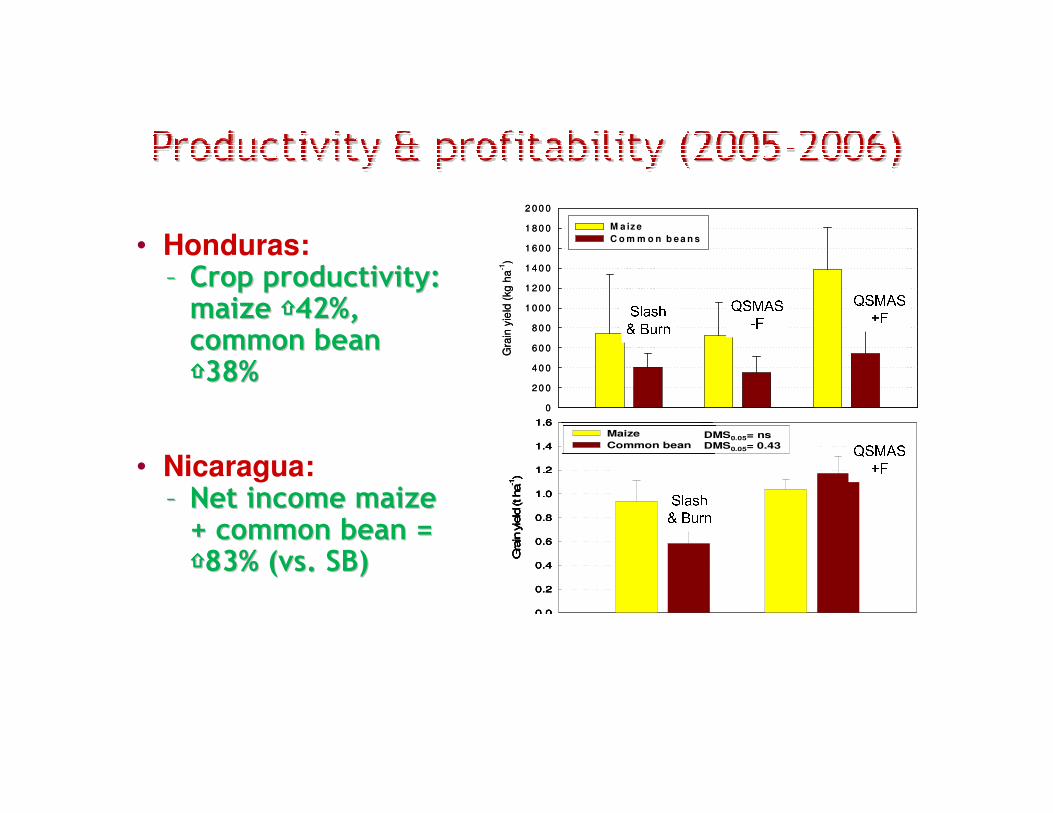
• Honduras:–– Crop productivity: Crop productivity:
maize maize ⇧⇧⇧⇧⇧⇧⇧⇧42%, 42%, common bean common bean ⇧⇧⇧⇧⇧⇧⇧⇧38%38%
• Nicaragua:–– Net income maize Net income maize
+ common bean = + common bean = ⇧⇧⇧⇧⇧⇧⇧⇧83% (vs. SB)83% (vs. SB)
Gra
in y
ield
(kg h
a-1
)
0
2 0 0
4 0 0
6 0 0
8 0 0
1 0 0 0
1 2 0 0
1 4 0 0
1 6 0 0
1 8 0 0
2 0 0 0
M a iz e
C o m m o n b e a n s
Gra
in y
ield
(kg h
a-1
)
0
2 0 0
4 0 0
6 0 0
8 0 0
1 0 0 0
1 2 0 0
1 4 0 0
1 6 0 0
1 8 0 0
2 0 0 0
M a iz e
C o m m o n b e a n sSlash& Burn QSMAS-F QSMAS+FG
rain
yie
ld (t ha
-1)
0.0
0.2
0.4
0.6
0.8
1.0
1.2
1.4
1.6
Maize
Common beanDMS0.05= nsDMS0.05= 0.43
Gra
in y
ield
(t ha
-1)
0.0
0.2
0.4
0.6
0.8
1.0
1.2
1.4
1.6
Maize
Common beanDMS0.05= nsDMS0.05= 0.43
Maize
Common beanDMS0.05= nsDMS0.05= 0.43
Gra
in y
ield
(t ha
-1)
0.0
0.2
0.4
0.6
0.8
1.0
1.2
1.4
1.6
Maize
Common beanDMS0.05= nsDMS0.05= 0.43
Gra
in y
ield
(t ha
-1)
0.0
0.2
0.4
0.6
0.8
1.0
1.2
1.4
1.6
Maize
Common beanDMS0.05= nsDMS0.05= 0.43
Maize
Common beanDMS0.05= nsDMS0.05= 0.43Slash& Burn QSMAS+F
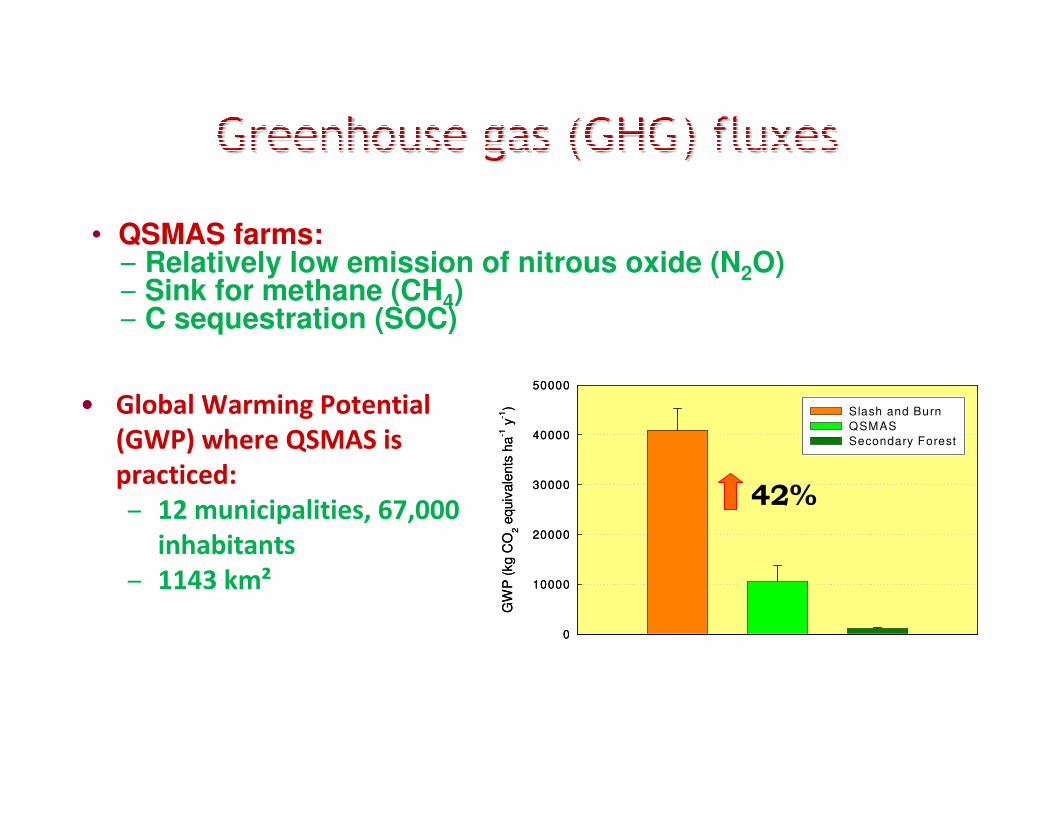
• QSMAS farms:– Relatively low emission of nitrous oxide (N2O)– Sink for methane (CH4)– C sequestration (SOC)
GW
P (
kg
CO
2 e
quiv
ale
nts
ha
-1 y
-1)
0
10000
20000
30000
40000
50000
Slash and Burn
QSMAS
Secondary Forest
GW
P (
kg
CO
2 e
quiv
ale
nts
ha
-1 y
-1)
0
10000
20000
30000
40000
50000
Slash and Burn
QSMAS
Secondary Forest
42%
• Global Warming Potential
(GWP) where QSMAS is
practiced:
– 12 municipalities, 67,000
inhabitants
– 1143 km²
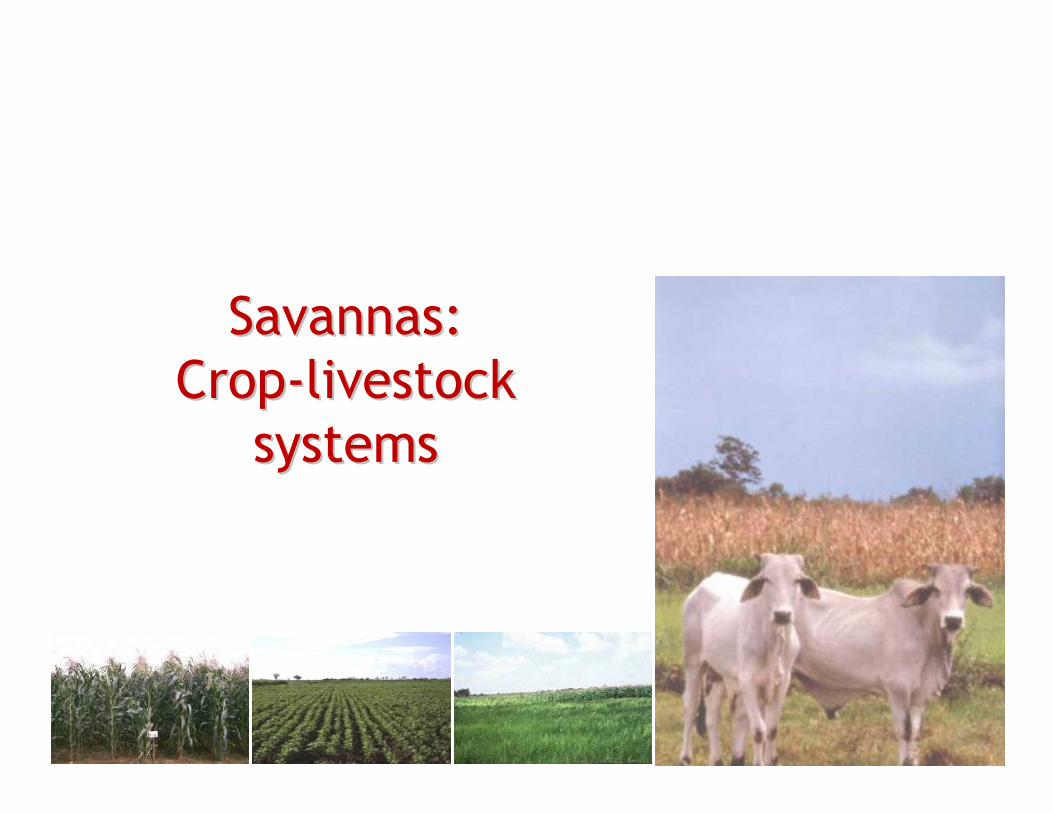
Savannas: Savannas:
CropCrop--livestock livestock
systemssystems
grass-
legume
pasture
-25000
-15000
-5000
5000
forest savanna sandy
savanna
crops
grass
alone
pasture
GW
P (k
g C
O2 e
qu
ivale
nts
)
GWP20y GWP100y
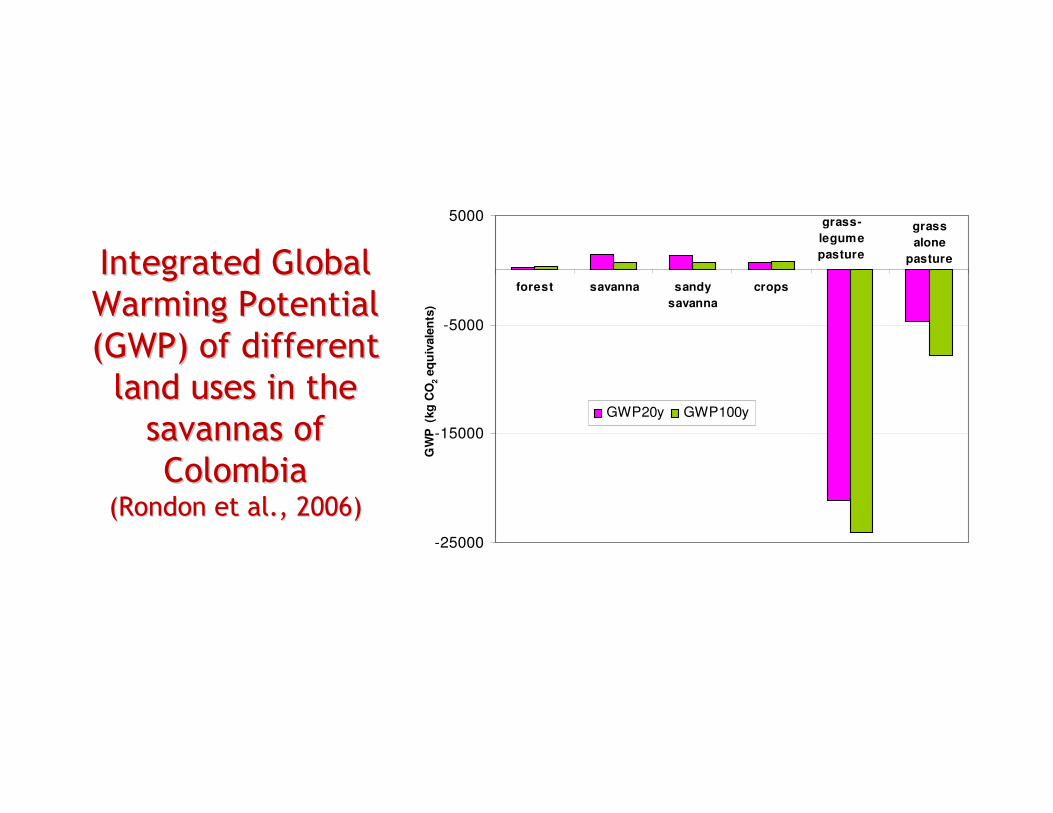
Integrated Global Integrated Global
Warming Potential Warming Potential
(GWP) of different(GWP) of different
land uses in the land uses in the
savannas of savannas of
Colombia Colombia ((RondonRondon et al., 2006)et al., 2006)
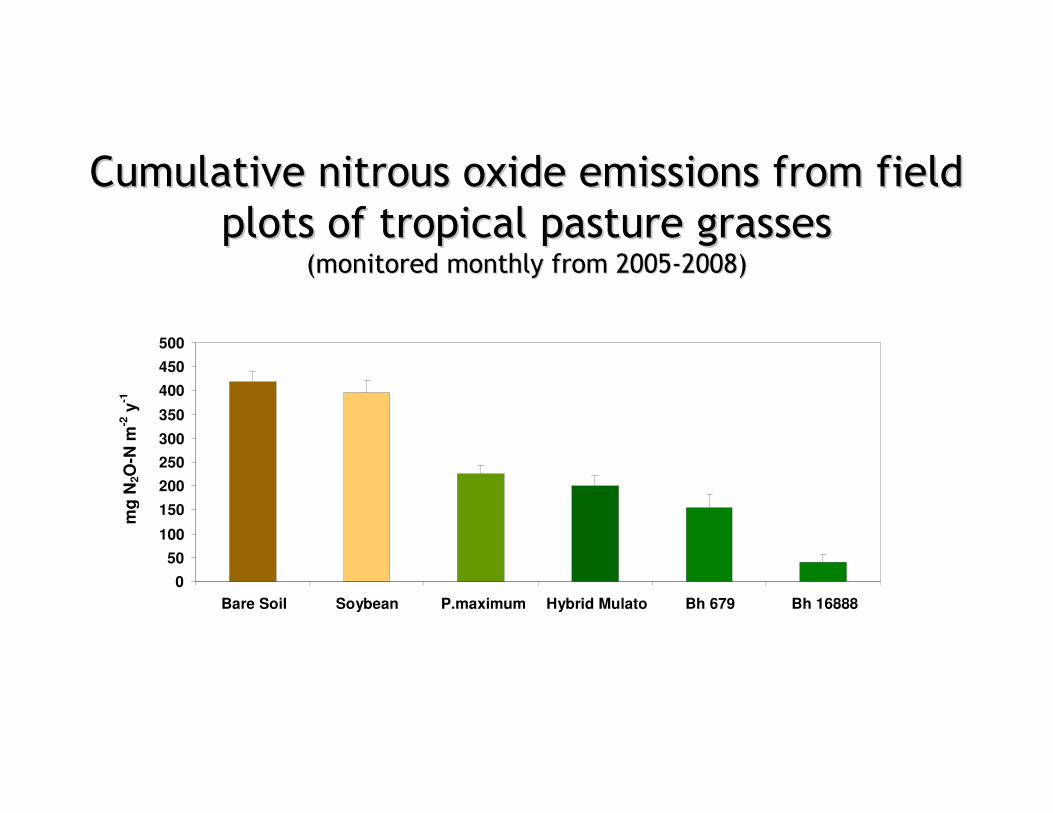
Cumulative nitrous oxide emissions from field Cumulative nitrous oxide emissions from field
plots of tropical pasture grasses plots of tropical pasture grasses (monitored monthly from 2005(monitored monthly from 2005--2008) 2008)
0
50
100
150
200
250
300
350
400
450
500
Bare Soil Soybean P.maximum Hybrid Mulato Bh 679 Bh 16888
mg
N2O
-N m
-2 y
-1
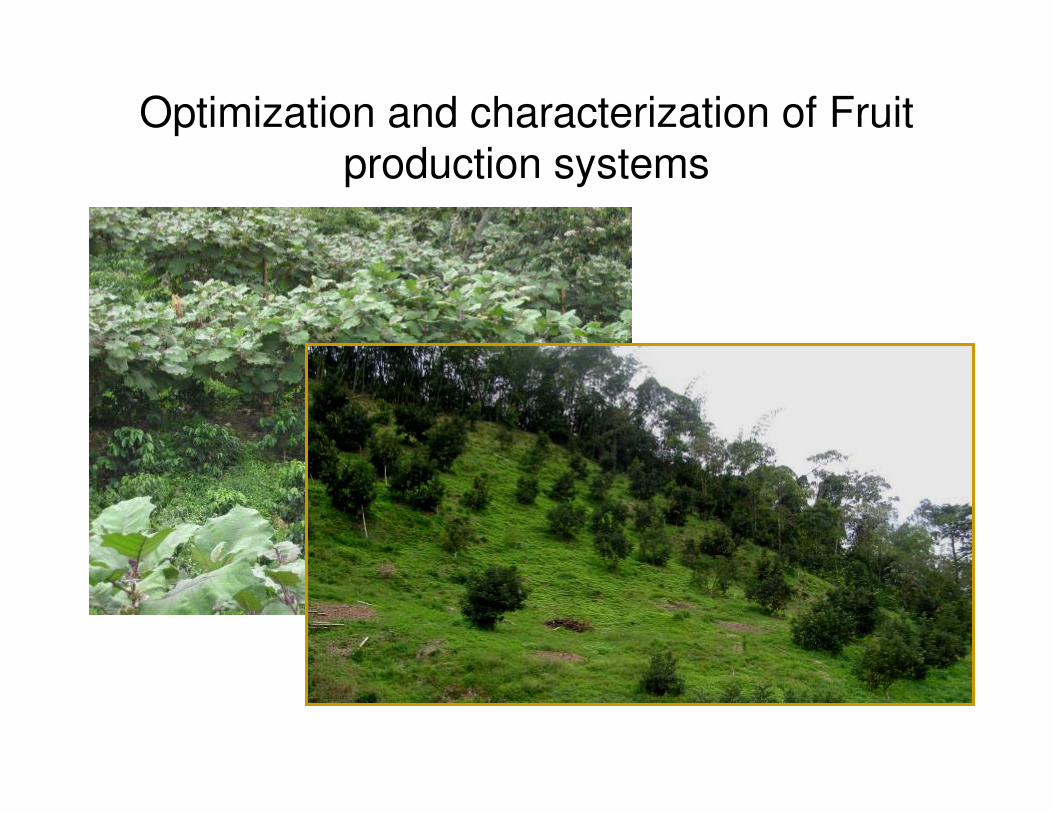
Optimization and characterization of Fruit production systems
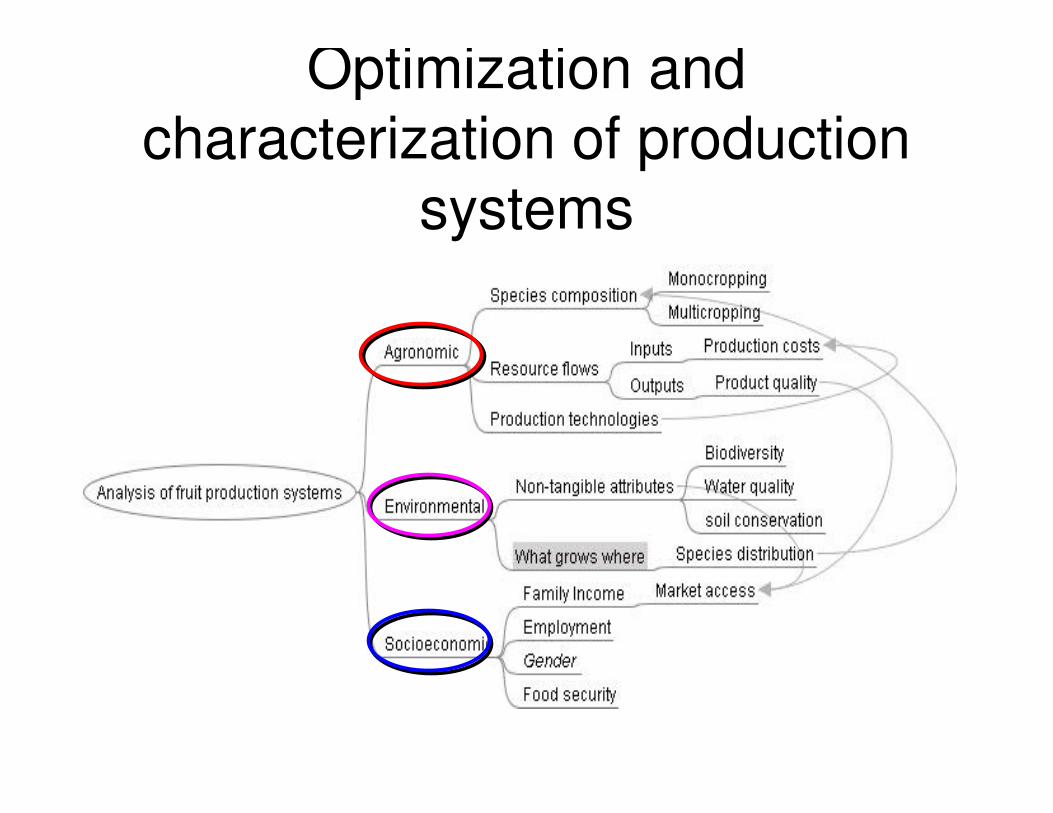
Optimization and
characterization of production
systems
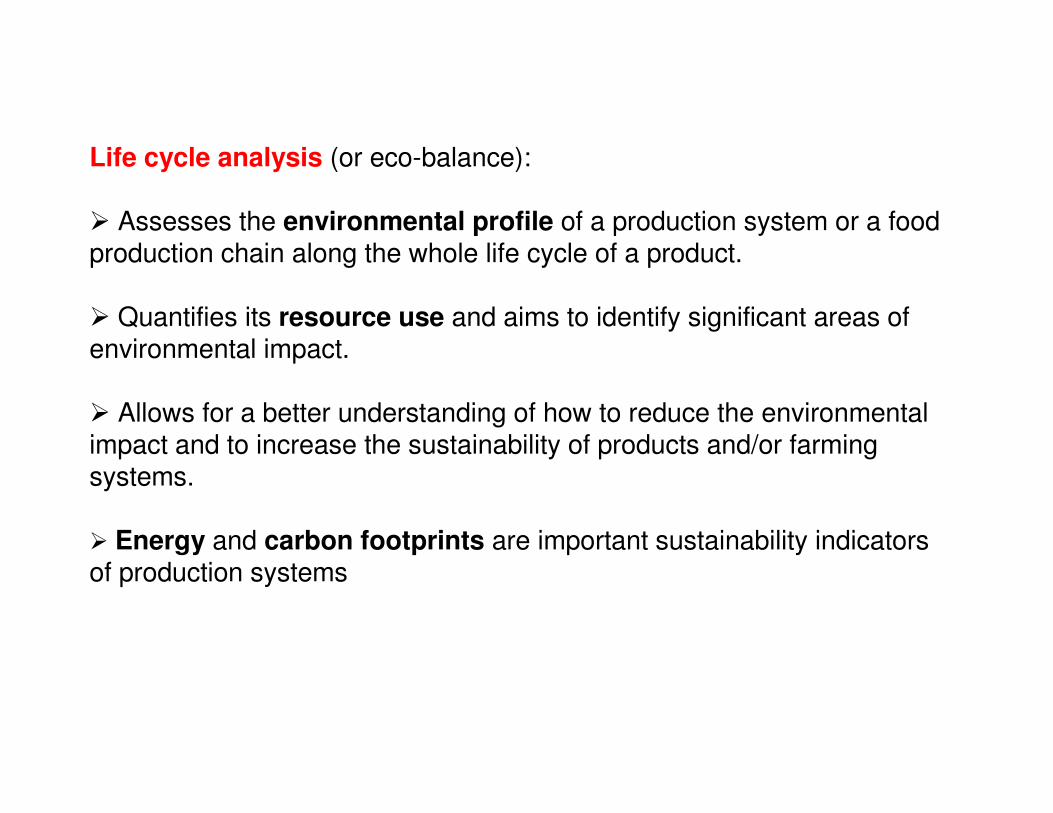
Life cycle analysis (or eco-balance):
� Assesses the environmental profile of a production system or a food production chain along the whole life cycle of a product.
� Quantifies its resource use and aims to identify significant areas of environmental impact.
� Allows for a better understanding of how to reduce the environmental impact and to increase the sustainability of products and/or farming systems.
� Energy and carbon footprints are important sustainability indicators of production systems
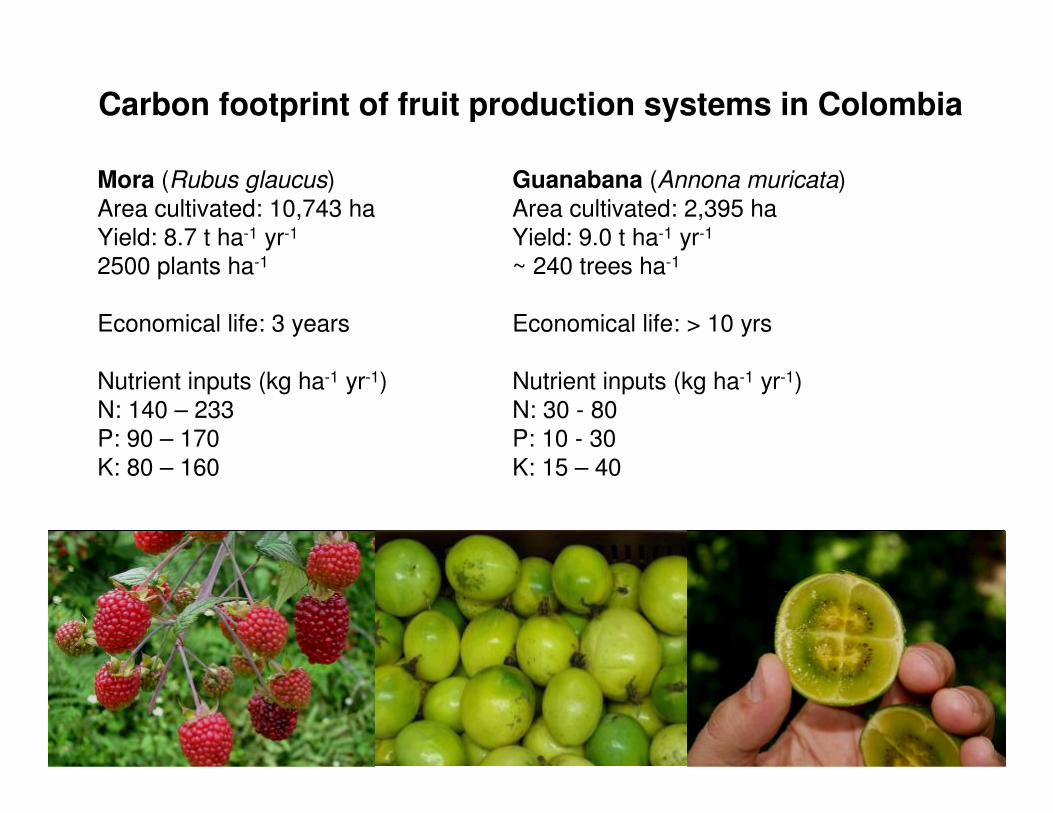
Carbon footprint of fruit production systems in Colombia
Mora (Rubus glaucus)
Area cultivated: 10,743 ha
Yield: 8.7 t ha-1 yr-1
2500 plants ha-1
Economical life: 3 years
Nutrient inputs (kg ha-1 yr-1)
N: 140 – 233
P: 90 – 170
K: 80 – 160
Guanabana (Annona muricata)
Area cultivated: 2,395 ha
Yield: 9.0 t ha-1 yr-1
~ 240 trees ha-1
Economical life: > 10 yrs
Nutrient inputs (kg ha-1 yr-1)
N: 30 - 80
P: 10 - 30
K: 15 – 40
0
1,000
2,000
3,000
4,000
CO
eq
.(k
gh
a)
2-1
1 2 3 4 5 6 7 8 9 10
Year
Guanábana
0
1,000
2,000
3,000
4,000
CO
eq
.(k
gh
a)
2-1
1 2 3
Year
MoraFertiliser induced
Embodied emissions fertiliser production
Agrochemicals
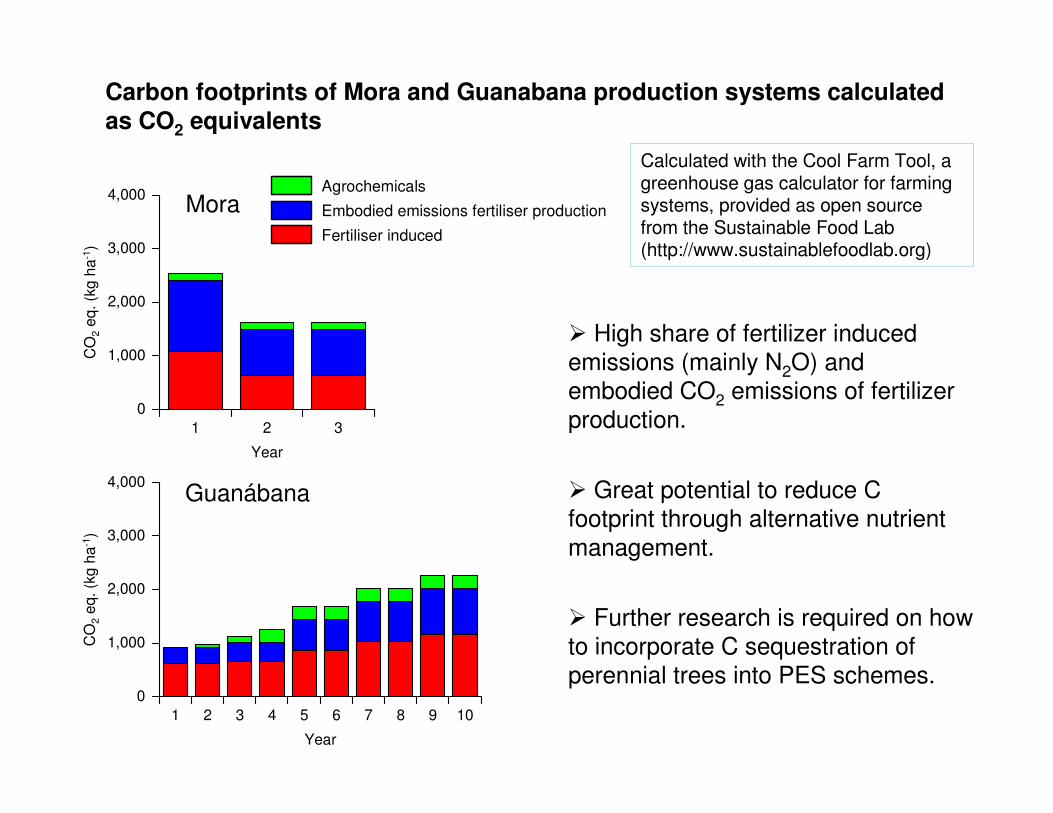
Carbon footprints of Mora and Guanabana production systems calculated
as CO2 equivalents
Calculated with the Cool Farm Tool, a greenhouse gas calculator for farming systems, provided as open source from the Sustainable Food Lab (http://www.sustainablefoodlab.org)
� High share of fertilizer induced
emissions (mainly N2O) and
embodied CO2 emissions of fertilizer
production.
� Great potential to reduce C
footprint through alternative nutrient
management.
� Further research is required on how
to incorporate C sequestration of
perennial trees into PES schemes.
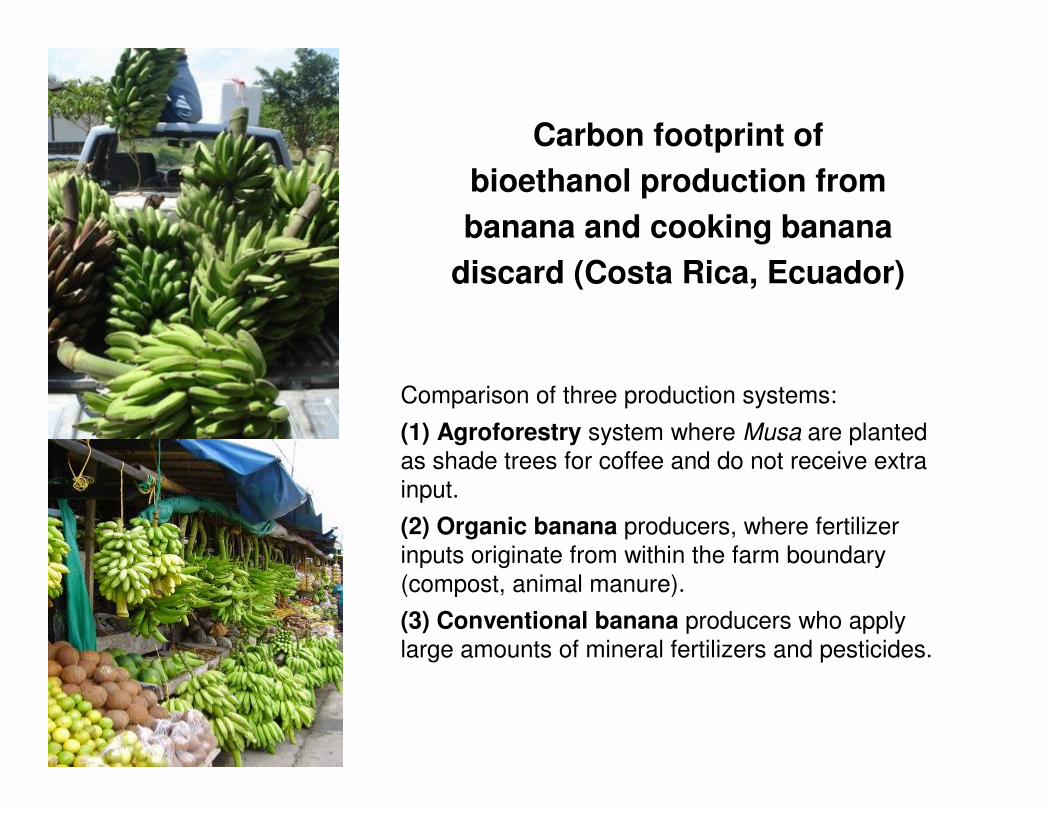
Carbon footprint of
bioethanol production from
banana and cooking banana
discard (Costa Rica, Ecuador)
Comparison of three production systems:
(1) Agroforestry system where Musa are planted
as shade trees for coffee and do not receive extra
input.
(2) Organic banana producers, where fertilizer
inputs originate from within the farm boundary
(compost, animal manure).
(3) Conventional banana producers who apply
large amounts of mineral fertilizers and pesticides.
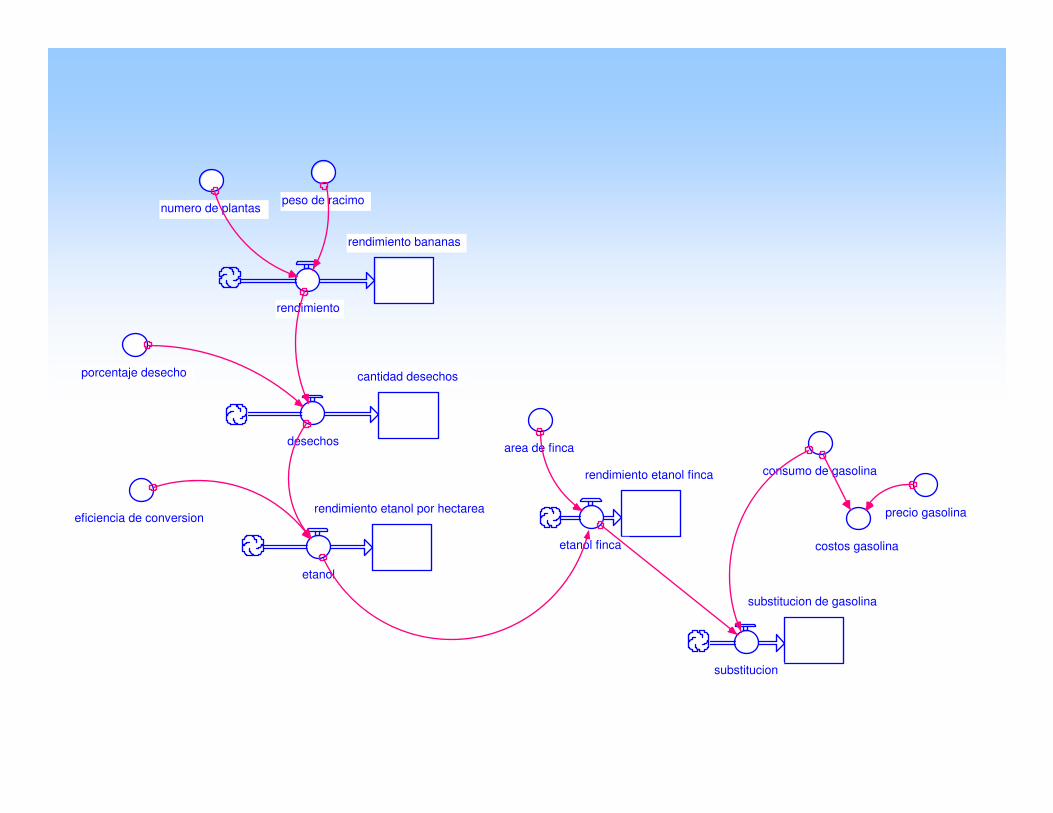
rendimiento bananas
rendimiento
numero de plantaspeso de racimo
cantidad desechos
desechos
porcentaje desecho
area de finca
rendimiento etanol por hectarea
etanol
eficiencia de conversion precio gasolina
consumo de gasolina
costos gasolina
rendimiento etanol finca
etanol finca
substitucion de gasolina
substitucion
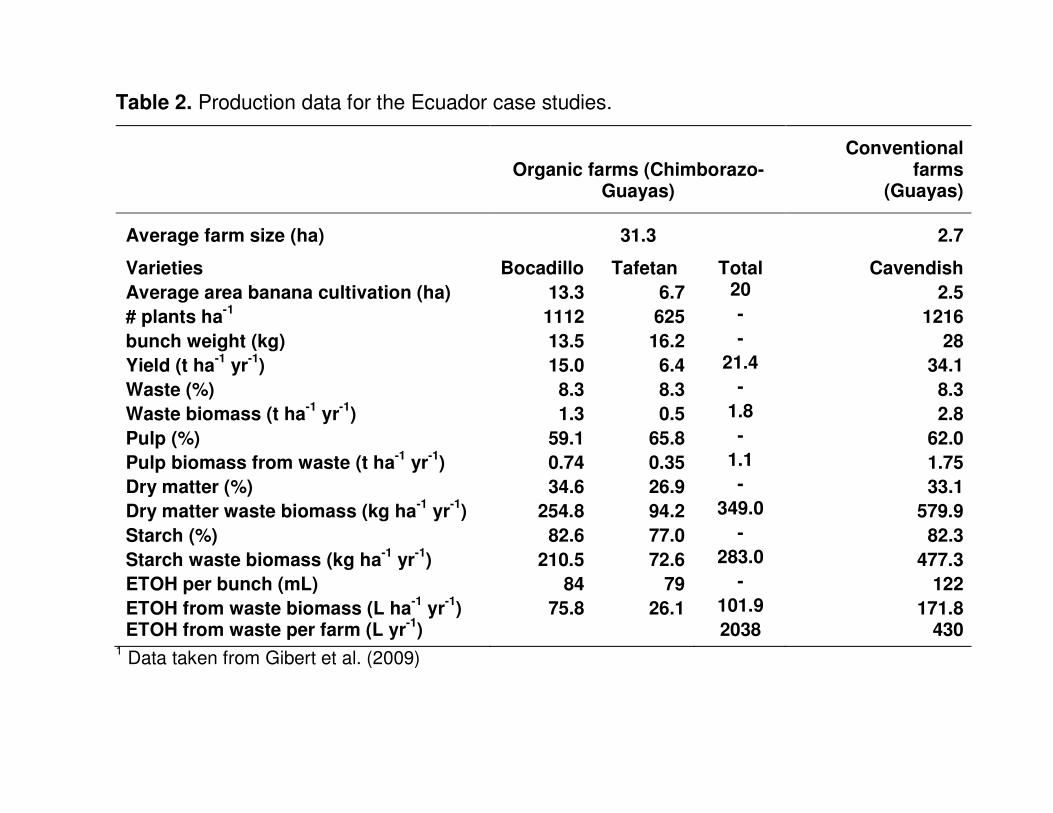
Table 2. Production data for the Ecuador case studies.
Organic farms (Chimborazo-Guayas)
Conventional farms
(Guayas)
Average farm size (ha) 31.3 2.7
Varieties Bocadillo Tafetan Total Cavendish
Average area banana cultivation (ha) 13.3 6.7 20 2.5
# plants ha-1
1112 625 - 1216
bunch weight (kg) 13.5 16.2 - 28
Yield (t ha-1
yr-1
) 15.0 6.4 21.4 34.1
Waste (%) 8.3 8.3 - 8.3
Waste biomass (t ha-1
yr-1
) 1.3 0.5 1.8 2.8
Pulp (%) 59.1 65.8 - 62.0
Pulp biomass from waste (t ha-1
yr-1
) 0.74 0.35 1.1 1.75
Dry matter (%) 34.6 26.9 - 33.1
Dry matter waste biomass (kg ha-1
yr-1
) 254.8 94.2 349.0 579.9
Starch (%) 82.6 77.0 - 82.3
Starch waste biomass (kg ha-1
yr-1
) 210.5 72.6 283.0 477.3
ETOH per bunch (mL) 84 79 - 122
ETOH from waste biomass (L ha-1
yr-1
) 75.8 26.1 101.9 171.8 ETOH from waste per farm (L yr
-1) 2038 430
1 Data taken from Gibert et al. (2009)
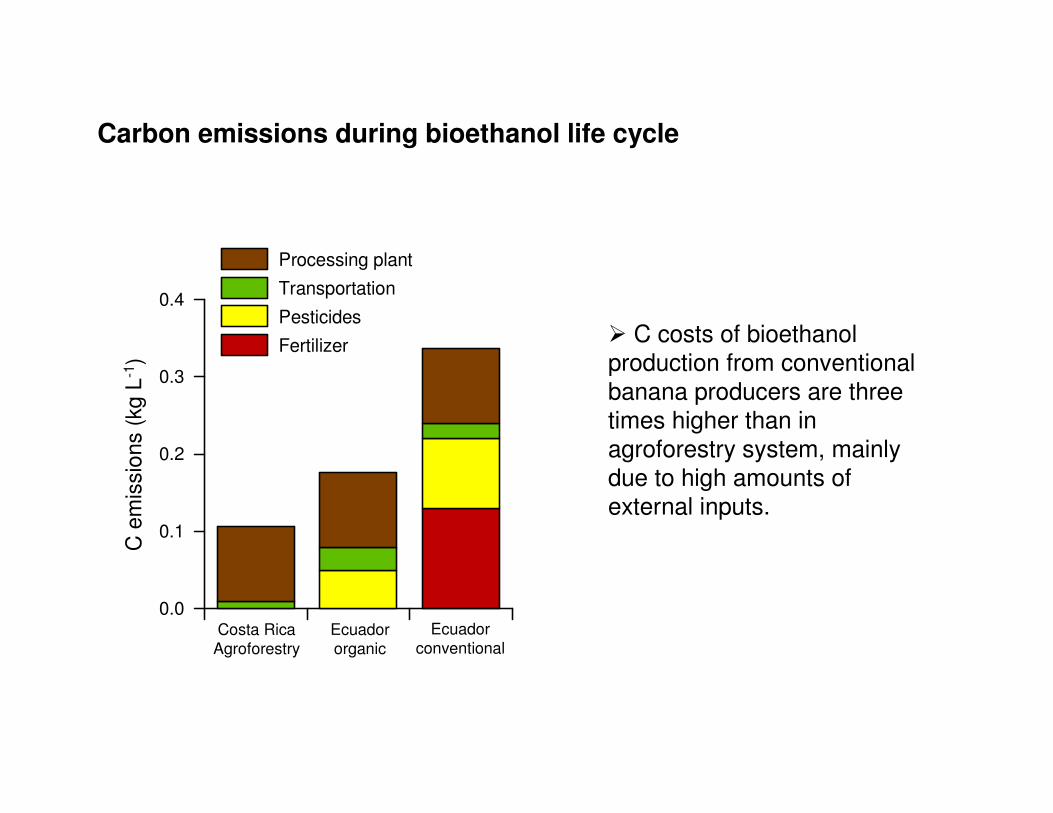
Carbon emissions during bioethanol life cycle
� C costs of bioethanol
production from conventional
banana producers are three
times higher than in
agroforestry system, mainly
due to high amounts of
external inputs.
0.0
0.1
0.2
0.3
0.4
Cem
issio
ns
(kg
L)
-1
Costa Rica
Agroforestry
Ecuador
conventionalEcuador
organic
Fertilizer
Pesticides
Transportation
Processing plant
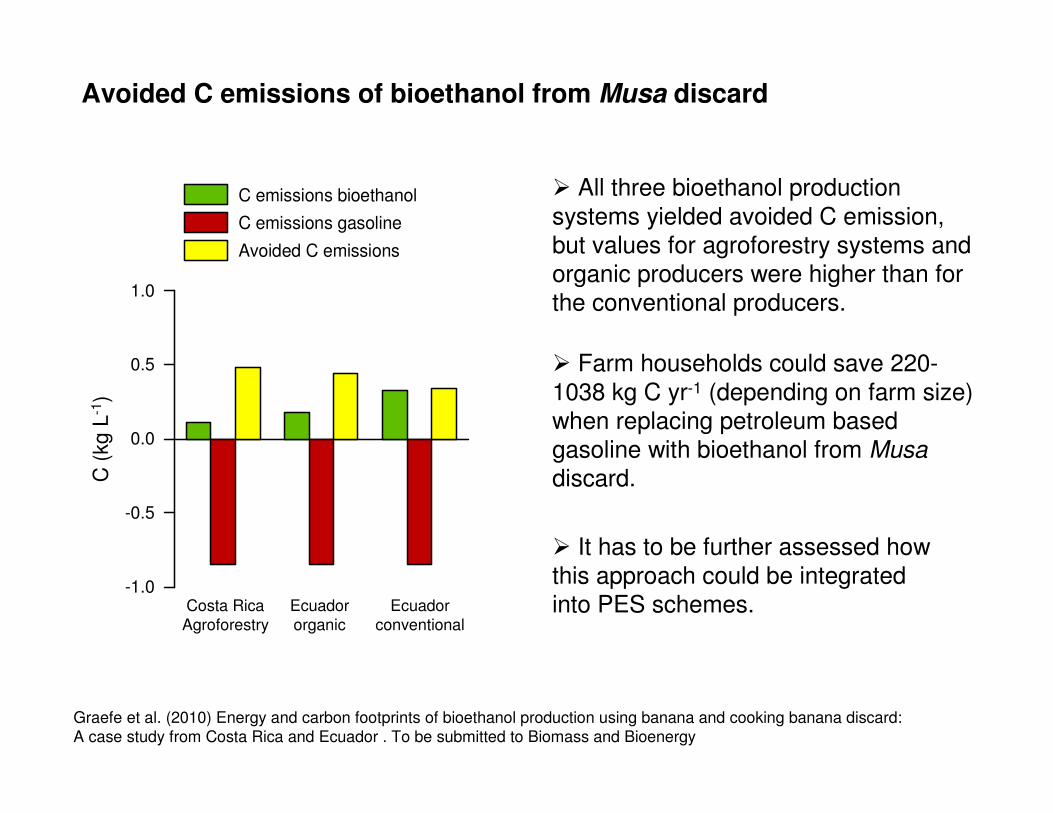
Avoided C emissions of bioethanol from Musa discard
� All three bioethanol production
systems yielded avoided C emission,
but values for agroforestry systems and
organic producers were higher than for
the conventional producers.
� It has to be further assessed how
this approach could be integrated
into PES schemes.
Graefe et al. (2010) Energy and carbon footprints of bioethanol production using banana and cooking banana discard:
A case study from Costa Rica and Ecuador . To be submitted to Biomass and Bioenergy
� Farm households could save 220-
1038 kg C yr-1 (depending on farm size)
when replacing petroleum based
gasoline with bioethanol from Musa
discard.
Costa Rica
Agroforestry
Ecuador
conventional
Ecuador
organic
-1.0
-0.5
0.0
0.5
1.0
C(k
gL
)-1
C emissions bioethanol
C emissions gasoline
Avoided C emissions