Embed Size (px)
Citation preview
SOUND TRAILS:WAVEFORMS AND INTERACTIVE OBJECTS INSIDE
3-D VIRTUAL ENVIRONMENTS
CUPELLINI Enrico, (I), FRANCAVIGLIA Mauro, (I)
Abstract. Sound visualizations can be done by software both for analytic and artistic purposes, in order to support message understanding and easier describe subtle qualities of sound. Many acoustic attributes can be visualized as frequency, phase, amplitude and spatial content of a sound. The authors present here some three-dimensional signal representations and discuss their advantages with respect to the traditional one-or-two-dimensional visualizations. They created interactive environment populated by geometrical objects which can be controlled at the same time in shape, size, orientation and color by several sound parameters combined together. Different sound analysis can be done, from physical to abstract level to mimic the human capabilities.
Key words: sound analysis, visual art, 3-D virtual environments
Mathematics Subject Classification: Primary 97M80; Secondary 00A66.
1 Introduction
Graphics and Multimedia are going to be important branches for applied Mathematics investigation, as well as in cognitive Psychology for trans-modal research that aims to exploiting a certain modality of perception to recover inabilities or enhance the functioning of other modalities. Entertainment industries employ visual art to enrich acoustic communication, too. Multimodal codification of sound is in fact a good way to manage subtle sound aspects, having an increased awareness of hearing and better appreciate it, or simply catch the audience’s attention and avoid boredom. There can be different kinds of sound visualizations: scientific sound analyses describe physical features as amplitude, frequency and phase. Sometimes they extract high level sound
features as pitch and beat (a pulse of constant time expectancies), and plot the results on one or two dimensional graphs and not in real time. Each graphs describe only one variable over time, so many windows have to be open to have a global sight of the phenomenon, that can become a problem in practical works. Scientific sound representations draw historic trace for the occurred sound, they are aimed at providing clear and accurate descriptions but only expert users can appreciate them. Other more artistic analyses operate in real time and offer three-dimensional representations; they can be exciting even for an inexpert audience, but they offer raw descriptions of sound. Rather they could be considered video entertainment with some, not clear, degree of sound interaction.We wonder why scientific representations are used to enhance global understanding and appreciate music instead of artistic representations is used to catch the listener’s attention?So our intention was to join together scientific and artistic sound representations to create some analysis tools incorporating aesthetic traits. We worked to get three-dimensional representation, supplied of historic trace of sound, showing low and high level features in a single tool. We think in fact that three dimensional graphs increase the amount of information coming from a single object and a historic trace is essential when comparing sound changes over time.We arranged the tools in a 3-D interactive environment, which can be explored either for scientific or aesthetic purposes. This paper is organized as follows: Section two discusses about the visualization engine and some technical aspects of digital implementation. Section three describes the analysis tools we used and explains the structures for visualization. The last Section gives a general discussion about the results, suggests practical applications and further progresses of work.
2 The Visualization Engine
The software we used for our work is called Pure Data, a real-time graphical programming environment for audio, video, and graphical processing. Using this software we created sound analysis by patching several DSP modules together. The Audioscape project1 is a set of libraries and Pure Data patches for the creation of virtual environments especially suited for audio interaction. Being heavily geared towards the organization of sound and signal processing in a virtual 3-D environment, Audioscape allows for the placement of sound sources, virtual microphones, and signal processors at specific coordinates in 3-D space [1, 2]. In Audioscape, the sound processing entity is called soundNode, which exists at some location and have various parameters to aid in DSP computation. A soundNode has an input and output and can be connected to other soundNodes to create a chain of DSP computation. A soundNode can be filled with geometrical shapes and 3-D models, that are controlled only by the input signal; as a result we can provide individual changes for the scene objects connecting each different analysis to a different soundNode. The historical trace of sound changes is obtained by soundLines that allow for the visualization of trajectories in 3-D space. A soundLine can be thought of as a fixed-length FIFO queue of connected vertices, which can be fed by the output of a generator. New points are always
1 www.audioscape.org
added to the front of the line until a maximum length is reached, after which the oldest vertex is pushed off with any new addition. Finally, objects location and camera point of view can be controlled also by external input device with which the user can explore the environment and organize the scene as he or she prefers.
3 Audio Analysis
Every measurement on digital audio signals deals with time frames of a fixed range of samples, typically a power of two. This introduces a delay of time between real sound emission and results. In interactive visual application the delay time is not perceived if it is shorter than 1/16 of a second (“Flicker fusion threshold”), that corresponds to buffer sizes up to 2048 samples with sample rate of 44100 samples per second. Besides representations of sound changes integrate signal values over broader ranges to create smoother flows that can be easily observed. We made analyses on the physical level by measures about amplitude, frequency and phase content. With respect to the symbolic level we gave estimations about pitch, beat recurrence and spectral centroid.
3.1 Analysis of Physical Features
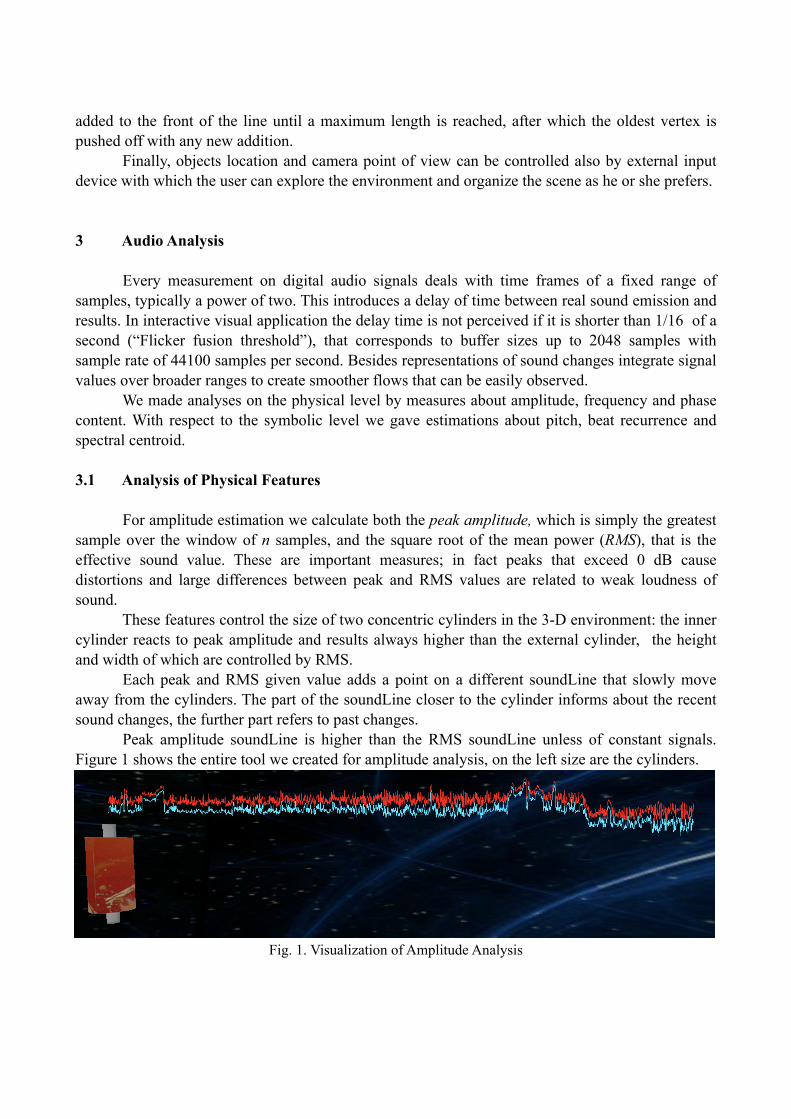
For amplitude estimation we calculate both the peak amplitude, which is simply the greatest sample over the window of n samples, and the square root of the mean power (RMS), that is the effective sound value. These are important measures; in fact peaks that exceed 0 dB cause distortions and large differences between peak and RMS values are related to weak loudness of sound. These features control the size of two concentric cylinders in the 3-D environment: the inner cylinder reacts to peak amplitude and results always higher than the external cylinder, the height and width of which are controlled by RMS. Each peak and RMS given value adds a point on a different soundLine that slowly move away from the cylinders. The part of the soundLine closer to the cylinder informs about the recent sound changes, the further part refers to past changes. Peak amplitude soundLine is higher than the RMS soundLine unless of constant signals. Figure 1 shows the entire tool we created for amplitude analysis, on the left size are the cylinders.
Fig. 1. Visualization of Amplitude Analysis
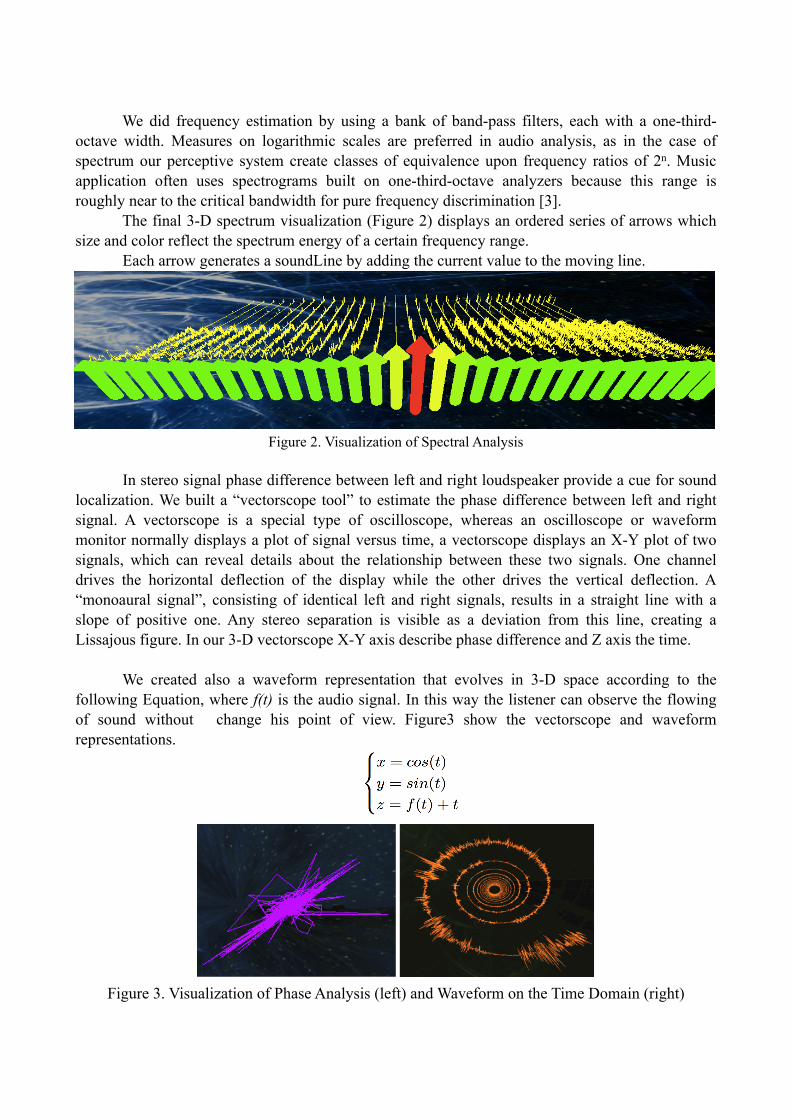
We did frequency estimation by using a bank of band-pass filters, each with a one-third-octave width. Measures on logarithmic scales are preferred in audio analysis, as in the case of spectrum our perceptive system create classes of equivalence upon frequency ratios of 2n. Music application often uses spectrograms built on one-third-octave analyzers because this range is roughly near to the critical bandwidth for pure frequency discrimination [3]. The final 3-D spectrum visualization (Figure 2) displays an ordered series of arrows which size and color reflect the spectrum energy of a certain frequency range. Each arrow generates a soundLine by adding the current value to the moving line.
Figure 2. Visualization of Spectral Analysis
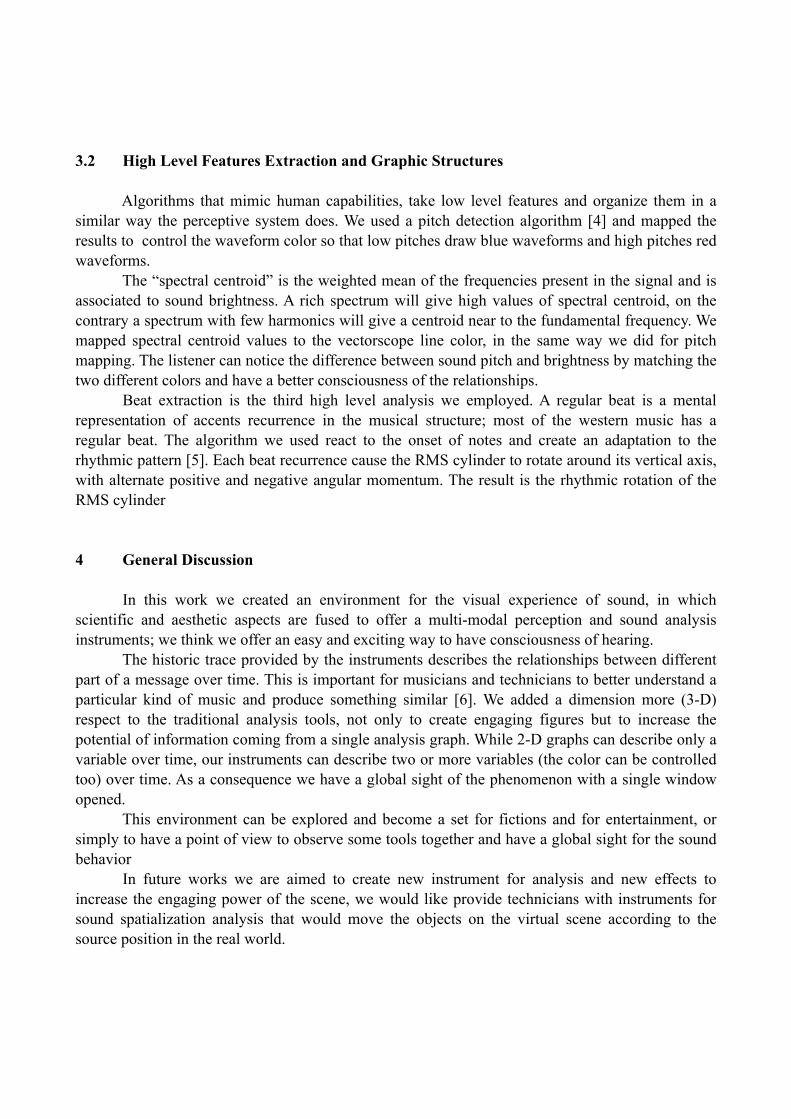
In stereo signal phase difference between left and right loudspeaker provide a cue for sound localization. We built a “vectorscope tool” to estimate the phase difference between left and right signal. A vectorscope is a special type of oscilloscope, whereas an oscilloscope or waveform monitor normally displays a plot of signal versus time, a vectorscope displays an X-Y plot of two signals, which can reveal details about the relationship between these two signals. One channel drives the horizontal deflection of the display while the other drives the vertical deflection. A “monoaural signal”, consisting of identical left and right signals, results in a straight line with a slope of positive one. Any stereo separation is visible as a deviation from this line, creating a Lissajous figure. In our 3-D vectorscope X-Y axis describe phase difference and Z axis the time.
We created also a waveform representation that evolves in 3-D space according to the following Equation, where f(t) is the audio signal. In this way the listener can observe the flowing of sound without change his point of view. Figure3 show the vectorscope and waveform representations.
Figure 3. Visualization of Phase Analysis (left) and Waveform on the Time Domain (right)
3.2 High Level Features Extraction and Graphic Structures
Algorithms that mimic human capabilities, take low level features and organize them in a similar way the perceptive system does. We used a pitch detection algorithm [4] and mapped the results to control the waveform color so that low pitches draw blue waveforms and high pitches red waveforms. The “spectral centroid” is the weighted mean of the frequencies present in the signal and is associated to sound brightness. A rich spectrum will give high values of spectral centroid, on the contrary a spectrum with few harmonics will give a centroid near to the fundamental frequency. We mapped spectral centroid values to the vectorscope line color, in the same way we did for pitch mapping. The listener can notice the difference between sound pitch and brightness by matching the two different colors and have a better consciousness of the relationships. Beat extraction is the third high level analysis we employed. A regular beat is a mental representation of accents recurrence in the musical structure; most of the western music has a regular beat. The algorithm we used react to the onset of notes and create an adaptation to the rhythmic pattern [5]. Each beat recurrence cause the RMS cylinder to rotate around its vertical axis, with alternate positive and negative angular momentum. The result is the rhythmic rotation of the RMS cylinder
4 General Discussion
In this work we created an environment for the visual experience of sound, in which scientific and aesthetic aspects are fused to offer a multi-modal perception and sound analysis instruments; we think we offer an easy and exciting way to have consciousness of hearing. The historic trace provided by the instruments describes the relationships between different part of a message over time. This is important for musicians and technicians to better understand a particular kind of music and produce something similar [6]. We added a dimension more (3-D) respect to the traditional analysis tools, not only to create engaging figures but to increase the potential of information coming from a single analysis graph. While 2-D graphs can describe only a variable over time, our instruments can describe two or more variables (the color can be controlled too) over time. As a consequence we have a global sight of the phenomenon with a single window opened. This environment can be explored and become a set for fictions and for entertainment, or simply to have a point of view to observe some tools together and have a global sight for the sound behavior In future works we are aimed to create new instrument for analysis and new effects to increase the engaging power of the scene, we would like provide technicians with instruments for sound spatialization analysis that would move the objects on the virtual scene according to the source position in the real world.
Acknowledgements
The authors gratefully acknowledge the Evolutionary System Group at the University of Calabria (Italy) and the Centre for Interdisciplinary Research in Music Media and Technology at McGill University (Canada).
References
[1]Wozniewski, M., Settel, Z., and Cooperstock, J.R.: A paradigm for physical interaction with sound in 3-D audio space, in: Proceedings of International Computer Music Conference (ICMC), 2006.[2]Wozniewski, M., Settel, Z., and Cooperstock, J.R.: User-specific audio rendering and steerable sound for distributed virtual environments, in: Proceedings of International conference on auditory displays (ICAD), 2007.[3]Dowling, W., J., Hardwood, D., L. Music Cognition, Academic Press (Orlando, Florida, USA, 1986).[4]Pukette, M., S., Apel, T., Zicarelli, D., D.: Real-time audio analysis tools for Pd and Max MSP. in: Proceedings, International Computer Music Conference, San Francisco; International Computer Music Association, pp. 109-112.[5]Rowe, R,.: Machine musicianship. MIT Press, Cambridge, MA, USA, 2001.[6]Moylan, W. The art of recording: understanding and crafting the mix, Focal Press (2002).
Current address
Enrico Cupellini, Philosophiae DoctorUniversity of Torino, Dep.t of Mathematics,Via Carlo Alberto 10, 10123 Torino (Italy) - tel. +39 328 8386750, e-mail: [email protected]
Francaviglia Mauro, Full ProfessorUniversity of Torino, Dep.t of Mathematics,Via Carlo Alberto 10, 10123 Torino (Italy) - tel. +39 011 6702932, e-mail: [email protected]