Embed Size (px)
Citation preview

Estimating Functional Connectomes:Sparsity’s Strength and Limitations
Gael Varoquaux Ssssssskeptical
Graphical models in cognitive neuroscience
G Varoquaux 2

Functional connectome analysis
Functional regions
Functional connections
Variations in connections
G Varoquaux 3

Functional connectome analysis
Functional regions
Functional connections
Variations in connections
G Varoquaux 3

Functional connectome analysis
Functional regions
Functional connections
Variations in connections
G Varoquaux 3

Outline
1 Estimating connectomes
2 Comparing connectomes
G Varoquaux 4

1 Estimating connectomes
Functional connectomeGraph of interactions between regions
[Varoquaux and Craddock 2013]
G Varoquaux 5

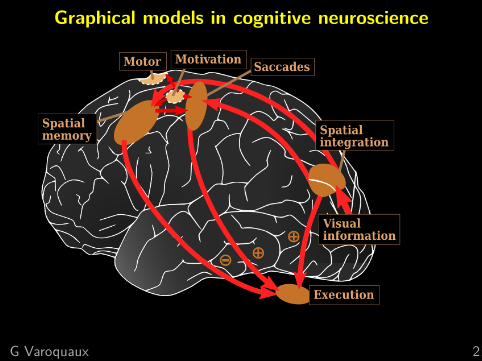
1 Graphical model in cognitive neuroscience
Whish listCausal linksDirected model:IPS = V 2 + MTFEF = IPS + ACC
Unreliable delays (HRF)Few samples
× many signalsHeteroscedastic noise
G Varoquaux 6
1 Graphical model in cognitive neuroscience
Whish listCausal linksDirected model:IPS = V 2 + MTFEF = IPS + ACC
Unreliable delays (HRF)Few samples
× many signalsHeteroscedastic noise
G Varoquaux 6

1 Graphical model in cognitive neuroscience
Whish listCausal linksDirected model:IPS = V 2 + MTFEF = IPS + ACC
Unreliable delays (HRF)Few samples
× many signalsHeteroscedastic noise
Independence structureKnowing IPS, FEF is independent of V2 and MT
G Varoquaux 6

1 From correlations to connectomes
Conditional independence structure?
G Varoquaux 7

1 Probabilistic model for interactionsSimplest data generating process
= multivariate normal:
P(X) ∝√|Σ−1|e−1
2XT Σ−1X
Model parametrized by inverse covariance matrix,K = Σ−1: conditional covariances
Goodness of fit:likelihood of observed covariance Σ in model Σ
L(Σ|K) = log |K| − trace(Σ K)
G Varoquaux 8

1 Graphical structure from correlations
ObservationsCovariance
0
1
2
3
4
Diagonal:signal variance
Direct connectionsInverse covariance
0
1
2
3
4
Diagonal:node innovation
G Varoquaux 9

1 Independence structure (Markov graph)
Zeros in partial correlationsgive conditional independence
Reflects the large-scalebrain interaction structure
Ill-posed problem:multi-collinearity⇒ noisy partial correlations
Independence between nodes makes estimationof partial correlations well-conditionned.
G Varoquaux 10

1 Independence structure (Markov graph)
Zeros in partial correlationsgive conditional independence
Ill-posed problem:multi-collinearity⇒ noisy partial correlations
Independence between nodes makes estimationof partial correlations well-conditionned.
Chicken and egg problem
G Varoquaux 10

1 Independence structure (Markov graph)
Zeros in partial correlationsgive conditional independence
Ill-posed problem:multi-collinearity⇒ noisy partial correlations
Independence between nodes makes estimationof partial correlations well-conditionned.
0
1
2
3
4
0
1
2
3
4
+Joint estimation:
Sparse inverse covariance
G Varoquaux 10

1 Sparse inverse covariance: penalization
[Friedman... 2008, Varoquaux... 2010b, Smith... 2011]
Maximum a posteriori:Fit models with a penaltySparsity ⇒ Lasso-like problem: `1 penalization
K = argminK�0L(Σ|K) +λ `1(K)
Data fit,Likelihood
Penalization,
x2
x1
G Varoquaux 11

1 Sparse inverse covariance: penalization
[Varoquaux... 2010b]
Σ−1 Sparseinverse
Likelihood of new data (cross-validation)Subject data, Σ−1 -57.1
Subject data, sparse inverse 43.0
G Varoquaux 12

1 Limitations of sparsity Sssssskeptical
Theoretical limitation to sparse recoveryNumber of samples for s edges, p nodes:n = O
((s + p) log p
)[Lam and Fan 2009]
High-degree nodes fail [Ravikumar... 2011]
EmpiricallyOptimal graphalmost dense
2.5 3.0 3.5 4.0
−log10λ
Test
-dat
a lik
eliho
od
Sparsity
[Varoquaux... 2012] Very sparse graphsdon’t fit the data
G Varoquaux 13

1 Multi-subject to overcome subject data scarsity
[Varoquaux... 2010b]
Σ−1 Sparseinverse
Sparse groupconcat
Likelihood of new data (cross-validation)Subject data, Σ−1 -57.1
Subject data, sparse inverse 43.0Group concat data, Σ−1 40.6
Group concat data, sparse inverse 41.8
Inter-subject variability
G Varoquaux 14

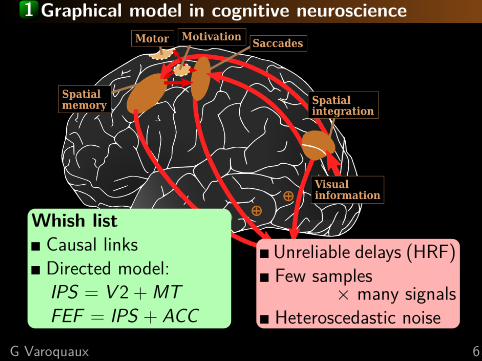
1 Multi-subject sparsity
[Varoquaux... 2010b]
Common independence structure but differentconnection values
{Ks} = argmin{Ks�0}
∑sL(Σs |Ks) + λ `21({Ks})
Multi-subject data fit,Likelihood
Group-lasso penalization
G Varoquaux 15
1 Multi-subject sparsity
[Varoquaux... 2010b]
Common independence structure but differentconnection values
{Ks} = argmin{Ks�0}
∑sL(Σs |Ks) + λ `21({Ks})
Multi-subject data fit,Likelihood
`1 on the connections ofthe `2 on the subjects
G Varoquaux 15

1 Multi-subject sparse graphs perform better
[Varoquaux... 2010b]
Σ−1 Sparseinverse
Populationprior
Likelihood of new data (cross-validation) sparsitySubject data, Σ−1 -57.1
Subject data, sparse inverse 43.0 60% fullGroup concat data, Σ−1 40.6
Group concat data, sparse inverse 41.8 80% fullGroup sparse model 45.6 20% full
G Varoquaux 16

1 Independence structure of brain activity
Subject-sparseestimate
G Varoquaux 17

1 Independence structure of brain activity
Population-sparse estimate
G Varoquaux 17

1 Large scale organization: communitiesGraph communities
[Eguiluz... 2005]
Non-sparse
Neural communities
G Varoquaux 18

1 Large scale organization: communitiesGraph communities
[Eguiluz... 2005]
Group-sparse
Neural communities= large known functional networks [Varoquaux... 2010b]
G Varoquaux 18

1 Giving up on sparsity?
Sparsity is finickySensitive hyper-parameterSlow and unreliable convergenceUnstable set of selected edges
ShrinkageSoftly push partial correlations to zero
ΣShrunk = (1− λ)ΣMLE + λId
Ledoit-Wolf oracle to set λ[Ledoit and Wolf 2004]
G Varoquaux 19

2 Comparing connectomesFunctional biomarkersPopulation imaging
G Varoquaux 20

2 Failure of univariate approach on correlations
Subject variability spread across correlation matrices
0 5 10 15 20 25
0
5
10
15
20
25 Control0 5 10 15 20 25
0
5
10
15
20
25 Control0 5 10 15 20 25
0
5
10
15
20
25 Control0 5 10 15 20 25
0
5
10
15
20
25Large lesion
dΣ = Σ2 −Σ1 is not definite positive⇒ not a covariance
Σ does not live in a vector space
G Varoquaux 21

2 Inverse covariance very noisy
Partial correlations are hard to estimate
0 5 10 15 20 25
0
5
10
15
20
25 Control0 5 10 15 20 25
0
5
10
15
20
25 Control0 5 10 15 20 25
0
5
10
15
20
25 Control0 5 10 15 20 25
0
5
10
15
20
25Large lesion
G Varoquaux 22

2 A toy model of differences in connectivityTwo processes with different partial correlations
K1: K1 −K2: Σ1: Σ1 −Σ2:
+ jitter in observed covarianceMSE(K1 −K2): MSE(Σ1 −Σ2):
Non-local effects and non homogeneous noiseG Varoquaux 23
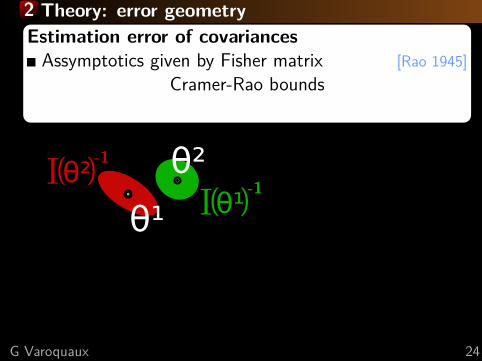
2 Theory: error geometryDisentangle parameters (edge-level connectivities)Connectivity matrices form a manifold
⇒ project to tangent space
θ¹
θ²( )θ¹I -1
( )θ²I -1
Estimation error of covariancesAssymptotics given by Fisher matrix [Rao 1945]
Cramer-Rao bounds
G Varoquaux 24

2 Theory: error geometryDisentangle parameters (edge-level connectivities)Connectivity matrices form a manifold
⇒ project to tangent space
Manifold
[Varoquaux... 2010a]
Estimation error of covariancesAssymptotics given by Fisher matrix [Rao 1945]Defines a metric on a manifold of modelsWith covariances: Lie-algebra structure [Lenglet... 2006]
G Varoquaux 24

2 Reparametrization for uniform error geometryDisentangle parameters (edge-level connectivities)Connectivity matrices form a manifold
⇒ project to tangent space
Controls
Patient
dΣ
Manifold
Tangent
dΣ = Σ−1/2
Ctrl ΣPatientΣ−1/2
Ctrl
[Varoquaux... 2010a]
G Varoquaux 24

2 Reparametrization for uniform error geometry
The simulationsK1 −K2: Σ1 −Σ2: dΣ: MSE(dΣ):
Semi-local effects and homogeneous noise
G Varoquaux 25

2 ResidualsCorrelation matrices: Σ -1.0 0.0 1.0
0 5 10 15 20 25
0
5
10
15
20
25
0 5 10 15 20 25
0
5
10
15
20
25
0 5 10 15 20 25
0
5
10
15
20
25
0 5 10 15 20 25
0
5
10
15
20
25
Residuals: dΣ -1.0 0.0 1.0
0 5 10 15 20 25
0
5
10
15
20
25
Control 0 5 10 15 20 25
0
5
10
15
20
25
Control 0 5 10 15 20 25
0
5
10
15
20
25
Control 0 5 10 15 20 25
0
5
10
15
20
25
Large lesionG Varoquaux 26

2 Post-stroke covariance modifications
p-value: 5·10−2
Bonferroni-correctedG Varoquaux 27

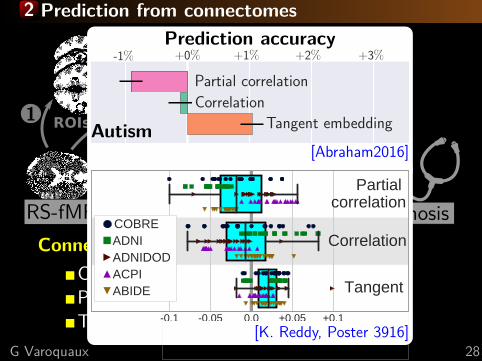
2 Prediction from connectomes
RS-fMRI
Functionalconnectivity
Time series
24
3
1
Diagnosis
ROIs
Connectivity matrixCorrelationPartial correlationsTangent space
Prediction accuracy
Autism[Abraham2016]
[K. Reddy, Poster 3916]
G Varoquaux 28

2 Prediction from connectomes
Time series
2
RS-fMRI
41
Diagnosis
ROIs Functionalconnectivity
3
Connectivity matrixCorrelationPartial correlationsTangent space
Prediction accuracy
Autism[Abraham2016]
[K. Reddy, Poster 3916]
G Varoquaux 28
2 Prediction from connectomes
Time series
2
RS-fMRI
41
Diagnosis
ROIs Functionalconnectivity
3
Connectivity matrixCorrelationPartial correlationsTangent space
Prediction accuracy
Autism[Abraham2016]
[K. Reddy, Poster 3916]G Varoquaux 28

@GaelVaroquaux
Estimation functional connectomes:sparsity and beyond
Zeros in inverse covariance giveconditional independance
⇒ sparsityShrinkage: simpler, faster
(Ledoit-Wolf)
Tangent spacefor comparisons
ControlsPatient
Controls
Patient
Software:http://nilearn.github.io/ ni

References I
V. M. Eguiluz, D. R. Chialvo, G. A. Cecchi, M. Baliki, andA. V. Apkarian. Scale-free brain functional networks.Physical review letters, 94:018102, 2005.
J. Friedman, T. Hastie, and R. Tibshirani. Sparse inversecovariance estimation with the graphical lasso. Biostatistics,9:432, 2008.
C. Lam and J. Fan. Sparsistency and rates of convergence inlarge covariance matrix estimation. Annals of statistics, 37(6B):4254, 2009.
O. Ledoit and M. Wolf. A well-conditioned estimator forlarge-dimensional covariance matrices. J. Multivar. Anal.,88:365, 2004.

References IIC. Lenglet, M. Rousson, R. Deriche, and O. Faugeras.
Statistics on the manifold of multivariate normaldistributions: Theory and application to diffusion tensorMRI processing. Journal of Mathematical Imaging andVision, 25:423, 2006.
C. Rao. Information and accuracy attainable in the estimationof statistical parameters. Bull. Calcutta Math. Soc., 37:81,1945.
P. Ravikumar, M. J. Wainwright, G. Raskutti, B. Yu, ...High-dimensional covariance estimation by minimizing`1-penalized log-determinant divergence. Electronic Journalof Statistics, 5:935–980, 2011.
S. Smith, K. Miller, G. Salimi-Khorshidi, M. Webster,C. Beckmann, T. Nichols, J. Ramsey, and M. Woolrich.Network modelling methods for fMRI. Neuroimage, 54:875,2011.

References IIIG. Varoquaux and R. C. Craddock. Learning and comparing
functional connectomes across subjects. NeuroImage, 80:405, 2013.
G. Varoquaux, F. Baronnet, A. Kleinschmidt, P. Fillard, andB. Thirion. Detection of brain functional-connectivitydifference in post-stroke patients using group-levelcovariance modeling. In MICCAI. 2010a.
G. Varoquaux, A. Gramfort, J. B. Poline, and B. Thirion.Brain covariance selection: better individual functionalconnectivity models using population prior. In NIPS. 2010b.
G. Varoquaux, A. Gramfort, J. B. Poline, and B. Thirion.Markov models for fMRI correlation structure: is brainfunctional connectivity small world, or decomposable intonetworks? Journal of Physiology - Paris, 106:212, 2012.


![Relationships between Human Brain Structural Connectomes ......2018/01/31 · on functional connectomes instead of structural connectomes [1,5–8], due to the difficulty of recovering](https://img.pdfslide.net/doc/110x75/5fe8188288629e141865d771/relationships-between-human-brain-structural-connectomes-20180131-on.jpg)

![Predictive Subnetwork Extraction with Structural Priors ...hamarneh/ecopy/miccai2016b.pdf · Predictive Subnetwork Extraction with Structural Priors for Infant Connectomes ... [4,6]](https://img.pdfslide.net/doc/110x75/5af11d8d7f8b9a8b4c8e5910/predictive-subnetwork-extraction-with-structural-priors-hamarnehecopy-subnetwork.jpg)
![Neuroscience Flythrough - Heidelberg University · Fundings Connectomes Macro Node is gray matter region (e.g. retina and suprachiasmic nucleus) [7] [2]](https://img.pdfslide.net/doc/110x75/5f94eaaba5038c242f0d4f91/neuroscience-flythrough-heidelberg-university-fundings-connectomes-macro-node.jpg)


![Three hybrid intelligent models in estimating flyrock ... · As mentioned in literatures [20, 23, 35–39], using efficient optimization algorithms (OAs), these limitations can be](https://img.pdfslide.net/doc/110x75/5fd1f19ccb574e6afa65b20c/three-hybrid-intelligent-models-in-estimating-flyrock-as-mentioned-in-literatures.jpg)