Embed Size (px)
Citation preview
Convince Your CFO that #PerfMatters@ColinBendell

©2015 AKAMAI | FASTER FORWARDTM
©2015 AKAMAI | FASTER FORWARDTM
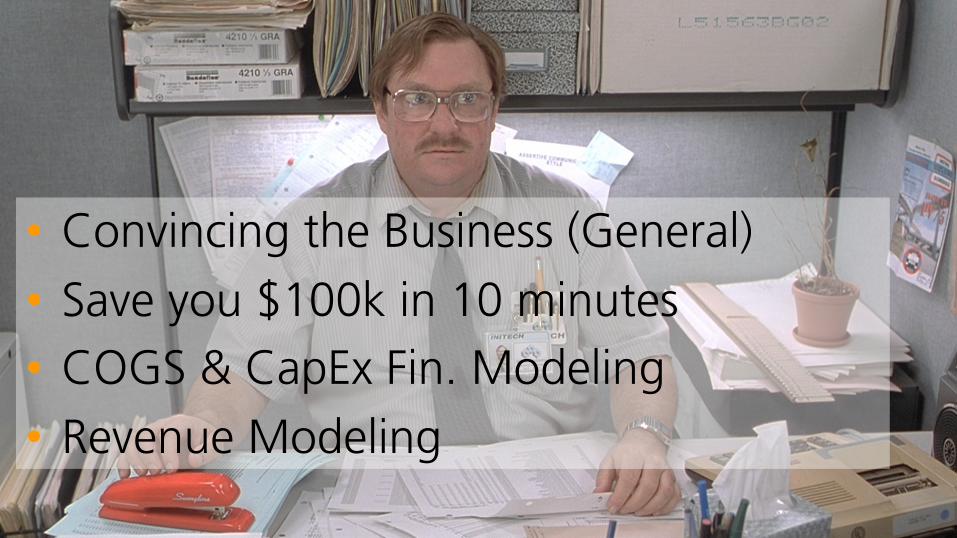
• Convincing the Business (General)• Save you $100k in 10 minutes• COGS & CapEx Fin. Modeling• Revenue Modeling

©2015 AKAMAI | FASTER FORWARDTM
Nobody likes waiting…
©2015 AKAMAI | FASTER FORWARDTM
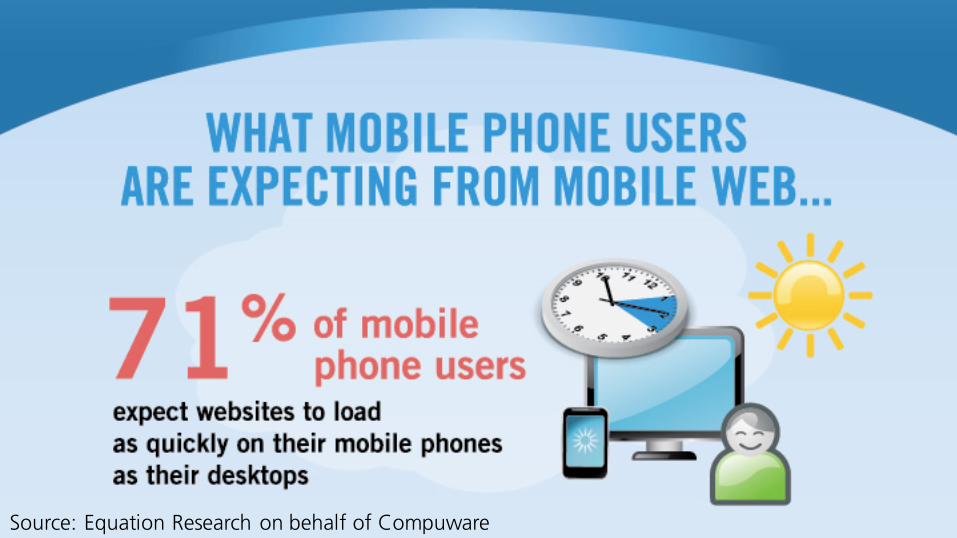
Source: Equation Research on behalf of Compuware
©2015 AKAMAI | FASTER FORWARDTM
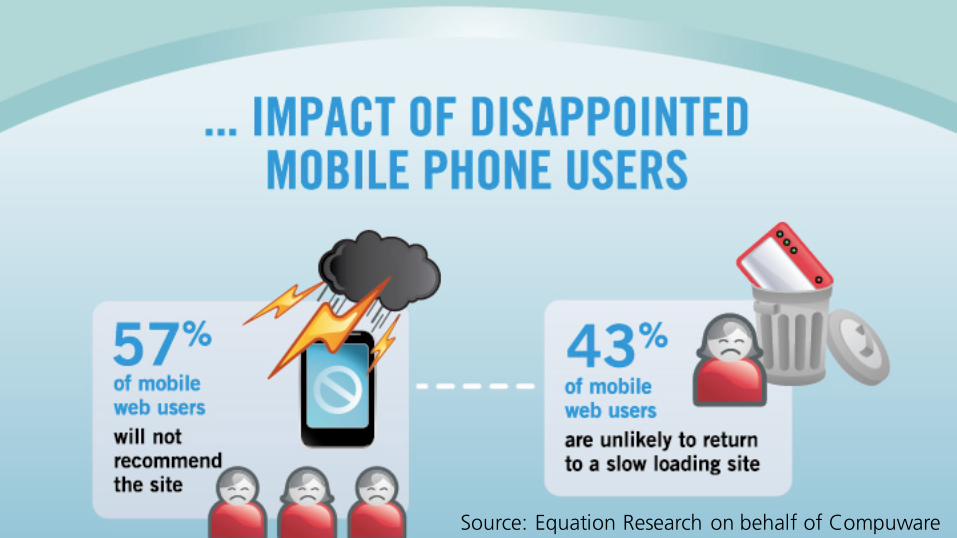
Source: Equation Research on behalf of Compuware
©2015 AKAMAI | FASTER FORWARDTM
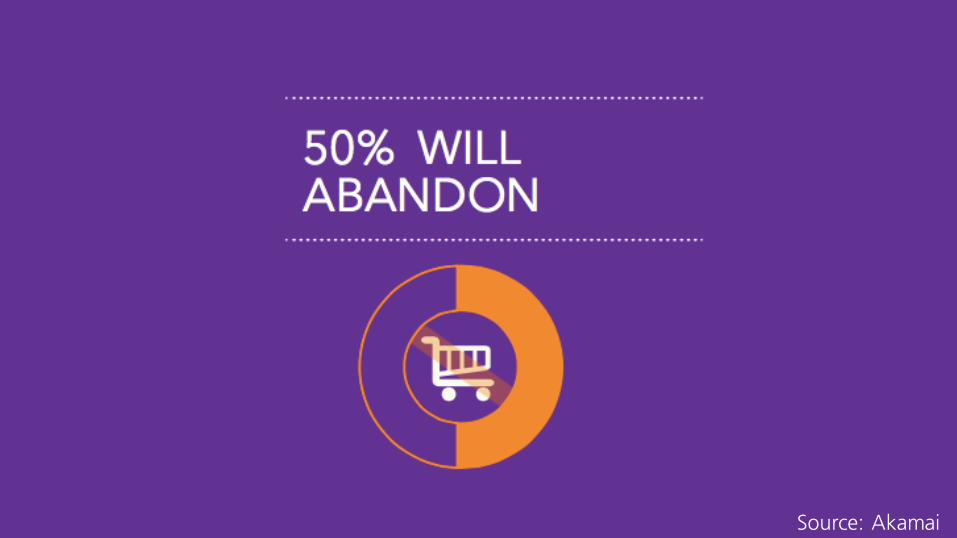
Source: Akamai
©2015 AKAMAI | FASTER FORWARDTM
But does Perf. Investment
Business Sense?

©2015 AKAMAI | FASTER FORWARDTM
©2015 AKAMAI | FASTER FORWARDTM
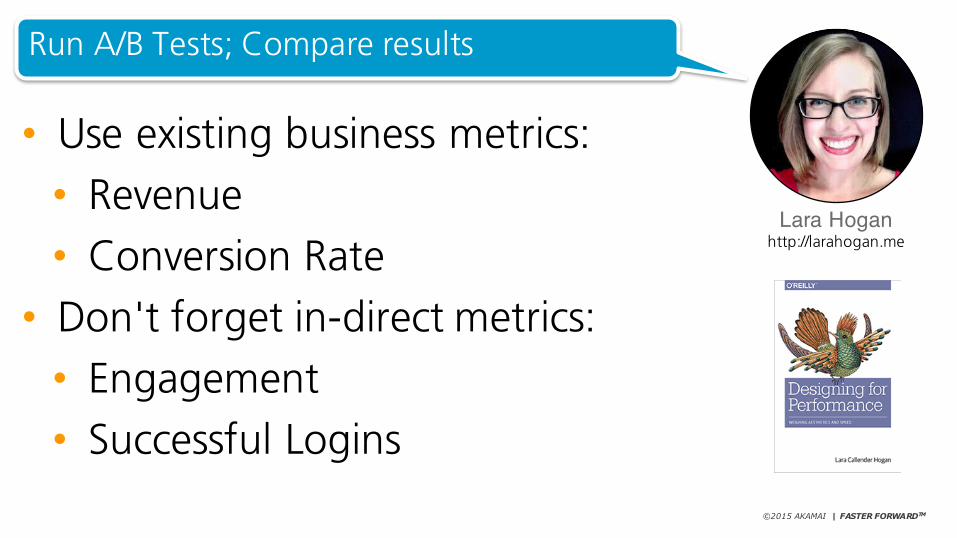
• Use existing business metrics:• Revenue• Conversion Rate• Don't forget in-direct metrics:• Engagement• Successful Logins
Lara Hoganhttp://larahogan.me
Run A/B Tests; Compare results
©2015 AKAMAI | FASTER FORWARDTM
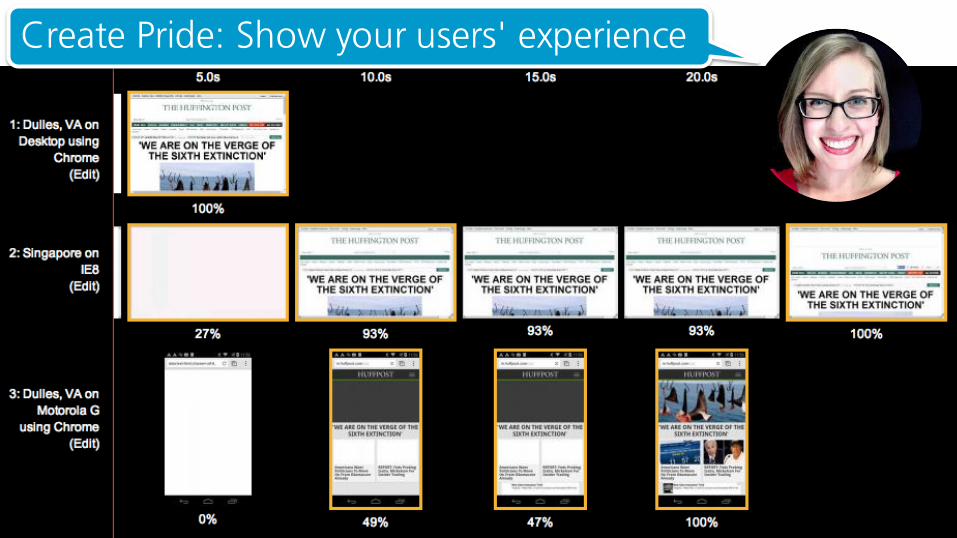
Create Pride: Show your users' experience
©2015 AKAMAI | FASTER FORWARDTM
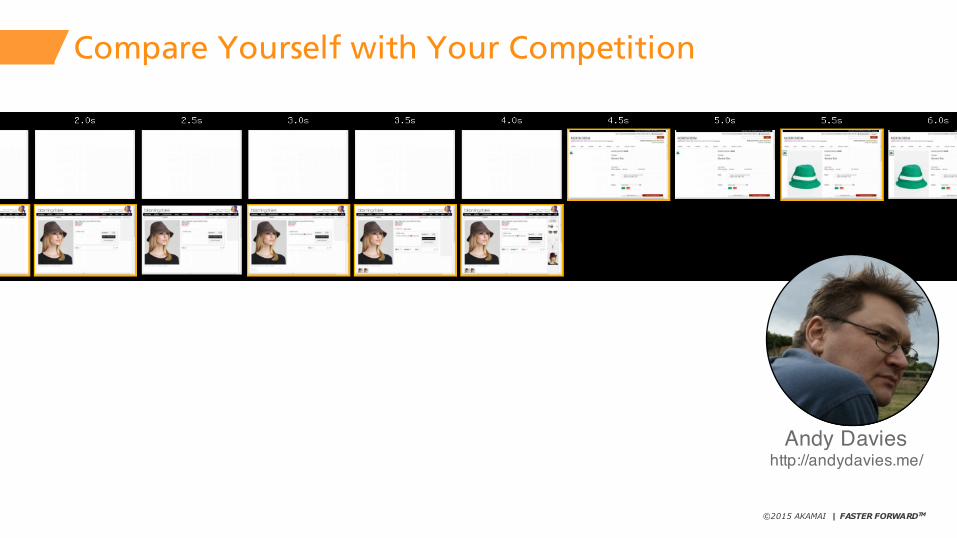
Compare Yourself with Your Competition
Andy Davieshttp://andydavies.me/

©2015 AKAMAI | FASTER FORWARDTM

©2015 AKAMAI | FASTER FORWARDTM
©2015 AKAMAI | FASTER FORWARDTM
Other Business'Success Stories
©2015 AKAMAI | FASTER FORWARDTM
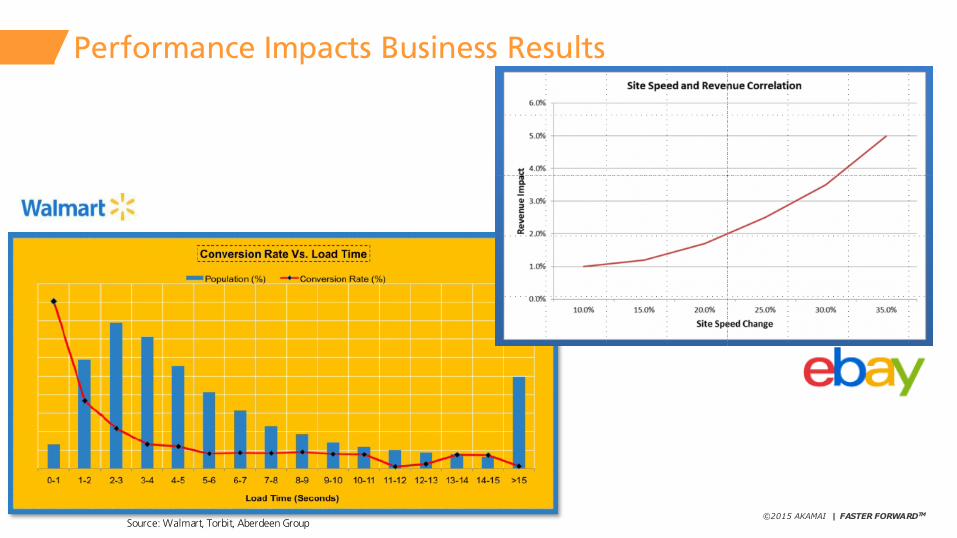
Performance Impacts Business Results
Source: Walmart, Torbit, Aberdeen Group
©2015 AKAMAI | FASTER FORWARDTM
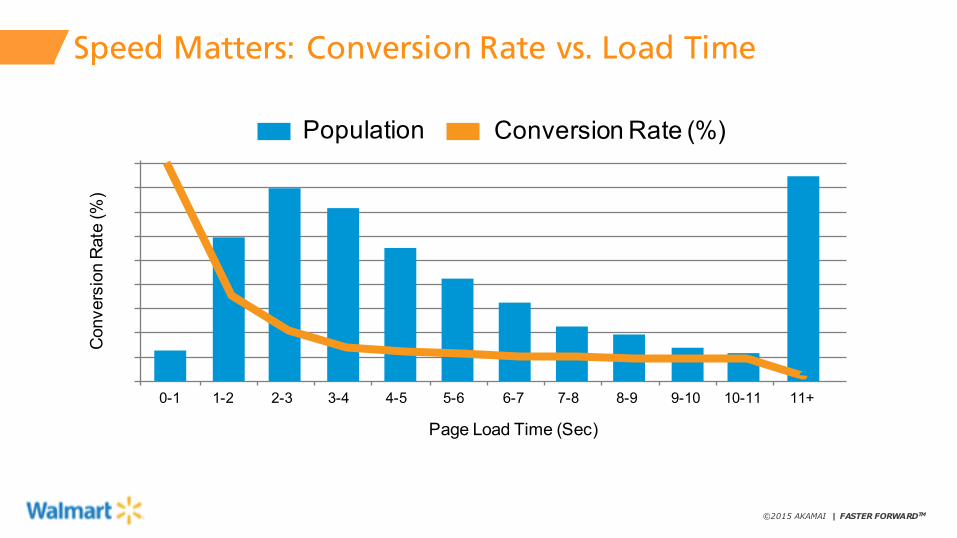
Speed Matters: Conversion Rate vs. Load TimeConversion Rate (%)
0-1 1-2 2-3 3-4 4-5 5-6 6-7 7-8 8-9 9-10 10-11 11+
Population Conversion Rate (%)
Page Load Time (Sec)
©2015 AKAMAI | FASTER FORWARDTM
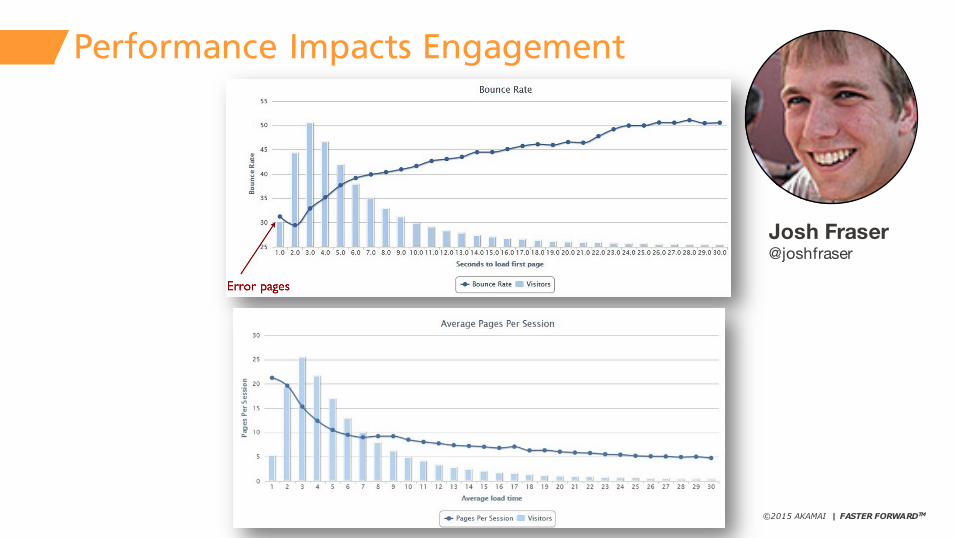
Performance Impacts Engagement
Josh Fraser@joshfraser
©2015 AKAMAI | FASTER FORWARDTM
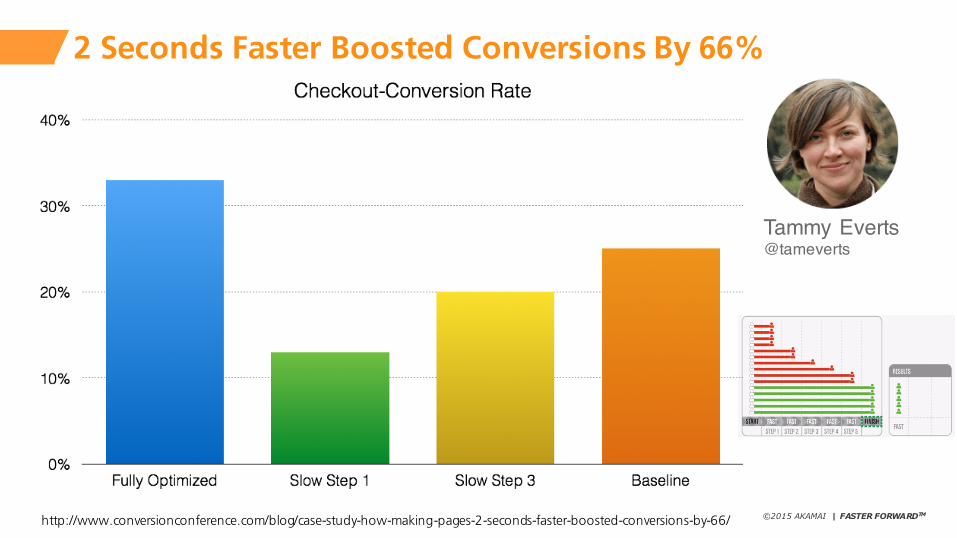
2 Seconds Faster Boosted Conversions By 66%
http://www.conversionconference.com/blog/case-study-how-making-pages-2-seconds-faster-boosted-conversions-by-66/
Tammy Everts@tameverts

©2015 AKAMAI | FASTER FORWARDTM

©2015 AKAMAI | FASTER FORWARDTM

©2015 AKAMAI | FASTER FORWARDTM
Spreadsheets:the Language of the CFO
©2015 AKAMAI | FASTER FORWARDTM
©2015 AKAMAI | FASTER FORWARDTM
10 minute
MBA
©2015 AKAMAI | FASTER FORWARDTM
Money buys beer

©2015 AKAMAI | FASTER FORWARDTM
How do I get [more] Money?
©2015 AKAMAI | FASTER FORWARDTM
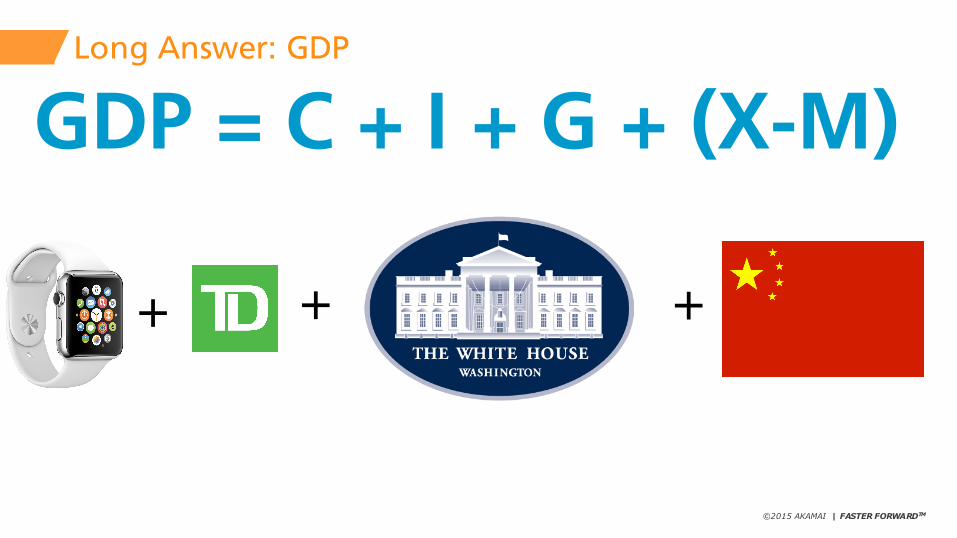
Long Answer: GDP
+ ++
GDP = C + I + G + (X-M)
©2015 AKAMAI | FASTER FORWARDTM
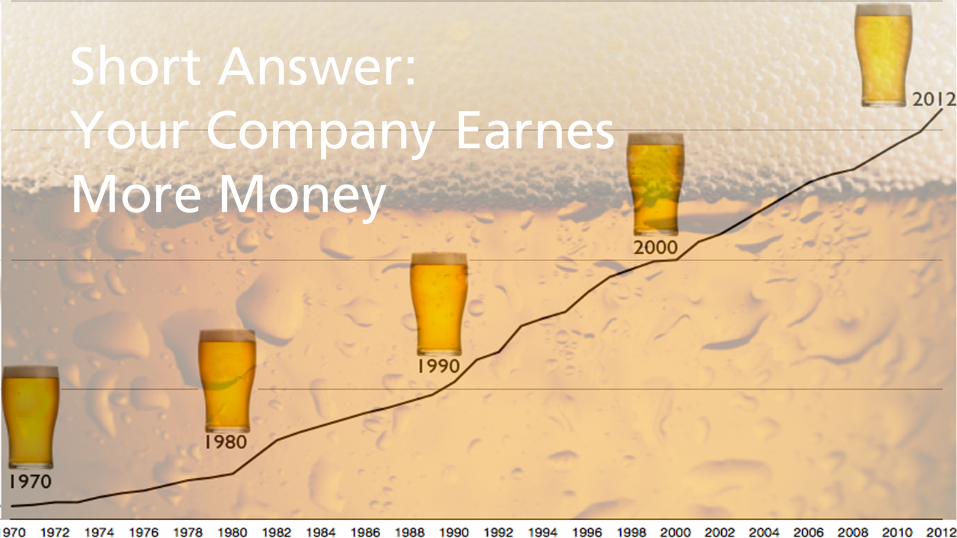
Short Answer: Your Company EarnesMore Money
©2015 AKAMAI | FASTER FORWARDTM
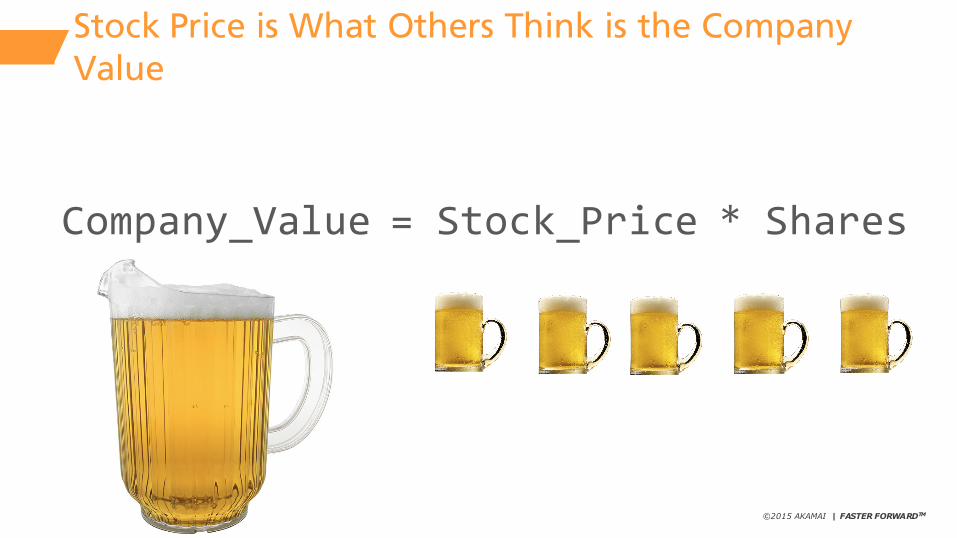
Stock Price is What Others Think is the Company Value
Company_Value = Stock_Price * Shares
©2015 AKAMAI | FASTER FORWARDTM
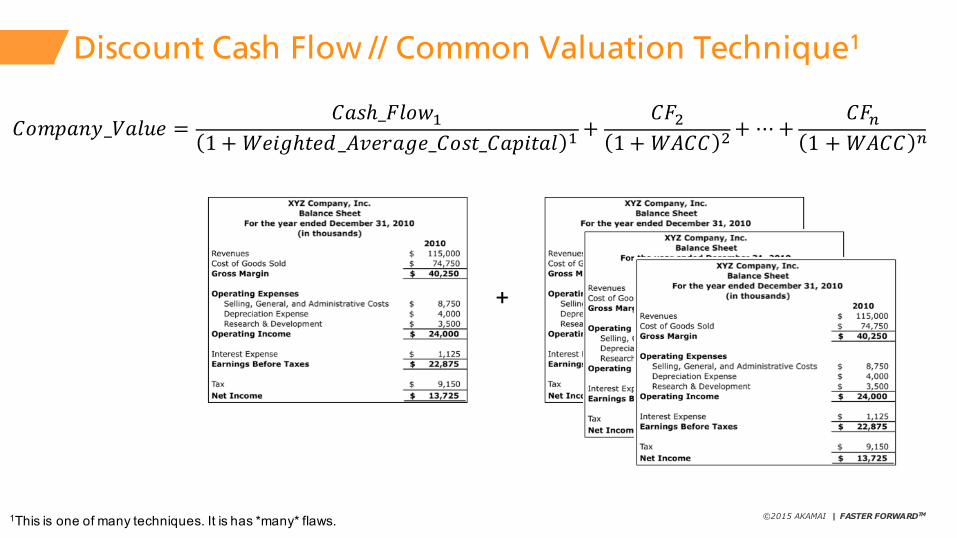
Discount Cash Flow // Common Valuation Technique1
𝐶𝑜𝑚𝑝𝑎𝑛𝑦_𝑉𝑎𝑙𝑢𝑒 =𝐶𝑎𝑠ℎ_𝐹𝑙𝑜𝑤2
1 + 𝑊𝑒𝑖𝑔ℎ𝑡𝑒𝑑_𝐴𝑣𝑒𝑟𝑎𝑔𝑒_𝐶𝑜𝑠𝑡_𝐶𝑎𝑝𝑖𝑡𝑎𝑙 2 +𝐶𝐹=
1 + 𝑊𝐴𝐶𝐶 =+ ⋯+𝐶𝐹?
1 + 𝑊𝐴𝐶𝐶 ?
+
1This is one of many techniques. It is has *many* flaws.
©2015 AKAMAI | FASTER FORWARDTM
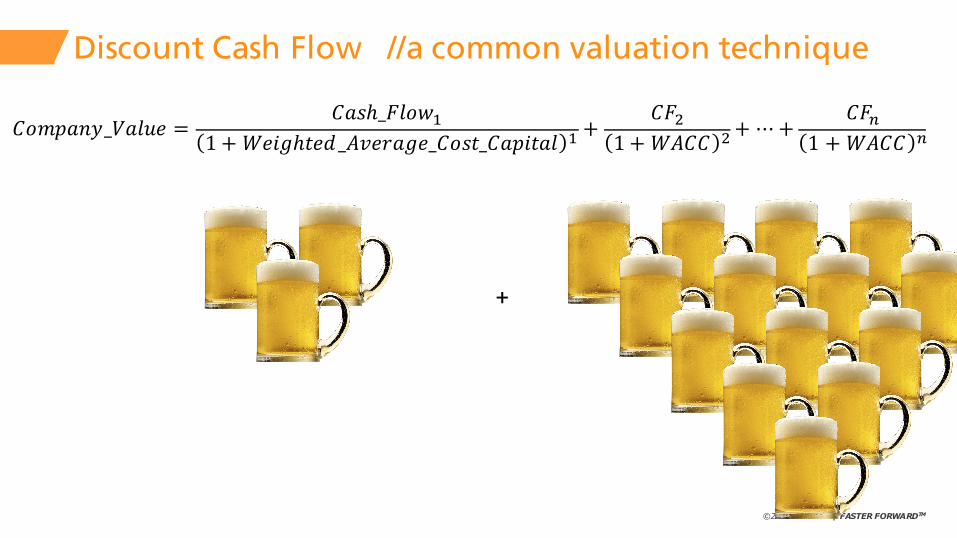
Discount Cash Flow //a common valuation technique
𝐶𝑜𝑚𝑝𝑎𝑛𝑦_𝑉𝑎𝑙𝑢𝑒 =𝐶𝑎𝑠ℎ_𝐹𝑙𝑜𝑤2
1 + 𝑊𝑒𝑖𝑔ℎ𝑡𝑒𝑑_𝐴𝑣𝑒𝑟𝑎𝑔𝑒_𝐶𝑜𝑠𝑡_𝐶𝑎𝑝𝑖𝑡𝑎𝑙 2 +𝐶𝐹=
1 + 𝑊𝐴𝐶𝐶 =+ ⋯+𝐶𝐹?
1 + 𝑊𝐴𝐶𝐶 ?
+

©2015 AKAMAI | FASTER FORWARDTM
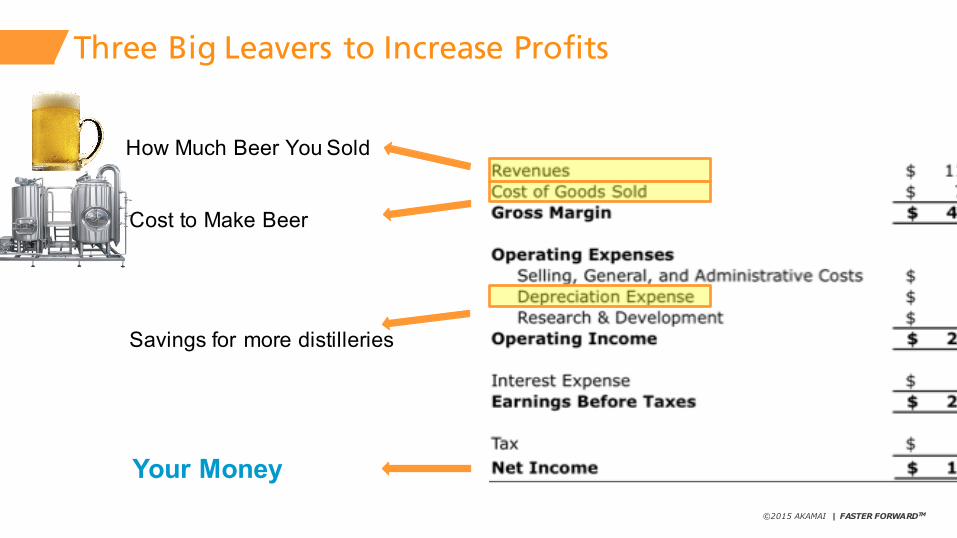
Profit & Loss Statement (or Income Statement)
How Much Beer You Sold
Cost to Make Beer
ManagementSavings for more distilleries
Your Money
©2015 AKAMAI | FASTER FORWARDTM
Three Big Leavers to Increase Profits
How Much Beer You Sold
Cost to Make Beer
Savings for more distilleries
Your Money

©2015 AKAMAI | FASTER FORWARDTM
More Money. More Beer.
©2015 AKAMAI | FASTER FORWARDTM
We are at a Performance Conference…… how does performance impact your P&L?
©2015 AKAMAI | FASTER FORWARDTM
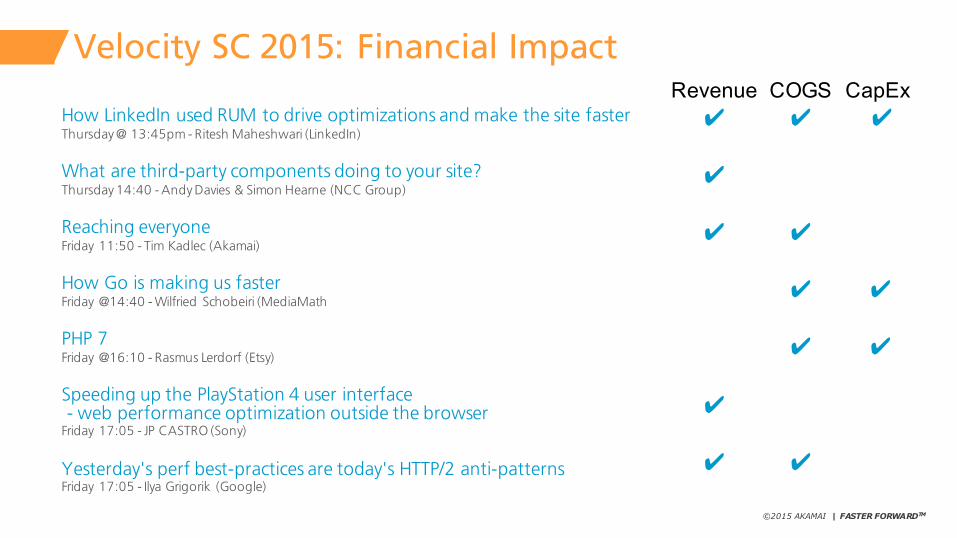
Velocity SC 2015: Financial Impact
How LinkedIn used RUM to drive optimizations and make the site fasterThursday @ 13:45pm - Ritesh Maheshwari (LinkedIn)
What are third-party components doing to your site?Thursday 14:40 - Andy Davies & Simon Hearne (NCC Group)
Reaching everyoneFriday 11:50 - Tim Kadlec (Akamai)
How Go is making us fasterFriday @14:40 - Wilfried Schobeiri (MediaMath
PHP 7Friday @16:10 - Rasmus Lerdorf (Etsy)
Speeding up the PlayStation 4 user interface- web performance optimization outside the browser
Friday 17:05 - JP CASTRO (Sony)
Yesterday's perf best-practices are today's HTTP/2 anti-patternsFriday 17:05 - Ilya Grigorik (Google)
Revenue COGS CapEx
©2015 AKAMAI | FASTER FORWARDTM
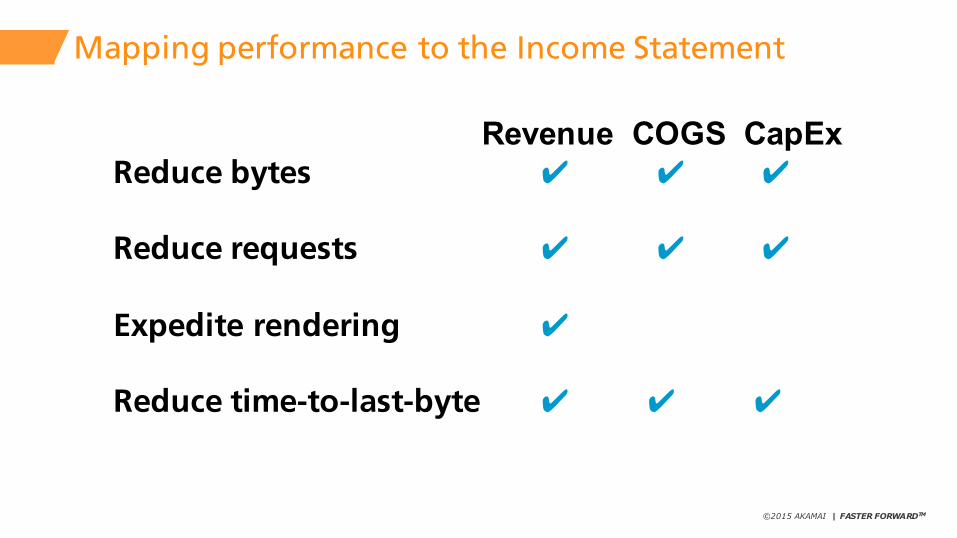
Mapping performance to the Income Statement
Revenue COGS CapExReduce bytes
Reduce requests
Expedite rendering
Reduce time-to-last-byte
©2015 AKAMAI | FASTER FORWARDTM
Financial ModelingPerformance
©2015 AKAMAI | FASTER FORWARDTM
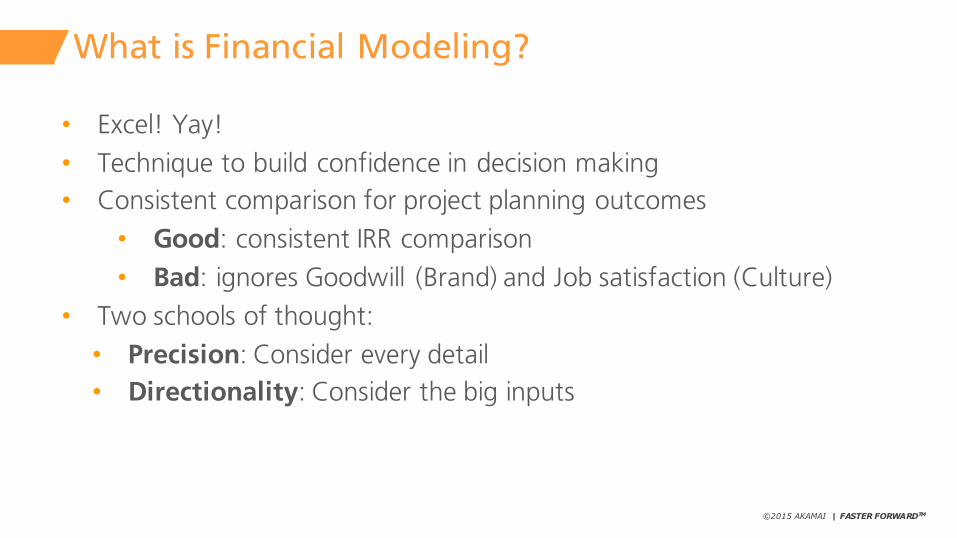
What is Financial Modeling?
• Excel! Yay!• Technique to build confidence in decision making• Consistent comparison for project planning outcomes
• Good: consistent IRR comparison• Bad: ignores Goodwill (Brand) and Job satisfaction (Culture)
• Two schools of thought:• Precision: Consider every detail• Directionality: Consider the big inputs
©2015 AKAMAI | FASTER FORWARDTM
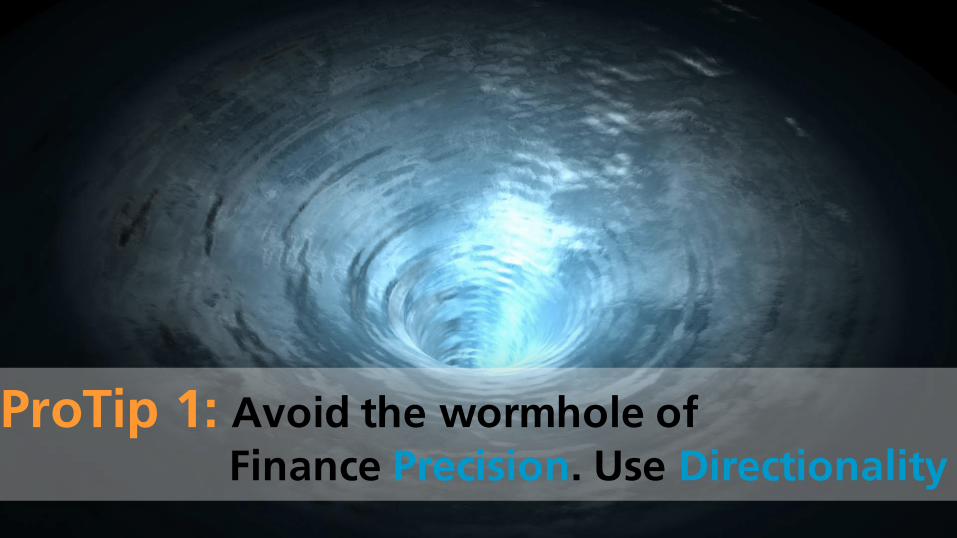
ProTip 1: Avoid the wormhole of Finance Precision. Use Directionality

©2015 AKAMAI | FASTER FORWARDTM
ProTip 2: Use conservative shortcuts
©2015 AKAMAI | FASTER FORWARDTM
Model 1:CapEx / OpEx CashFlow
©2015 AKAMAI | FASTER FORWARDTM
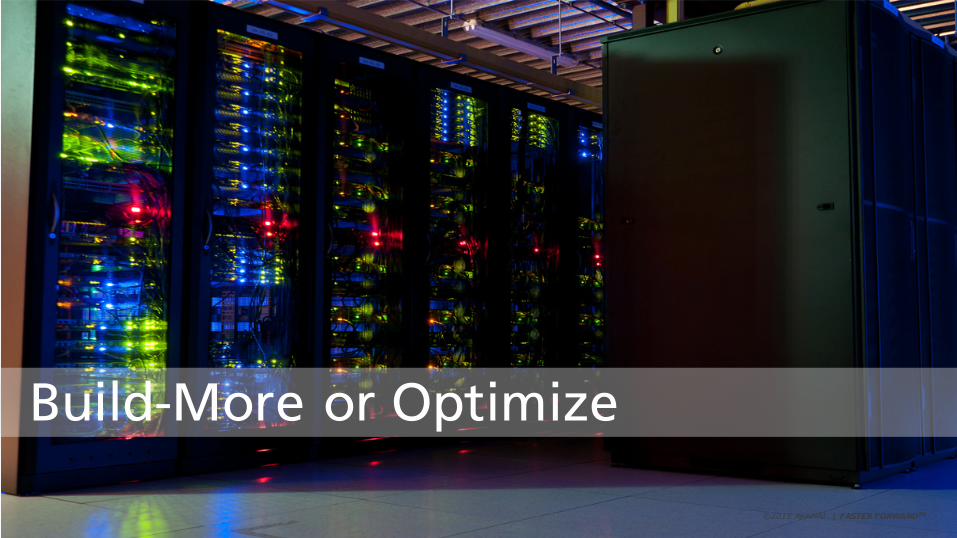
Build-More or Optimize

©2015 AKAMAI | FASTER FORWARDTM
CashFlow Opportunities: Requests, Bytes, TTLB
Server Time
Handshake

©2015 AKAMAI | FASTER FORWARDTM
Pros & Cons of CashFlow Modeling
Use this model:• When you are optimizing backend processes• Adding caching layers (back-end, cdn, client) • Optimizing user workflows• Optimizing page layout
Don't use this model:• Optimizing client compute (eg: javascript)• Optimizing client rendering (eg: adding webp)
©2015 AKAMAI | FASTER FORWARDTM
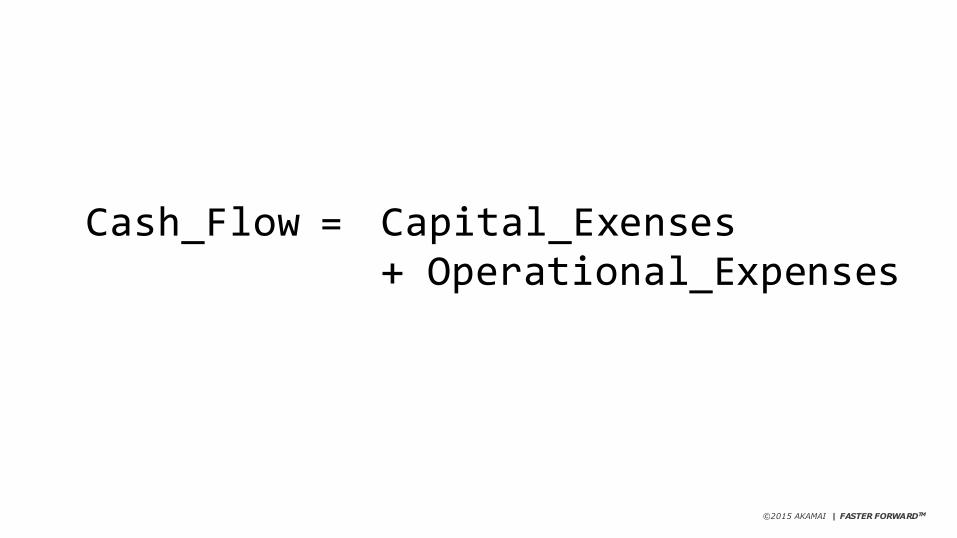
Cash_Flow = Capital_Exenses+ Operational_Expenses
©2015 AKAMAI | FASTER FORWARDTM
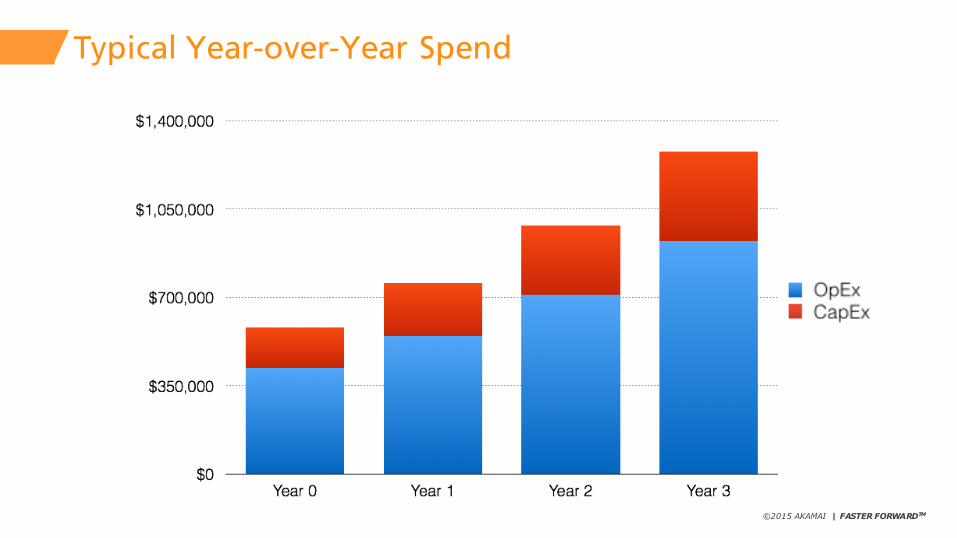
Typical Year-over-Year Spend

©2015 AKAMAI | FASTER FORWARDTM
Questions
• Will your improvements slow the rate of new hardware purchased? • Will it reduce the operating costs? • Will you be able to turn down servers?• What are the projected costs with and without improved performance?
©2015 AKAMAI | FASTER FORWARDTM
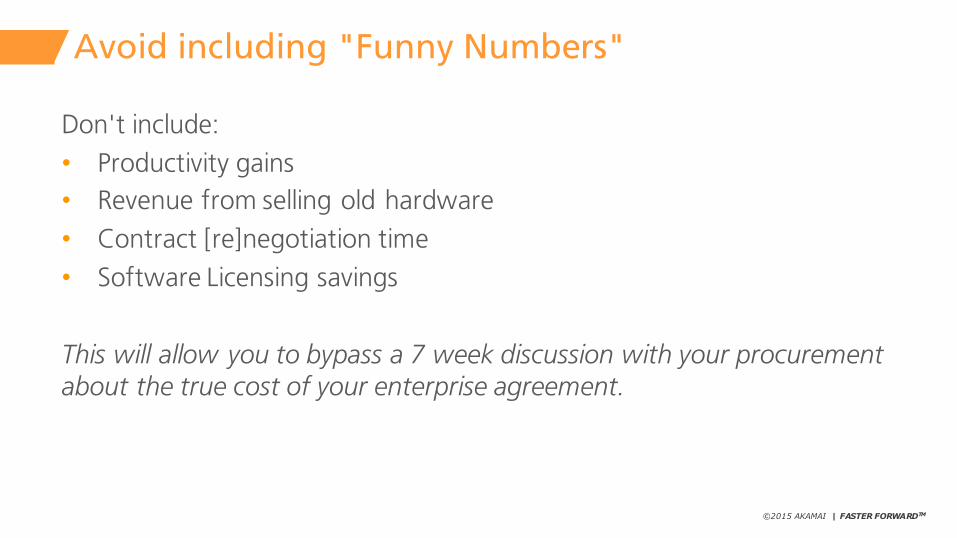
Avoid including "Funny Numbers"
Don't include:• Productivity gains• Revenue from selling old hardware• Contract [re]negotiation time• Software Licensing savings
This will allow you to bypass a 7 week discussion with your procurement about the true cost of your enterprise agreement.
©2015 AKAMAI | FASTER FORWARDTM
This company tried computing the true cost of the enterprise agreement.
©2015 AKAMAI | FASTER FORWARDTM
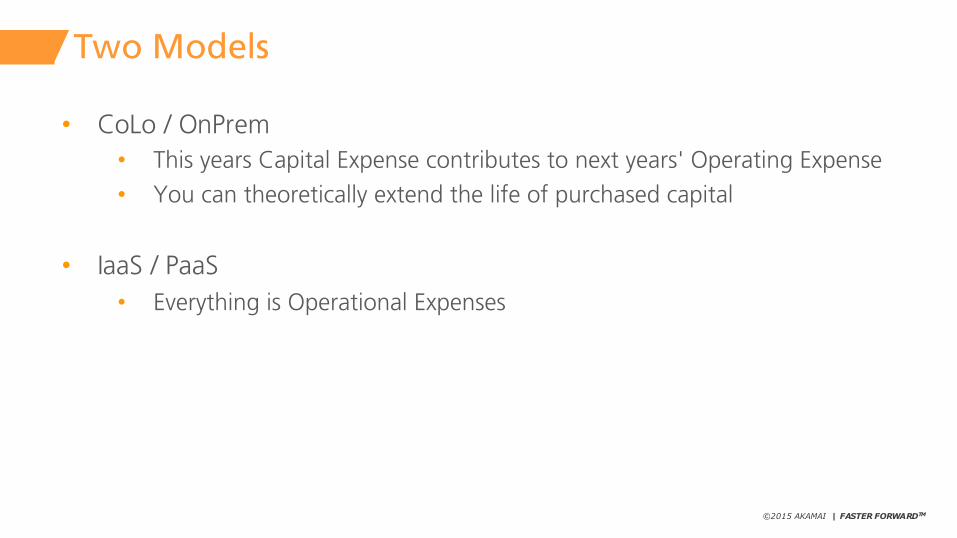
Two Models
• CoLo / OnPrem• This years Capital Expense contributes to next years' Operating Expense• You can theoretically extend the life of purchased capital
• IaaS / PaaS• Everything is Operational Expenses

©2015 AKAMAI | FASTER FORWARDTM
Operating_Exepnse = Number of Servers * Usage
OR
Capital_Expense= Number_of_New_Servers * Average_Server_Cost
Operating_Exepnse= Number_of_Servers * Average_Server_KVA
* CoLo_Cost_per_KVA

©2015 AKAMAI | FASTER FORWARDTM
Calculating Capital Expenses (CapEx)
CapEx = Number_of_Servers * Average_Cost
• Use "Fully Loaded" cost (incl: cost to procure, security audits, coloservice tickets, rack & stack fees, etc)
• Use lowest-common-denominator to save inventorying your infrastructure
• If in doubt:
$5,000
$100,000
©2015 AKAMAI | FASTER FORWARDTM
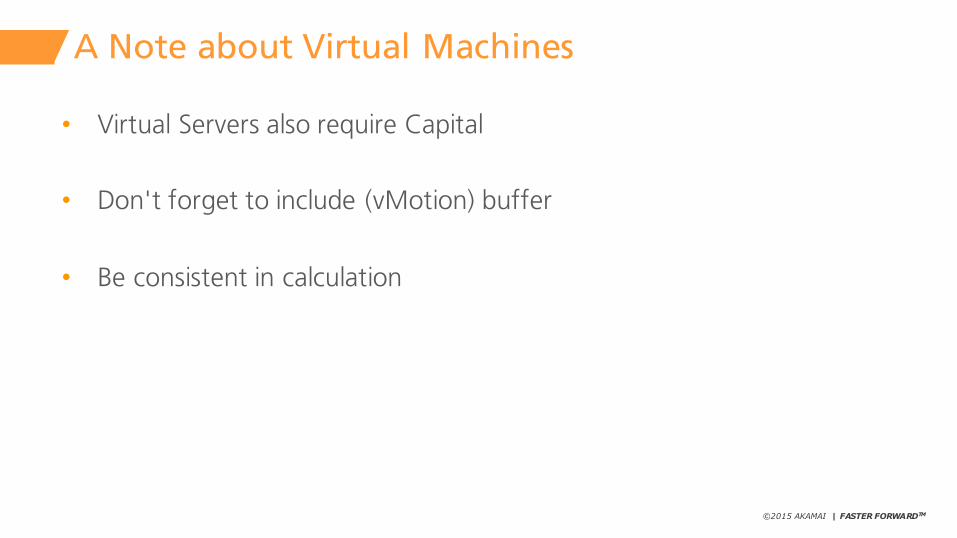
A Note about Virtual Machines
• Virtual Servers also require Capital
• Don't forget to include (vMotion) buffer
• Be consistent in calculation
©2015 AKAMAI | FASTER FORWARDTM
Plugging in the Numbers
https://goo.gl/6OHj9a
©2015 AKAMAI | FASTER FORWARDTM
Calculating Operating Expenses (OpEx)
Best Practice:• Include all servers, regardless of role• Assume that increase in user demand = increase in infrastructure use
Data-Center OpEx• Most Co-Lo providers bill based on power usage• Assume Co-Lo pricing includes cooling, floor space, and internet• Each datacenter is a special snowflake: be conservative in your
calculations
©2015 AKAMAI | FASTER FORWARDTM
OpEx
OpEx = Number_of_Servers * KVA_per_Server * KVA_Price
• Pick one hardware profile that is representative• If in doubt, use the newest hardware’s power consumption• Use 80% of the manufacturers reported fully loaded power draw• Most hardware reports power as Watts and BTU. Assume a power-
factor of 0.9 and use:• KVA = Watts / 900
• When in doubt I use these approximation numbers:• 0.5KVA for an average pizza box server• 3.5KVA for a 6U high density compute chassis
©2015 AKAMAI | FASTER FORWARDTM
Colo's charge by electricity
OpEx = Number_of_Servers * KVA_per_Server * KVA_Price
• Most CoLos bundle amenities and charge by electricity• Ranges from $0.70/KVA/mo to $0.20/KVA/mo• Running your own datacenter =~ colo space• If in doubt, a conservative, after tax value: $0.50/KVA/mo
©2015 AKAMAI | FASTER FORWARDTM

©2015 AKAMAI | FASTER FORWARDTM
Plugging in the Numbers
https://goo.gl/6OHj9a
©2015 AKAMAI | FASTER FORWARDTM
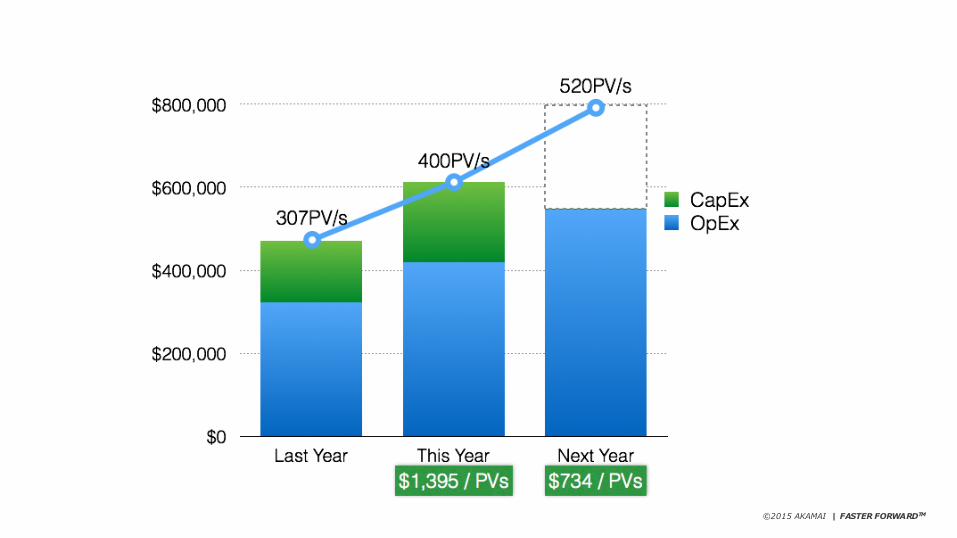
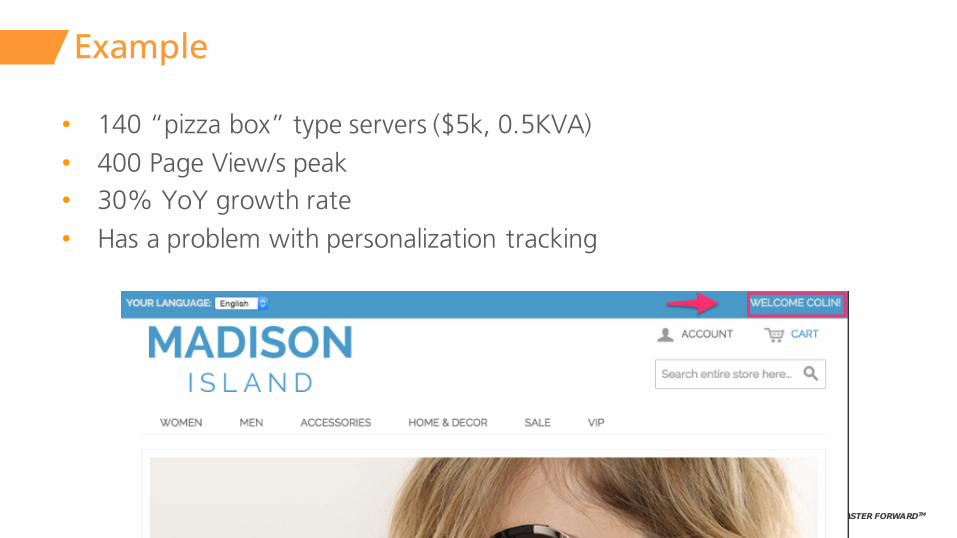
Example
• 140 “pizza box” type servers ($5k, 0.5KVA)• 400 Page View/s peak• 30% YoY growth rate• Has a problem with personalization tracking
©2015 AKAMAI | FASTER FORWARDTM
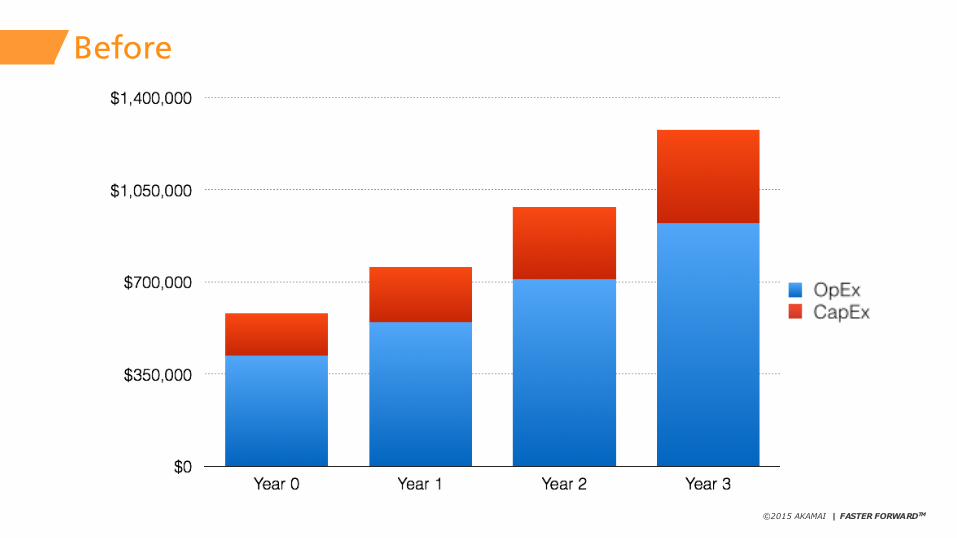
Before
©2015 AKAMAI | FASTER FORWARDTM
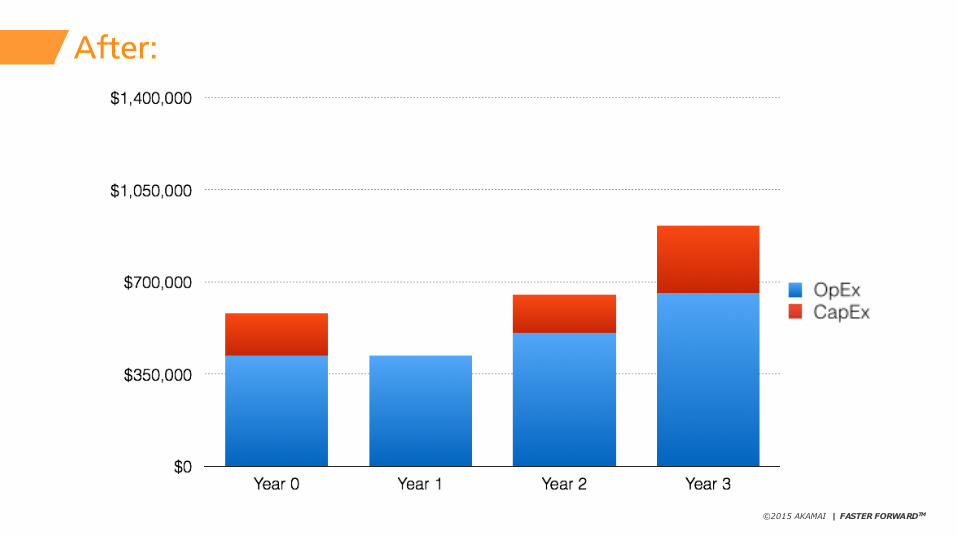
After:
©2015 AKAMAI | FASTER FORWARDTM
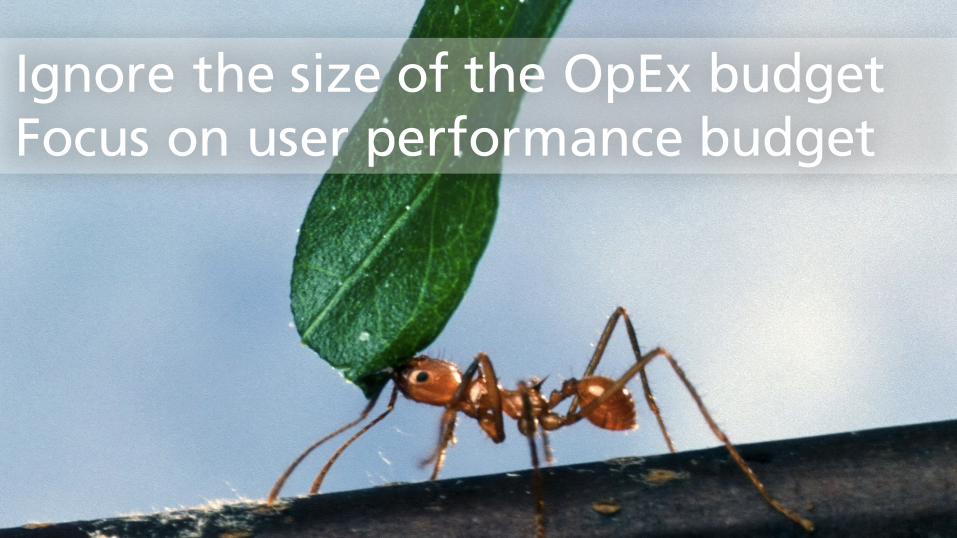
Ignore the size of the OpEx budgetFocus on user performance budget
©2015 AKAMAI | FASTER FORWARDTM
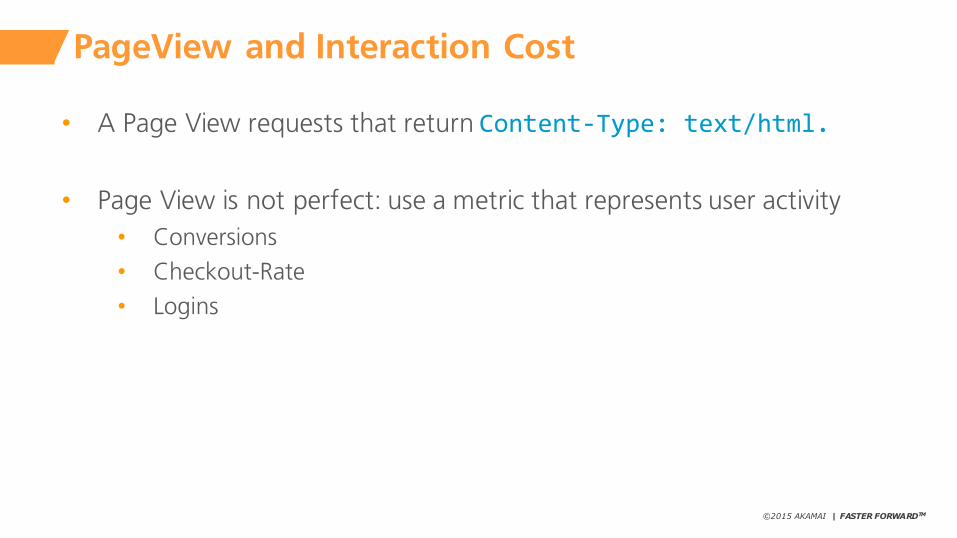
PageView and Interaction Cost
• A Page View requests that return Content-‐Type: text/html.
• Page View is not perfect: use a metric that represents user activity • Conversions• Checkout-Rate• Logins
©2015 AKAMAI | FASTER FORWARDTM
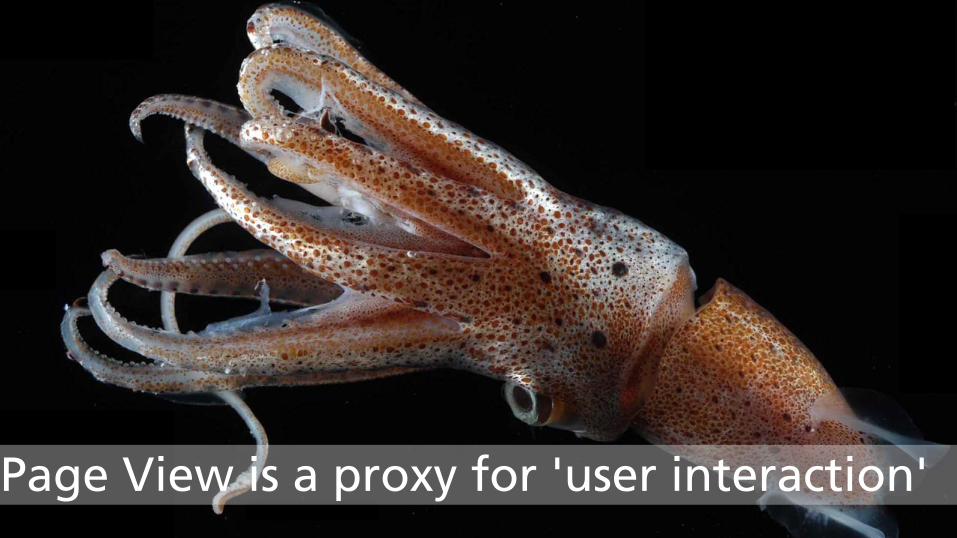
Page View is a proxy for 'user interaction'

©2015 AKAMAI | FASTER FORWARDTM
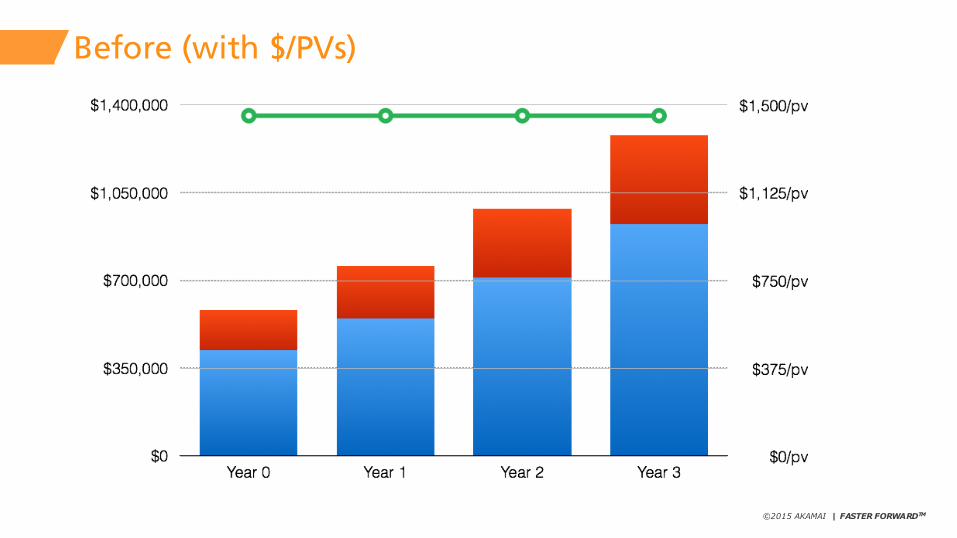
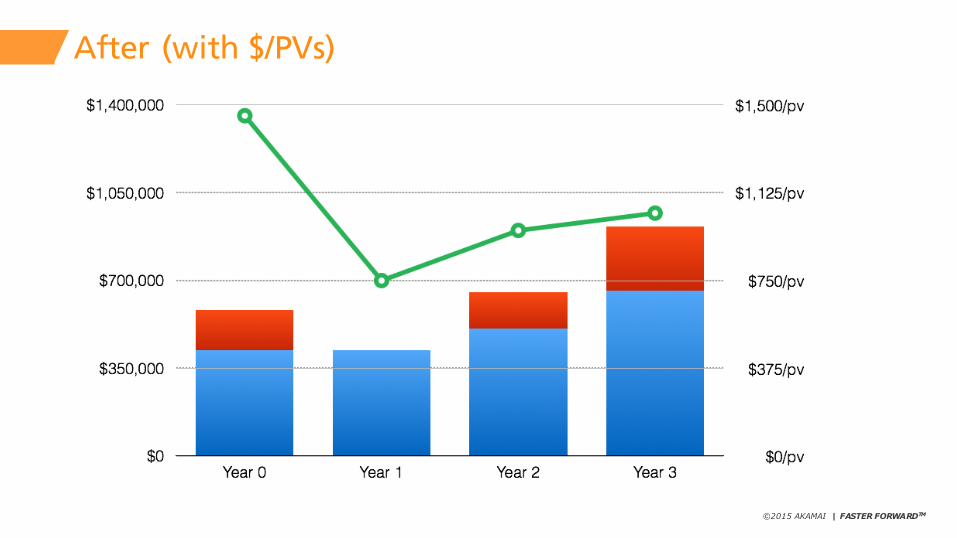
Interaction Cost
Interaction_Cost = (OpEx + CapEx) / Page_View_per_Second
• Max page view per second tells us how much money is spent to maintain this peak traffic• You have built implicitly to meet peak traffic
• As user demand grows, you will build more hardware in lock step
• Interaction Cost to remain constant year over year
©2015 AKAMAI | FASTER FORWARDTM
Before (with $/PVs)
©2015 AKAMAI | FASTER FORWARDTM
After (with $/PVs)
©2015 AKAMAI | FASTER FORWARDTM
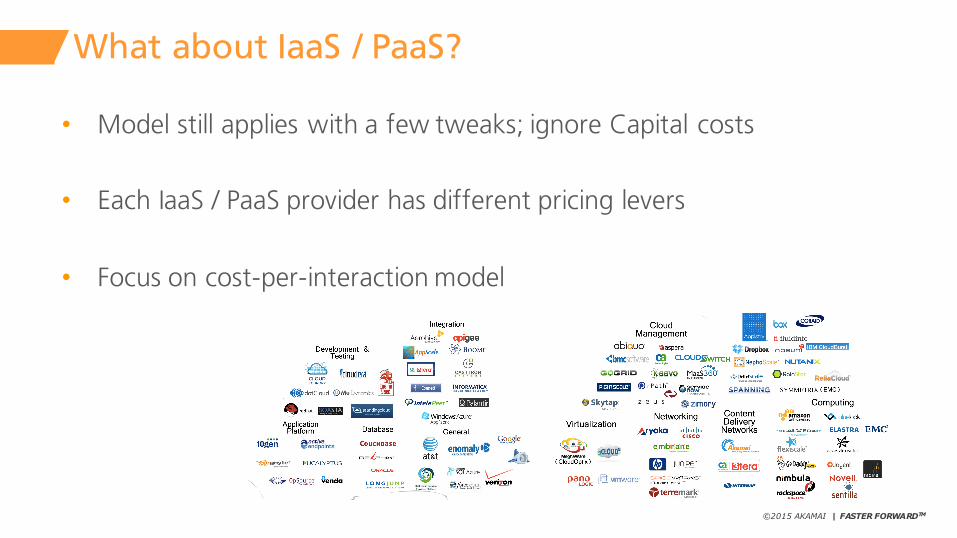
What about IaaS / PaaS?
• Model still applies with a few tweaks; ignore Capital costs
• Each IaaS / PaaS provider has different pricing levers
• Focus on cost-per-interaction model

©2015 AKAMAI | FASTER FORWARDTM
Please, tell me more
about your made-up financial model
©2015 AKAMAI | FASTER FORWARDTM
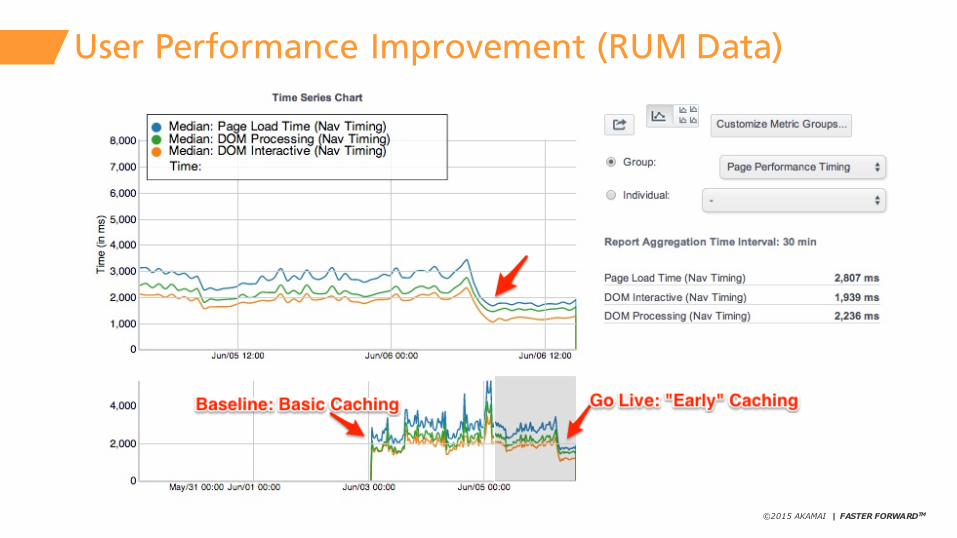
User Performance Improvement (RUM Data)
©2015 AKAMAI | FASTER FORWARDTM
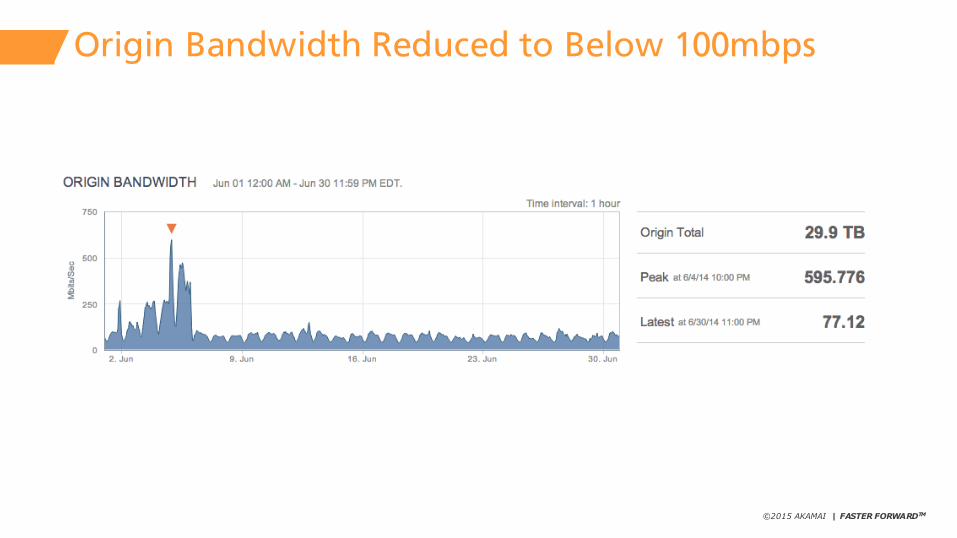
Origin Bandwidth Reduced to Below 100mbps
©2015 AKAMAI | FASTER FORWARDTM
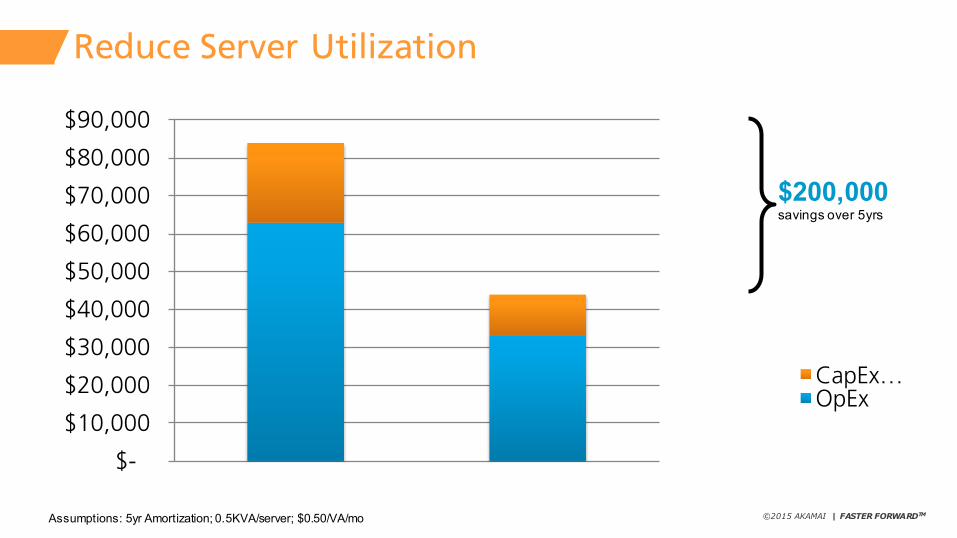
Reduce Server Utilization
$-
$10,000
$20,000
$30,000
$40,000
$50,000
$60,000
$70,000
$80,000
$90,000
CapEx …OpEx
Assumptions: 5yr Amortization;; 0.5KVA/server;; $0.50/VA/mo
$200,000savings over 5yrs
©2015 AKAMAI | FASTER FORWARDTM
Cashflow Summary
• Backend performance can impact end-user performance• Performance can have financial impact
• Use CapEx and OpEx modeling to show directionality of impact• Avoid the detailed nuances – use conservative generalizations
• You can use the same model to project negative financial impact (eg: image responsive images)
©2015 AKAMAI | FASTER FORWARDTM
RevenueProbabilistic Modeling

©2015 AKAMAI | FASTER FORWARDTM
Revenue Modeling
• Your Operations teams can control CapEx and OpEx spending
What about Revenue?• How can performance improve total sales?• How performance increases user growth (CAGR)• How performance increases sales per user (ARPU)
©2015 AKAMAI | FASTER FORWARDTM
Revenue Modeling is Hard

©2015 AKAMAI | FASTER FORWARDTM
Applying Monte-Carlo Simulation
• Apply probability based input on an equation• Run many times• Evaluate the results

©2015 AKAMAI | FASTER FORWARDTM
Plugging in the Numbers
https://goo.gl/6OHj9a
©2015 AKAMAI | FASTER FORWARDTM
Notes about Revenue Modeling
• Use Revenue Modeling to show directionality
• Avoid absolute claims about performance
• Consider regression analysis to understand what probability inputs
• Know your user performance distribution first. (You are using Real-User-Monitoring, right?)

©2015 AKAMAI | FASTER FORWARDTM
So yea, you're going to have to come in to work over the weekend now…
©2015 AKAMAI | FASTER FORWARDTM
Summary
• Performance correlates to engagement
• Make performance part of your culture • Understand the user experience and leverage empathy
• Project cash flow savings from performance• Applies to OnPrem and IaaS/PaaS
• Project revenue impact from performance
©2015 AKAMAI | FASTER FORWARDTM
Performance can make happy users and makes business sense!
Thank-You!@ColinBendell