Embed Size (px)
Citation preview
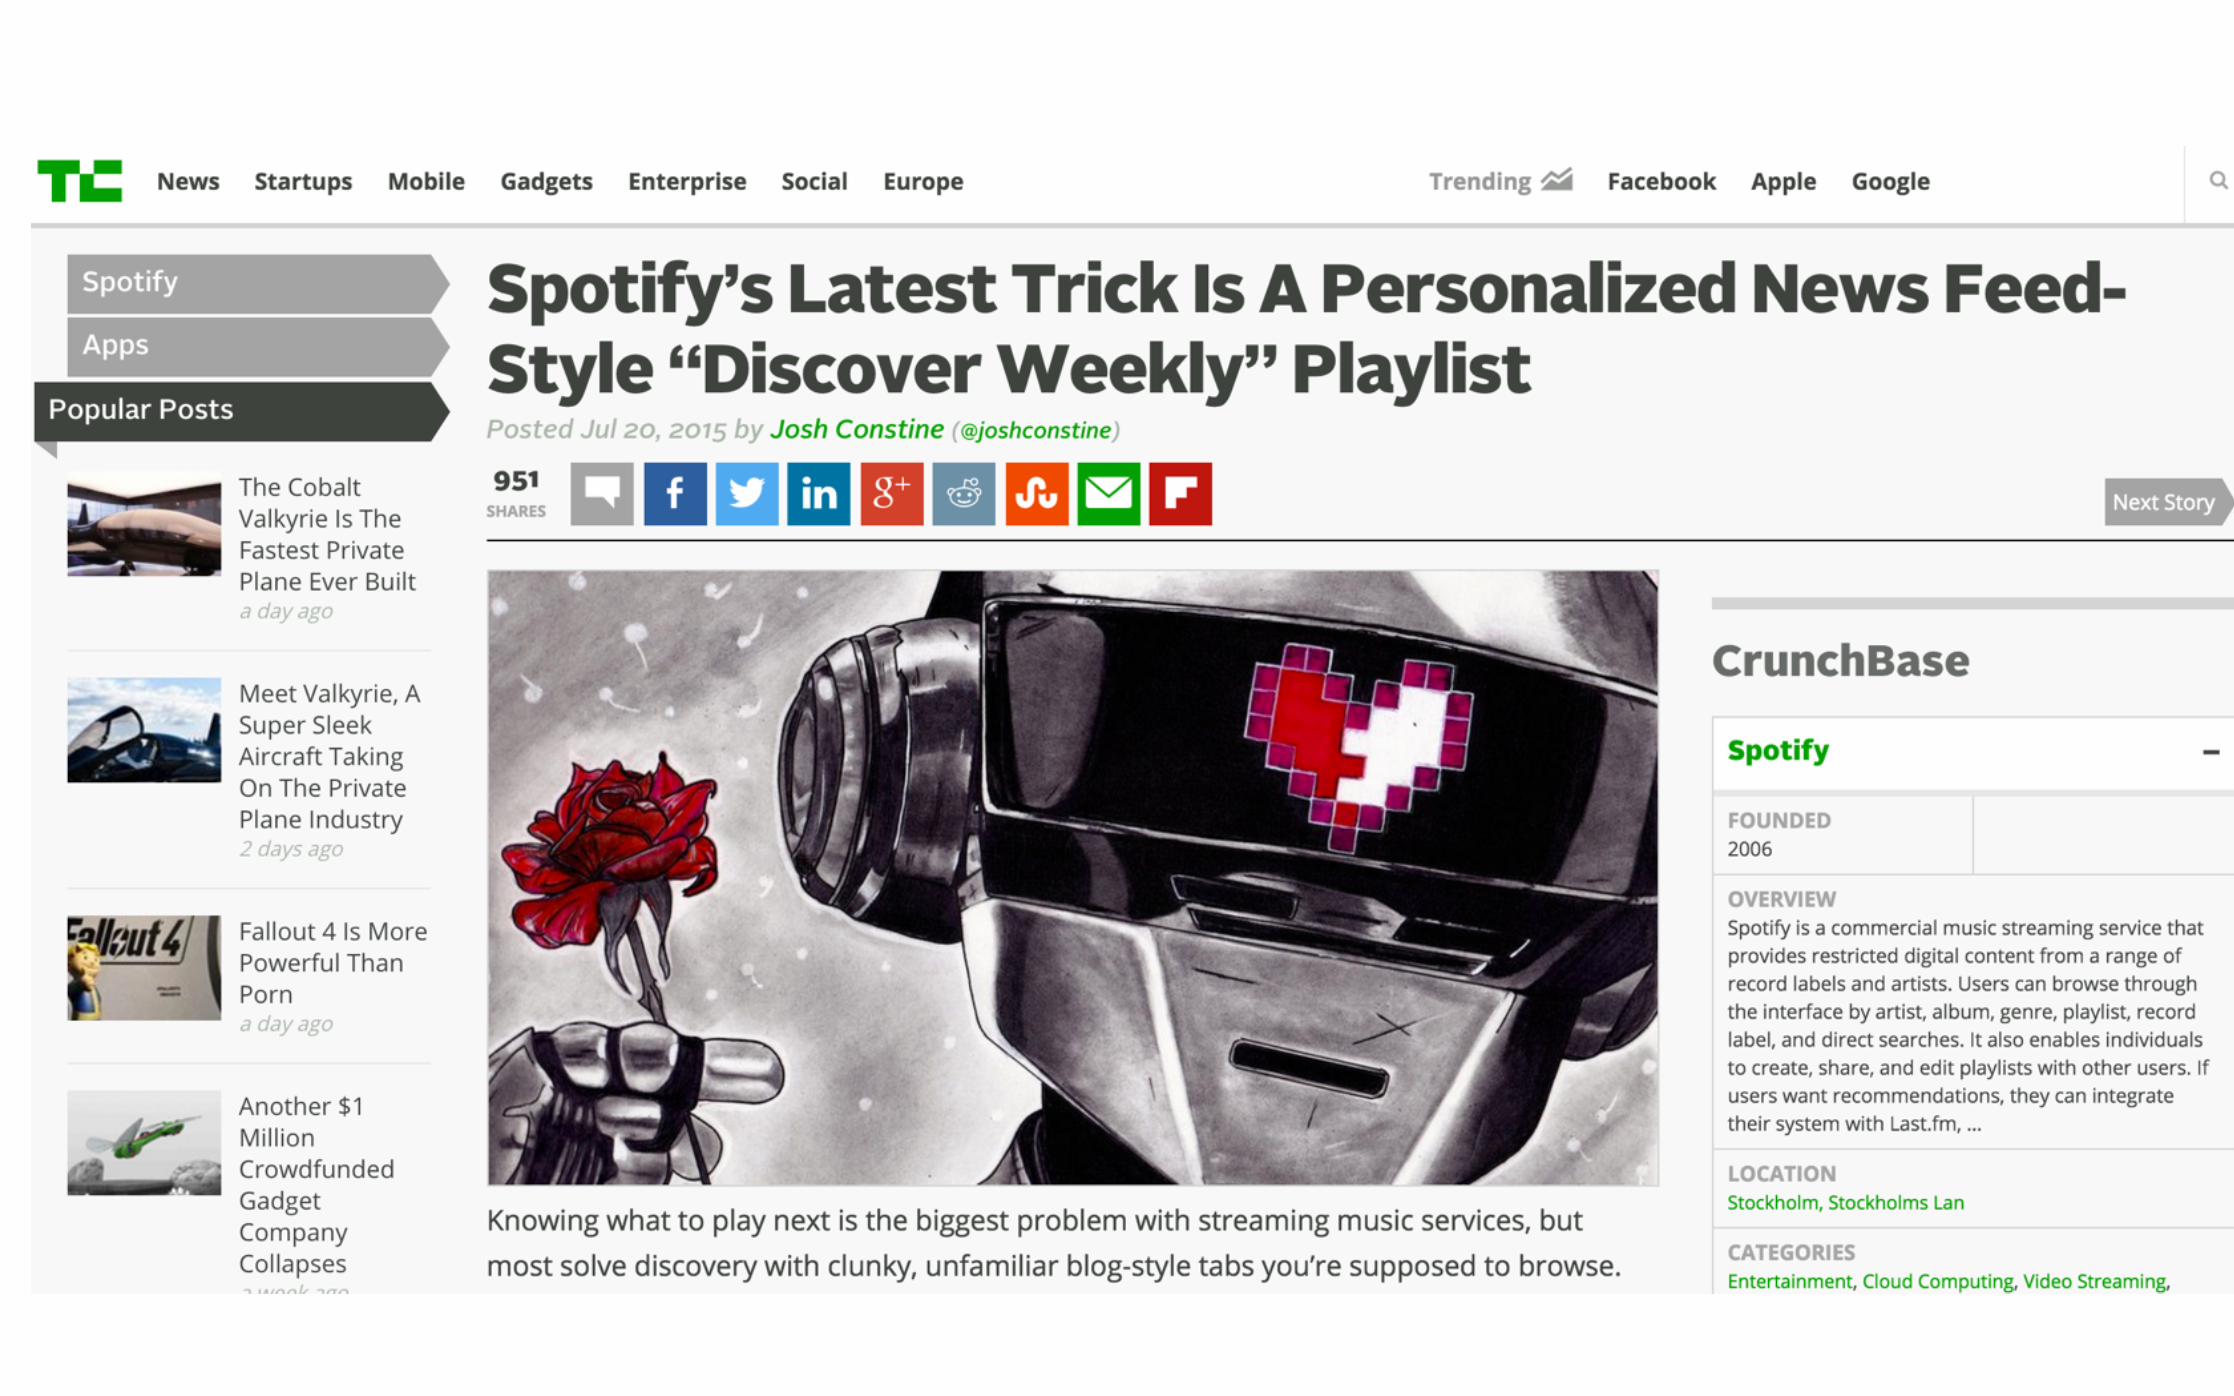
From Idea to Execution: Spotify’s Discover Weekly
Chris Johnson :: @MrChrisJohnsonEdward Newett :: @scaladaze DataEngConf • NYC • Nov 2015
Or: 5 lessons in building recommendation products at scale
Who are We??
Chris Johnson Edward Newett
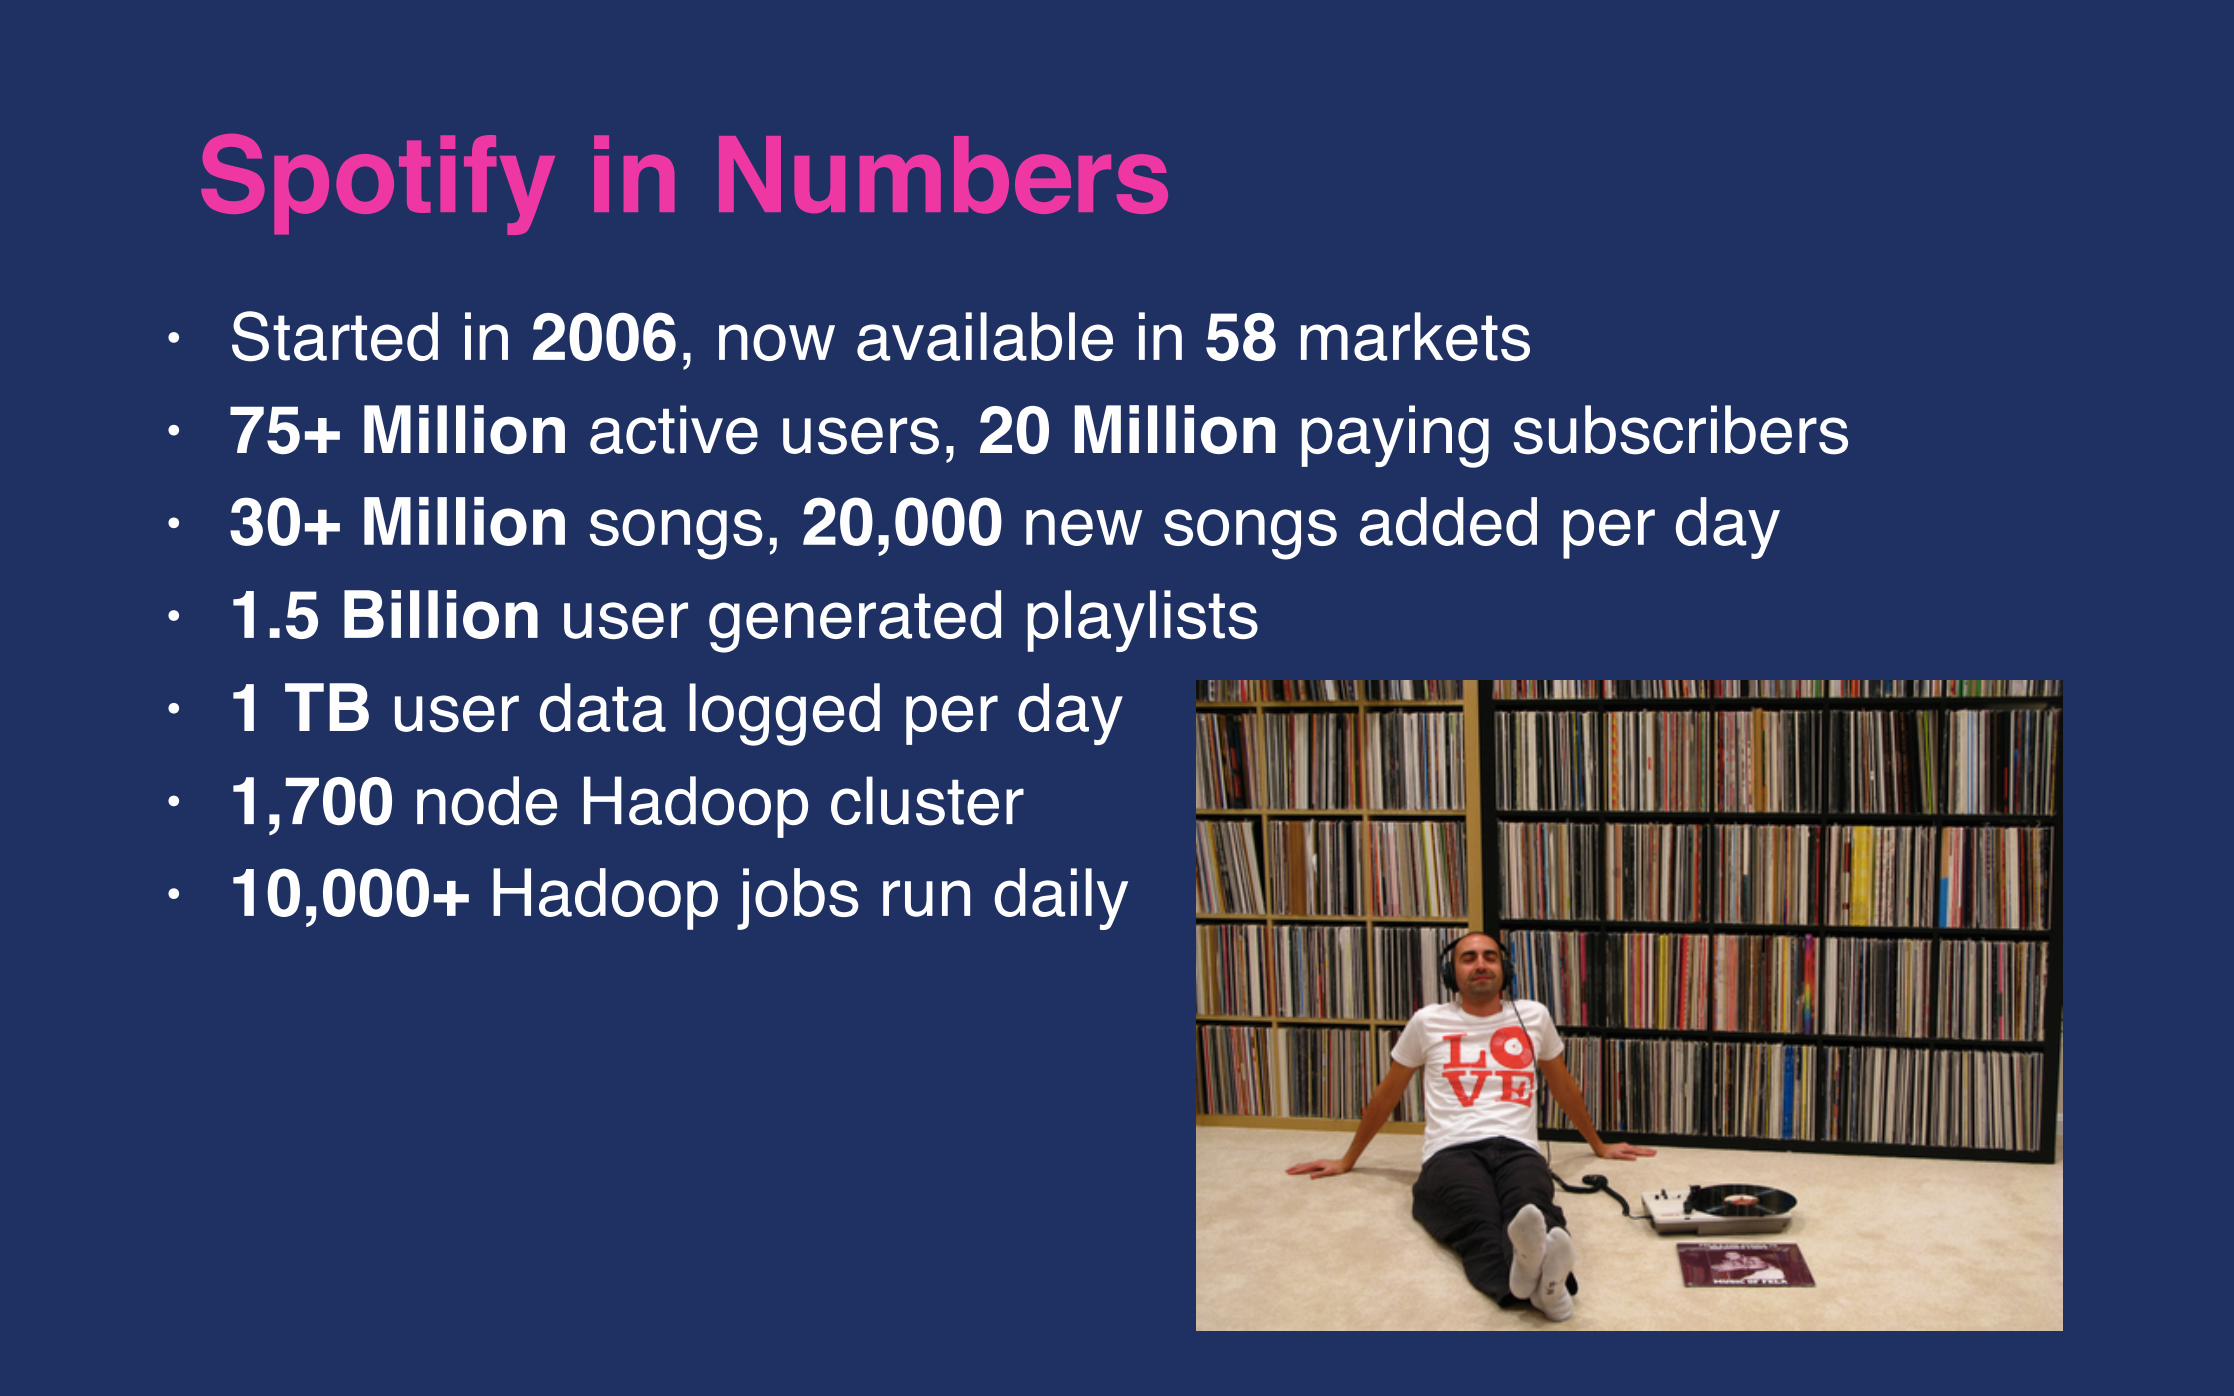
Spotify in Numbers• Started in 2006, now available in 58 markets• 75+ Million active users, 20 Million paying subscribers• 30+ Million songs, 20,000 new songs added per day• 1.5 Billion user generated playlists• 1 TB user data logged per day• 1,700 node Hadoop cluster • 10,000+ Hadoop jobs run daily
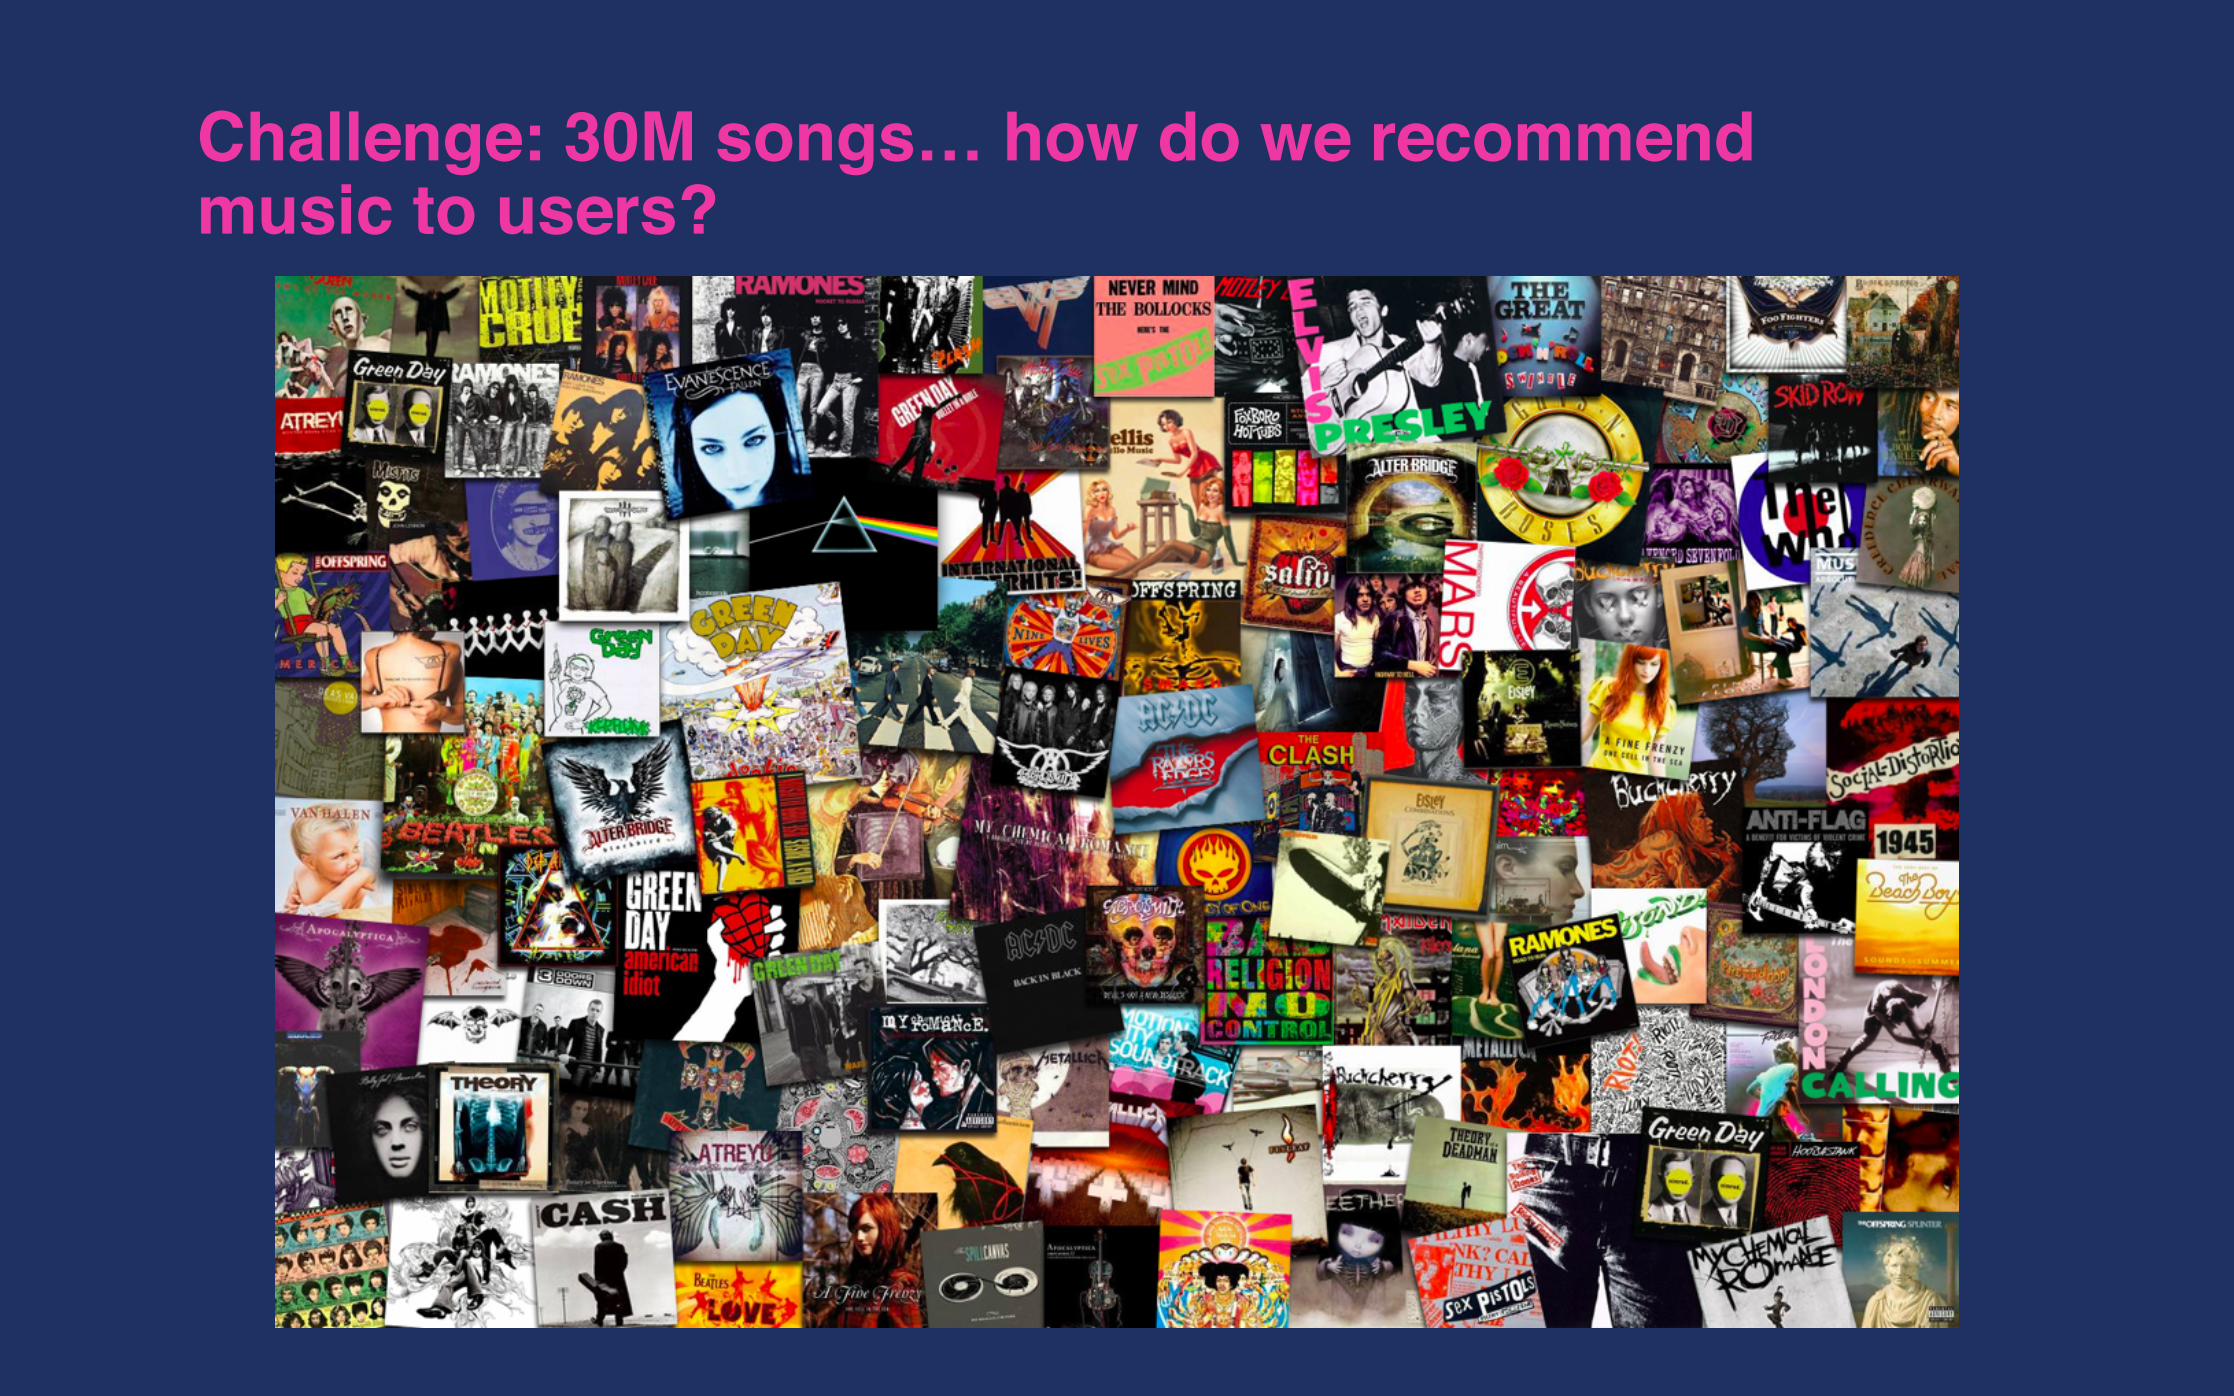
Challenge: 30M songs… how do we recommend music to users?
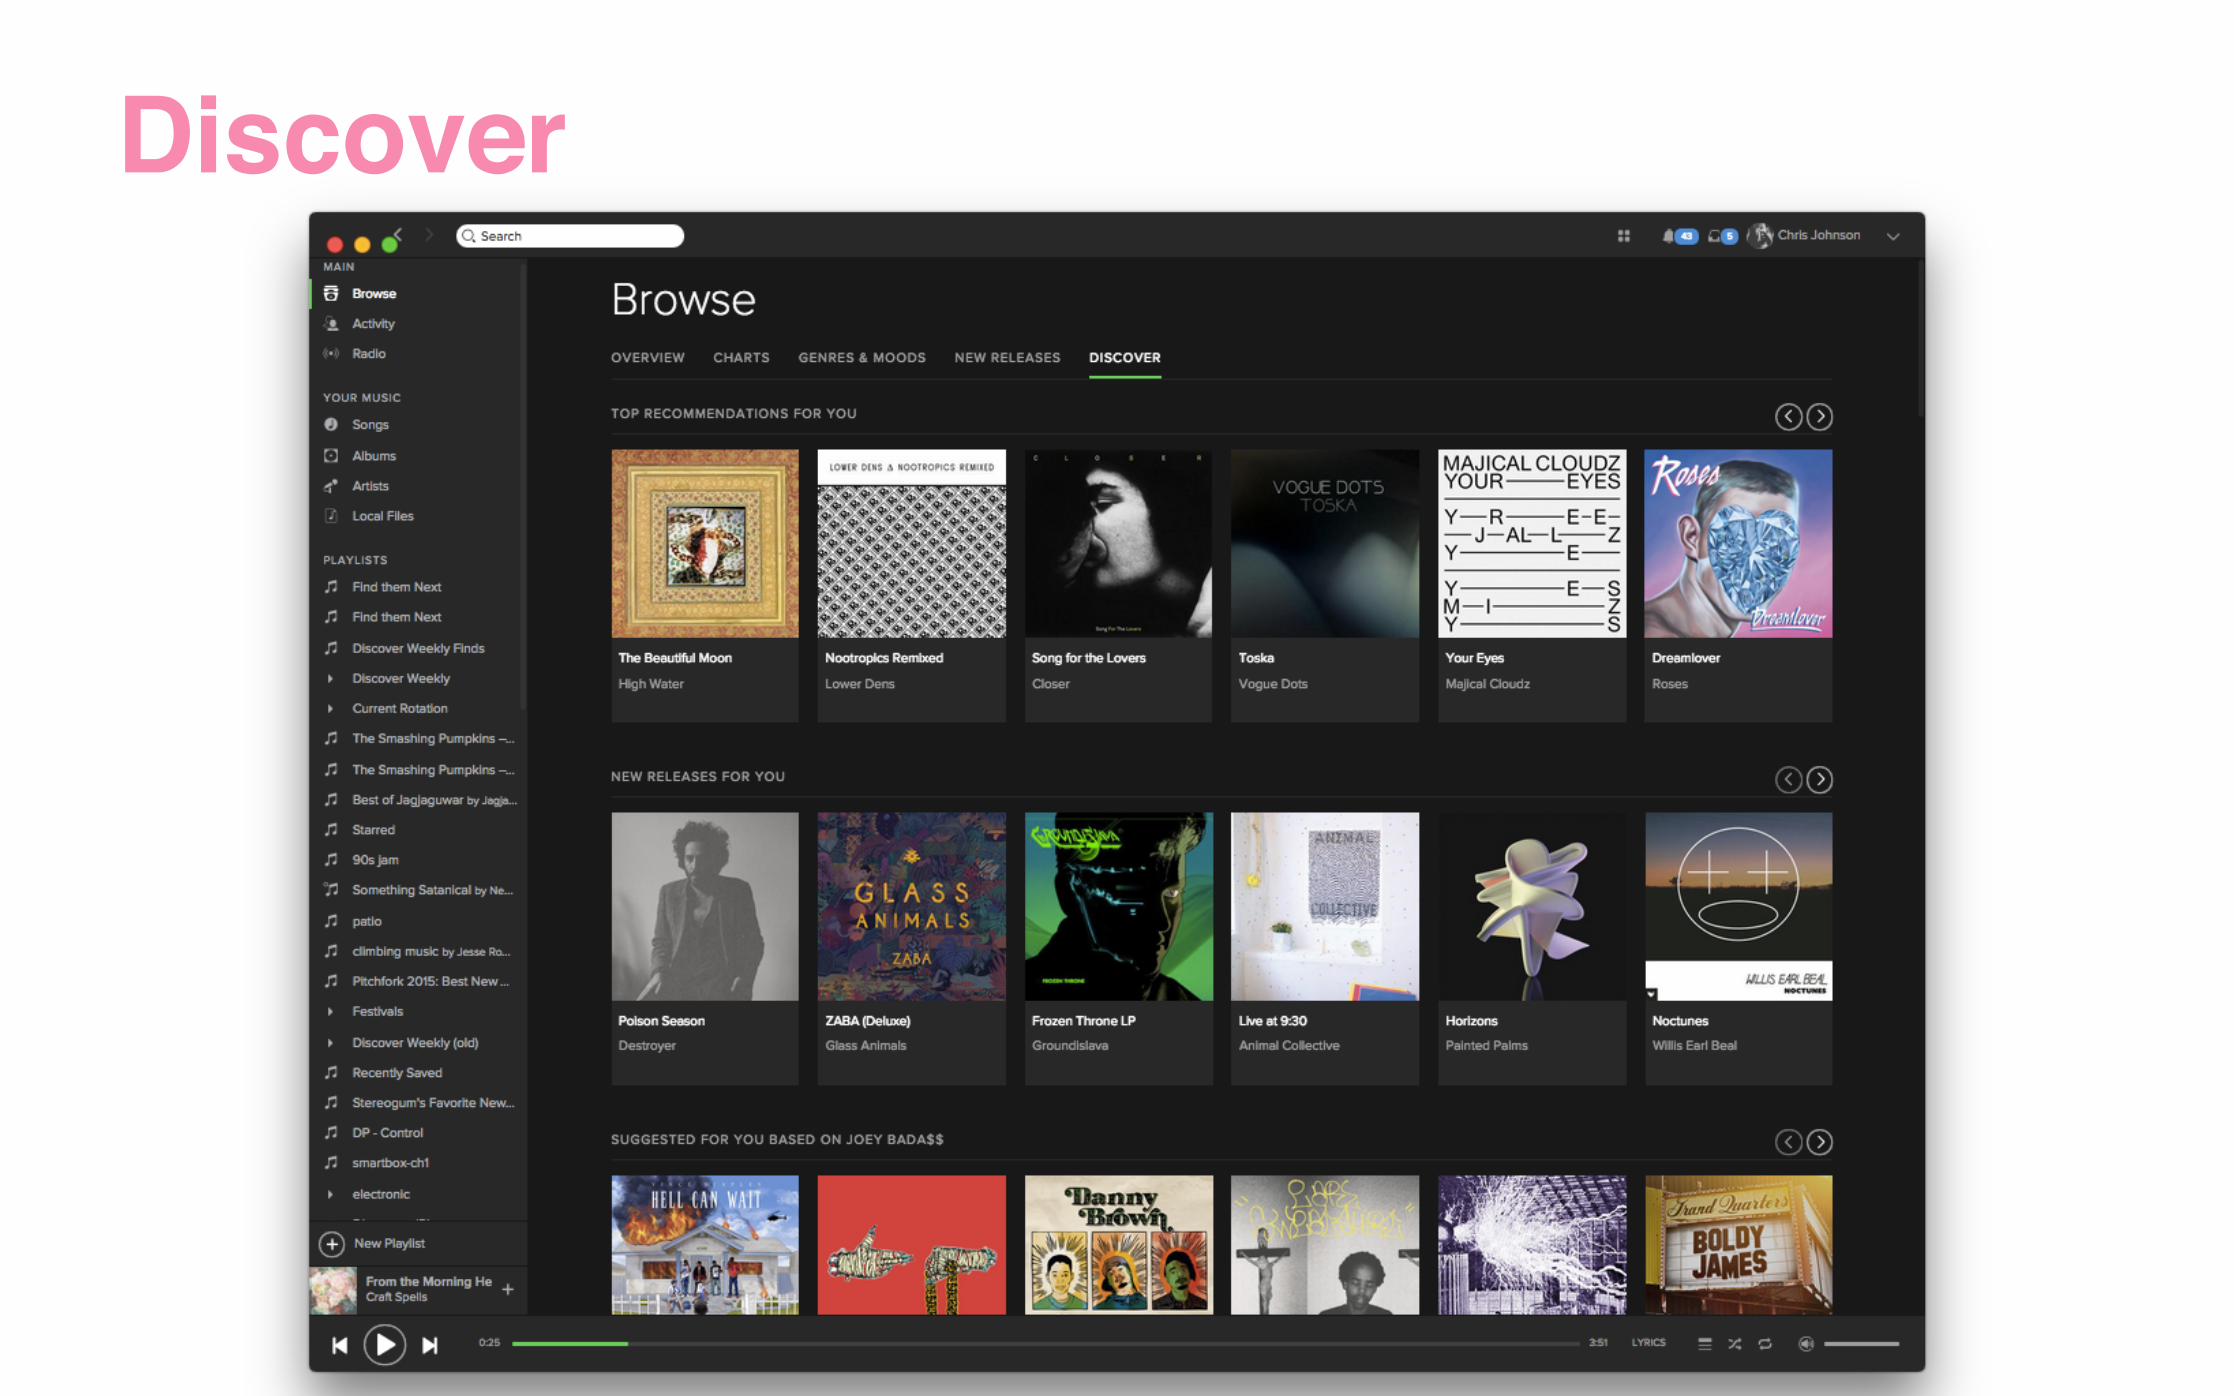
Discover
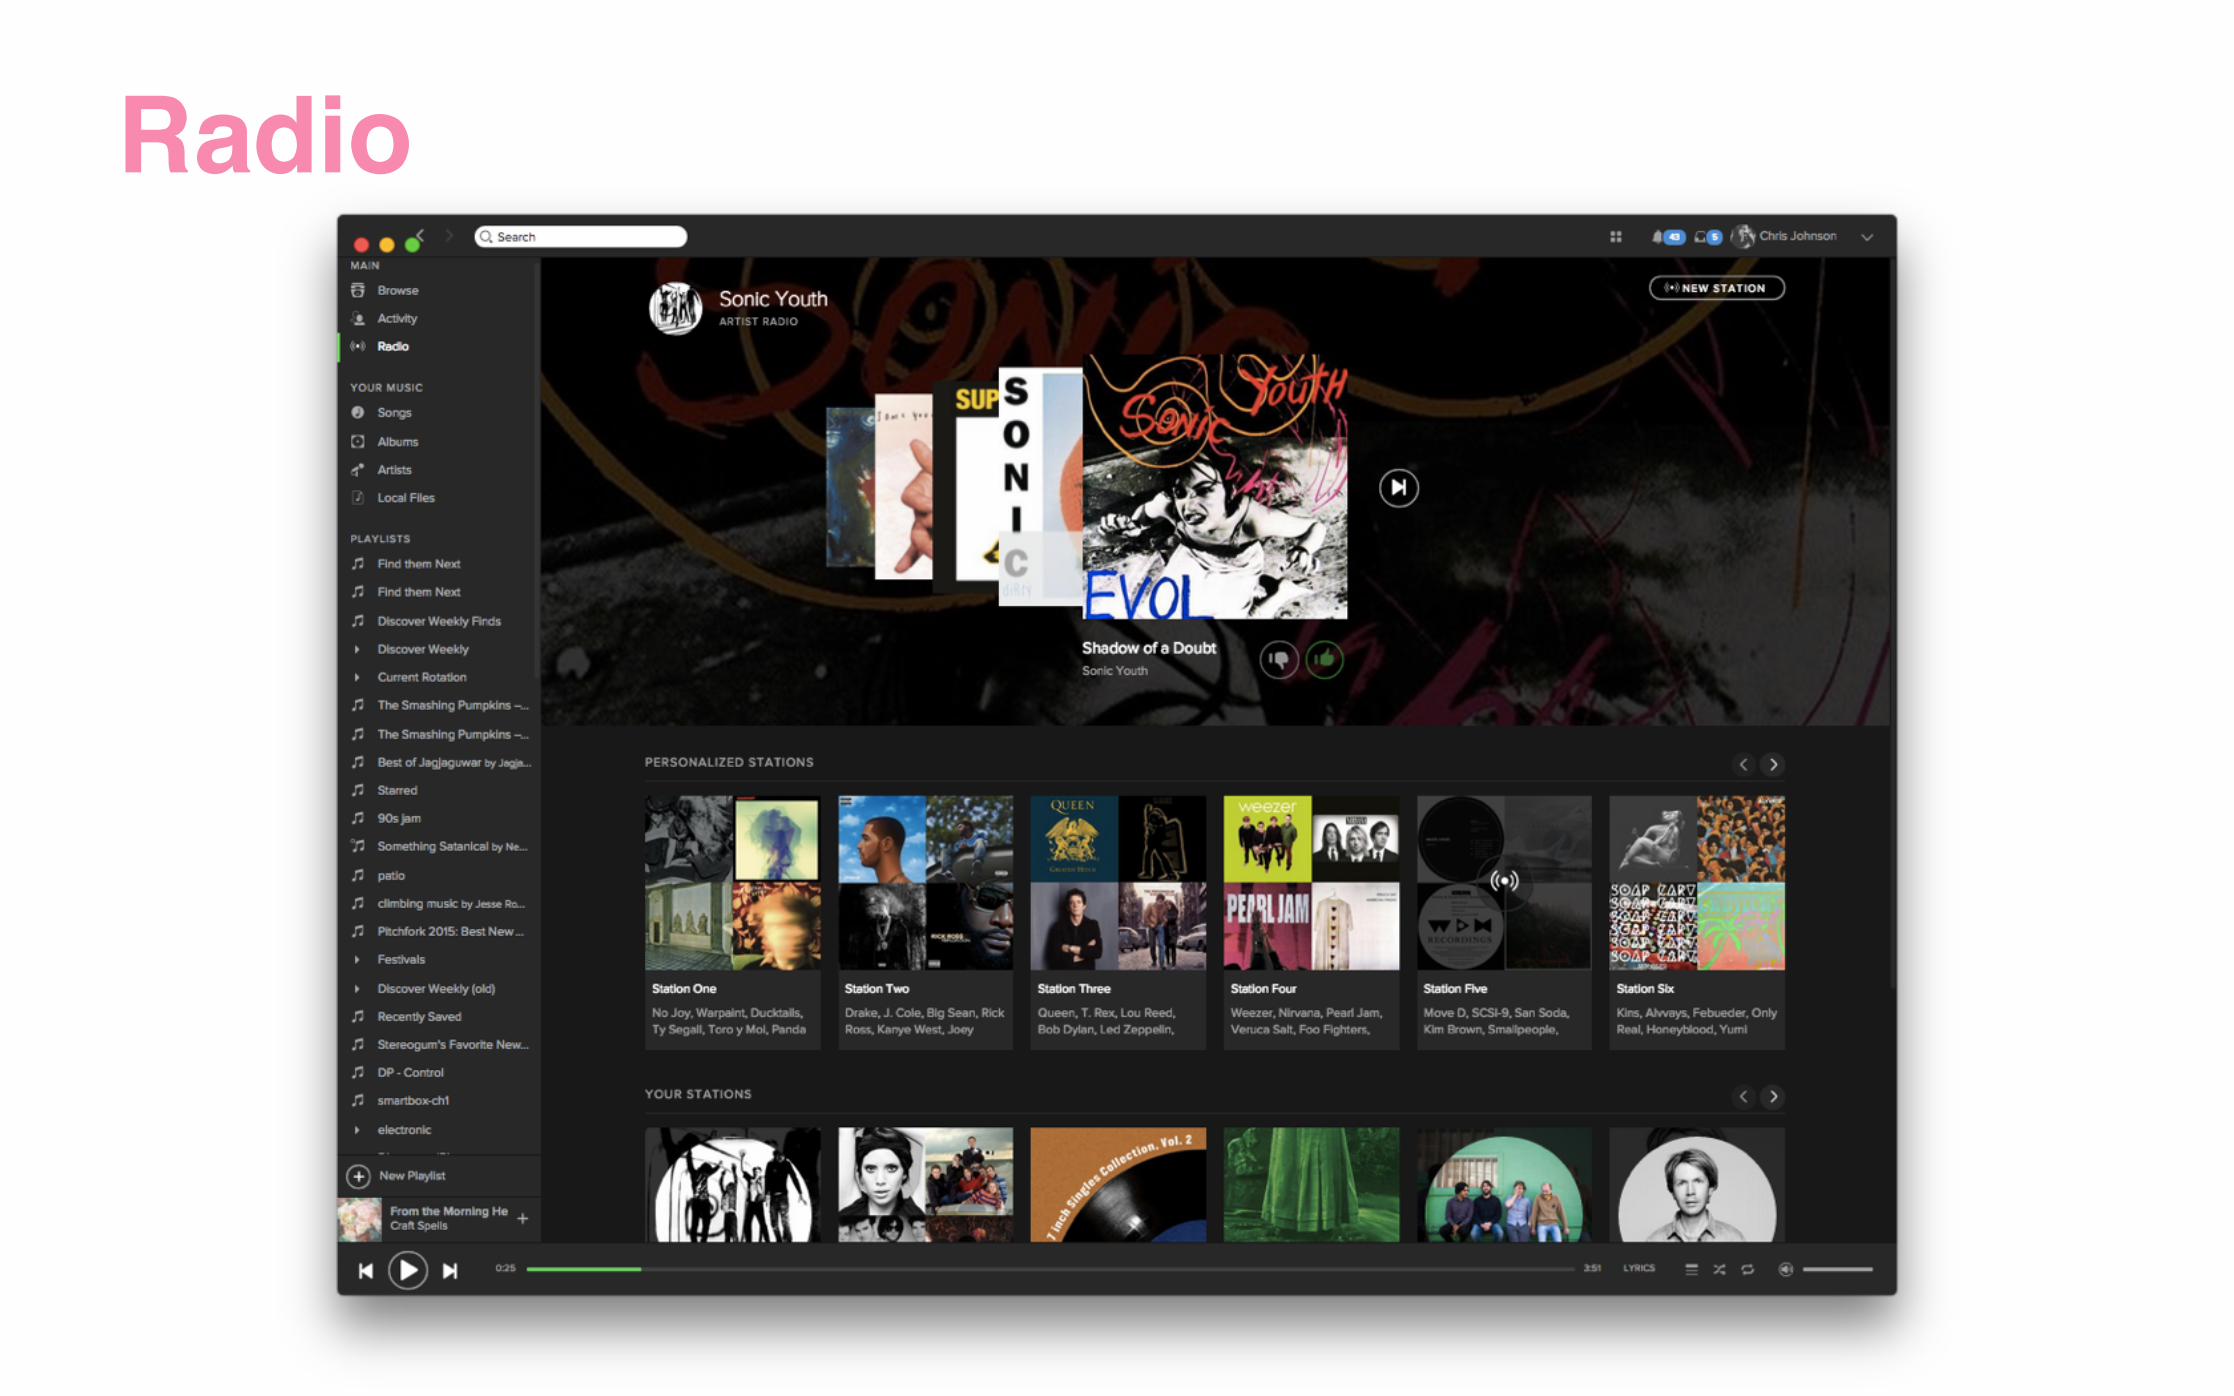
Radio
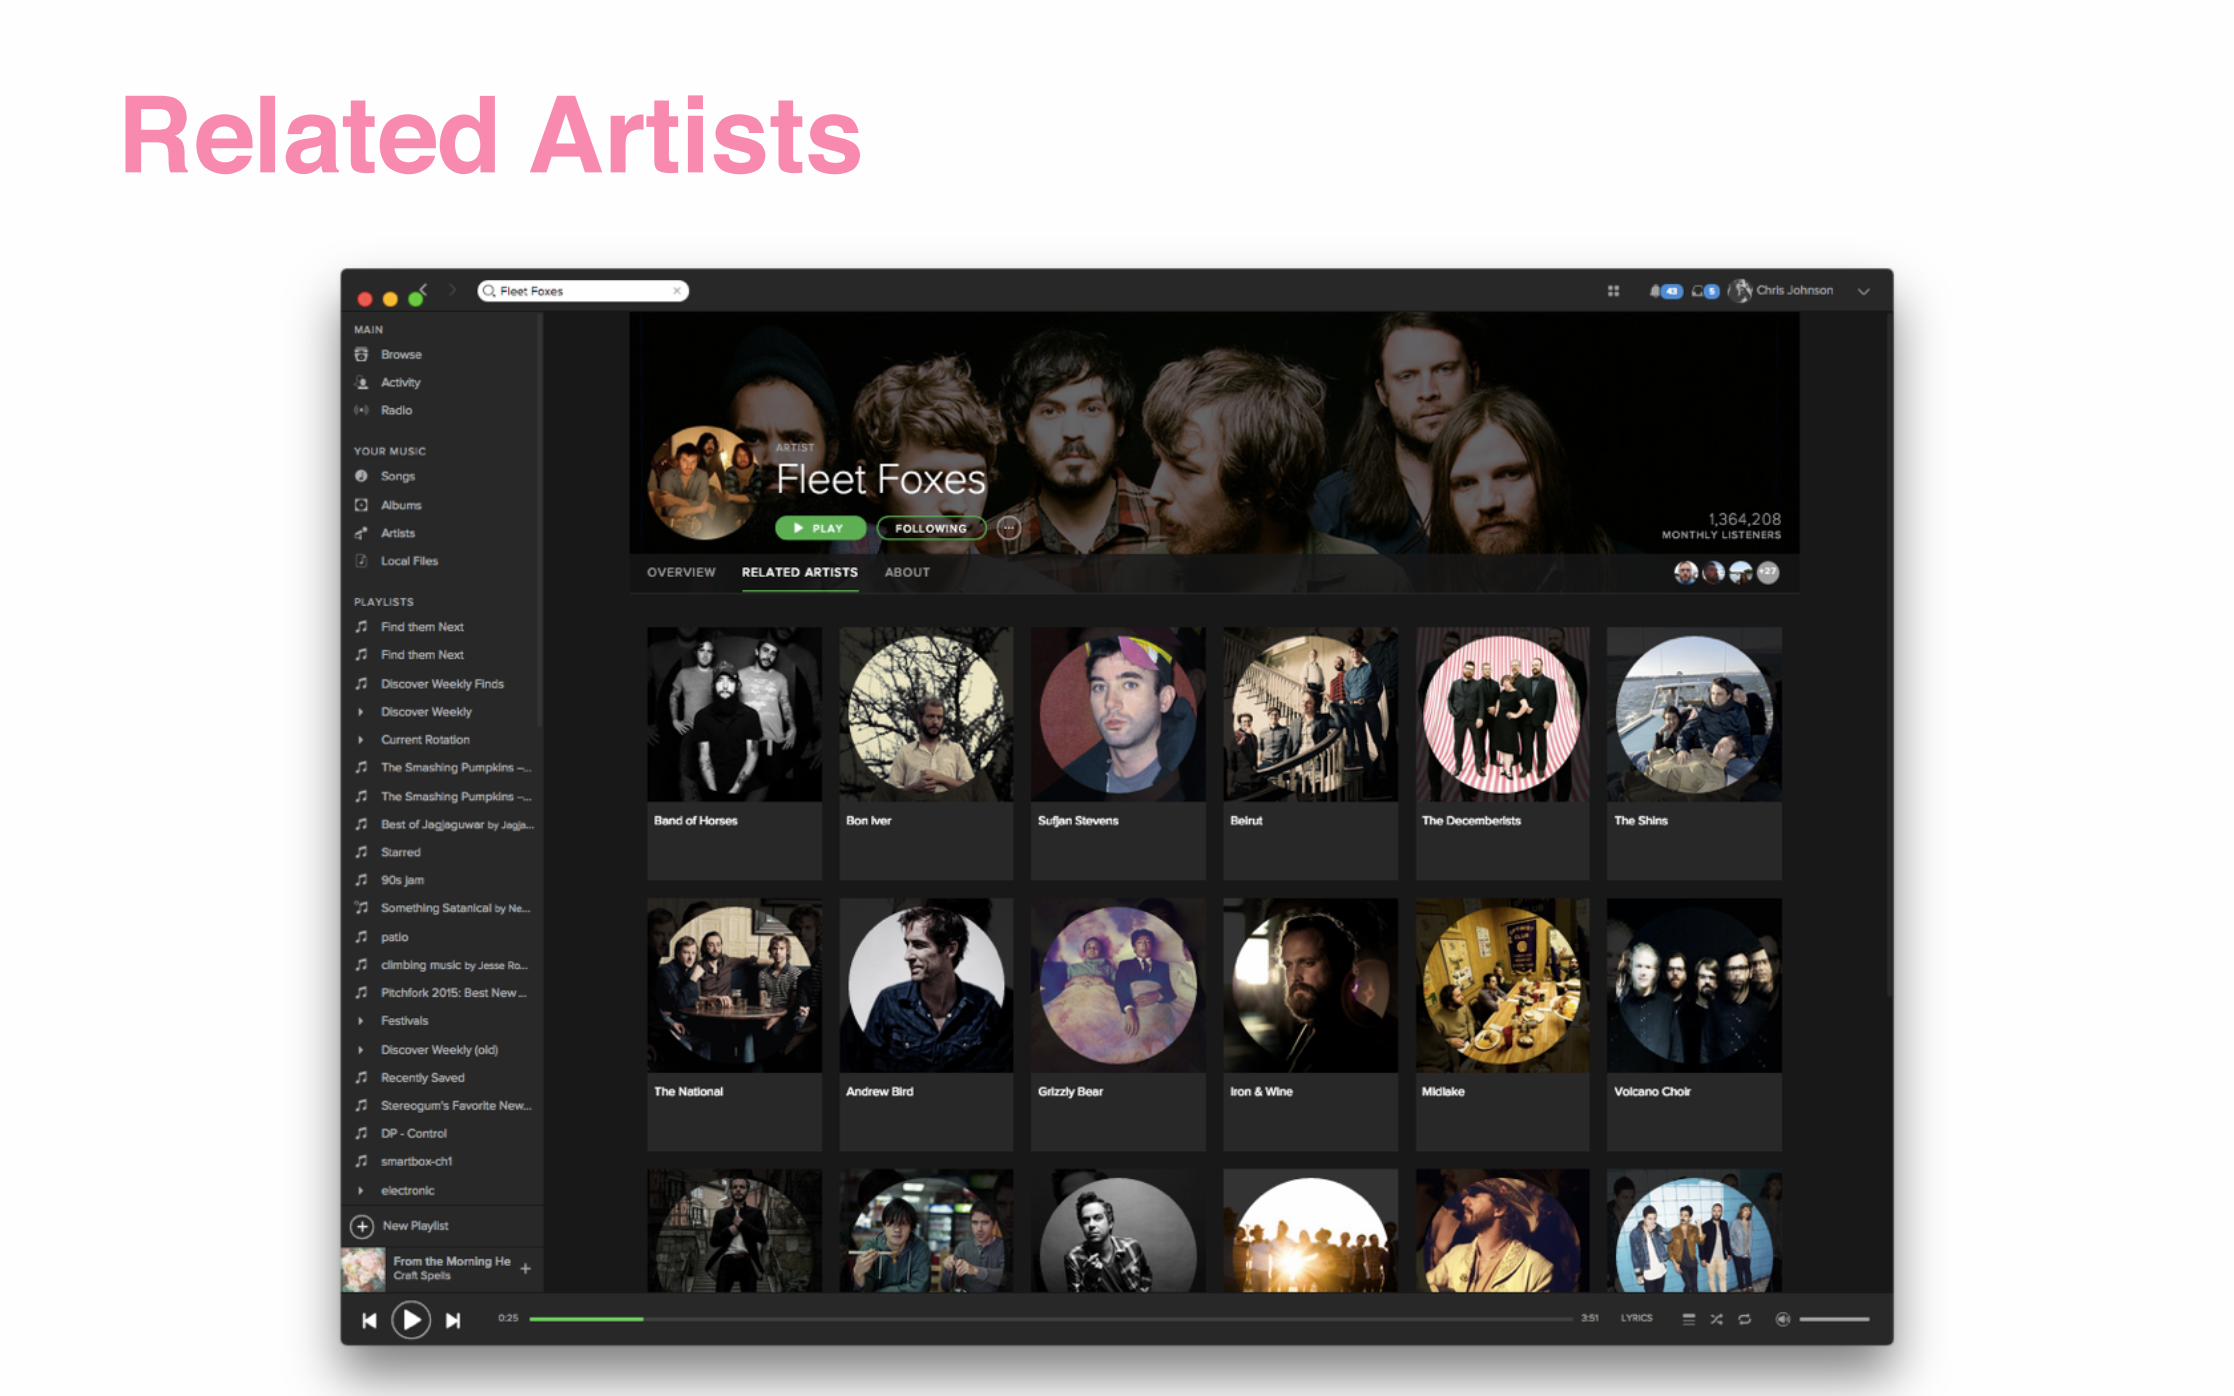
Related Artists
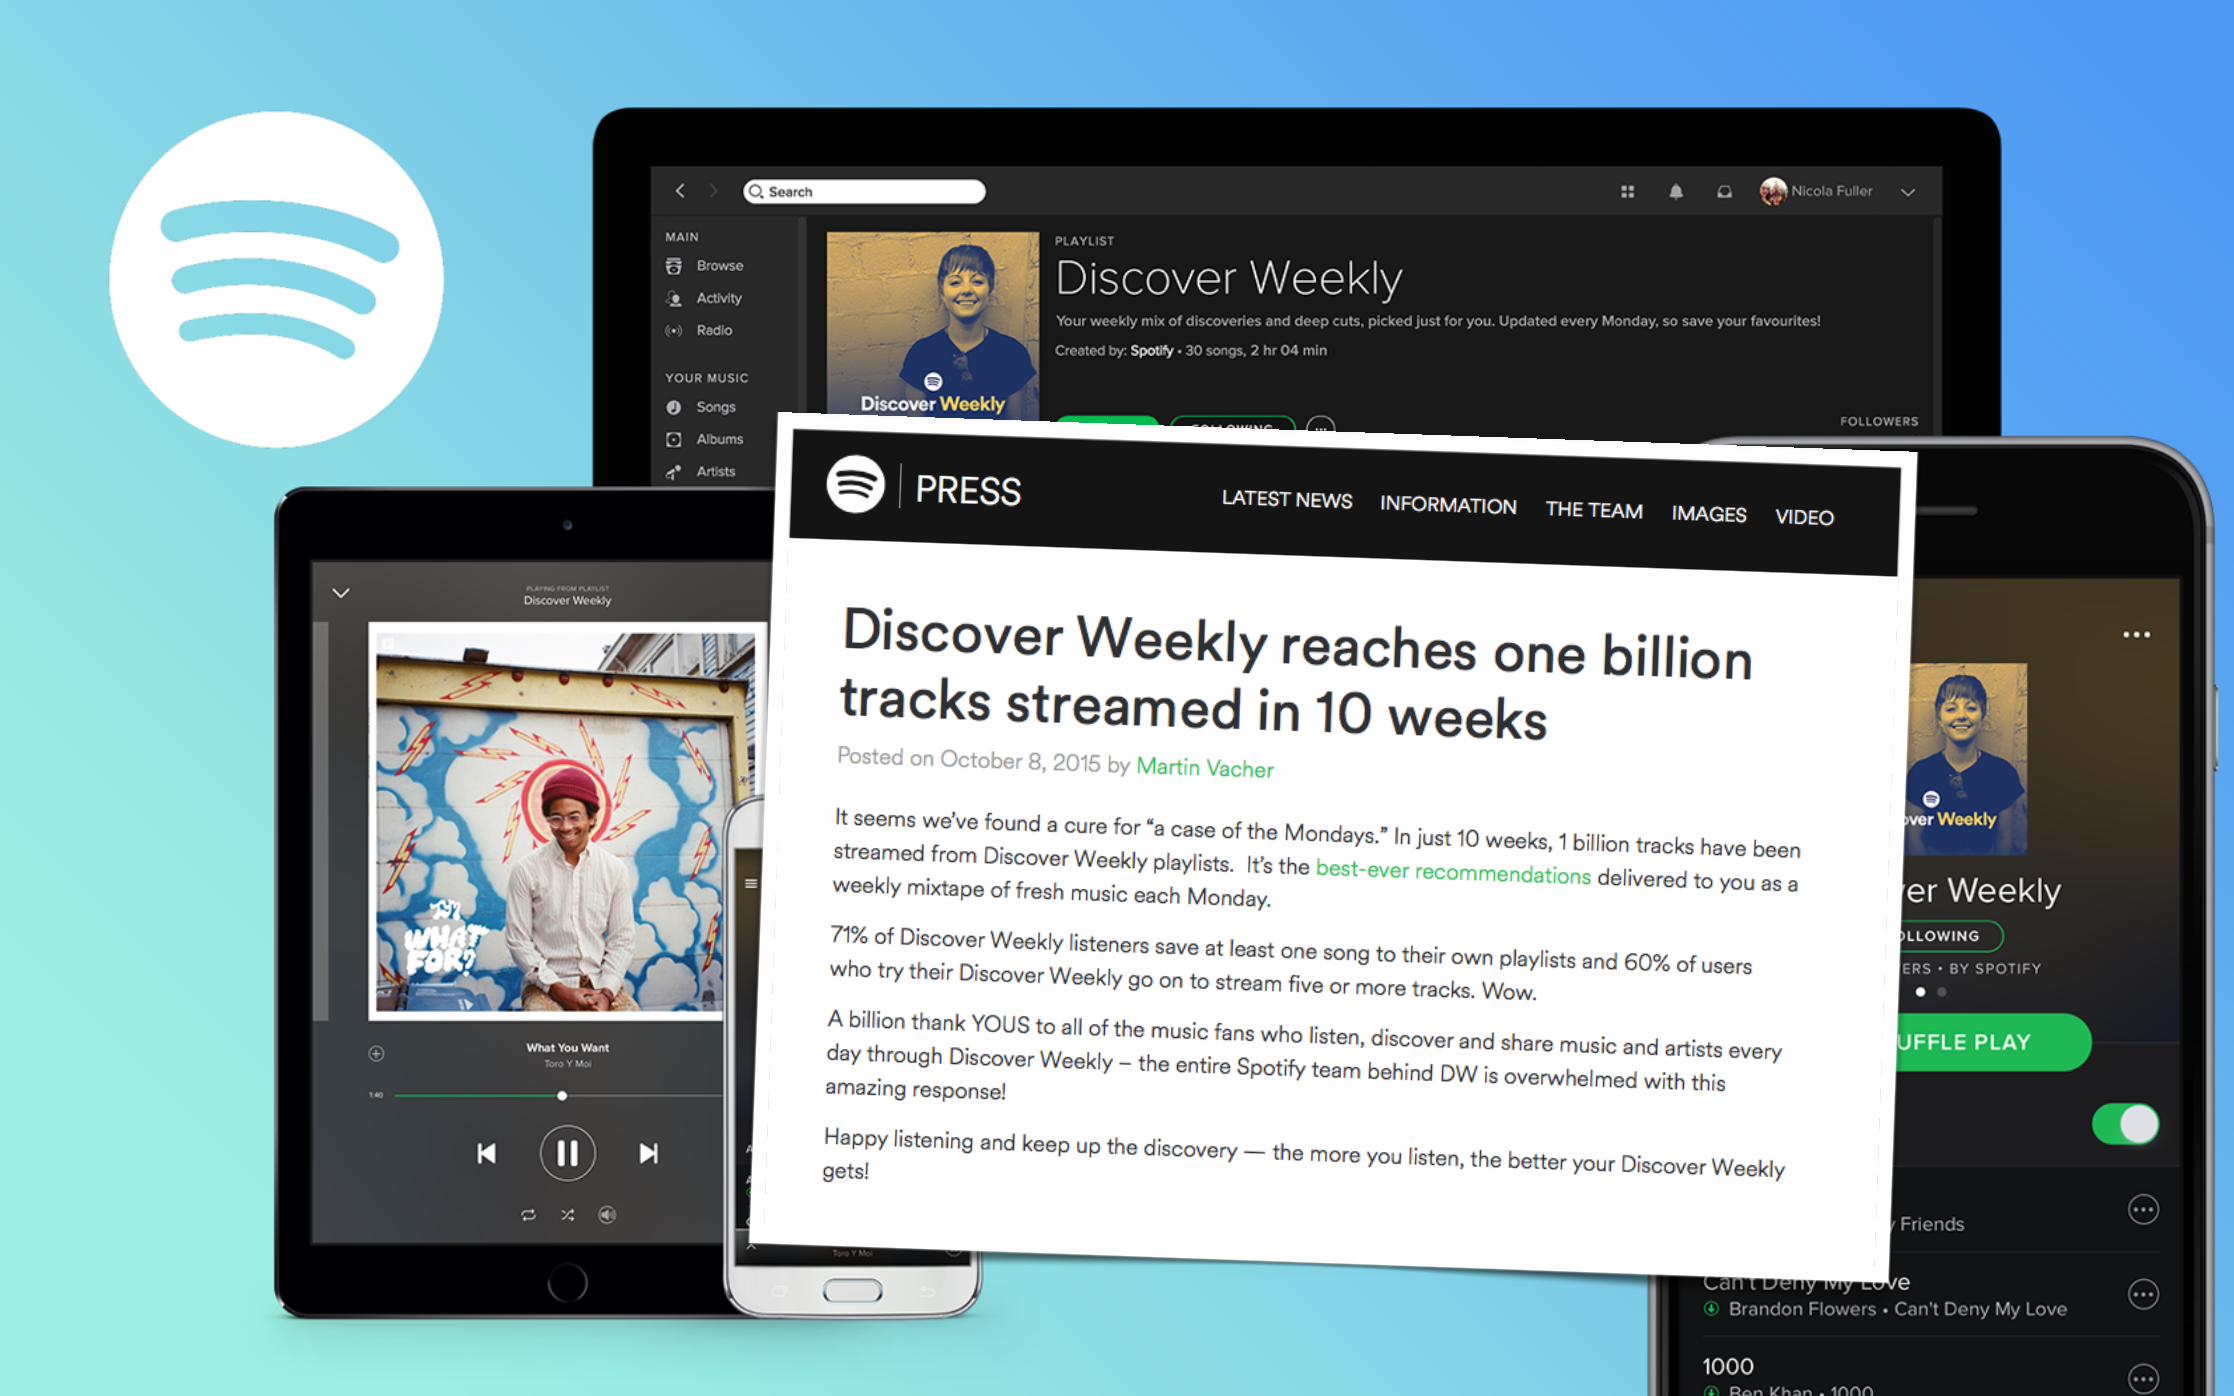
Discover Weekly
• Started in 2006, now available in 58 markets• 75+ Million active users, 20 Million paying subscribers• 30+ Million songs, 20,000 new songs added per day• 1.5 Billion user generated playlists• 1 TB user data logged per day• 1,700 node Hadoop cluster • 10,000+ Hadoop jobs run daily

The Road to Discover Weekly
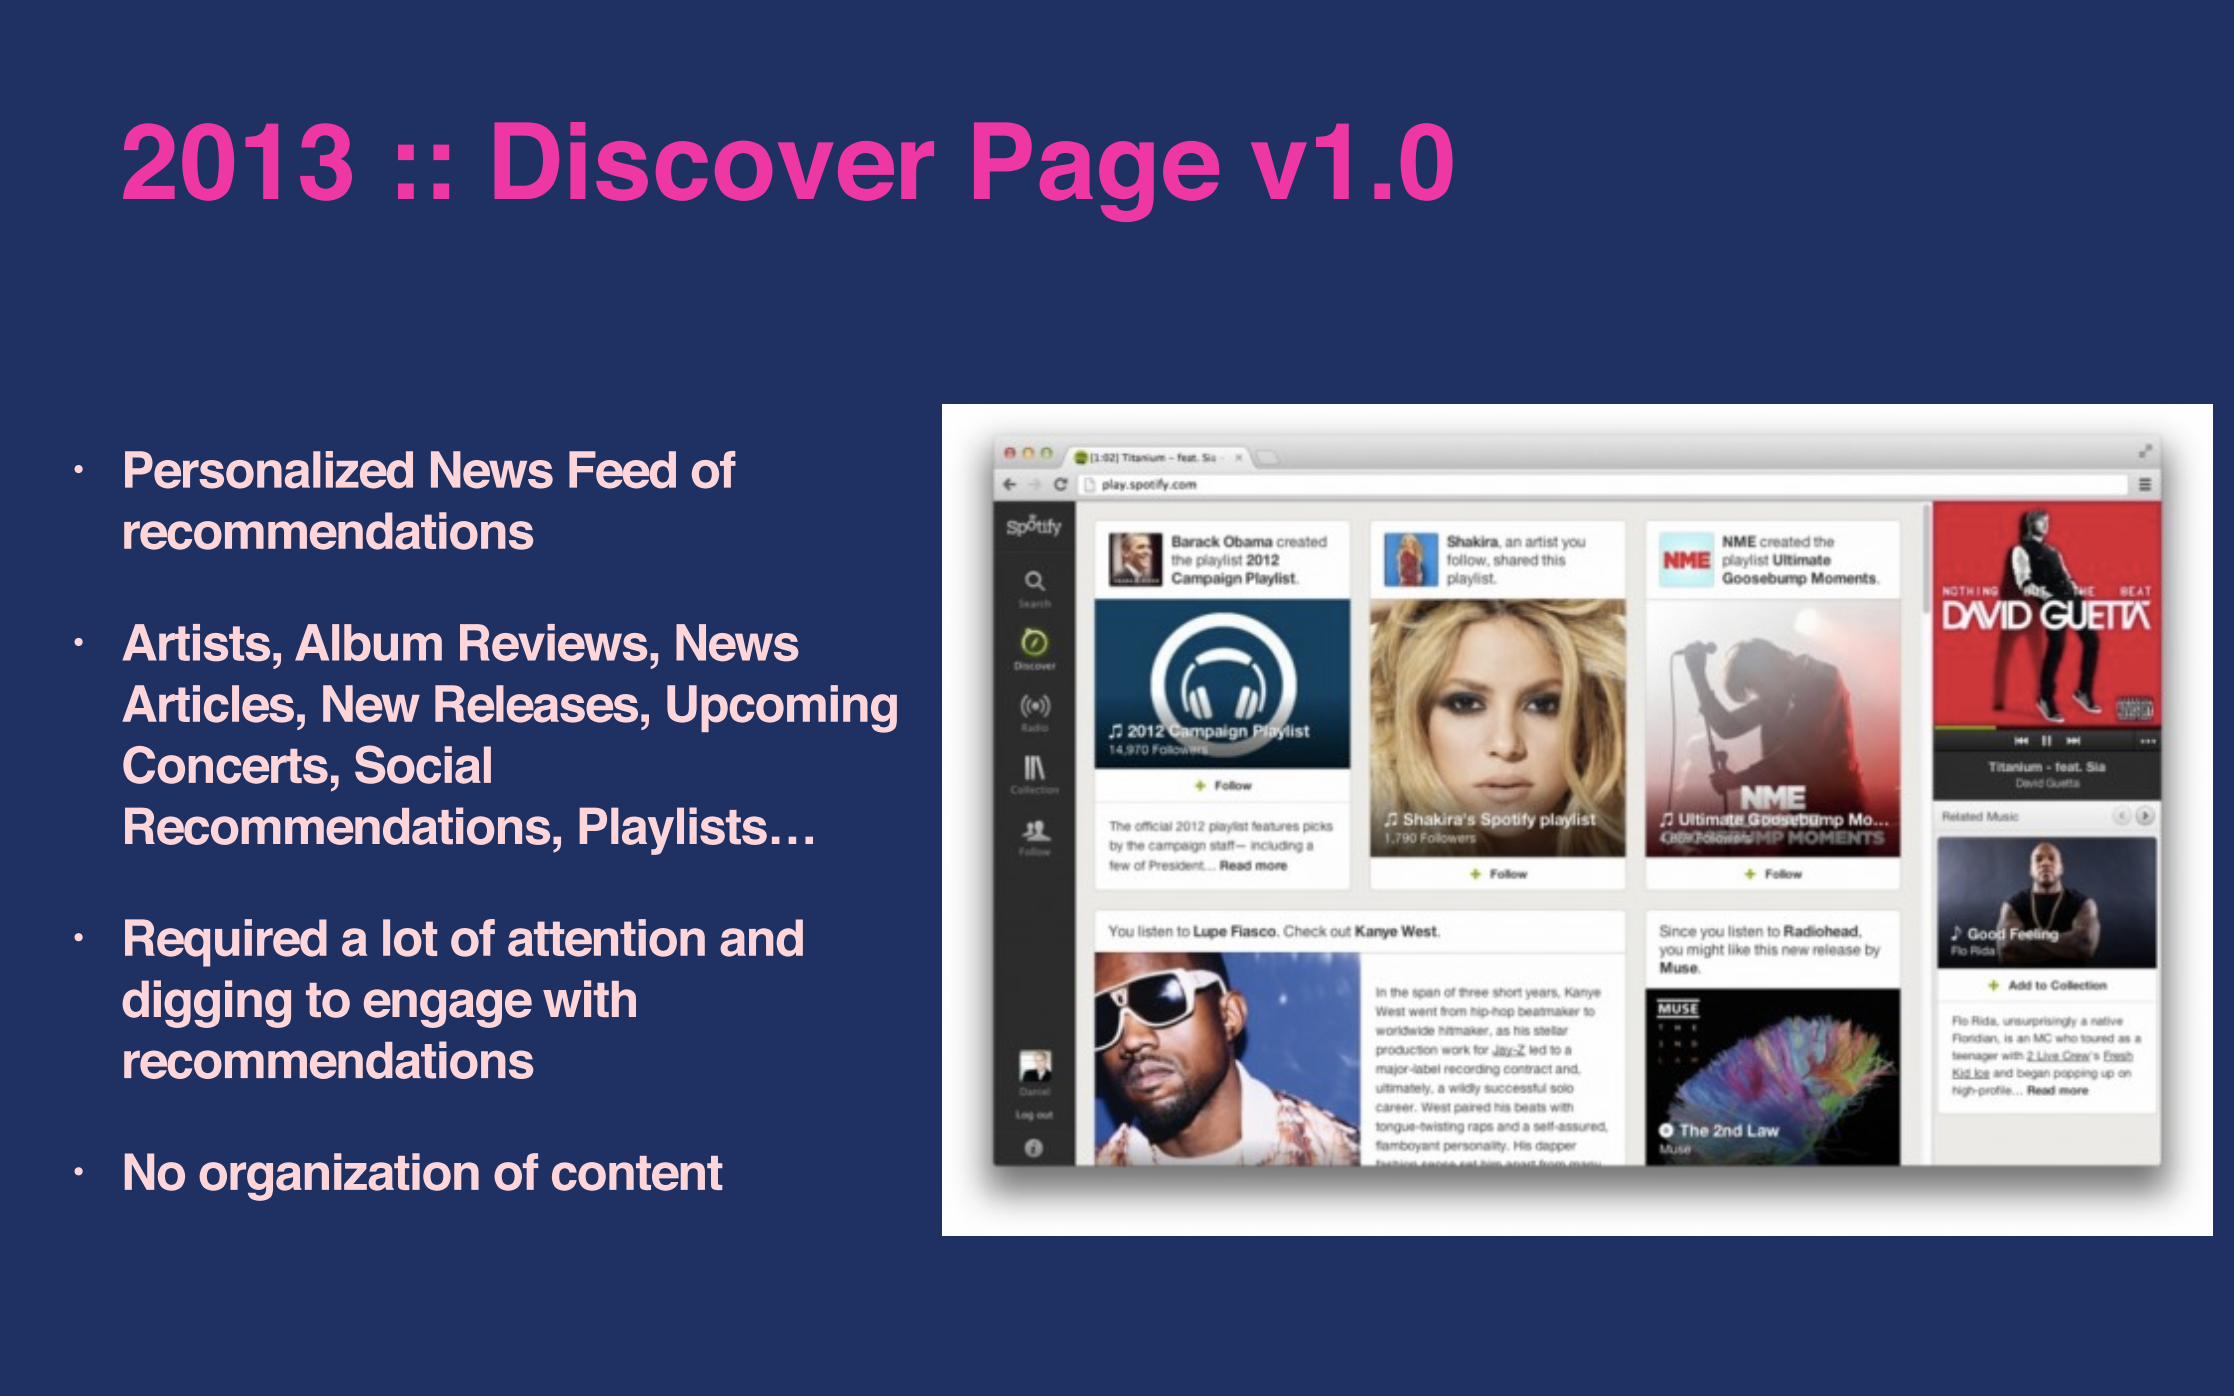
2013 :: Discover Page v1.0
• Personalized News Feed of recommendations
• Artists, Album Reviews, News Articles, New Releases, Upcoming Concerts, Social Recommendations, Playlists…
• Required a lot of attention and digging to engage with recommendations
• No organization of content
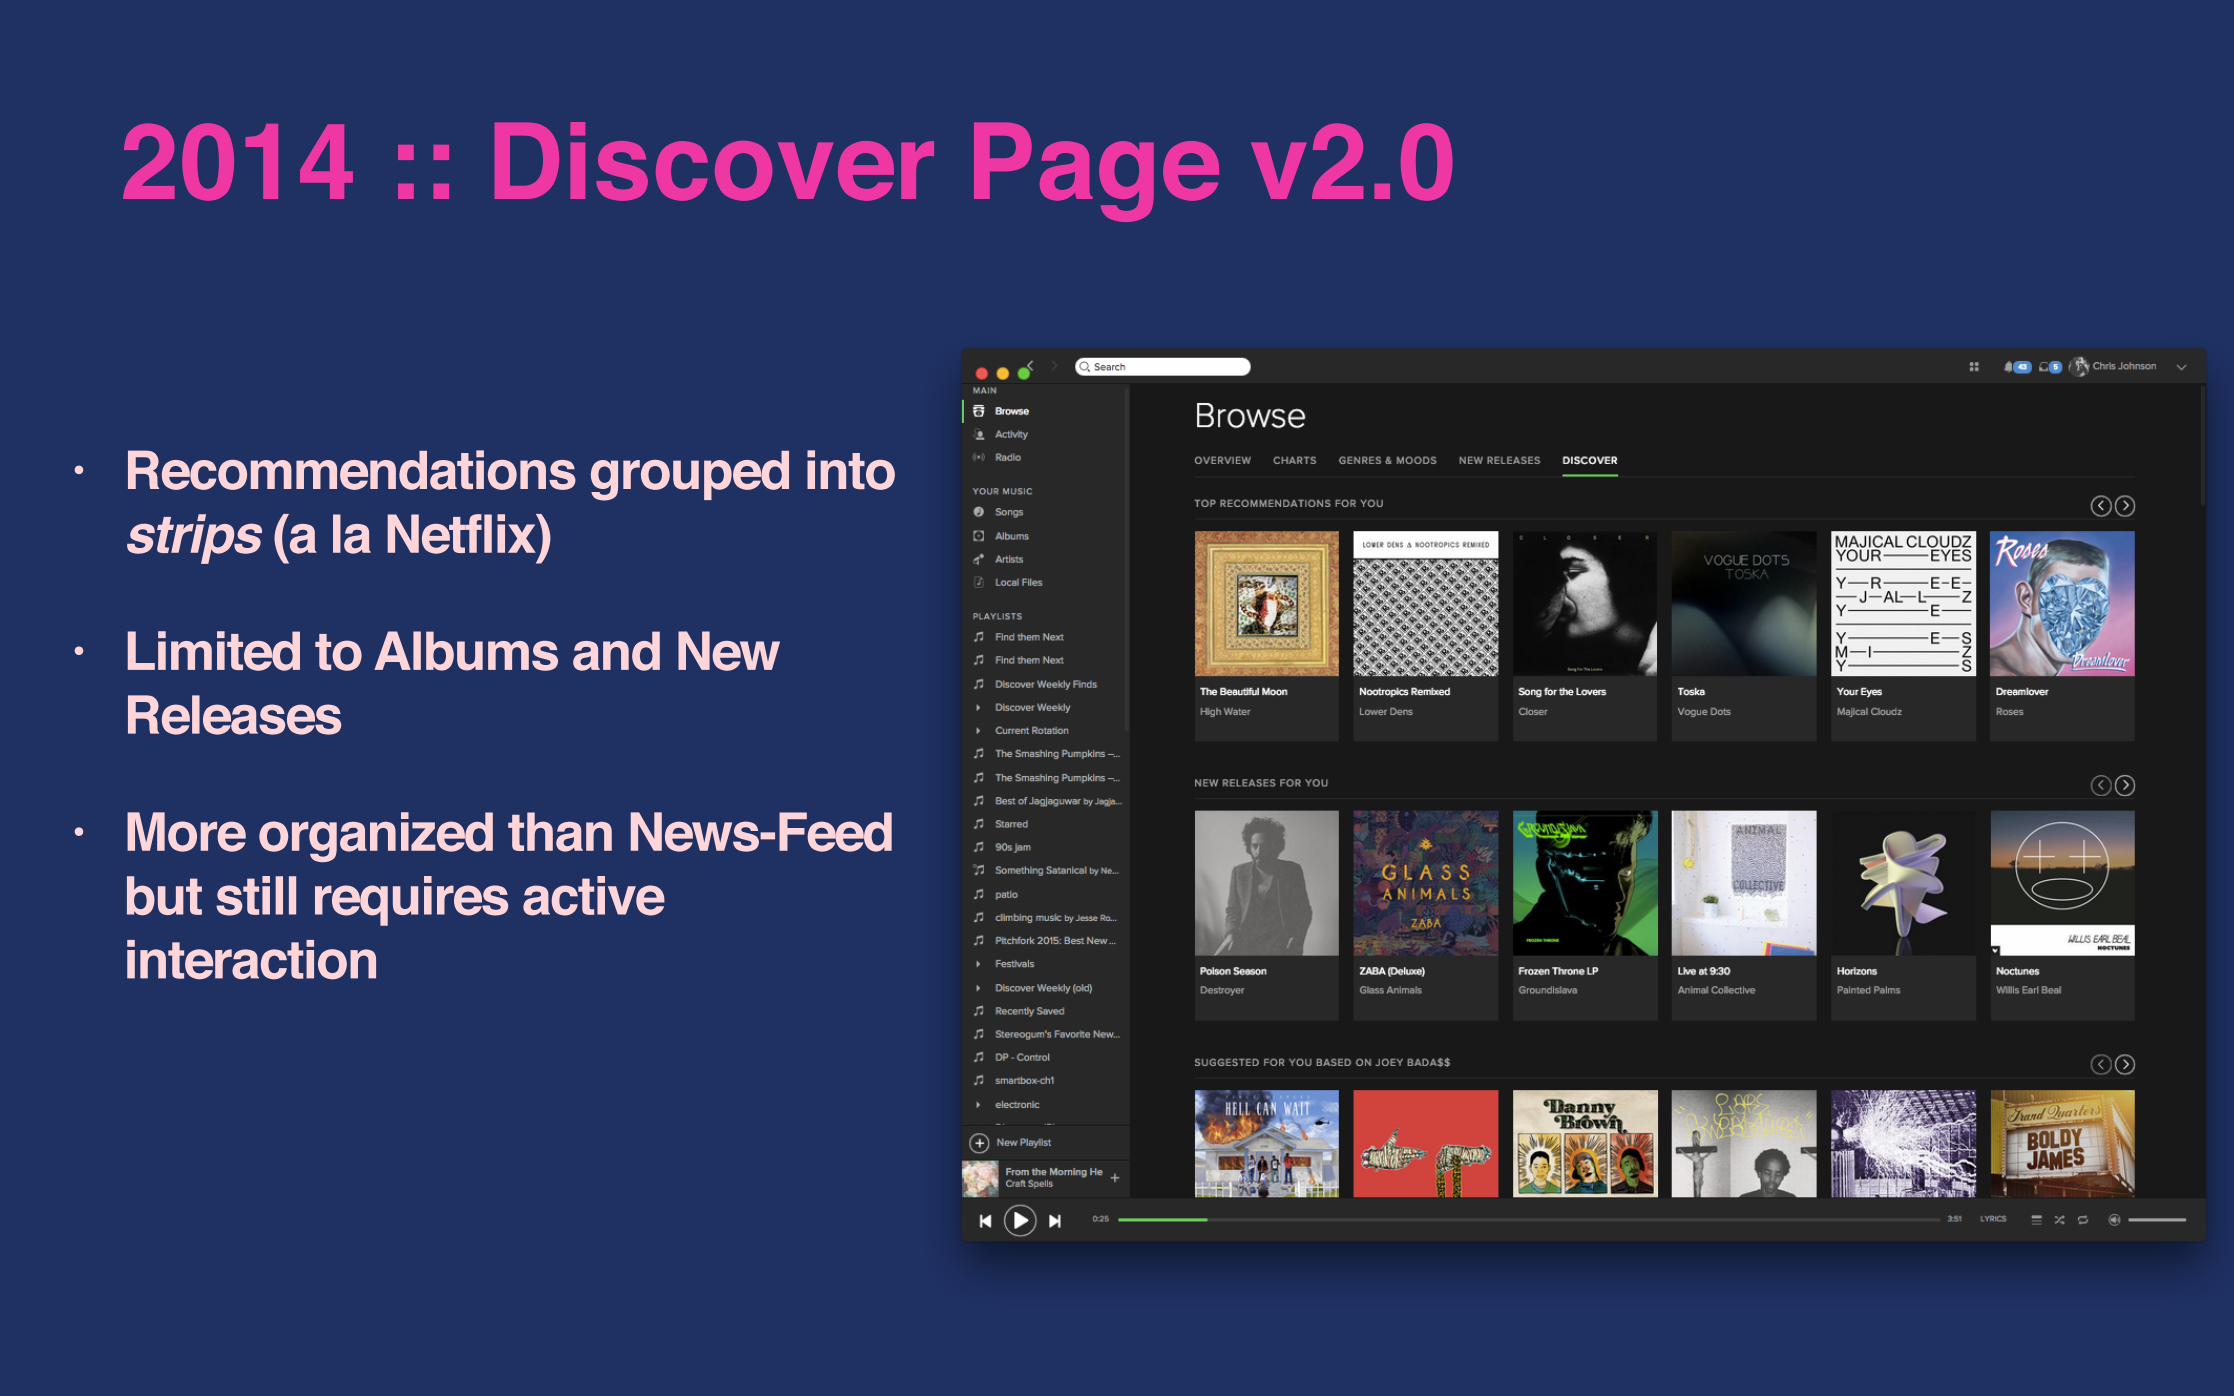
2014 :: Discover Page v2.0
• Recommendations grouped into strips (a la Netflix)
• Limited to Albums and New Releases
• More organized than News-Feed but still requires active interaction
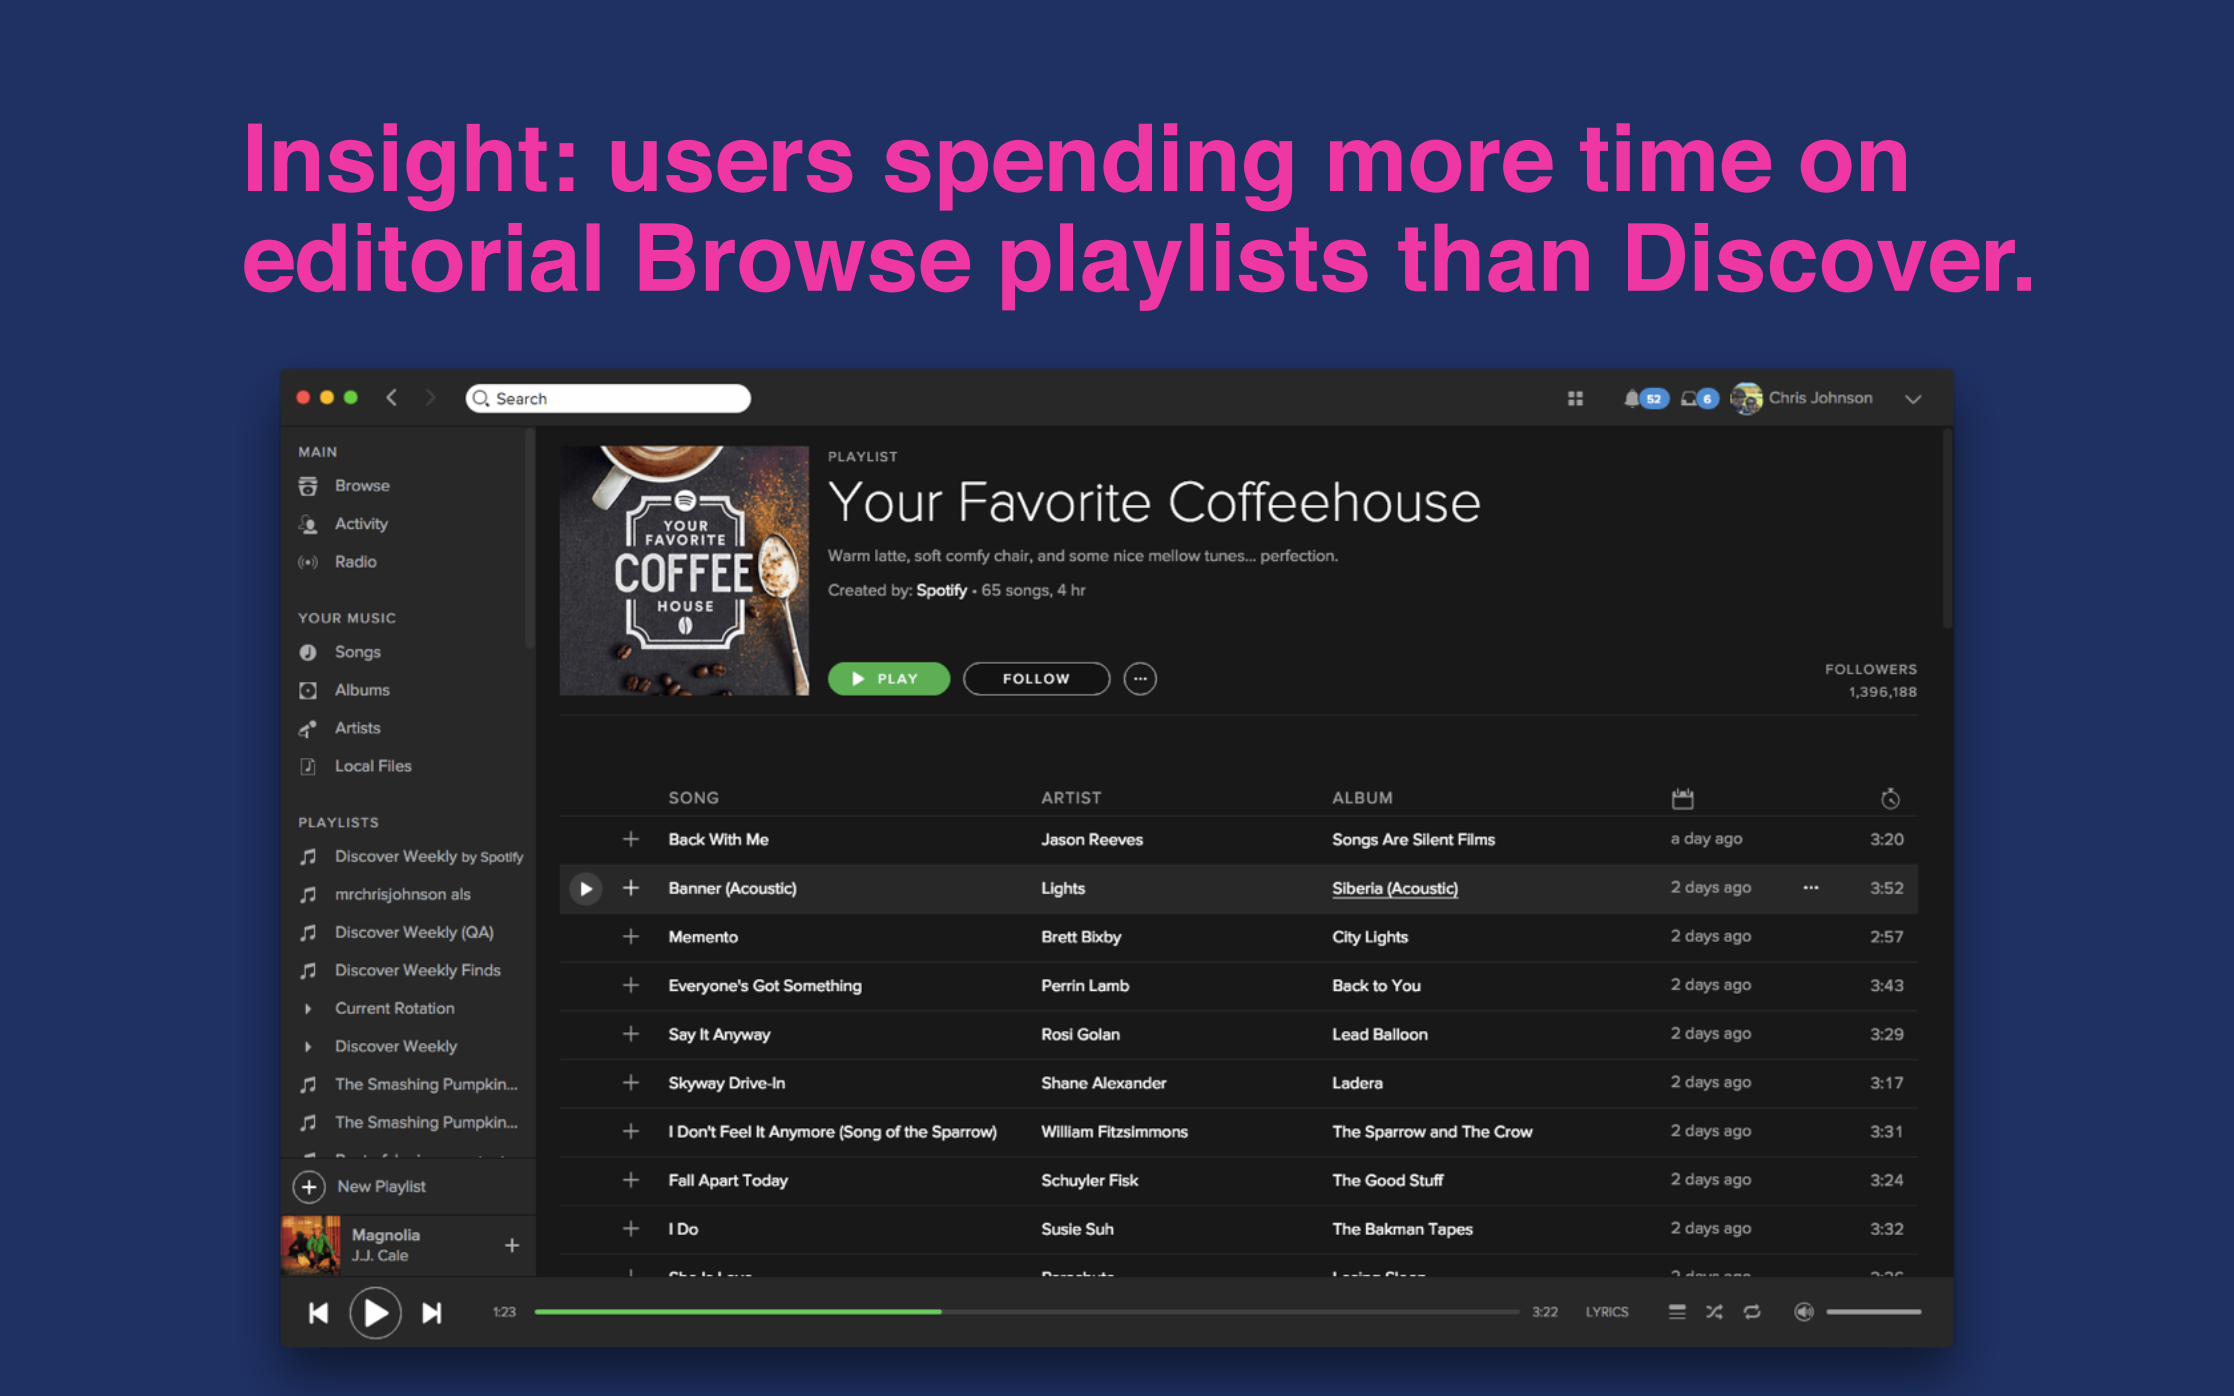
Insight: users spending more time on editorial Browse playlists than Discover.
Idea: combine the personalized experience of Discover with the lean-
back ease of Browse
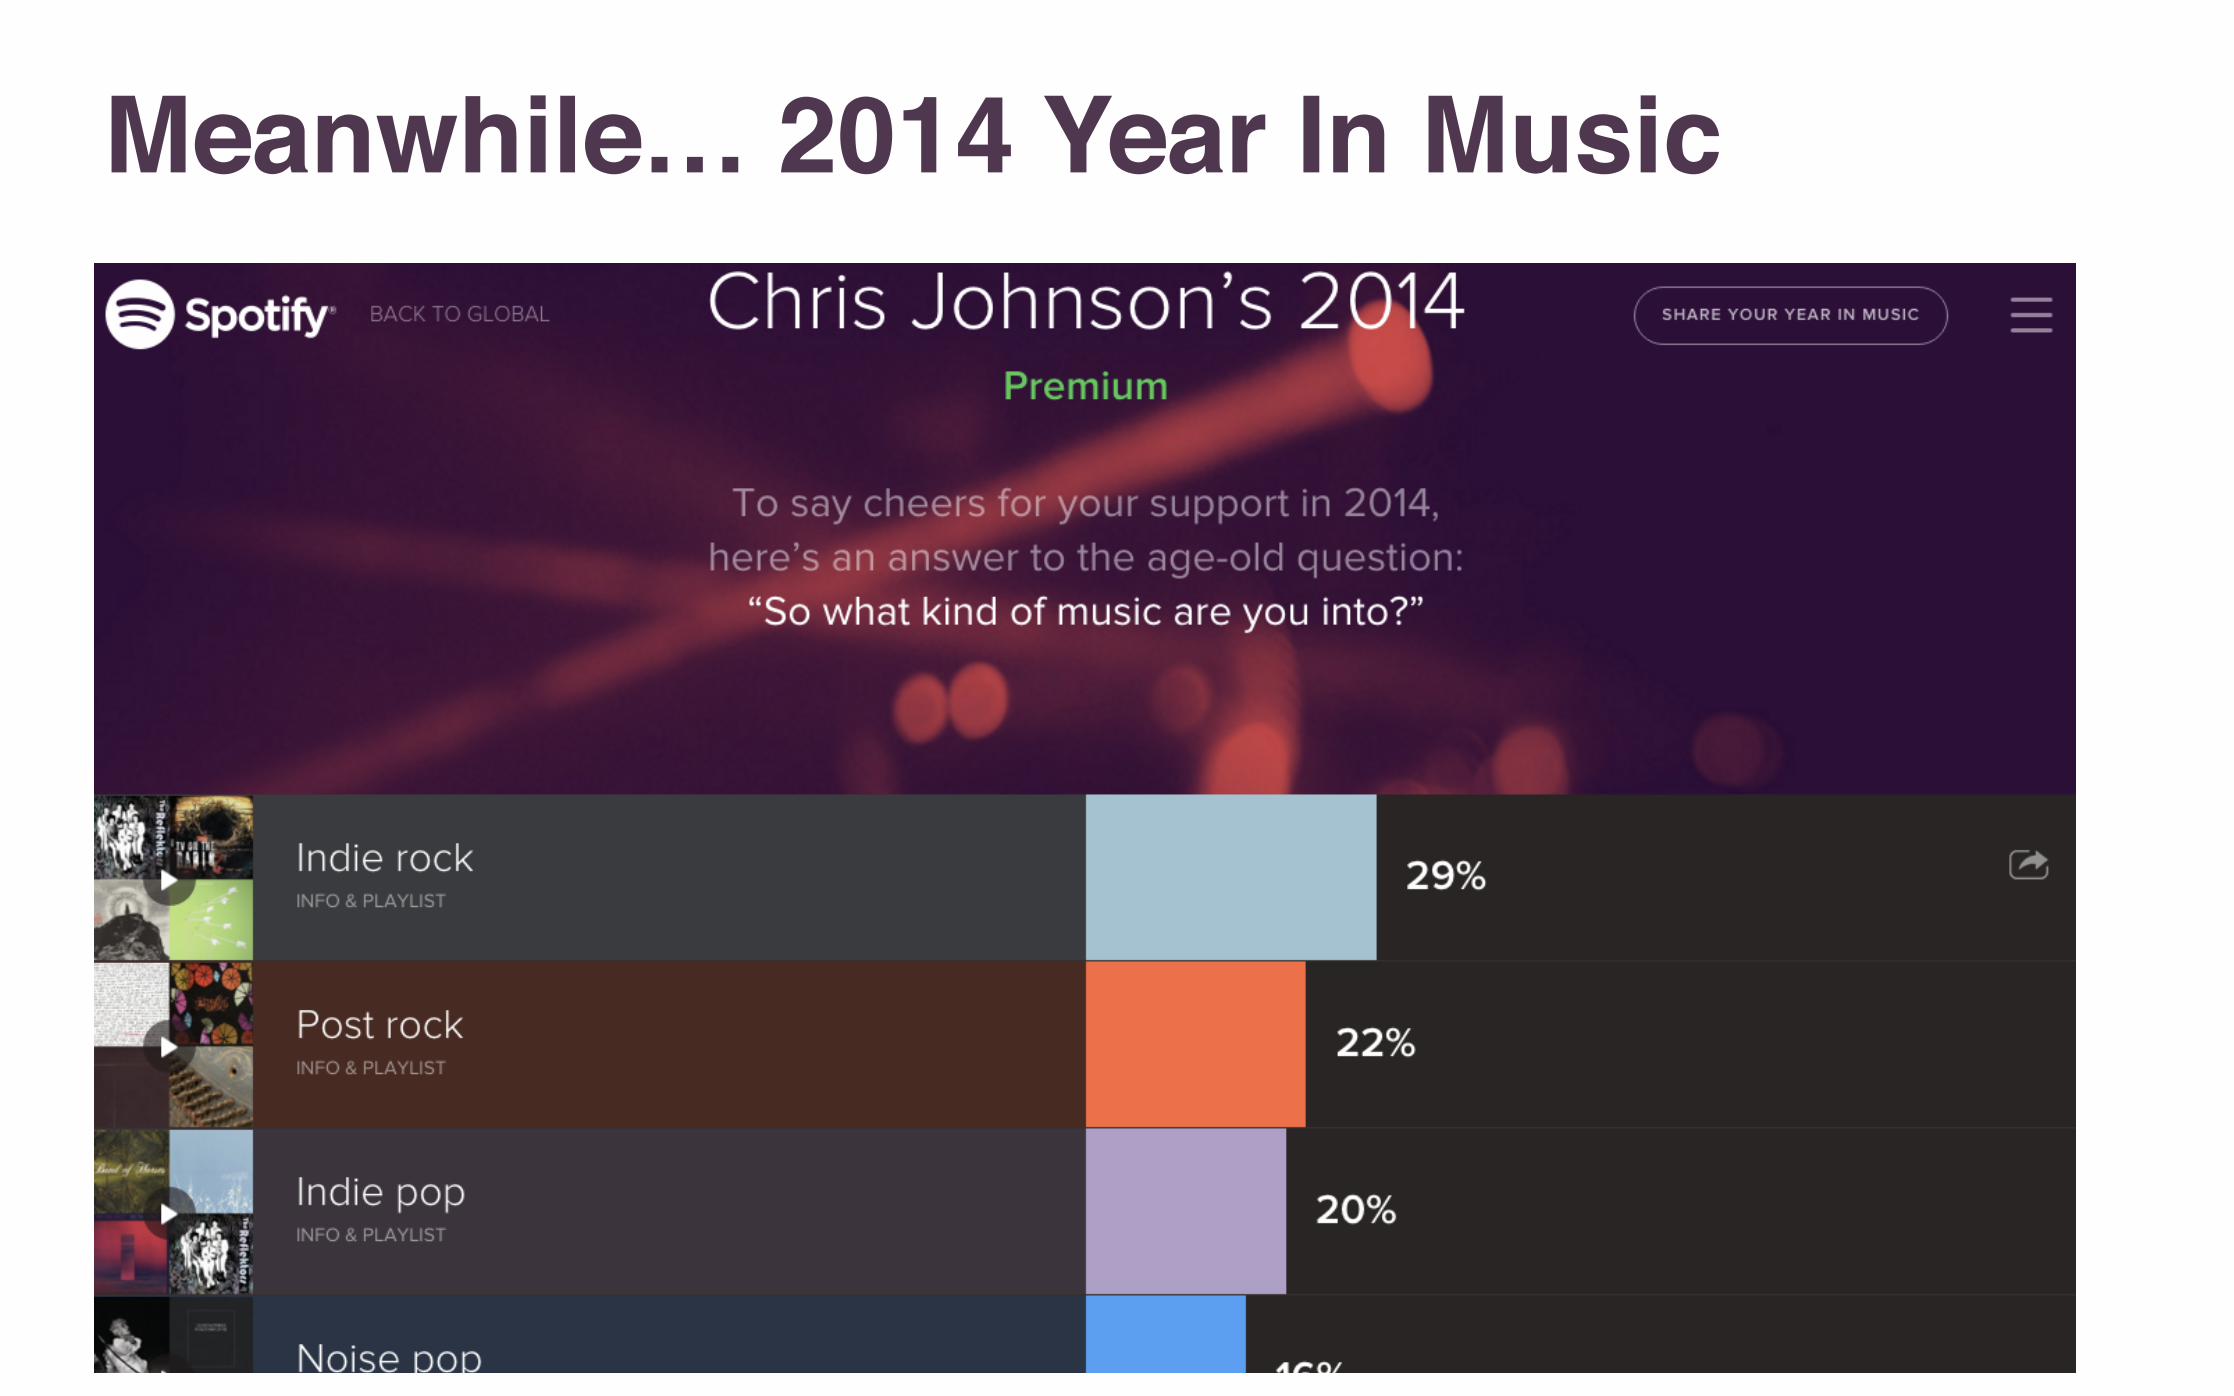
Meanwhile… 2014 Year In Music
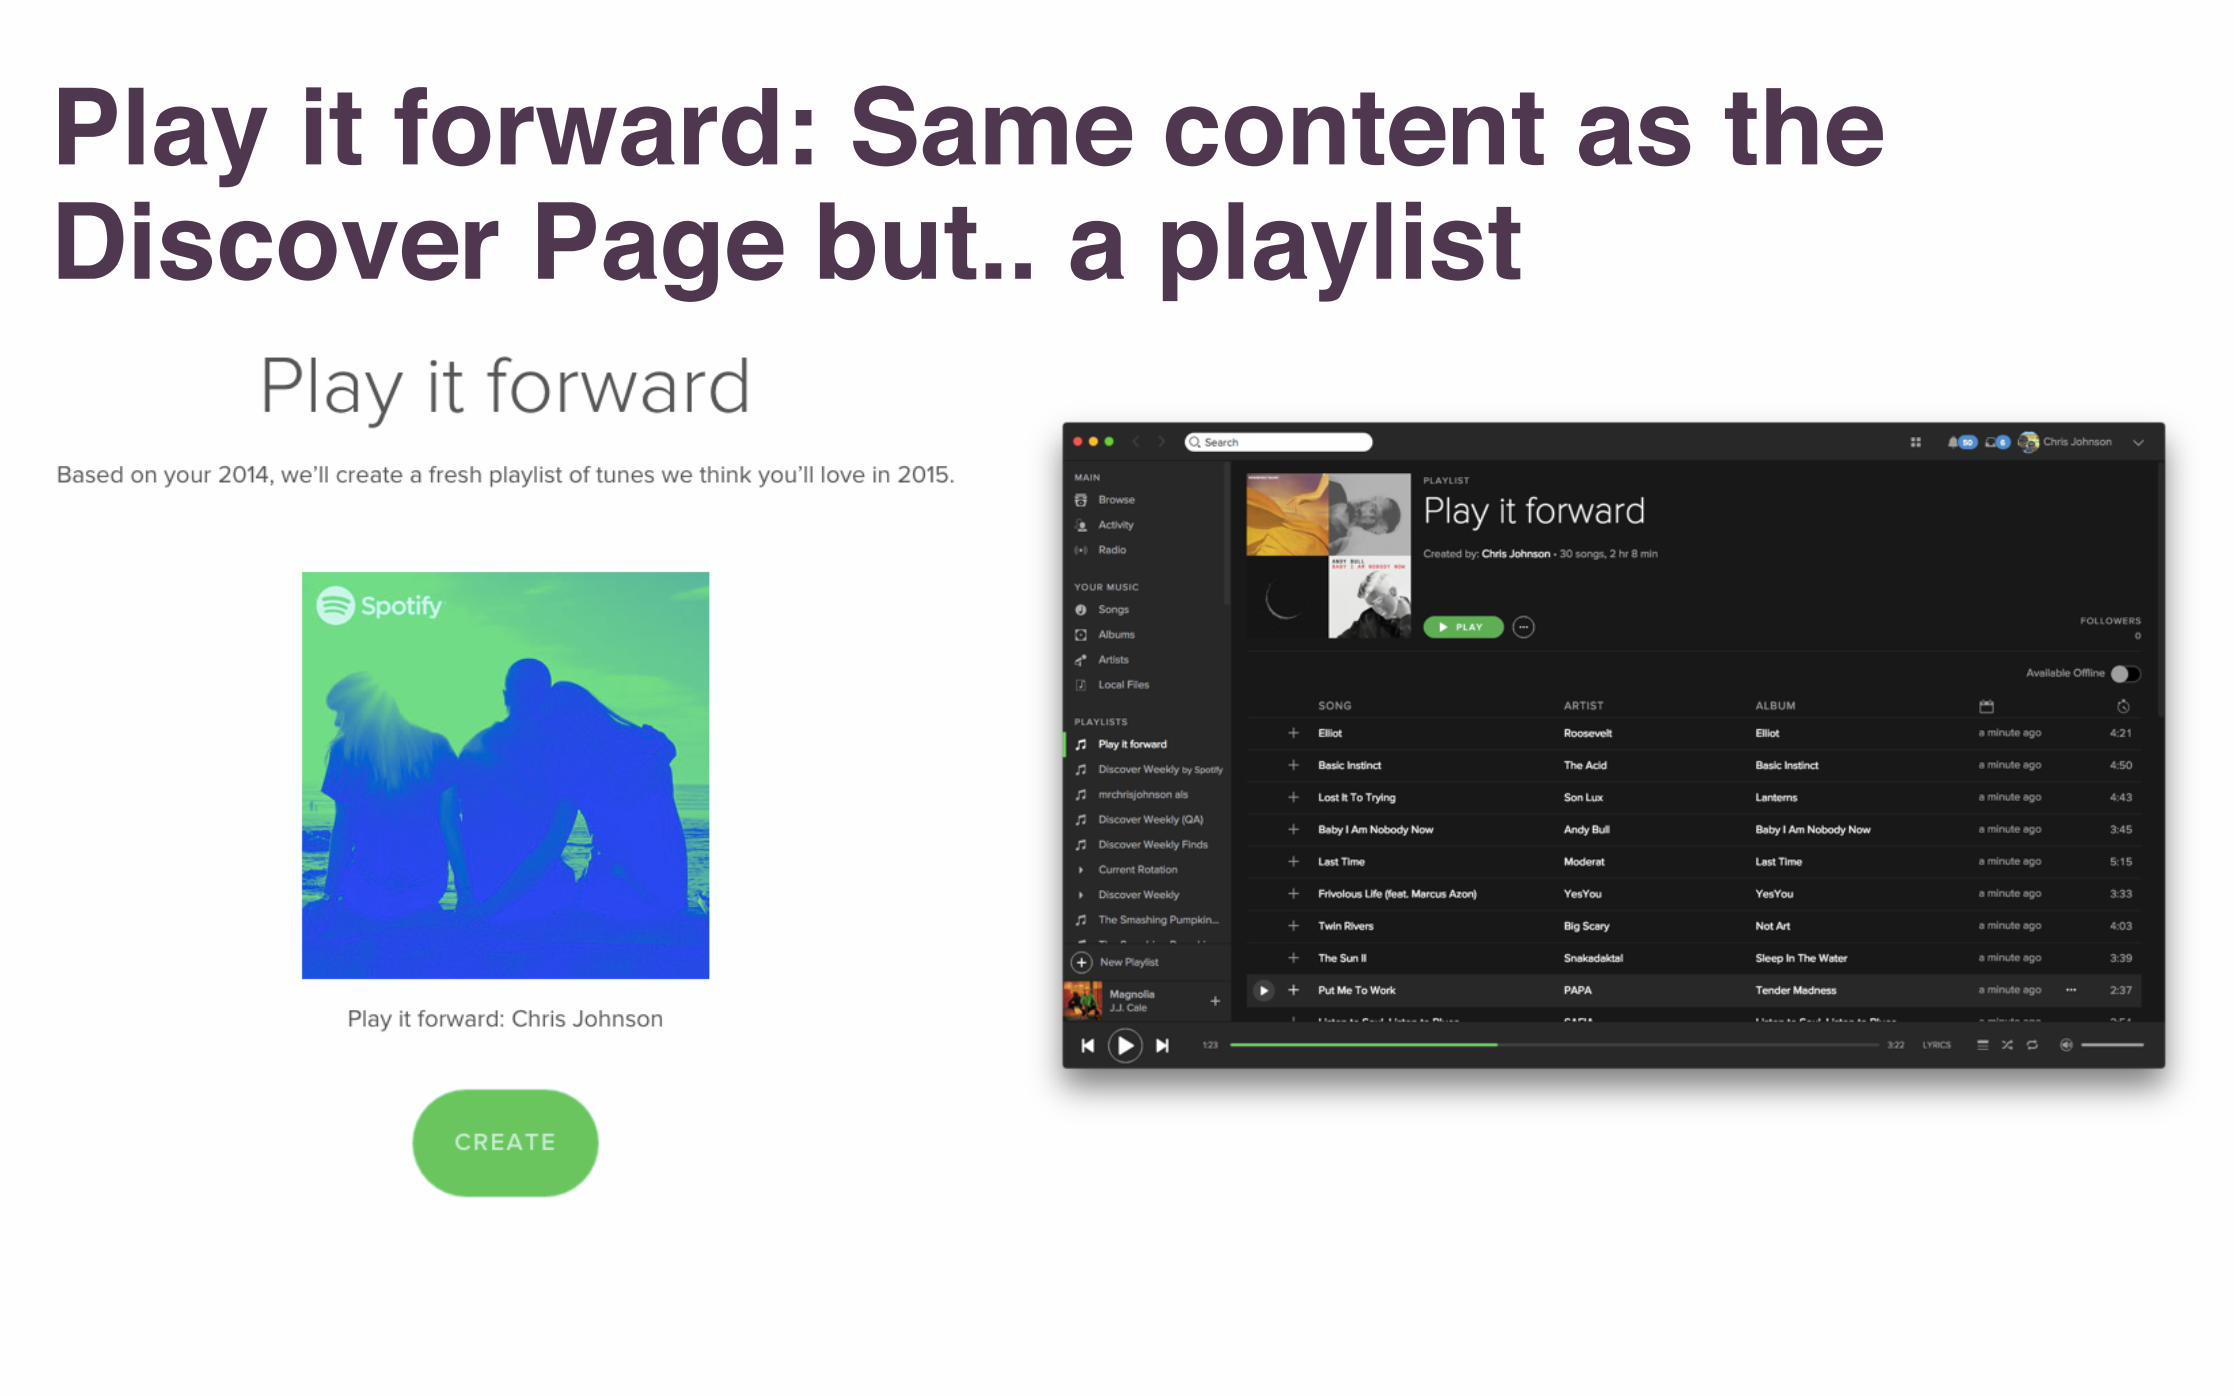
Play it forward: Same content as the Discover Page but.. a playlist
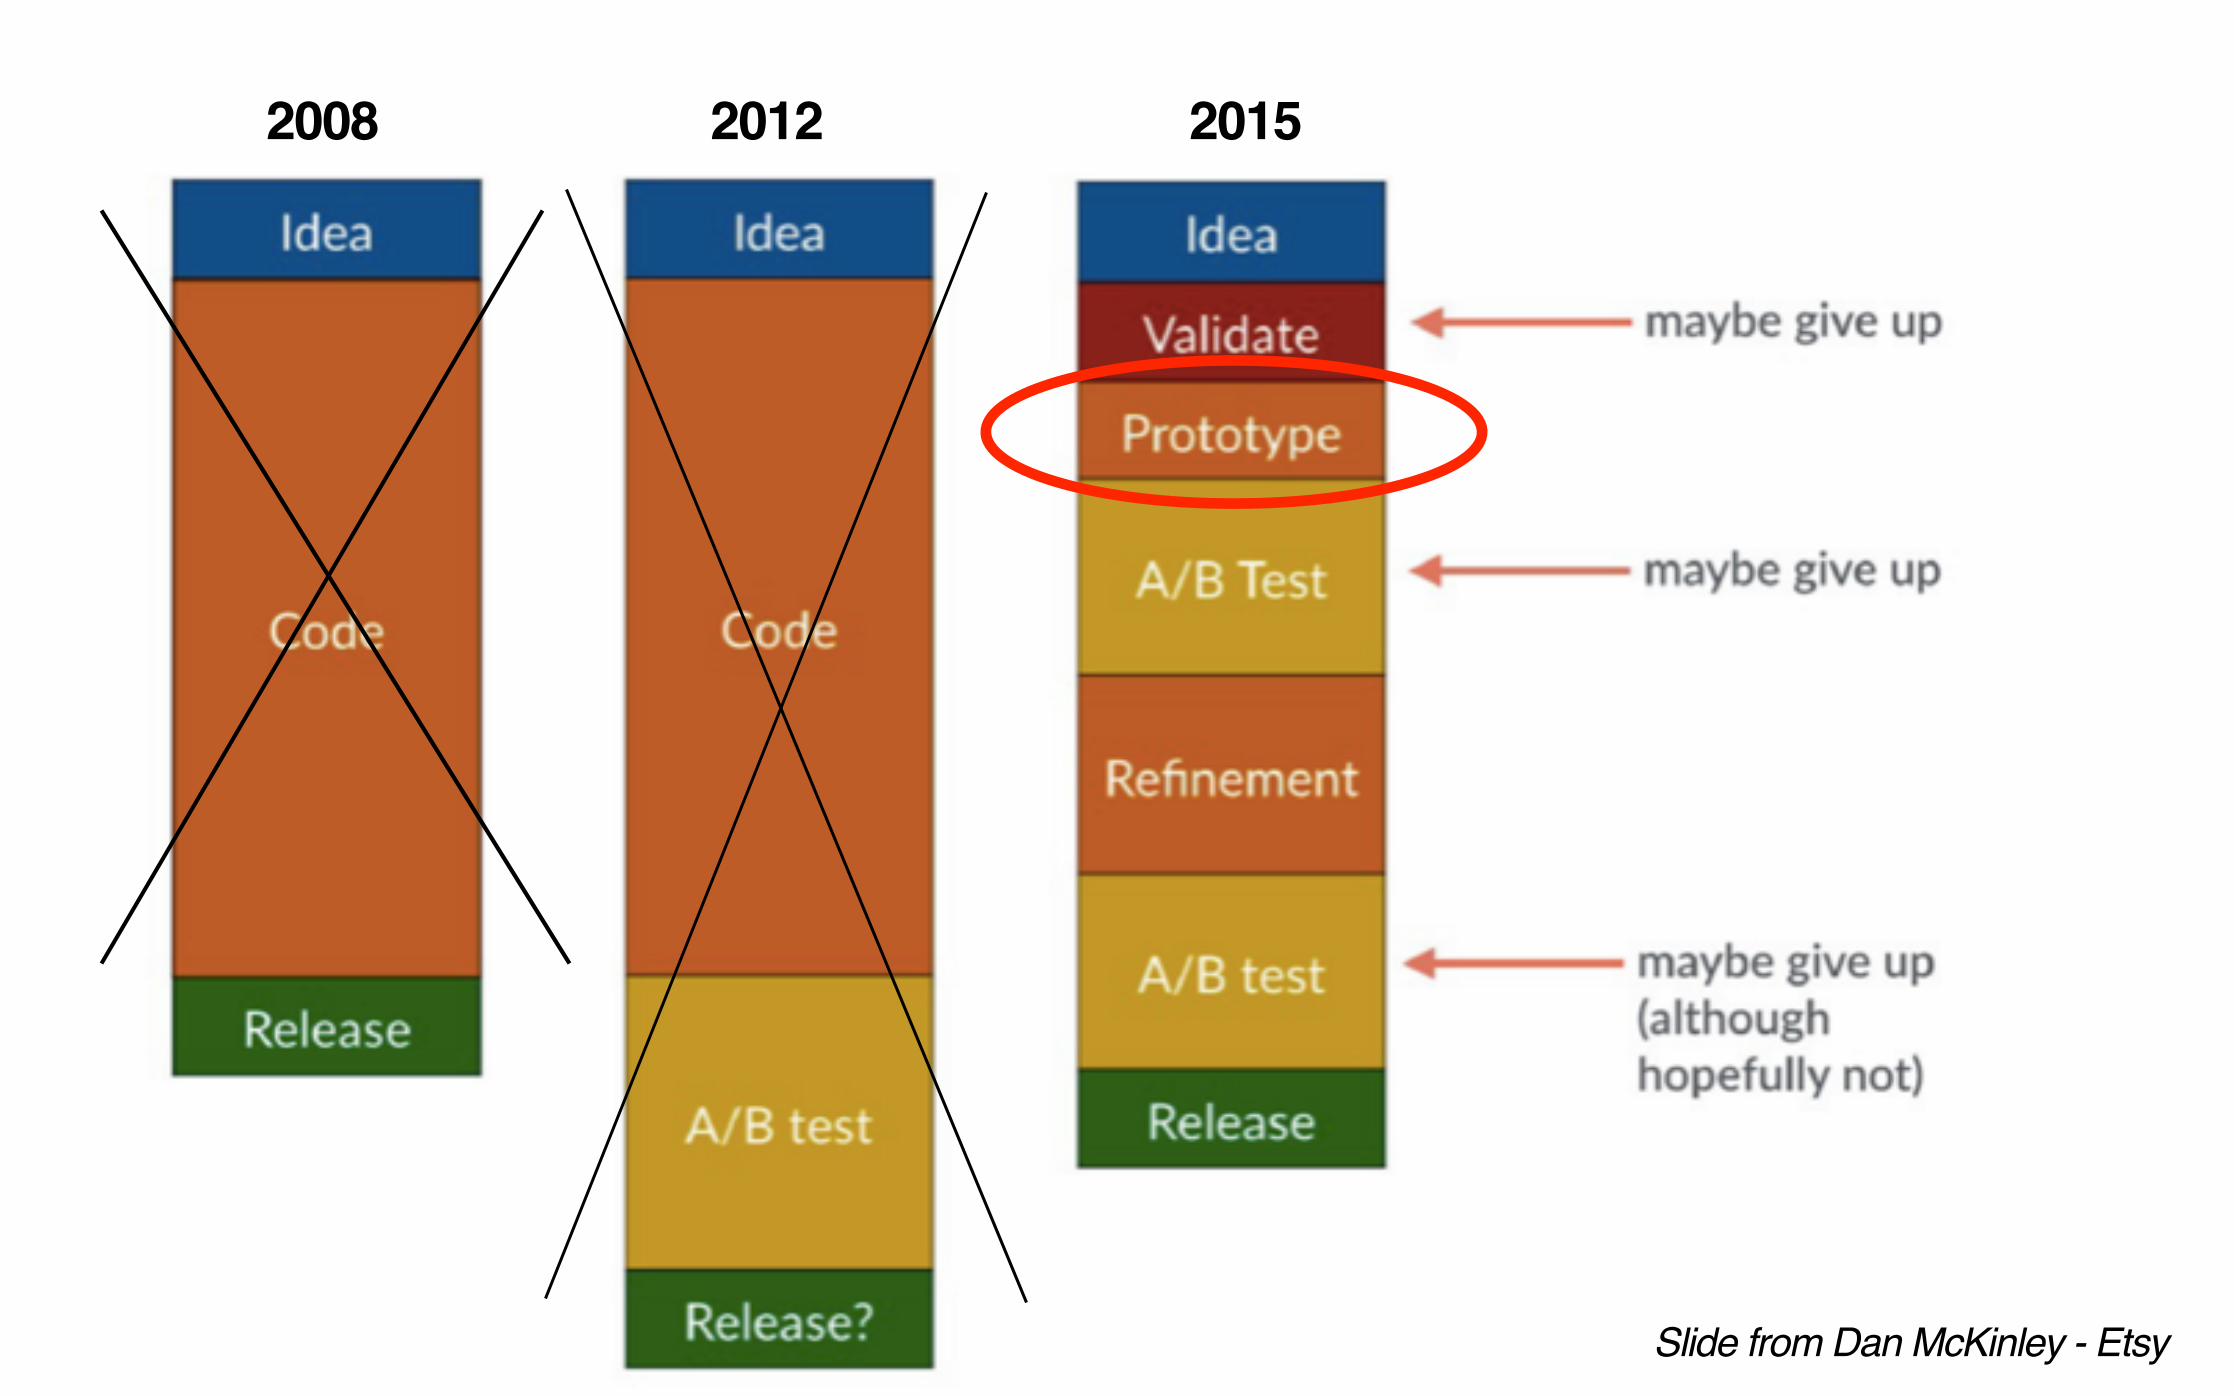
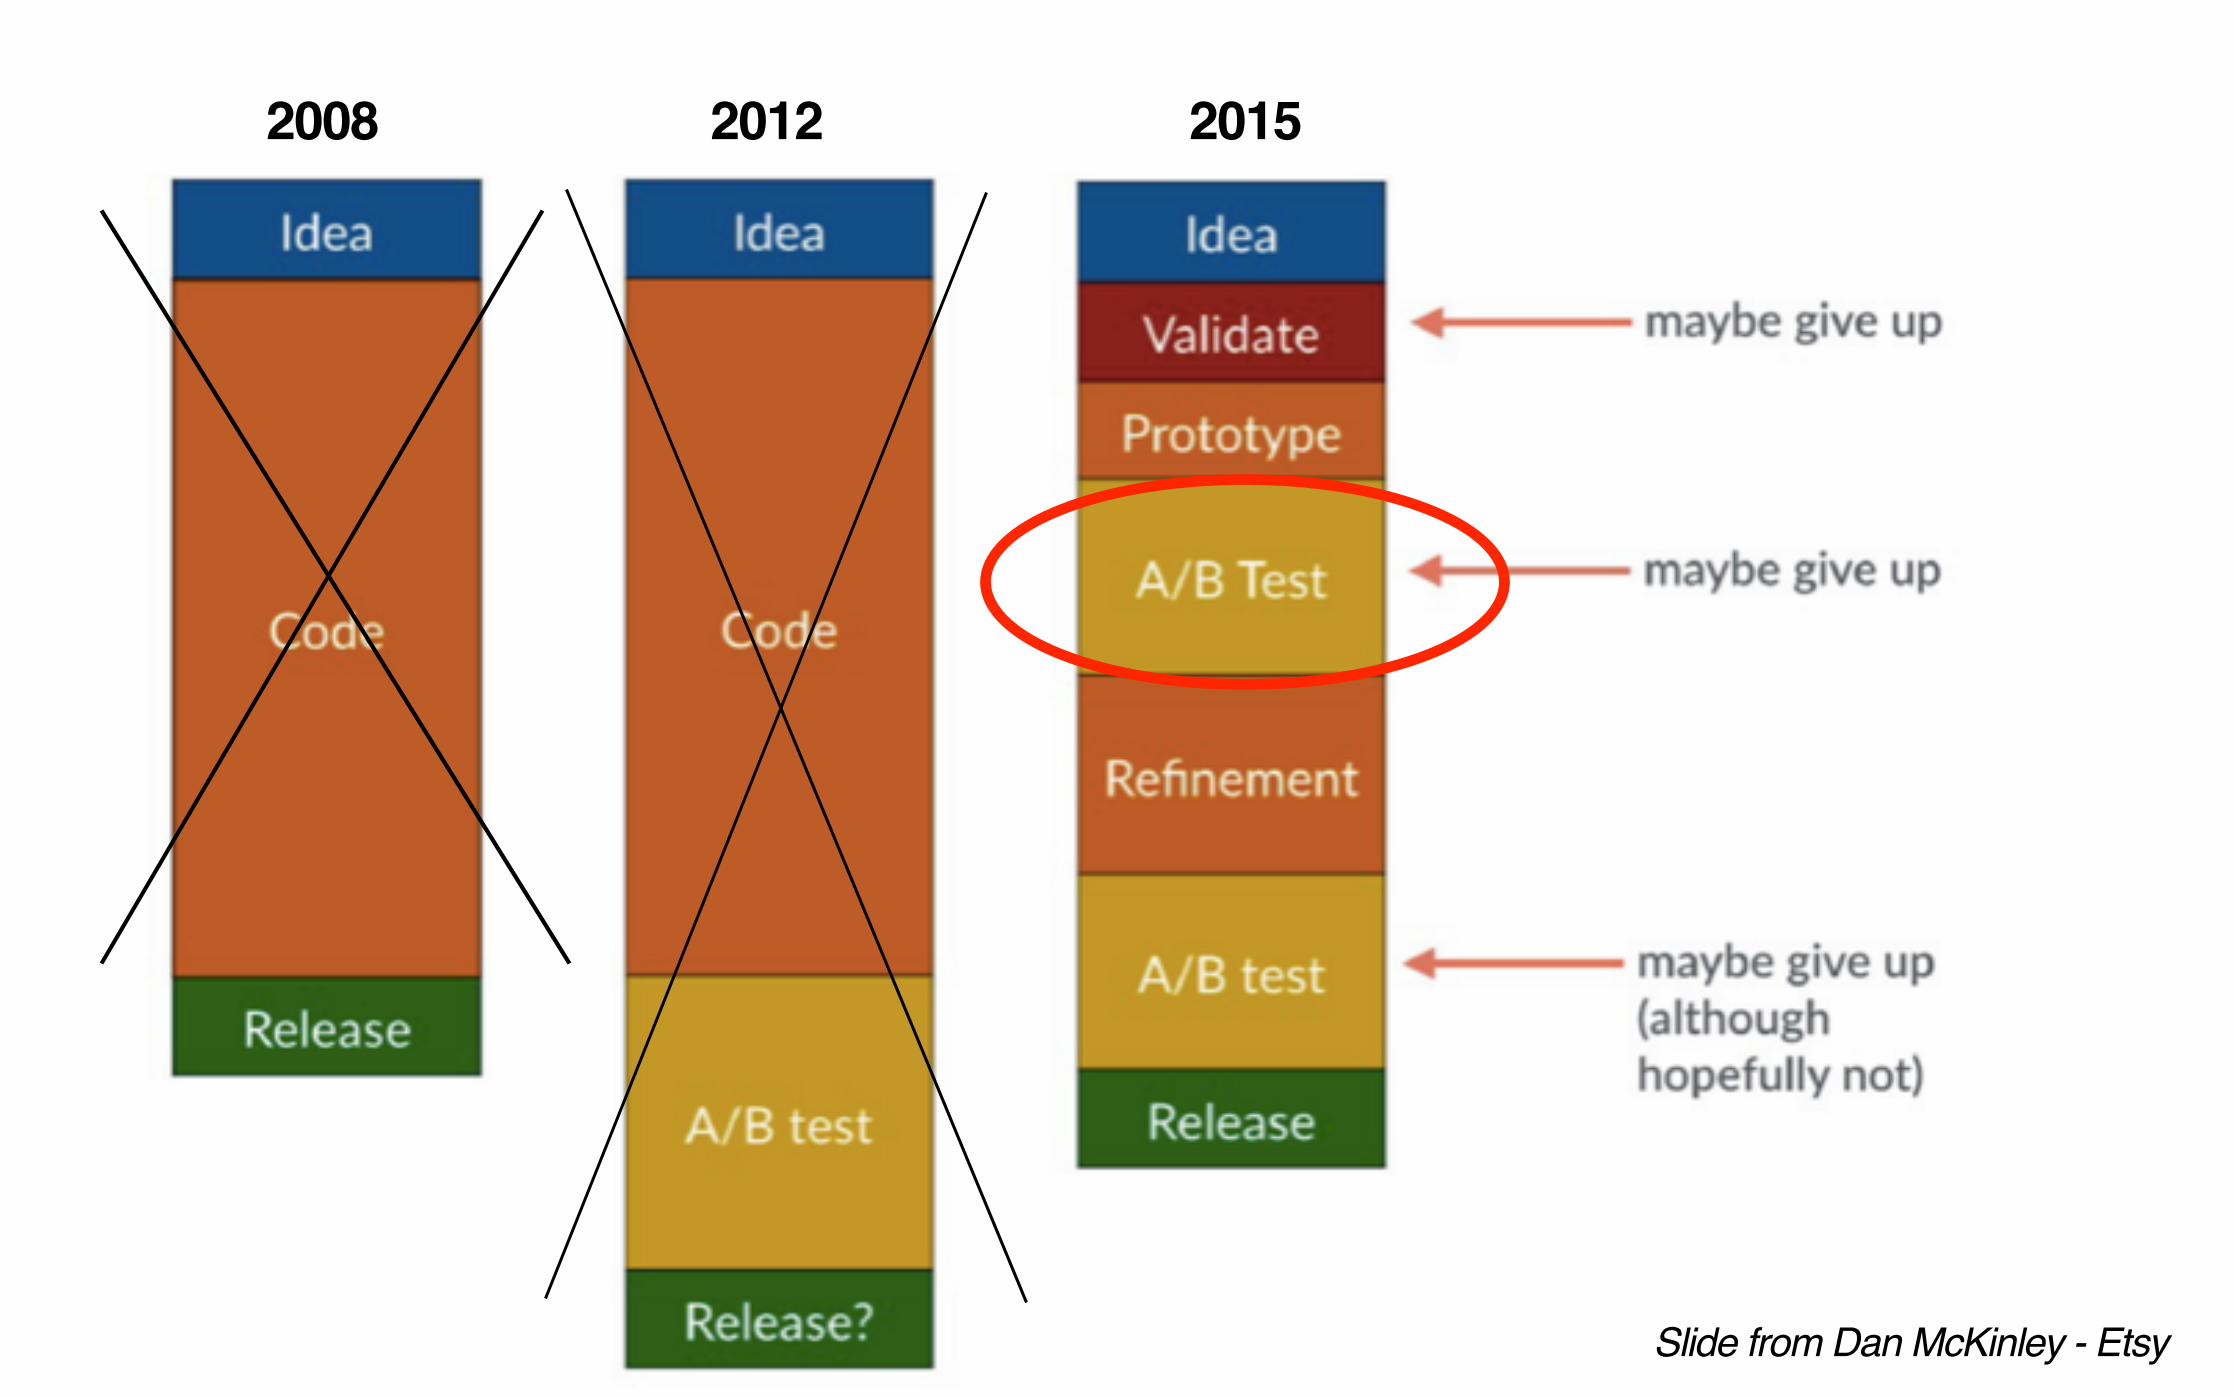
Lesson 1: Be data driven from
start to finish

Slide from Dan McKinley - Etsy
2008 2012 2015
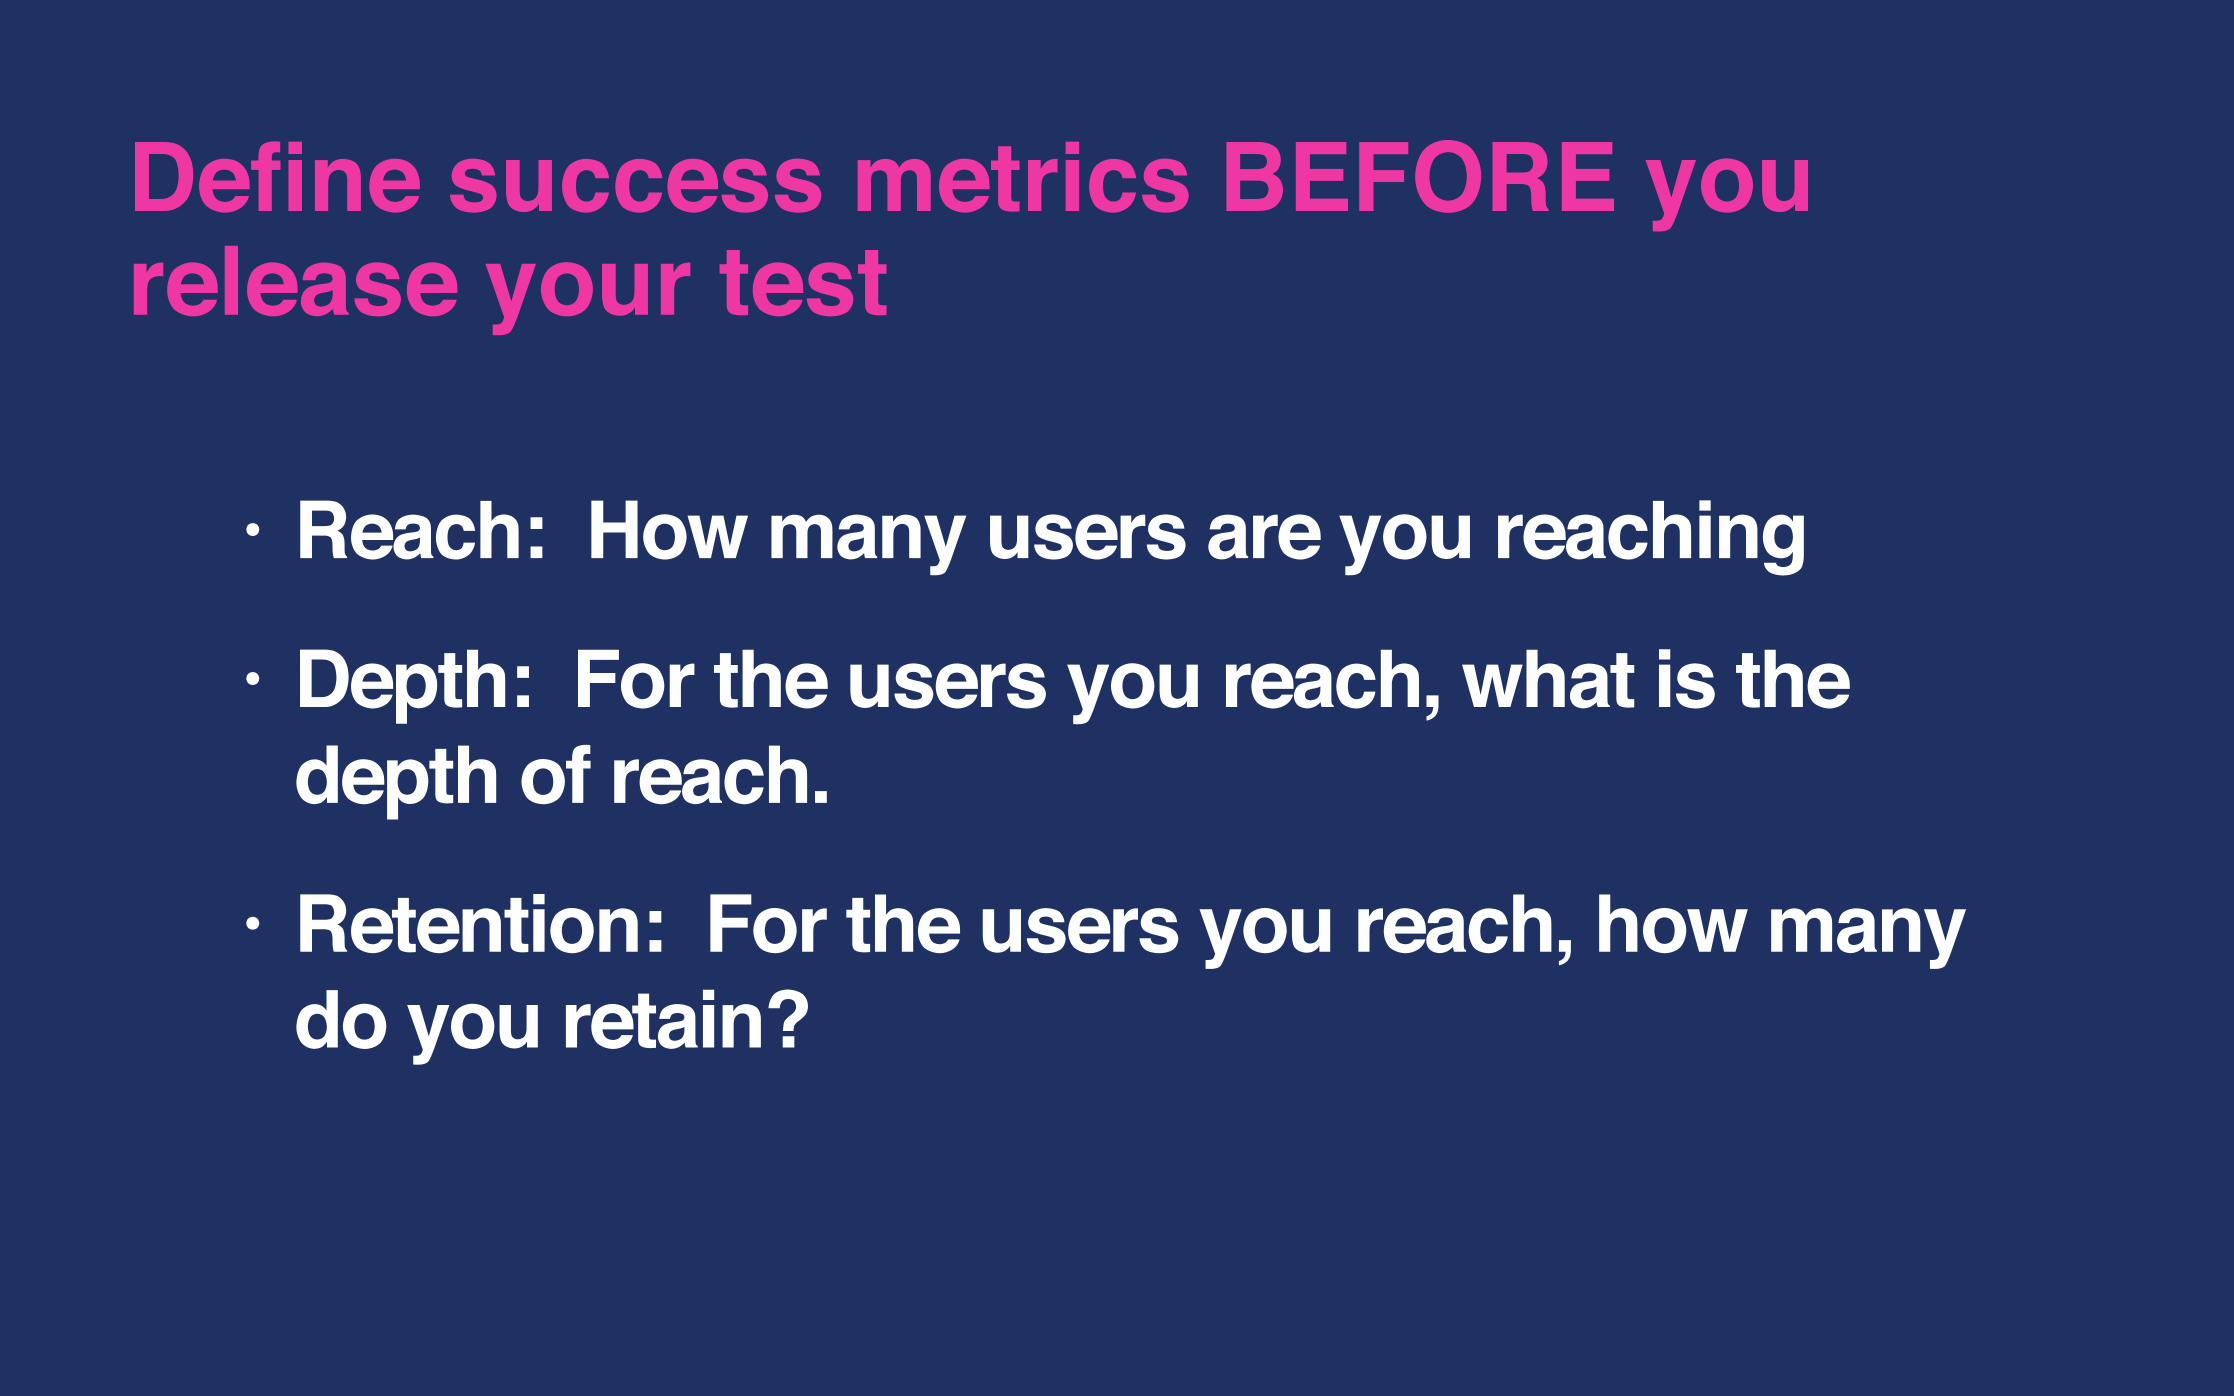
• Reach: How many users are you reaching• Depth: For the users you reach, what is the
depth of reach.• Retention: For the users you reach, how many
do you retain?
Define success metrics BEFORE you release your test
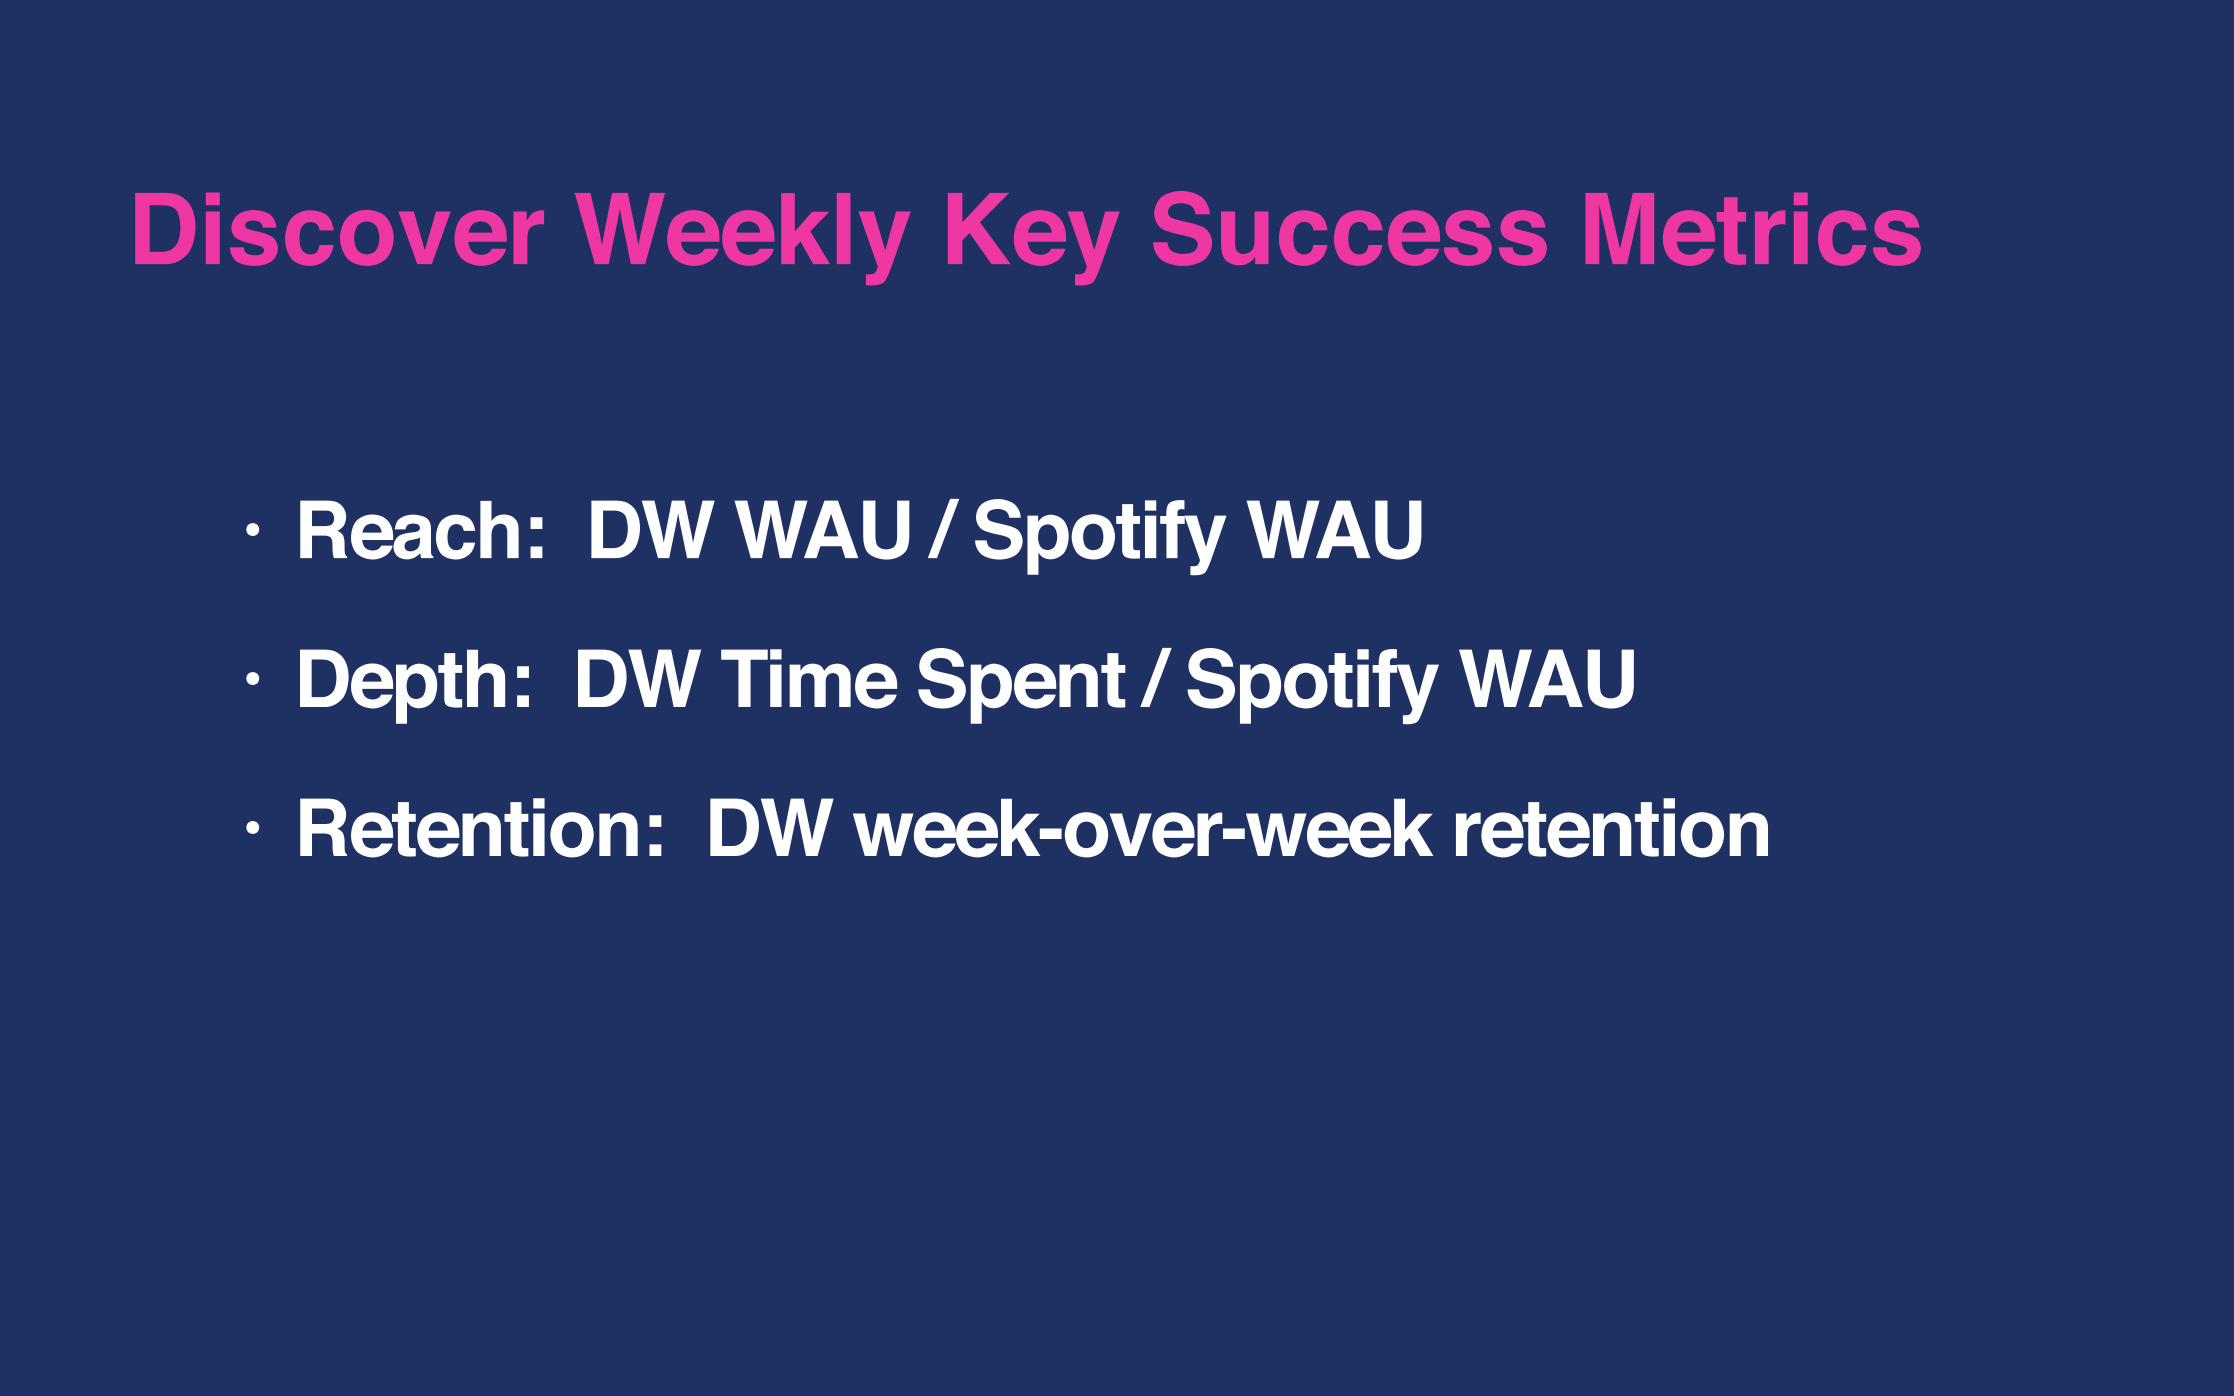
• Reach: DW WAU / Spotify WAU• Depth: DW Time Spent / Spotify WAU• Retention: DW week-over-week retention
Discover Weekly Key Success Metrics
2008 2012 2015
Slide from Dan McKinley - Etsy
Step 1: Prototype (employee test)
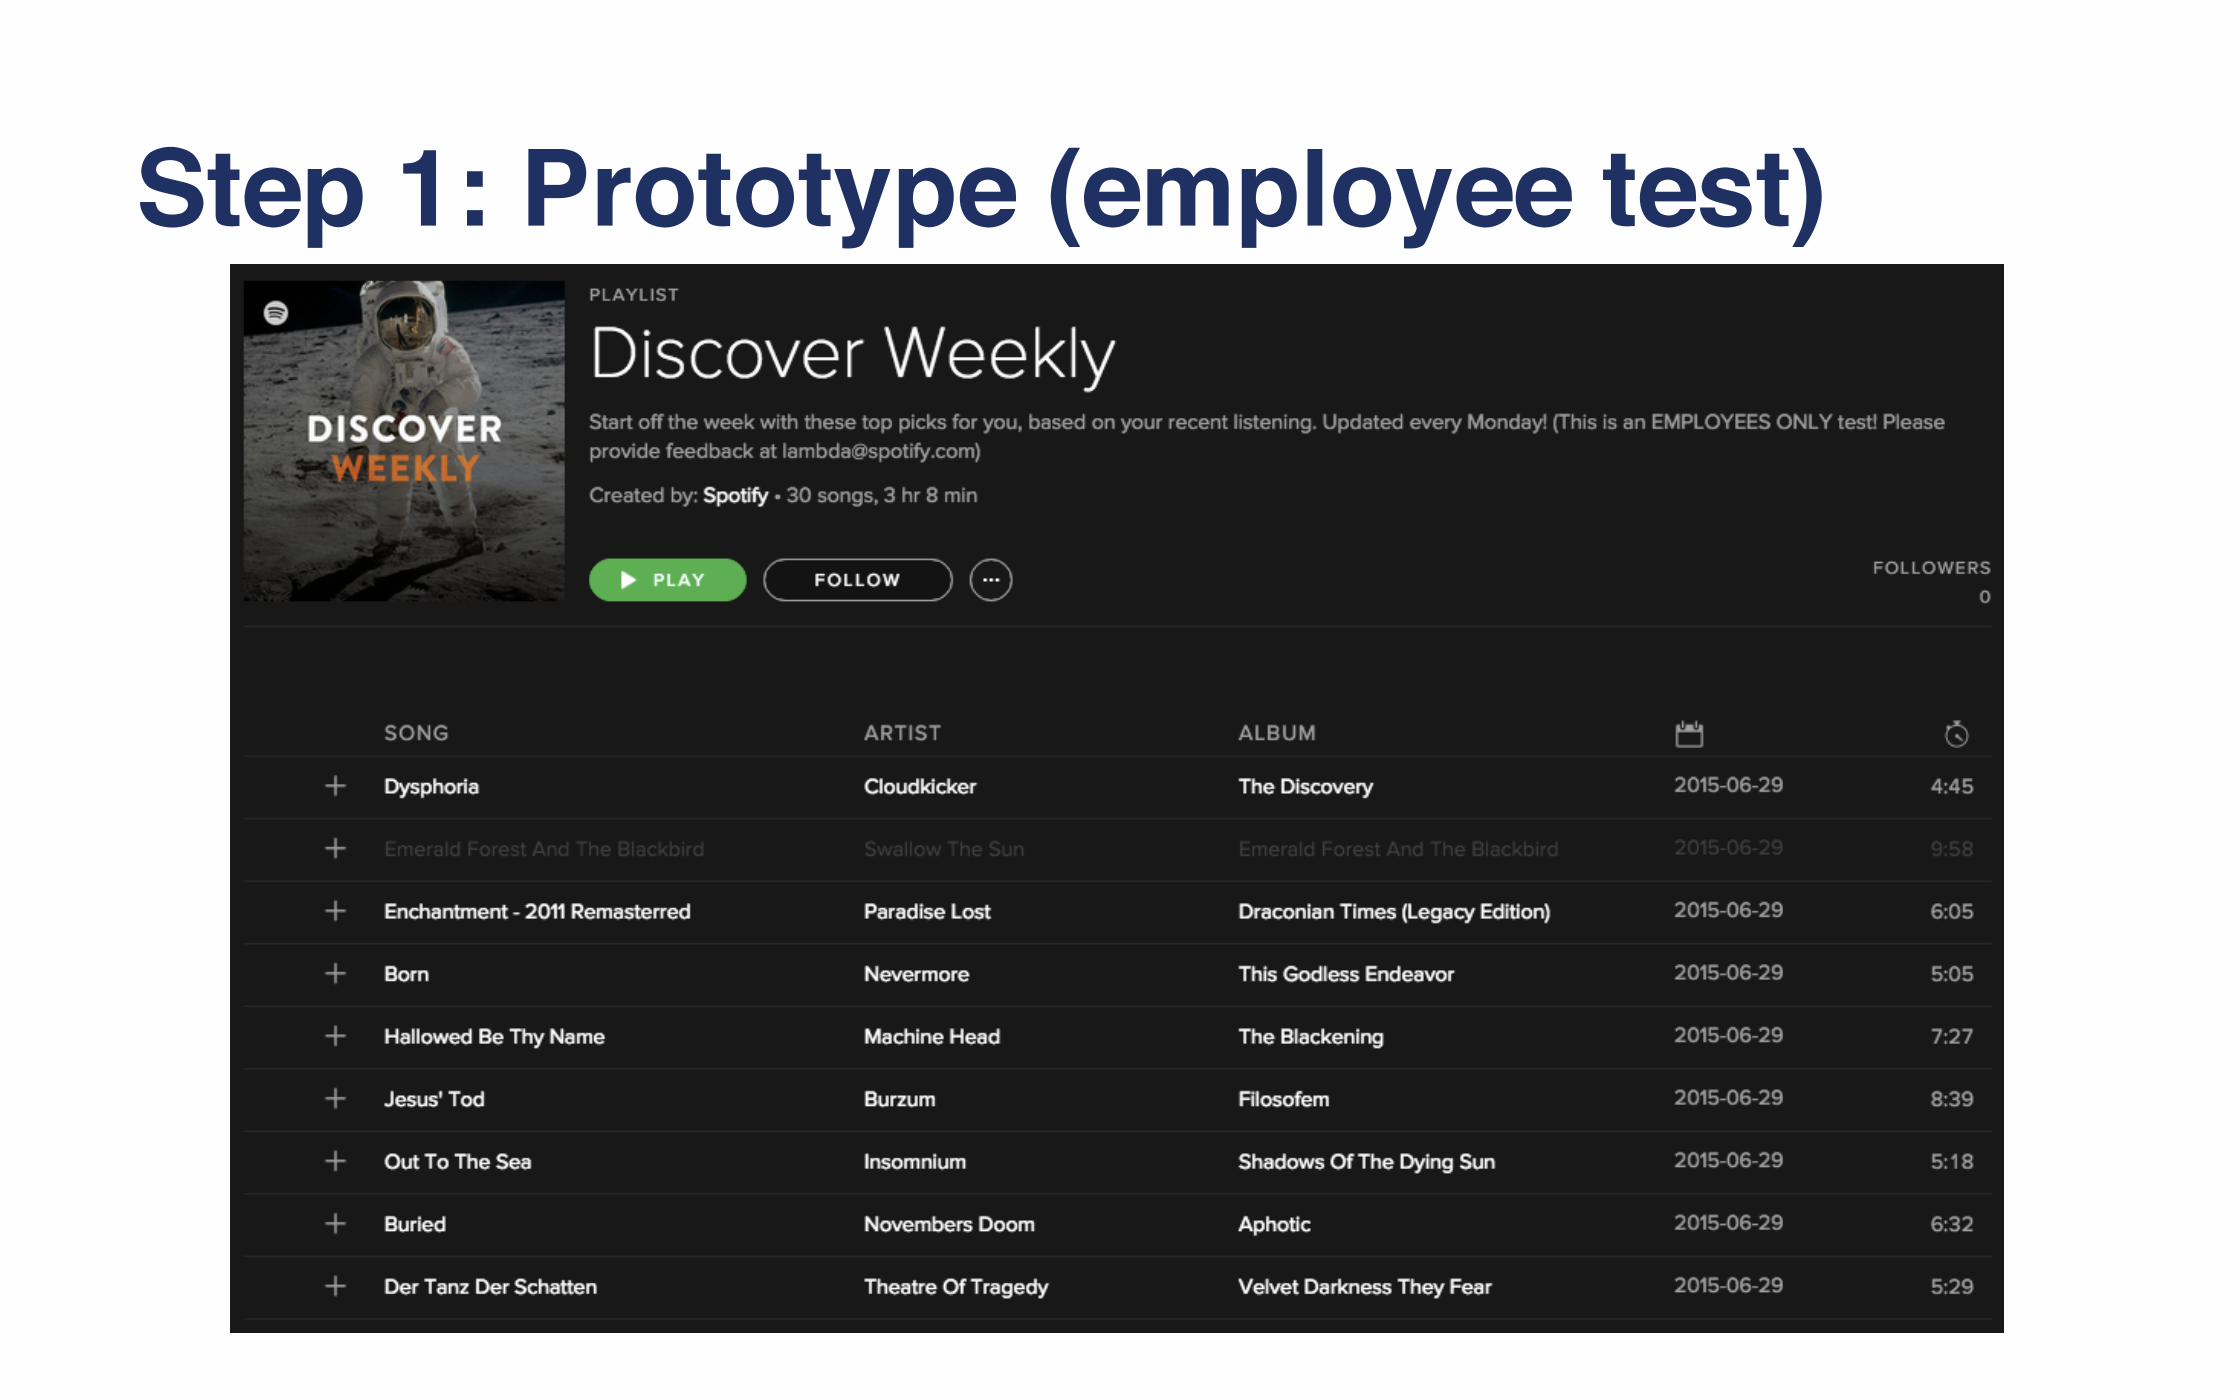
Step 1: Prototype (employee test)
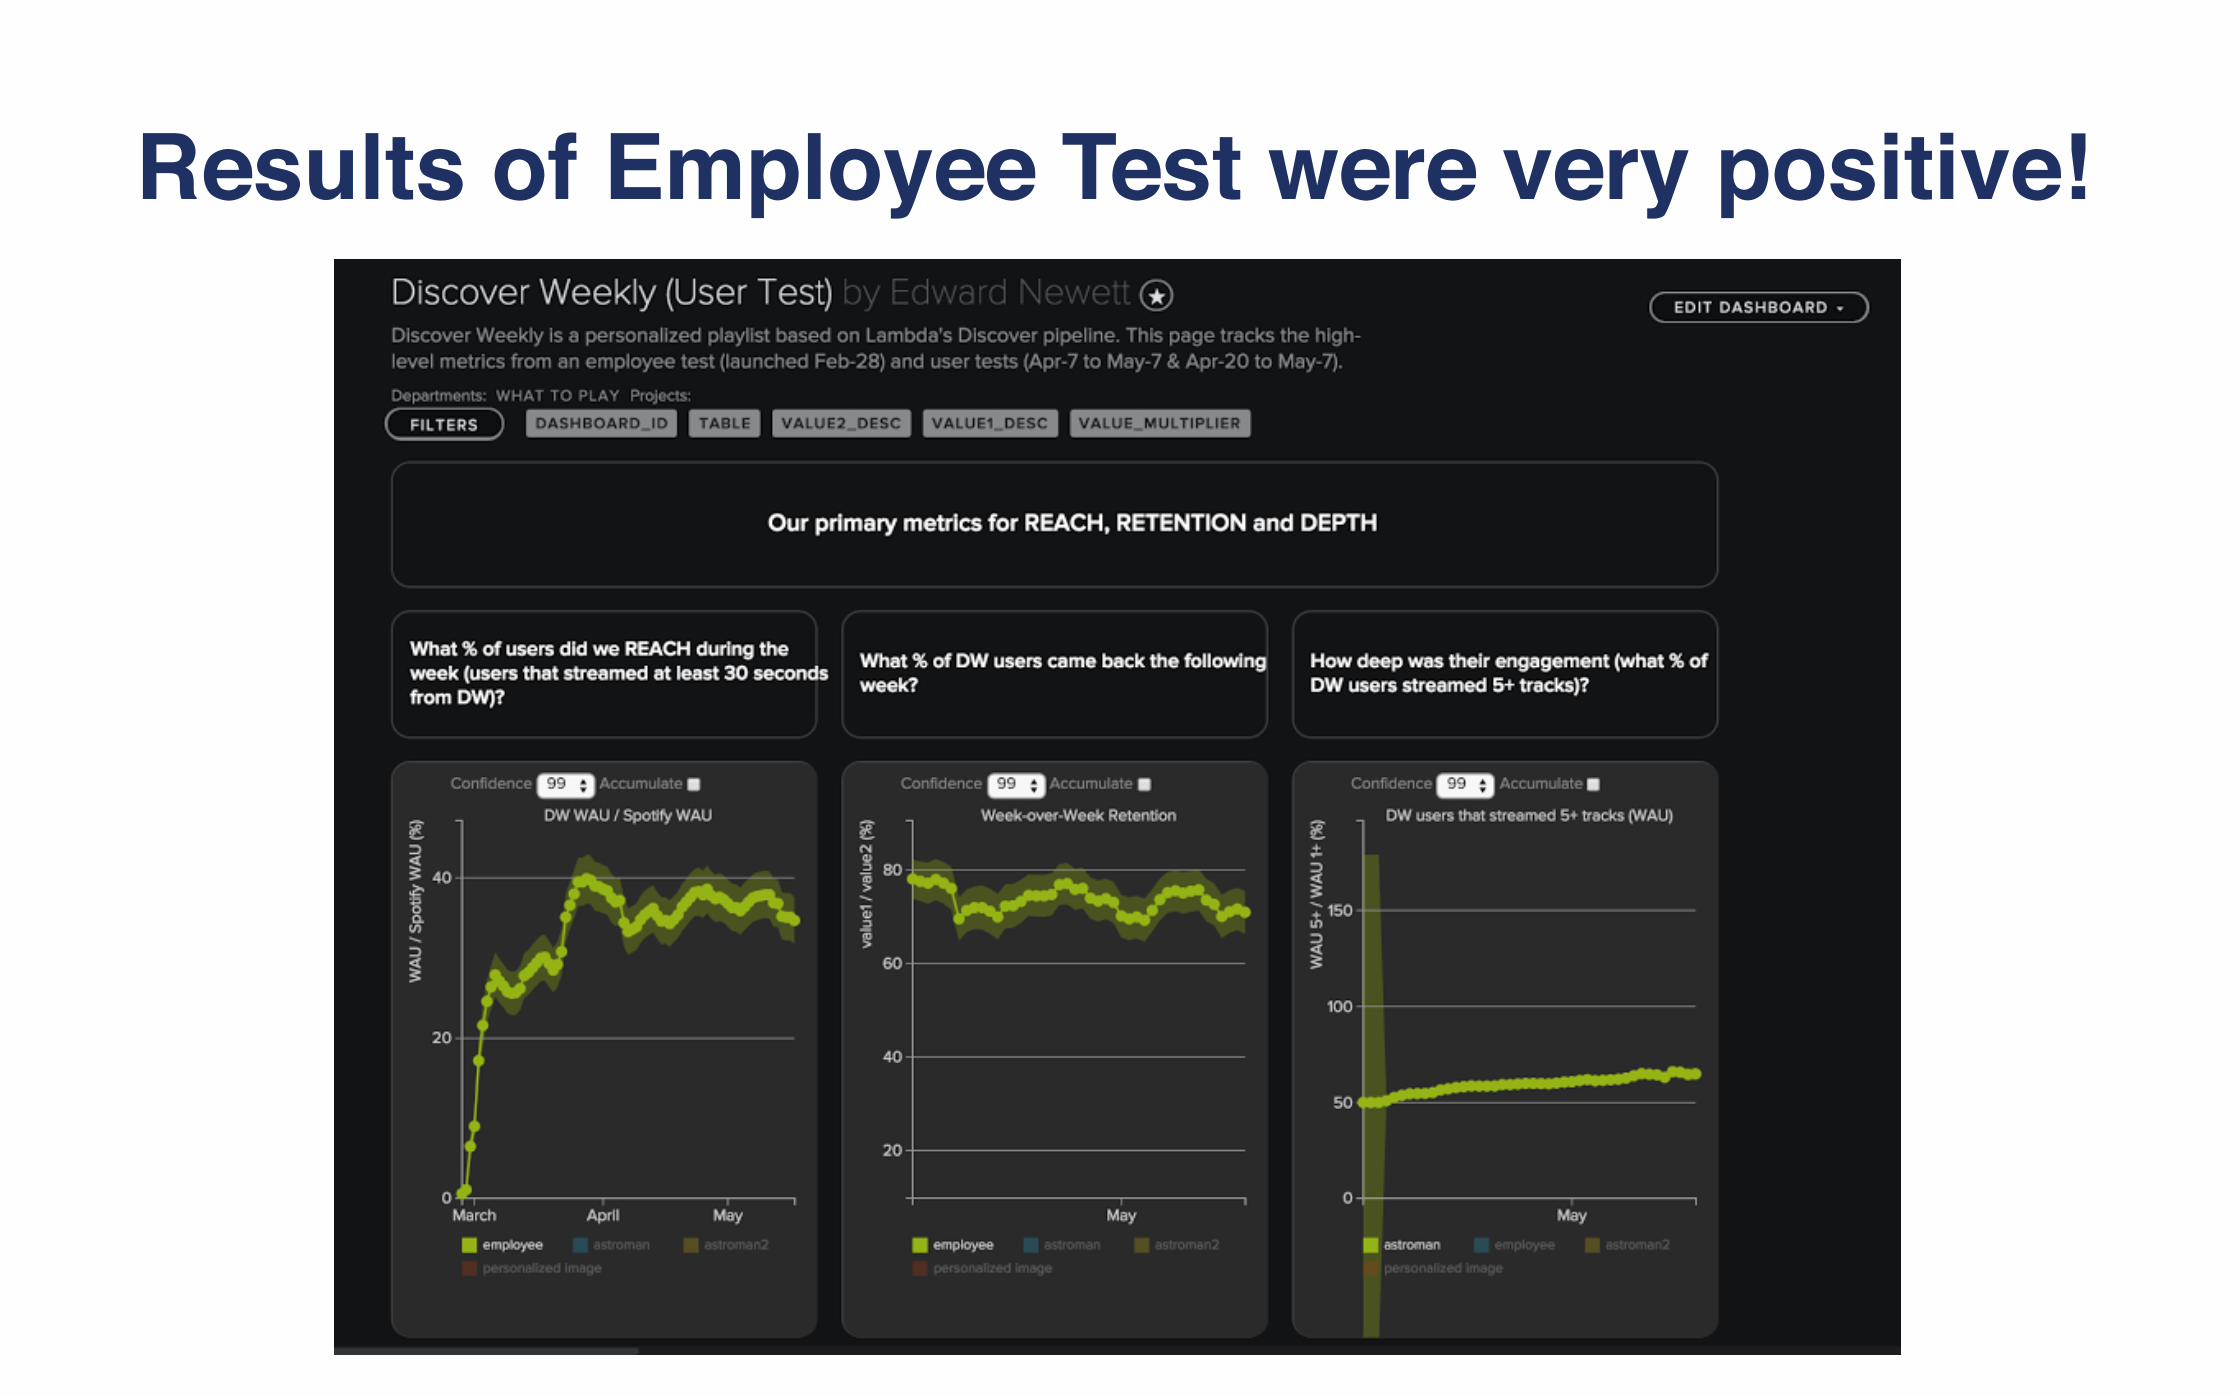
Results of Employee Test were very positive!
2008 2012 2015
Slide from Dan McKinley - Etsy
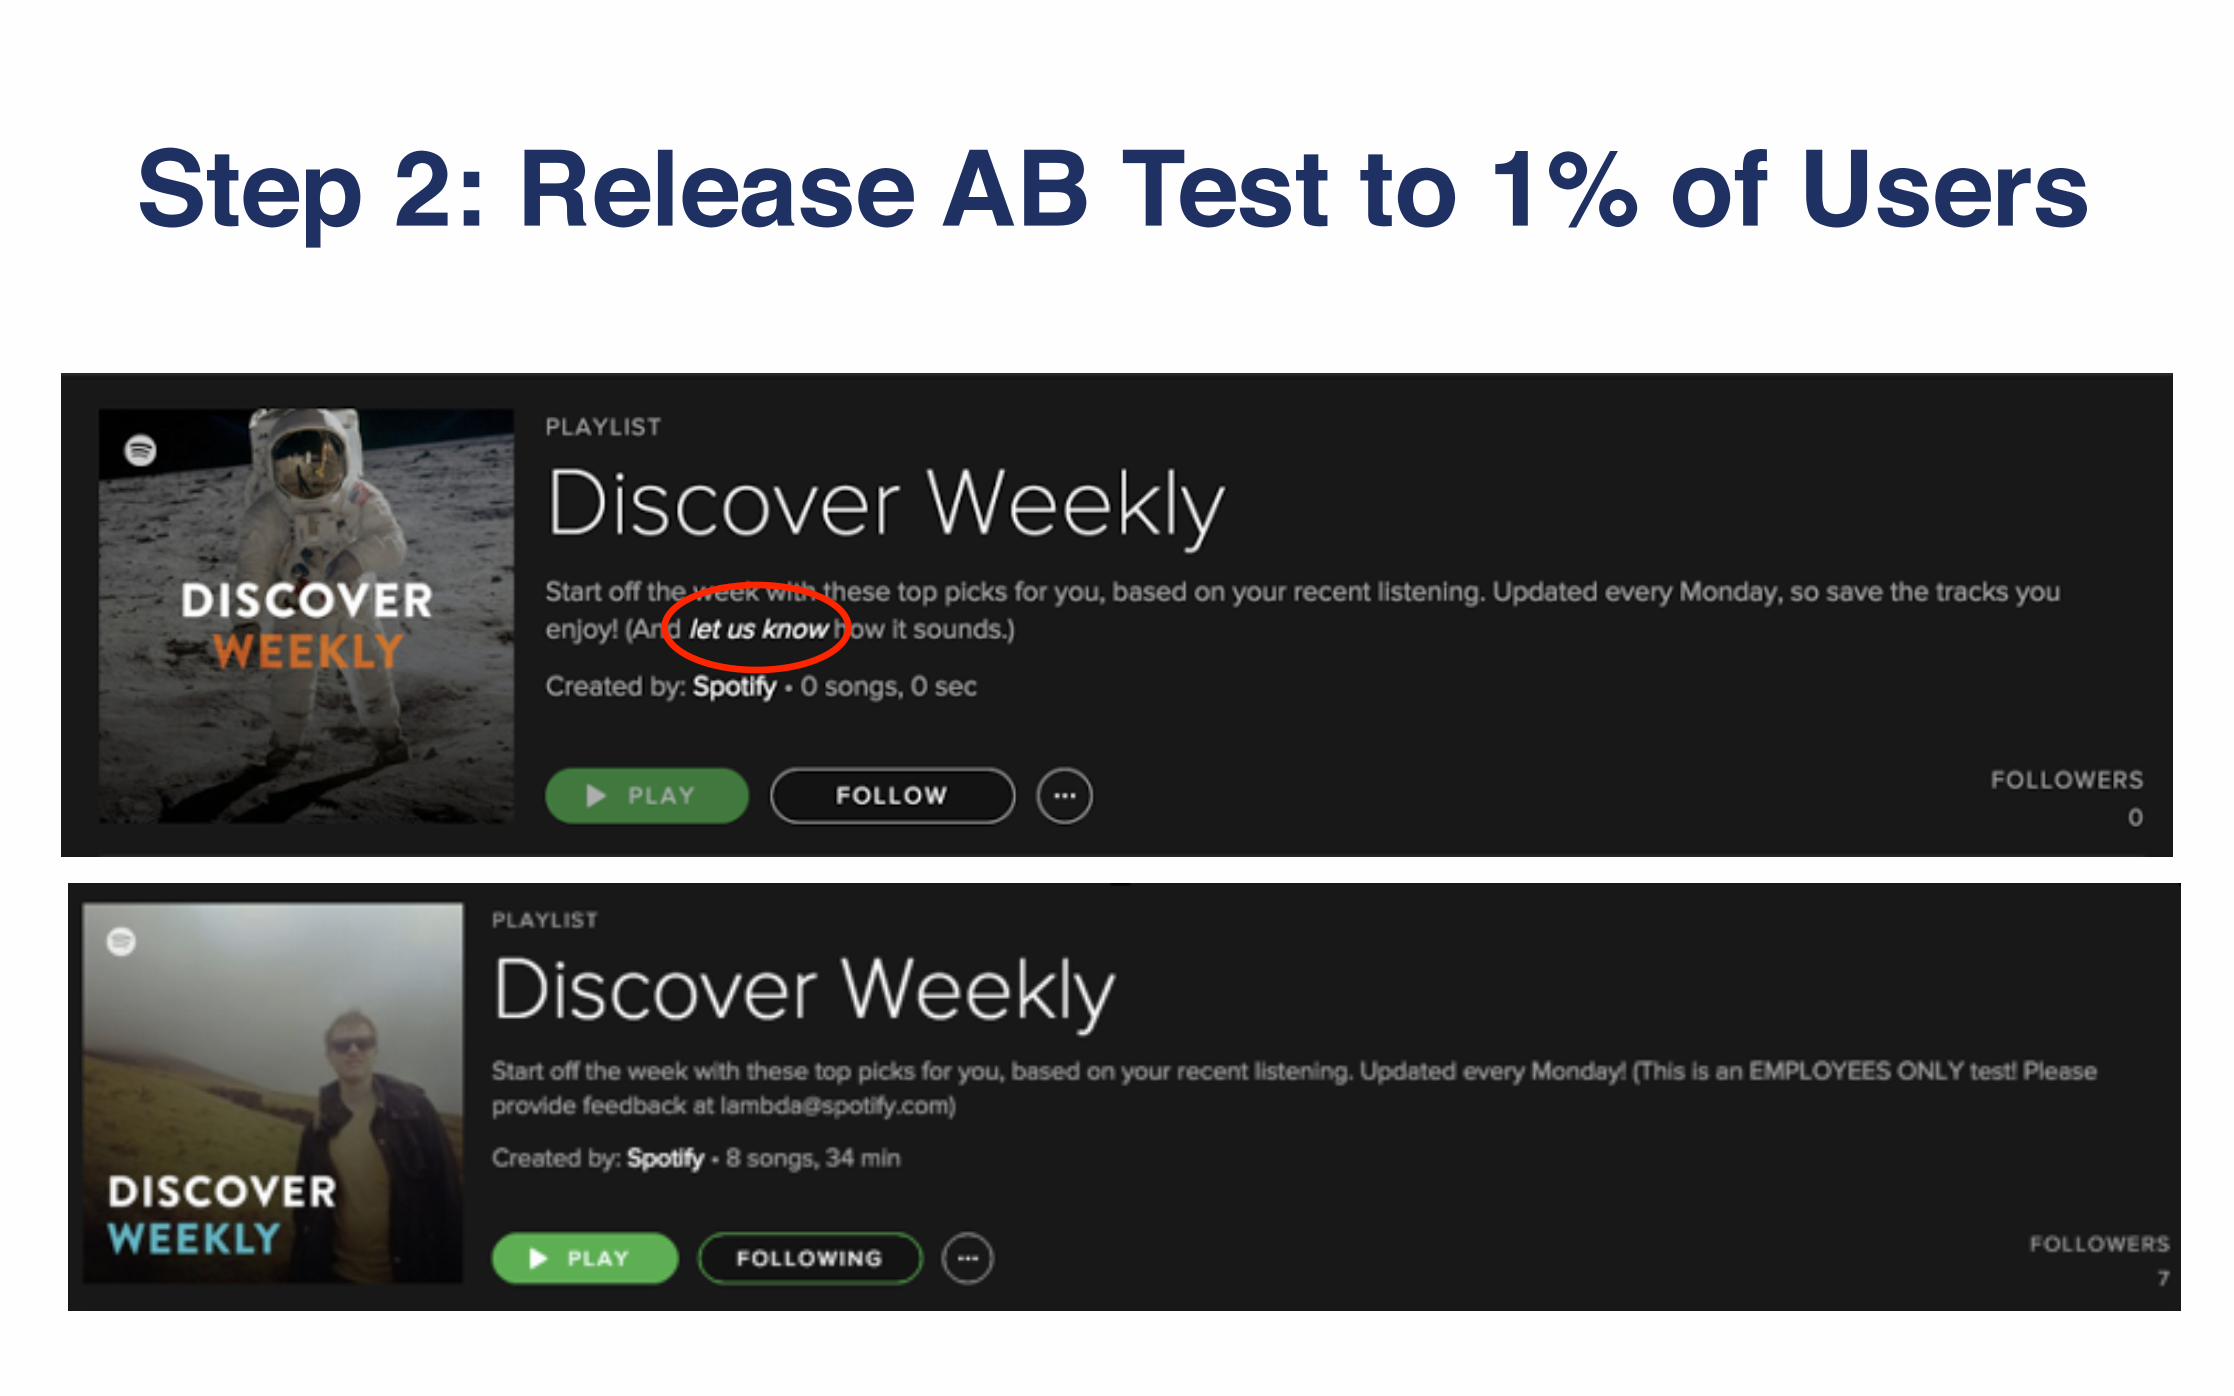
Step 2: Release AB Test to 1% of Users
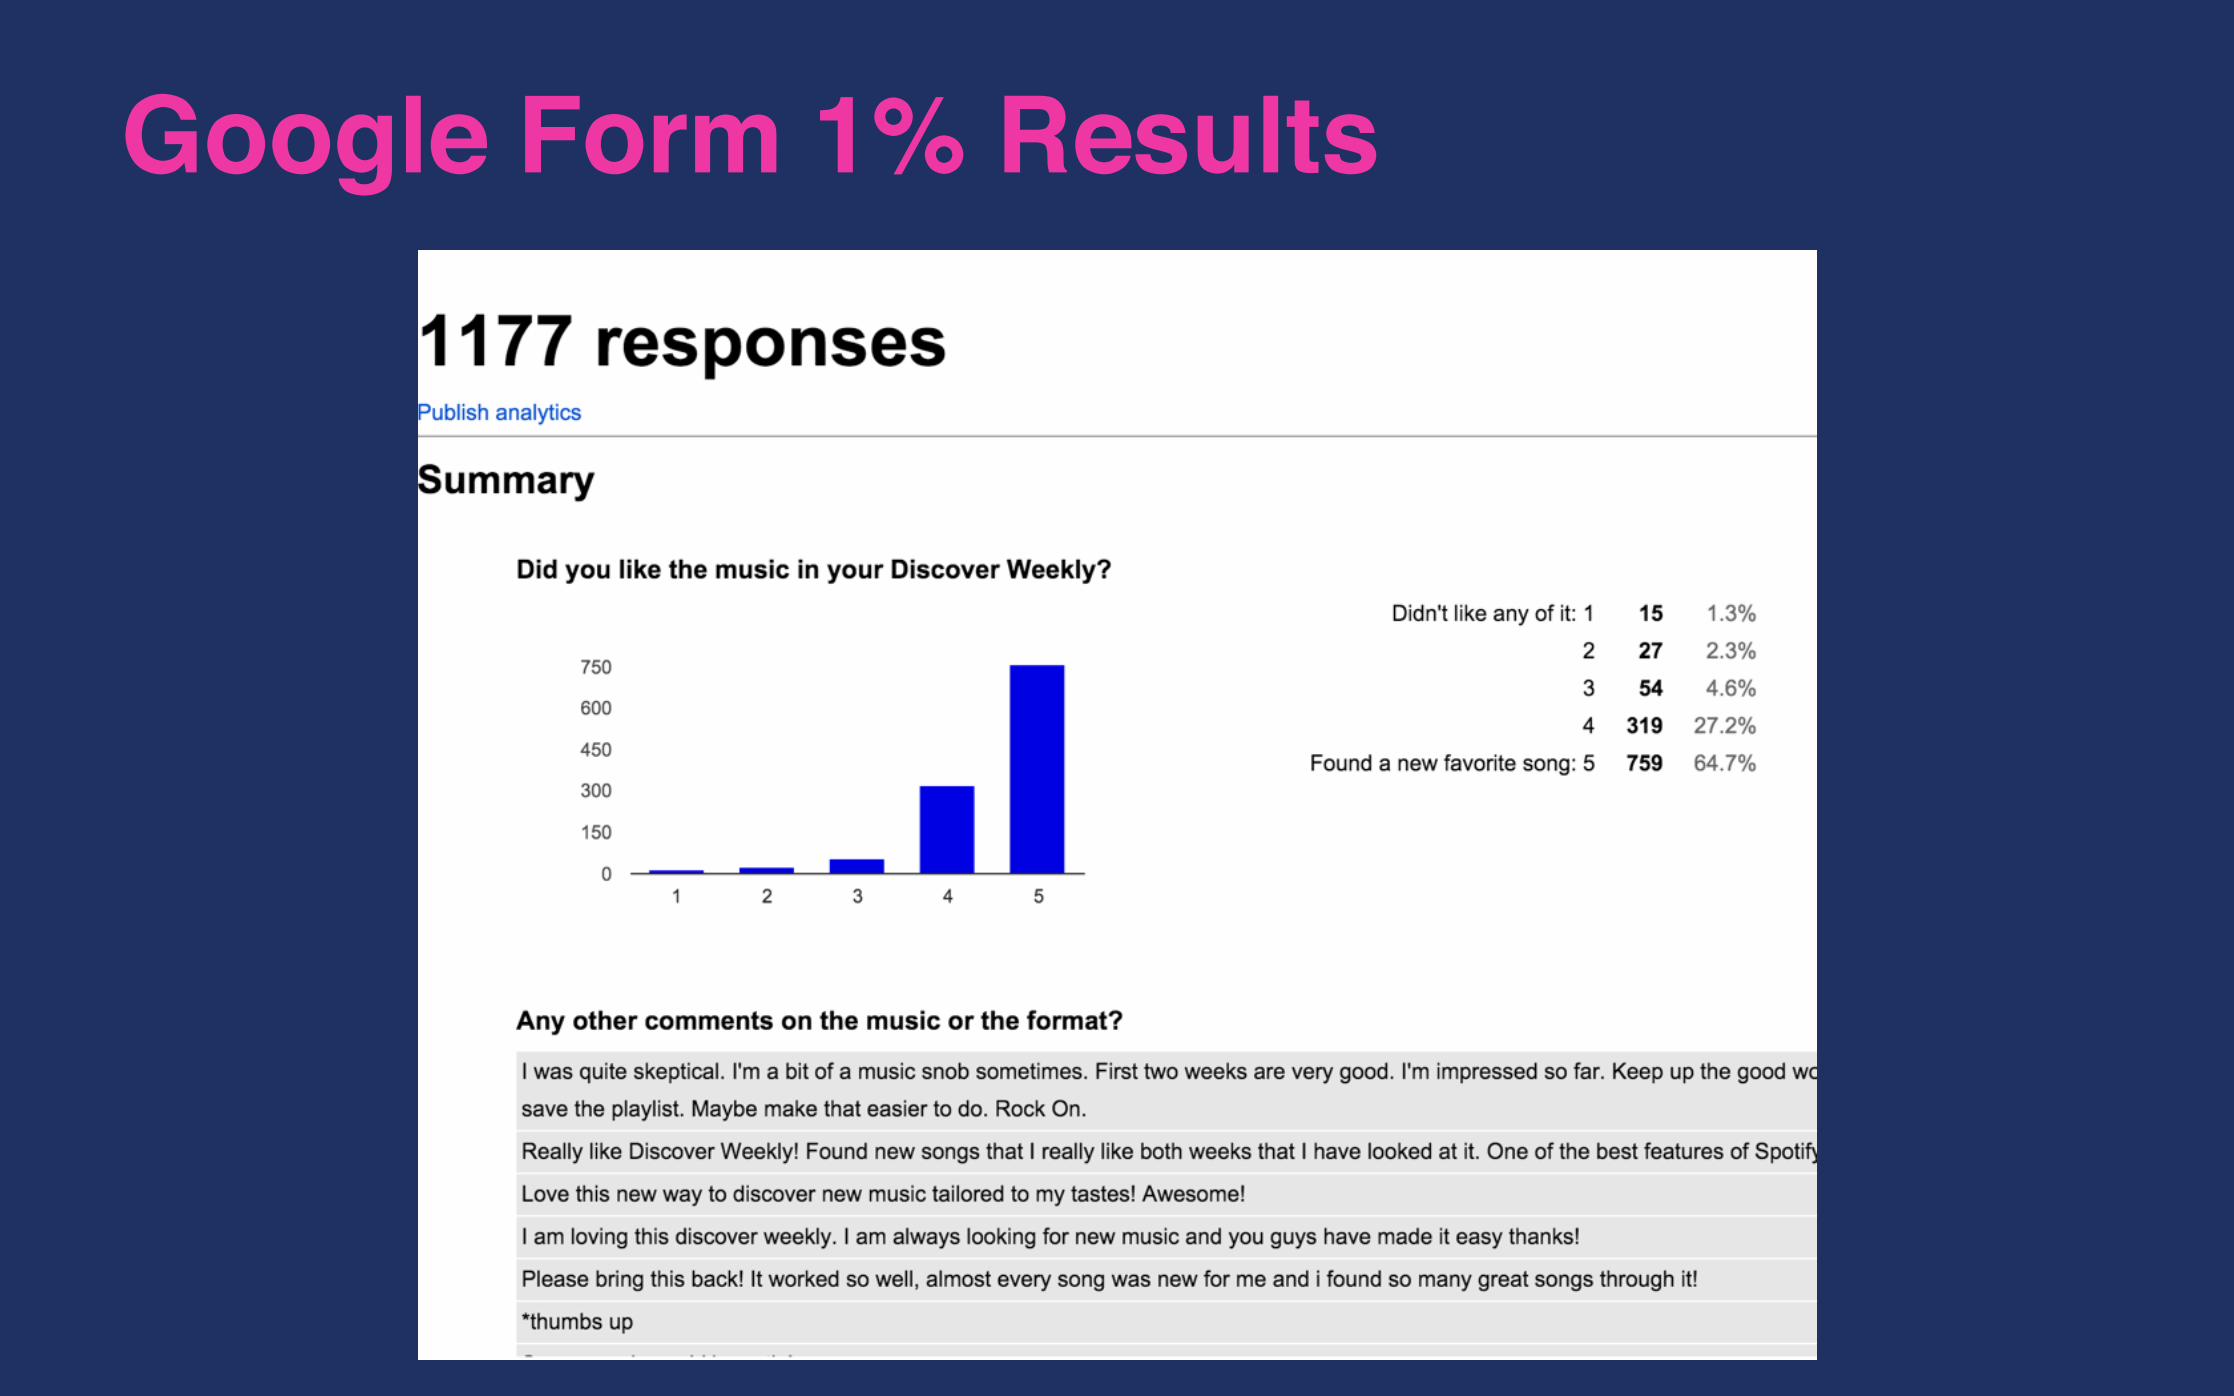
Google Form 1% Results
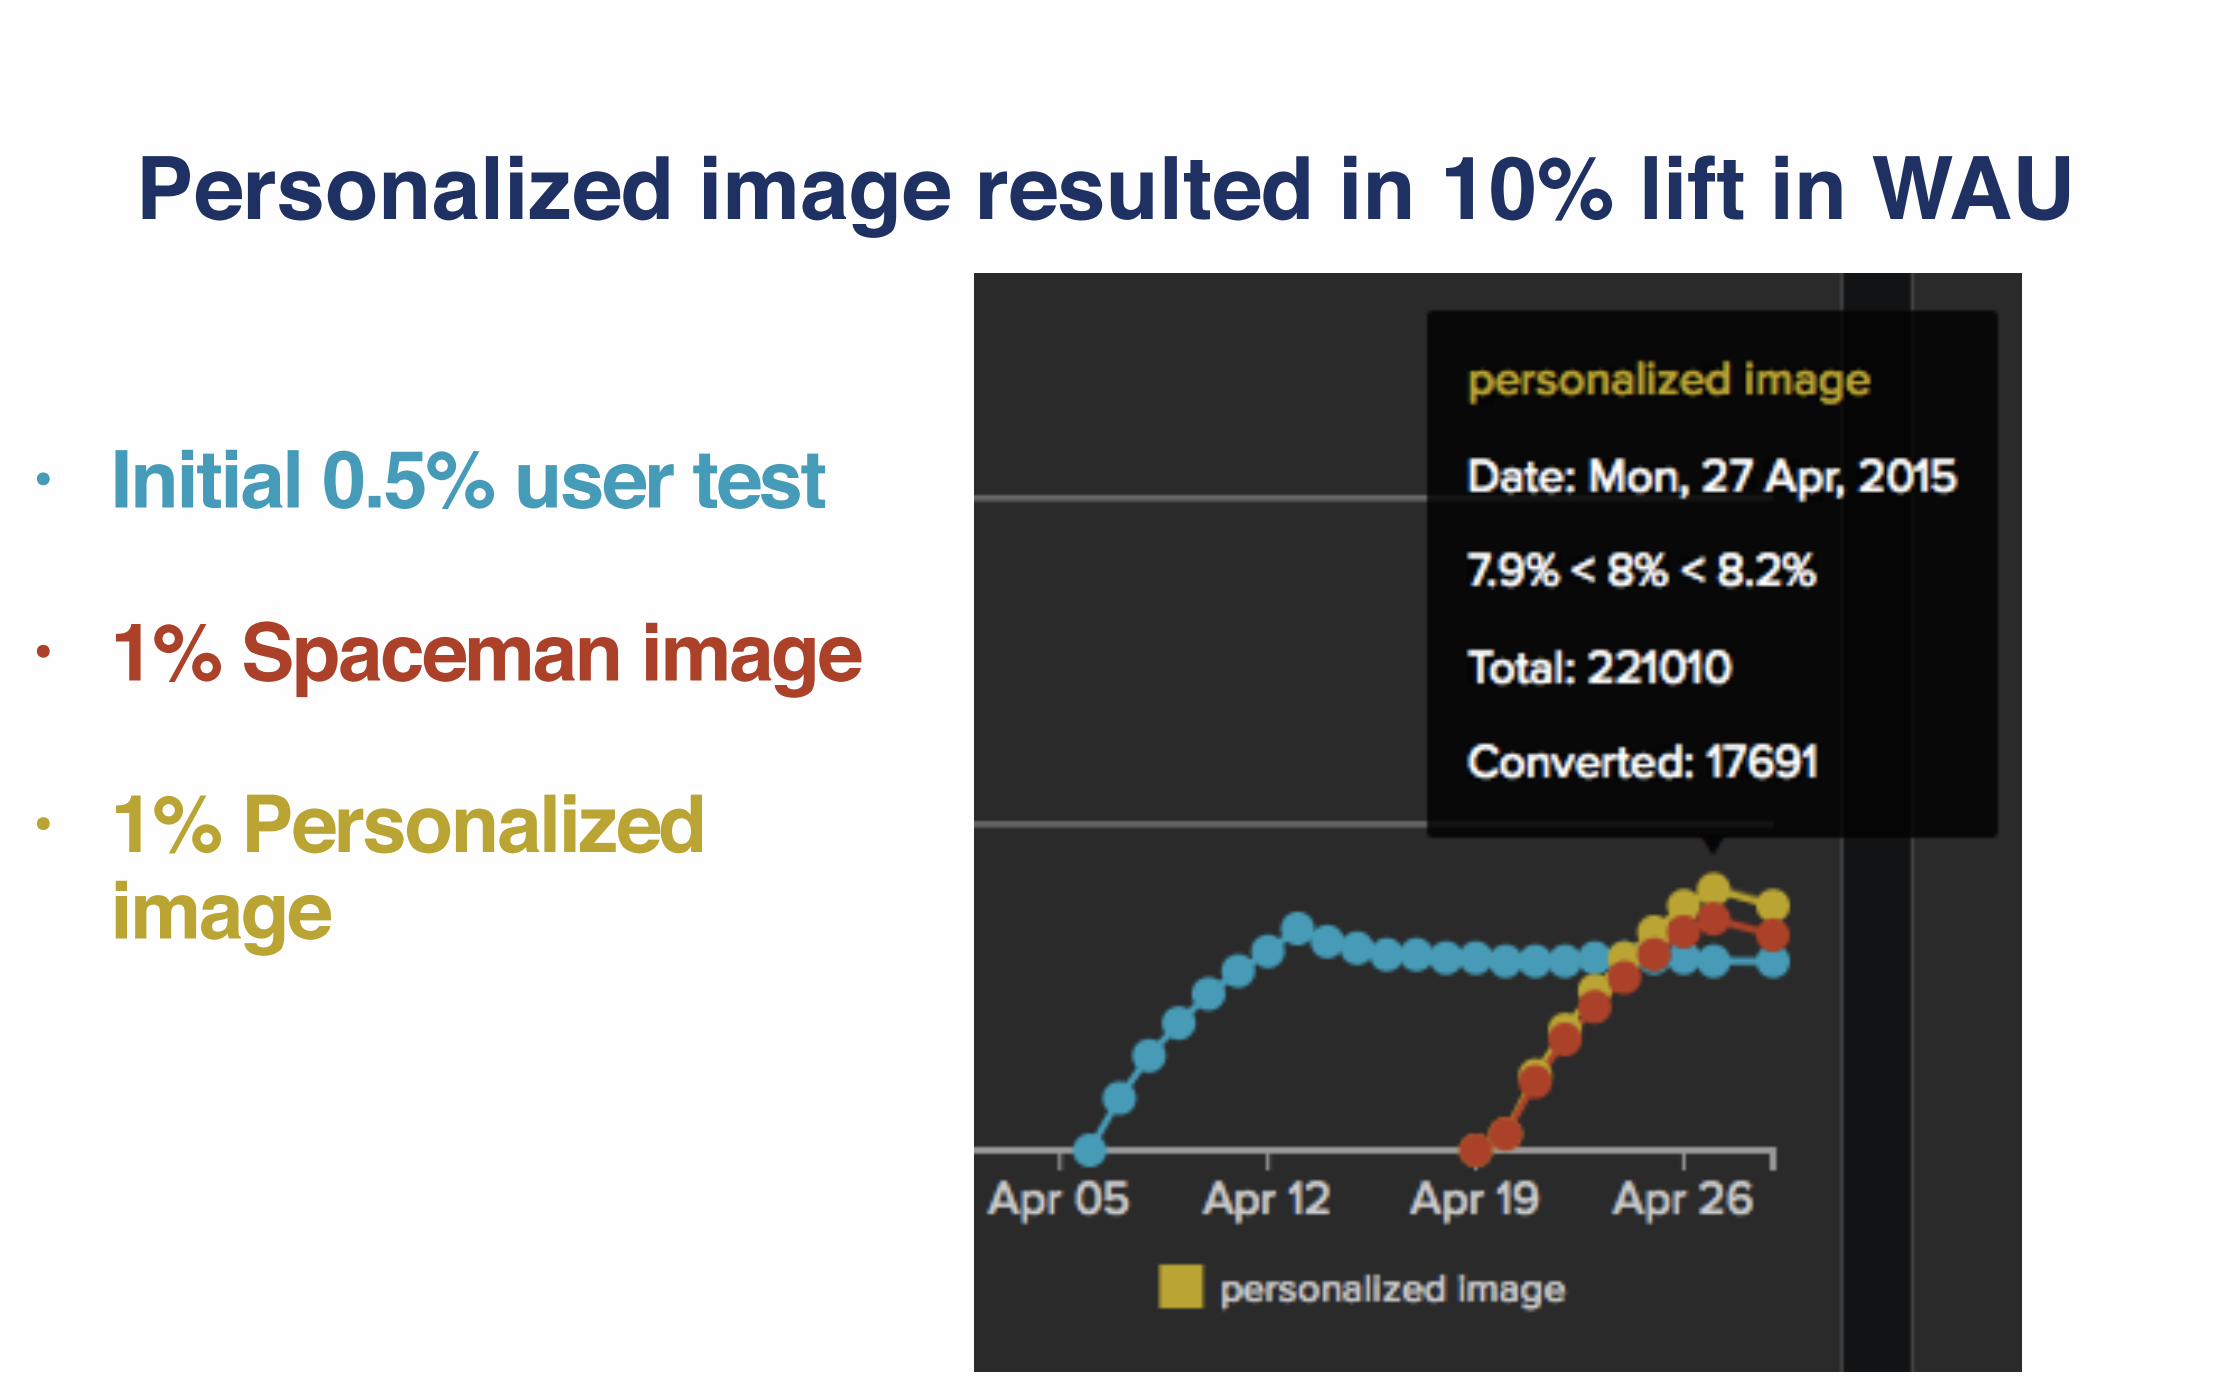
Personalized image resulted in 10% lift in WAU
• Initial 0.5% user test
• 1% Spaceman image
• 1% Personalized image
Lesson 2: Reuse existing
infrastructure in creative ways
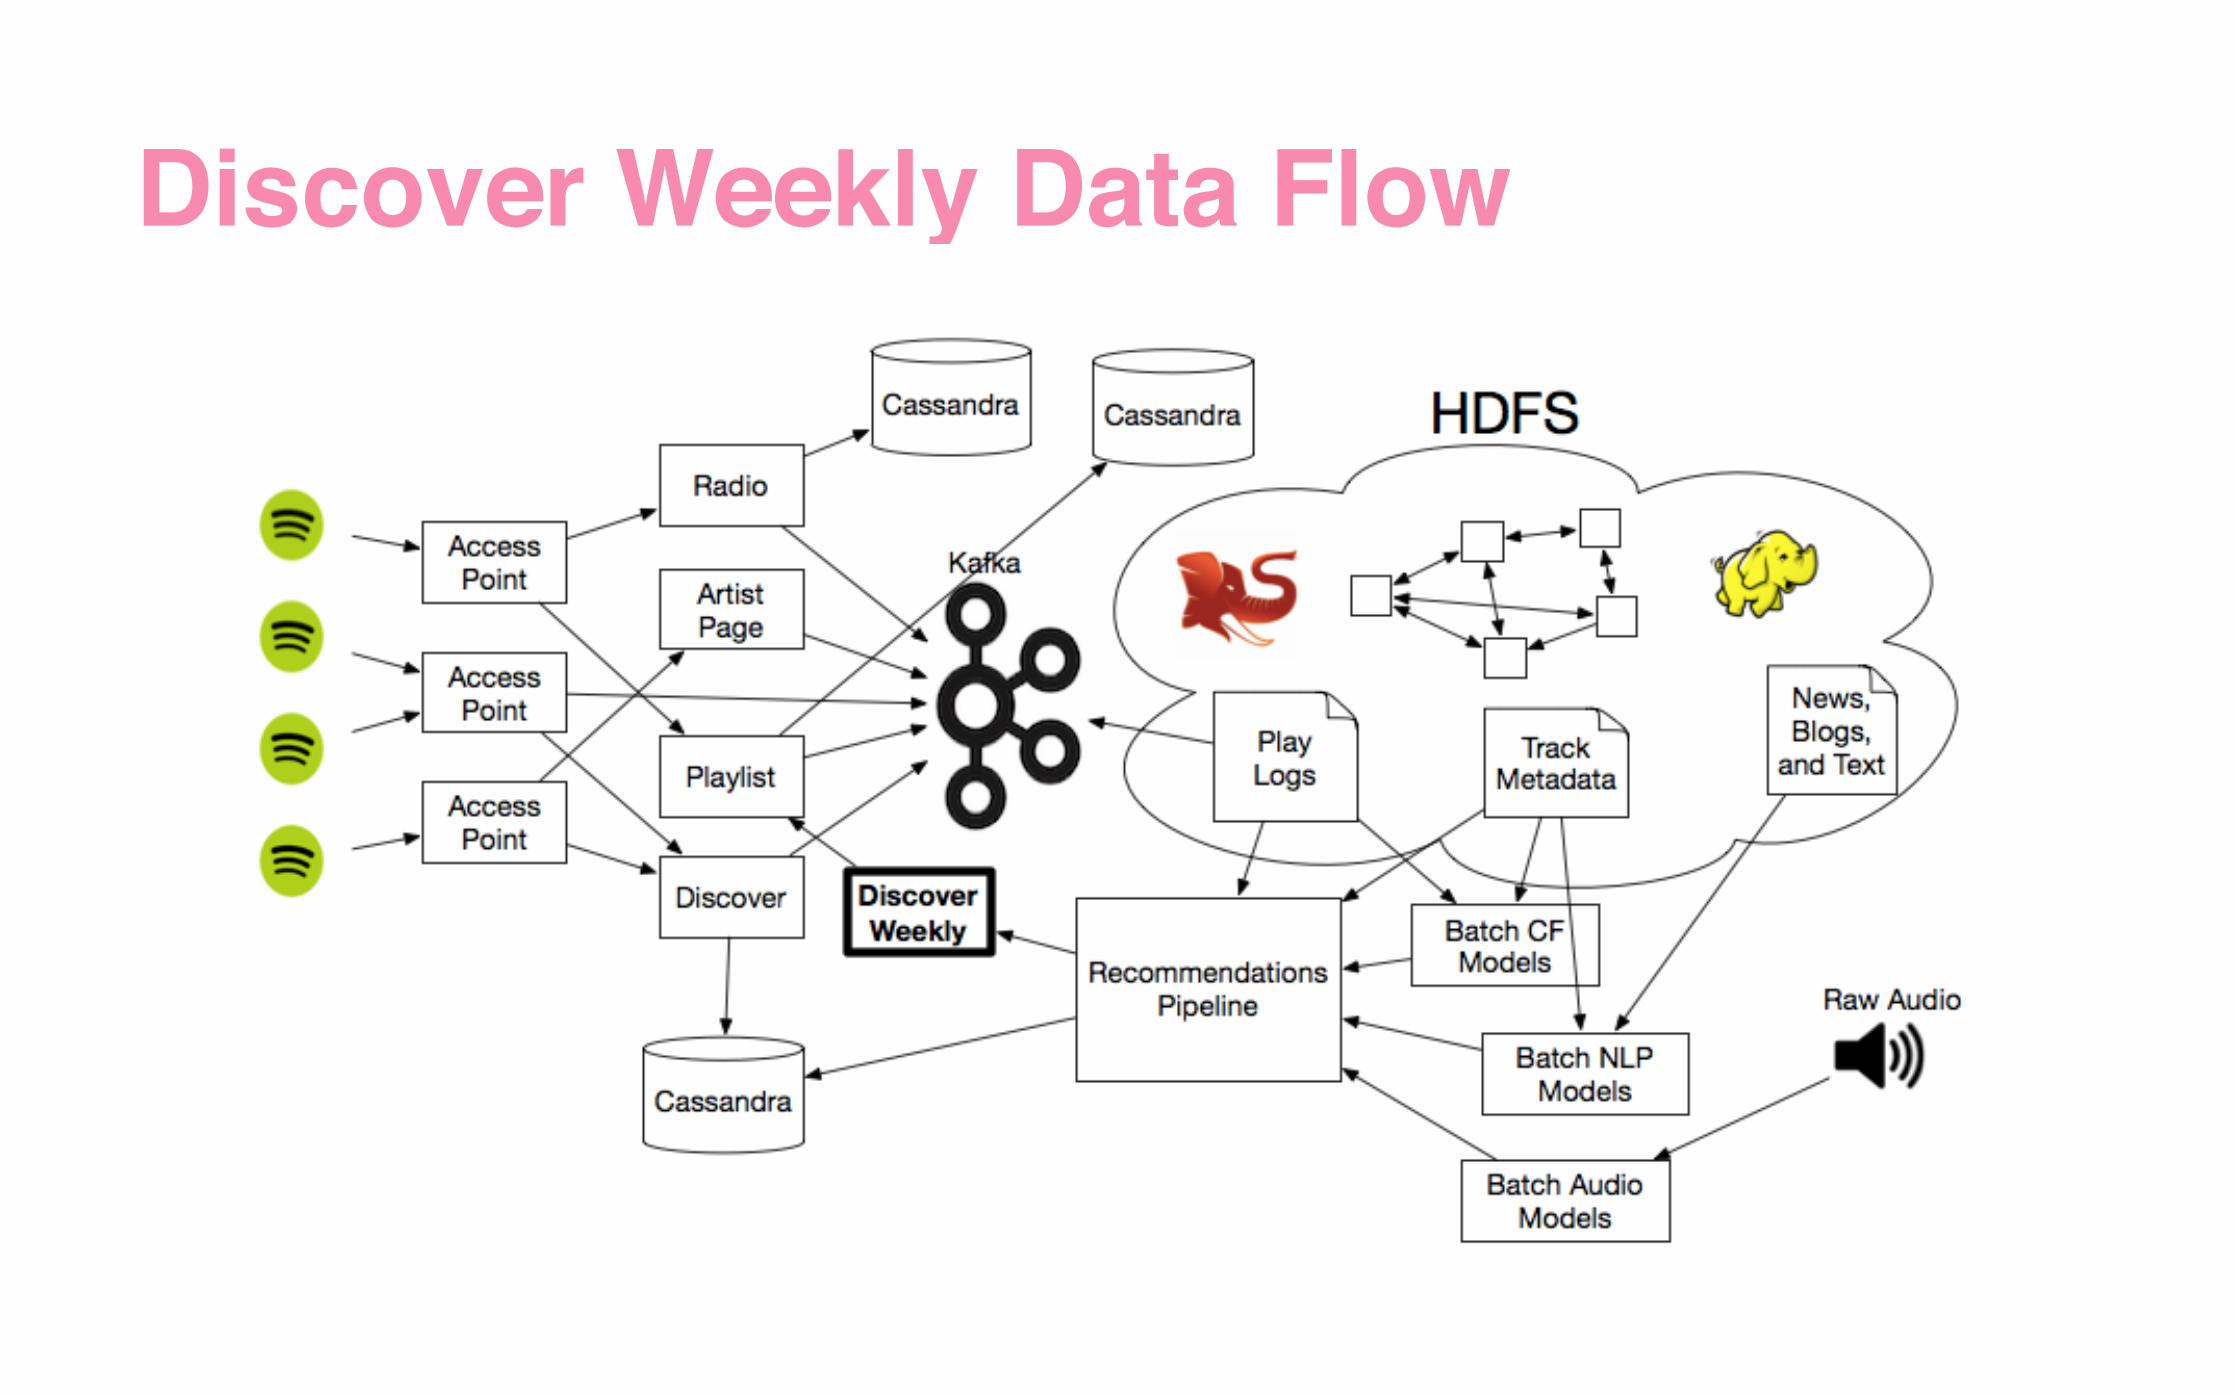
Discover Weekly Data Flow
Recommendation Models
1 0 0 0 1 0 0 10 0 1 0 0 1 0 0 1 0 1 0 0 0 1 10 1 0 0 0 1 0 0 0 0 1 0 0 1 0 0 1 0 0 0 1 0 0 1
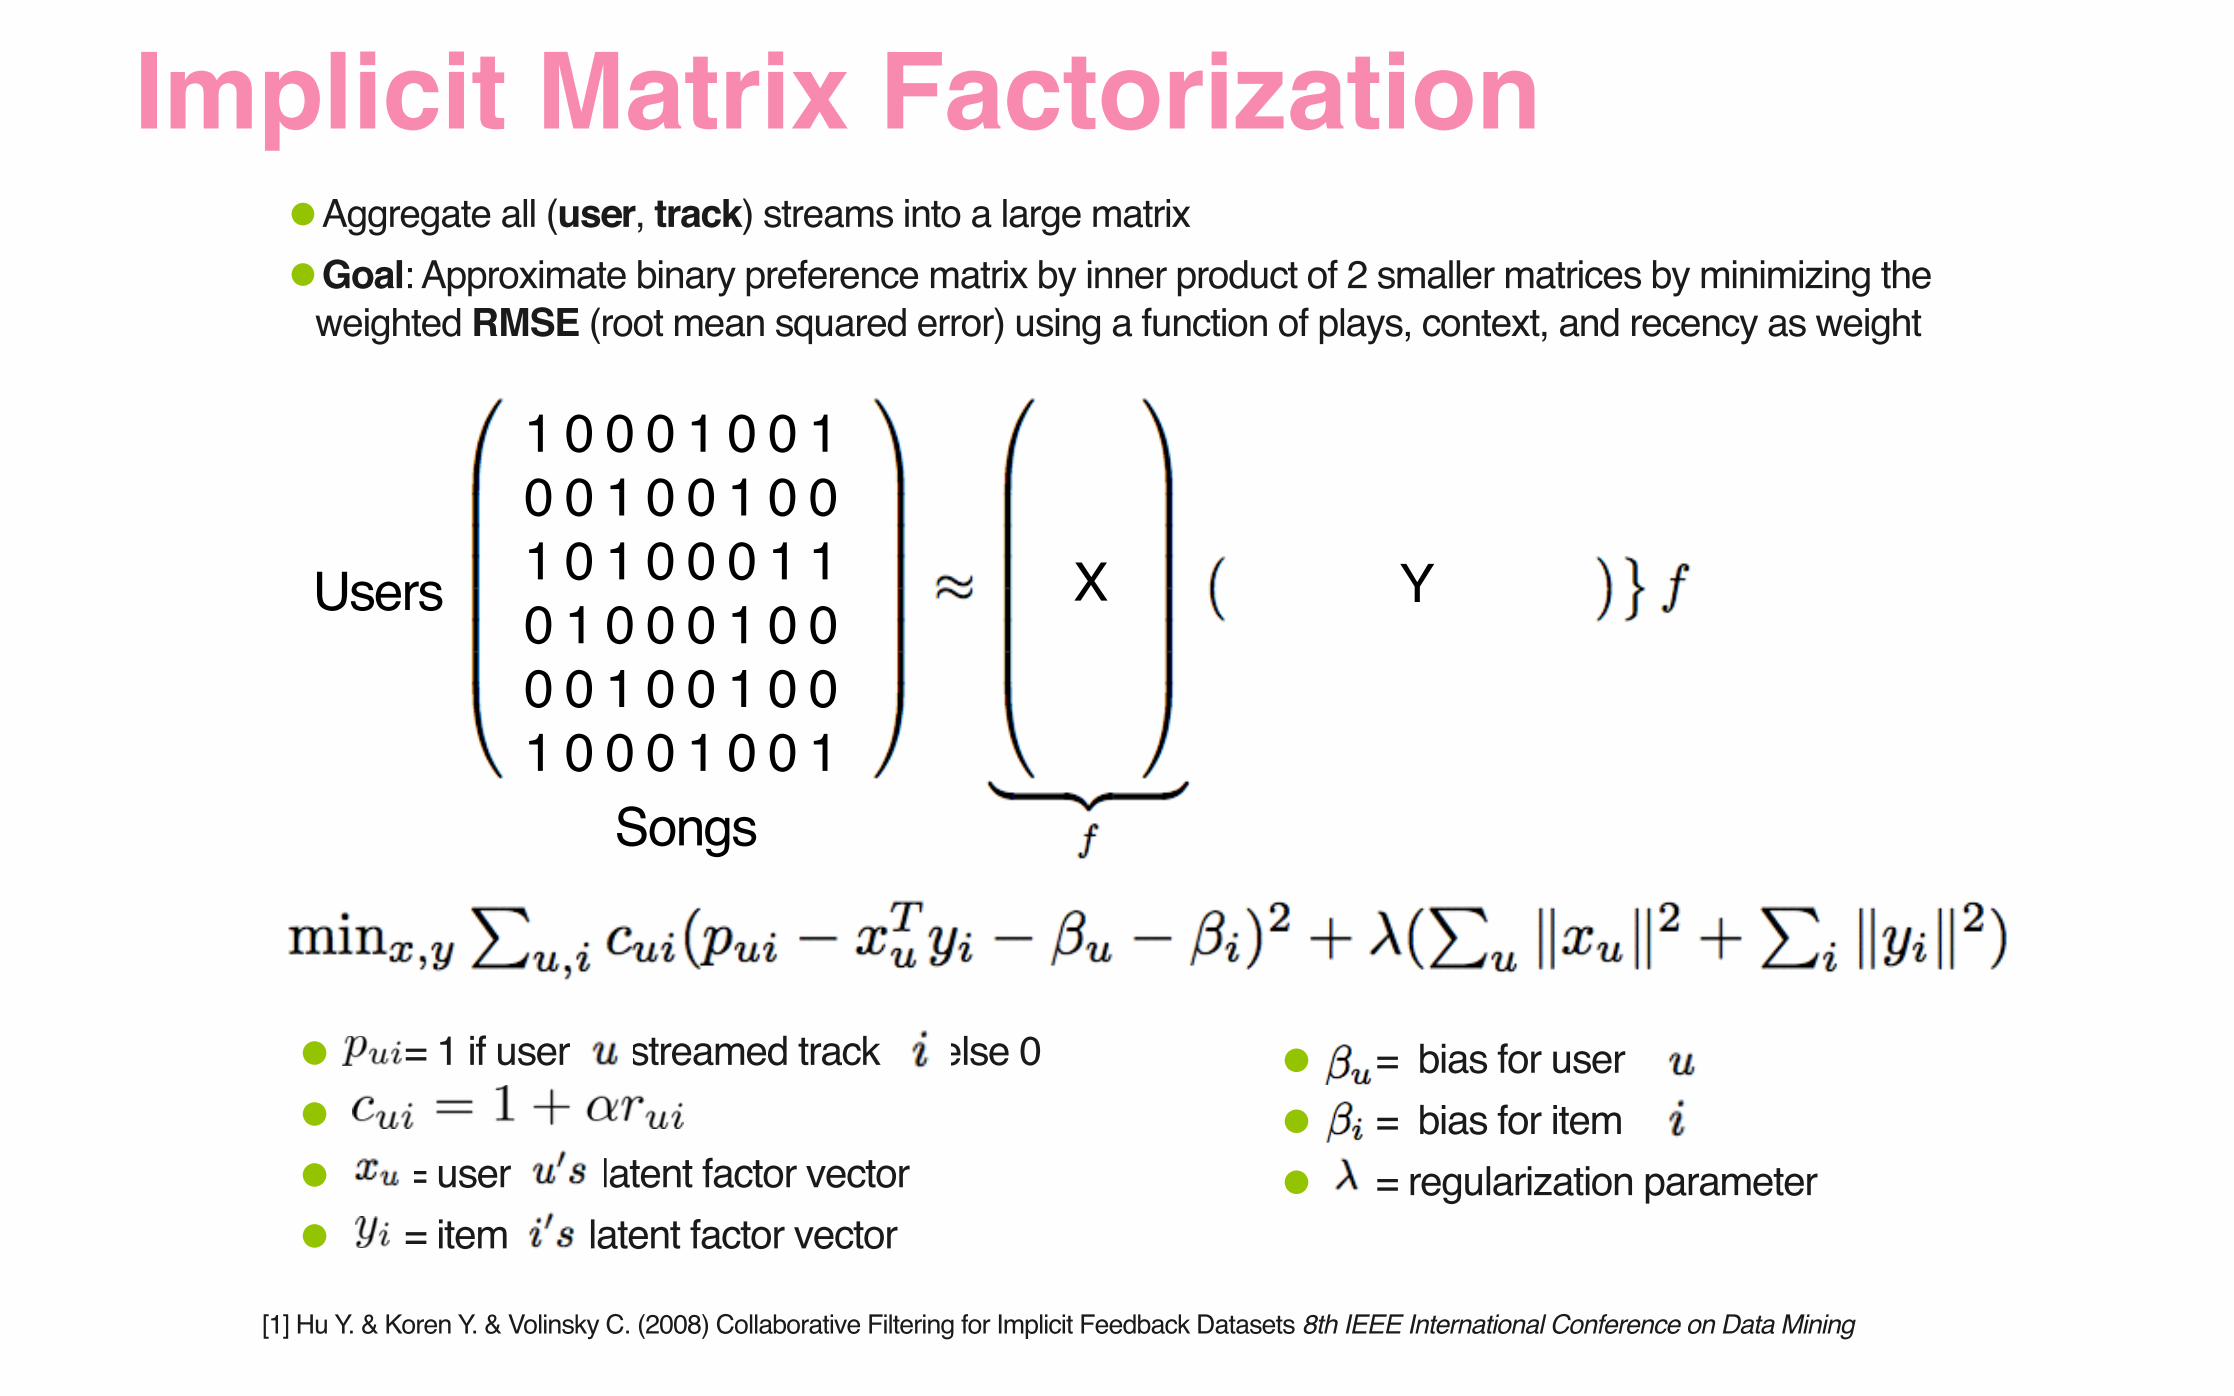
•Aggregate all (user, track) streams into a large matrix•Goal: Approximate binary preference matrix by inner product of 2 smaller matrices by minimizing the
weighted RMSE (root mean squared error) using a function of plays, context, and recency as weight
X YUsers
Songs
• = bias for user• = bias for item• = regularization parameter
• = 1 if user streamed track else 0• • = user latent factor vector• = item latent factor vector
[1] Hu Y. & Koren Y. & Volinsky C. (2008) Collaborative Filtering for Implicit Feedback Datasets 8th IEEE International Conference on Data Mining
Implicit Matrix Factorization
1 0 0 0 1 0 0 10 0 1 0 0 1 0 0 1 0 1 0 0 0 1 10 1 0 0 0 1 0 0 0 0 1 0 0 1 0 0 1 0 0 0 1 0 0 1
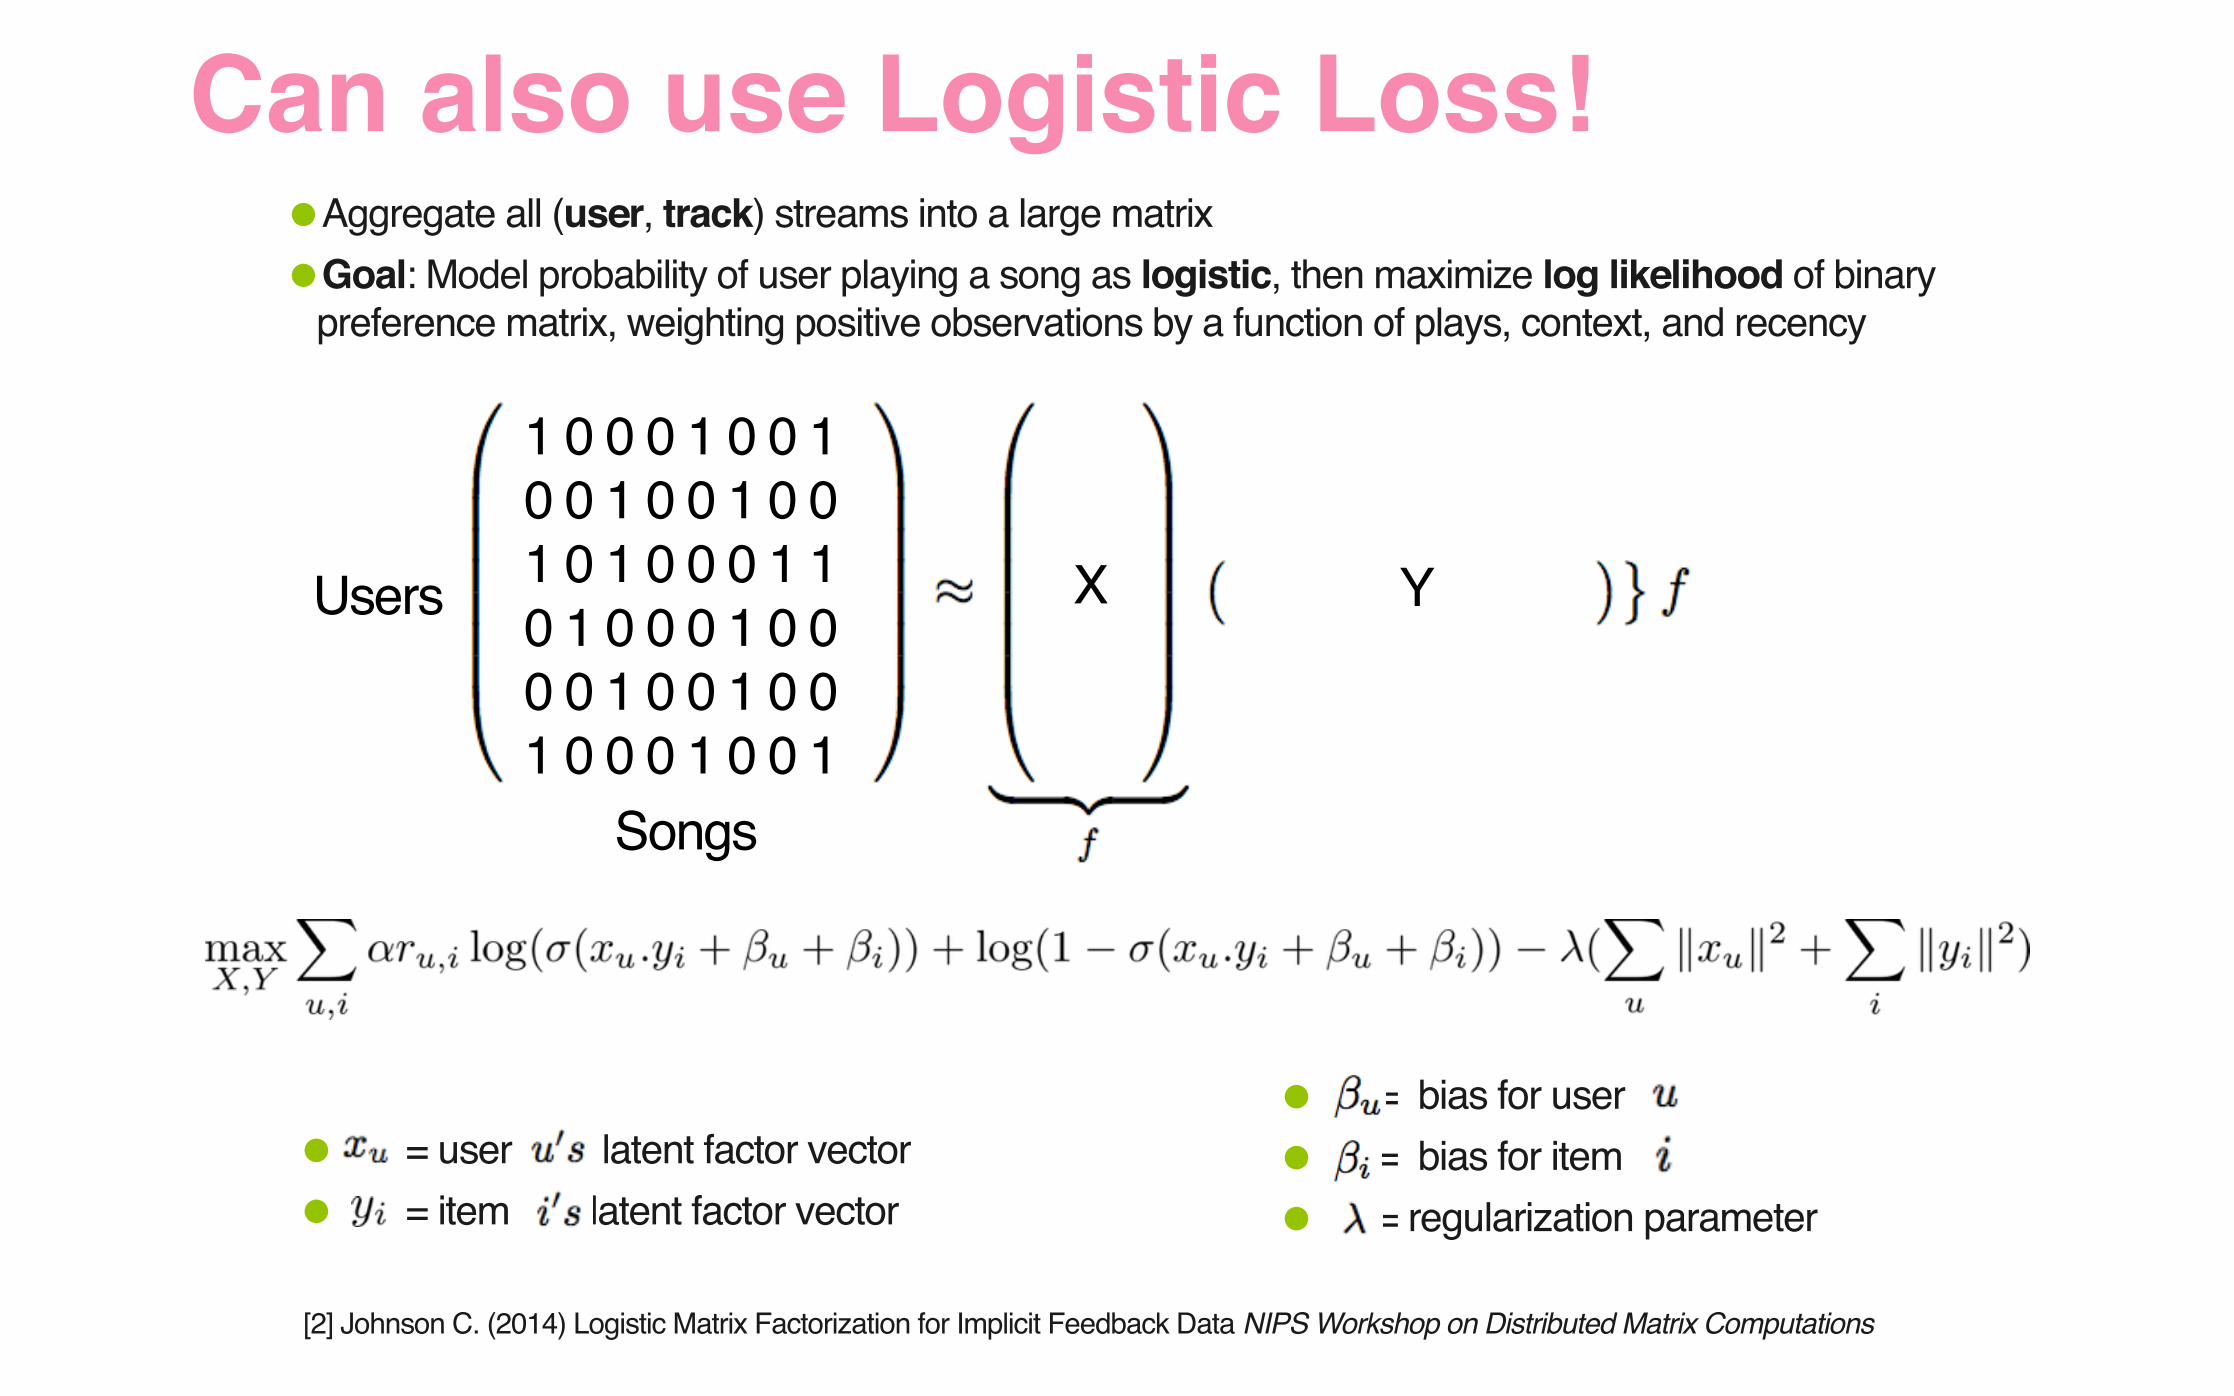
•Aggregate all (user, track) streams into a large matrix•Goal: Model probability of user playing a song as logistic, then maximize log likelihood of binary
preference matrix, weighting positive observations by a function of plays, context, and recency
X YUsers
Songs
• = bias for user• = bias for item• = regularization parameter
• = user latent factor vector• = item latent factor vector
[2] Johnson C. (2014) Logistic Matrix Factorization for Implicit Feedback Data NIPS Workshop on Distributed Matrix Computations
Can also use Logistic Loss!
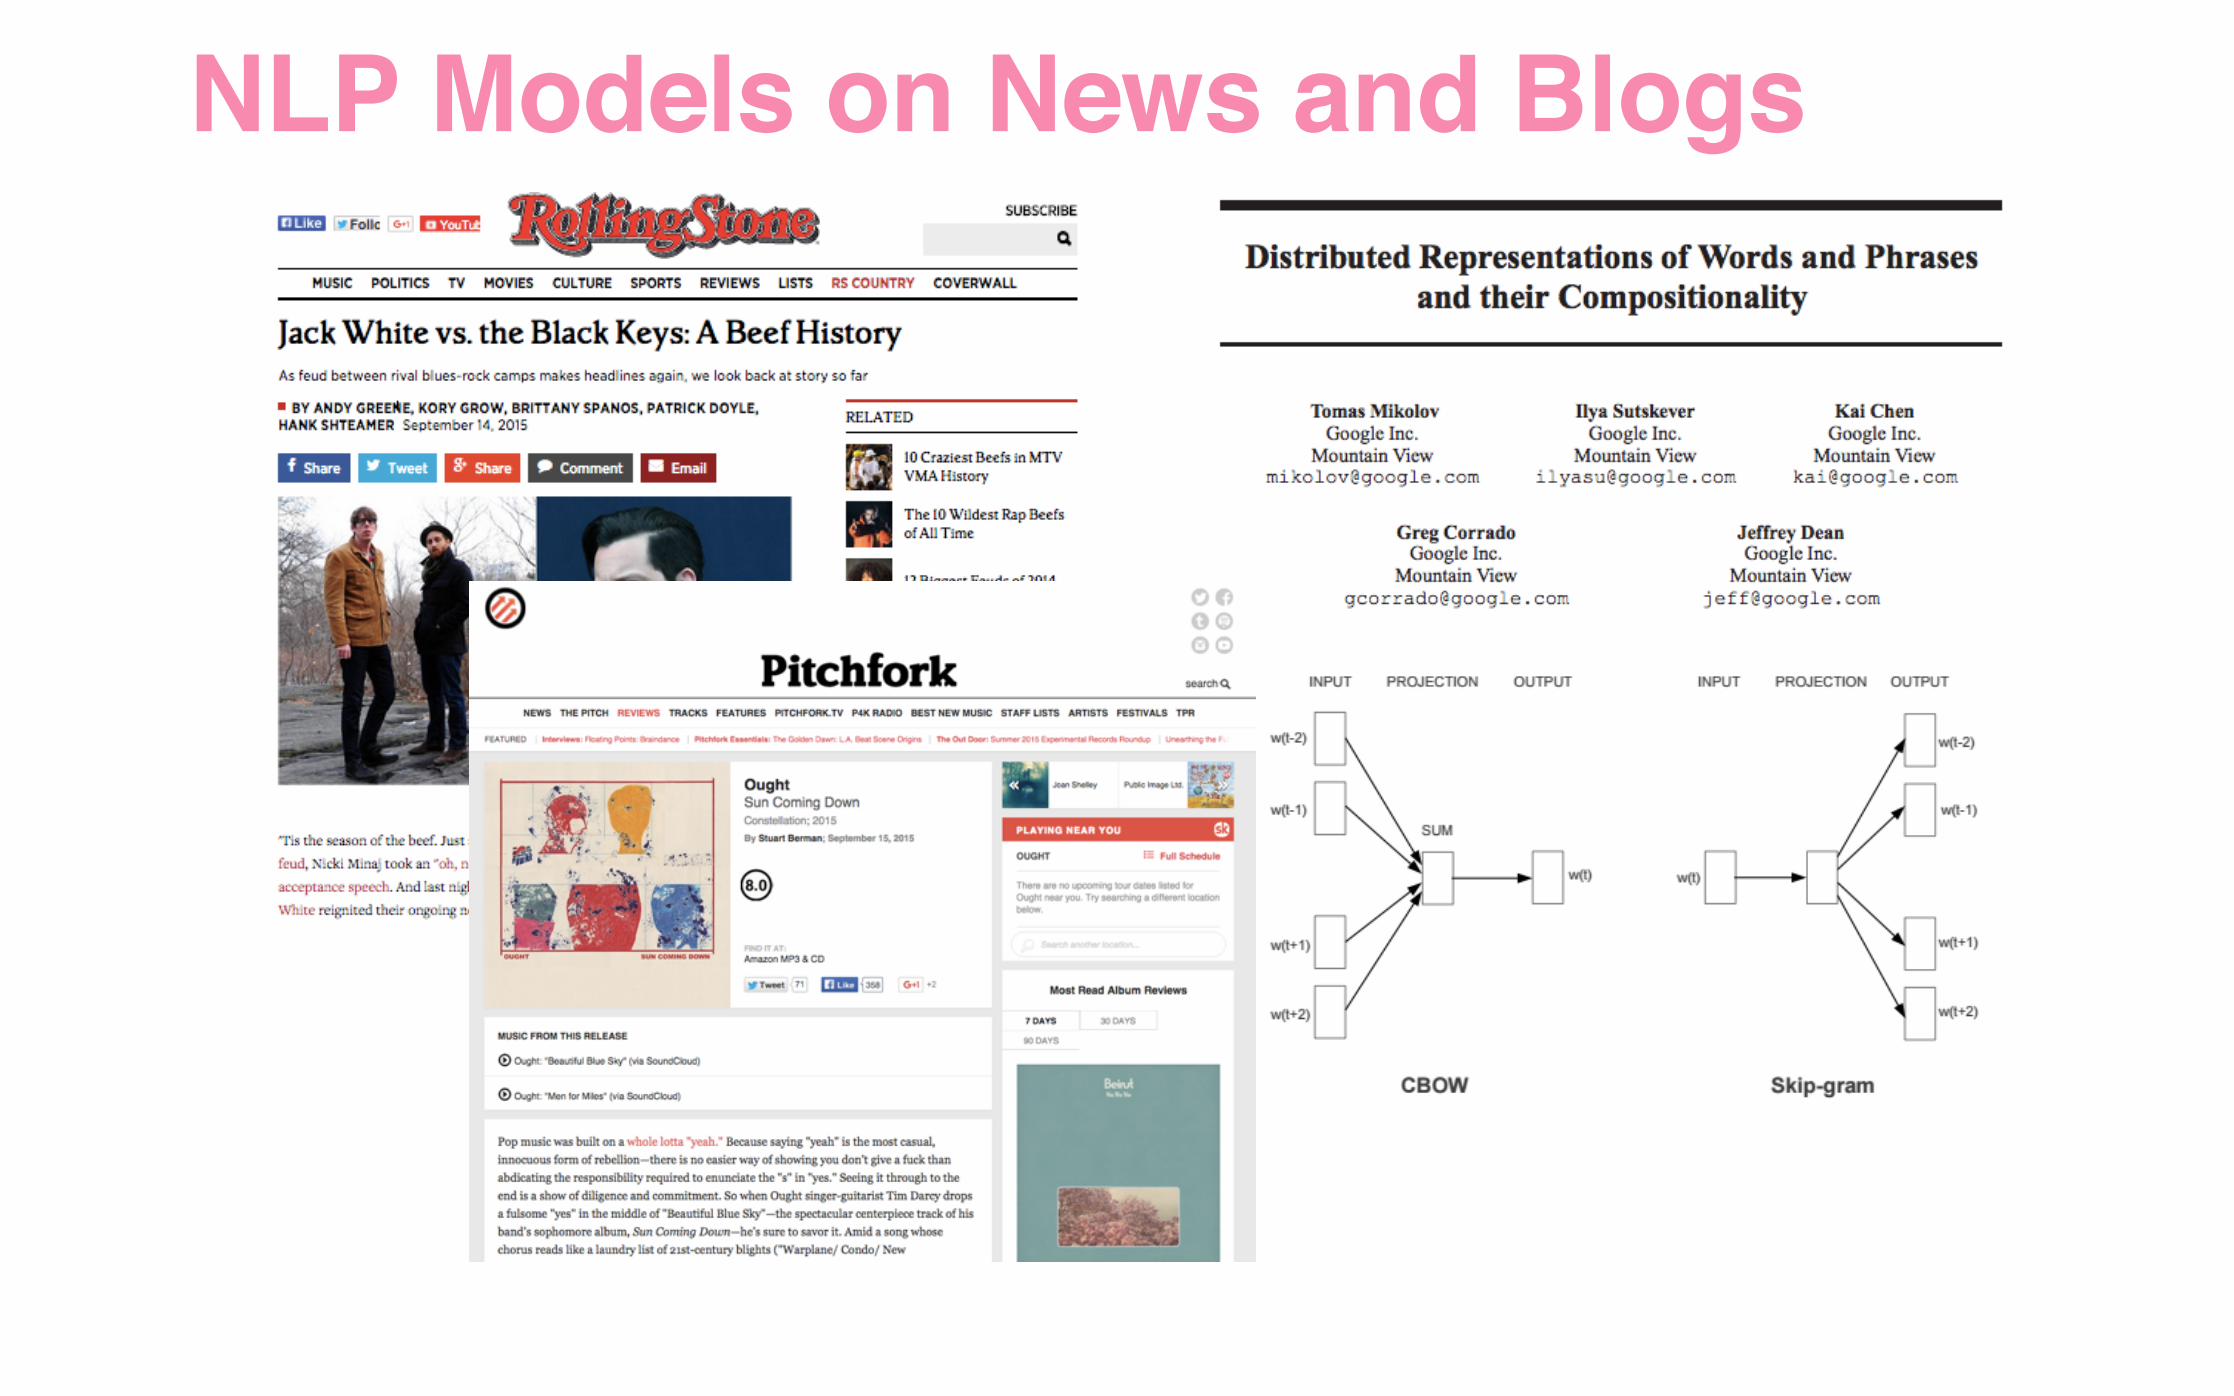
NLP Models on News and Blogs
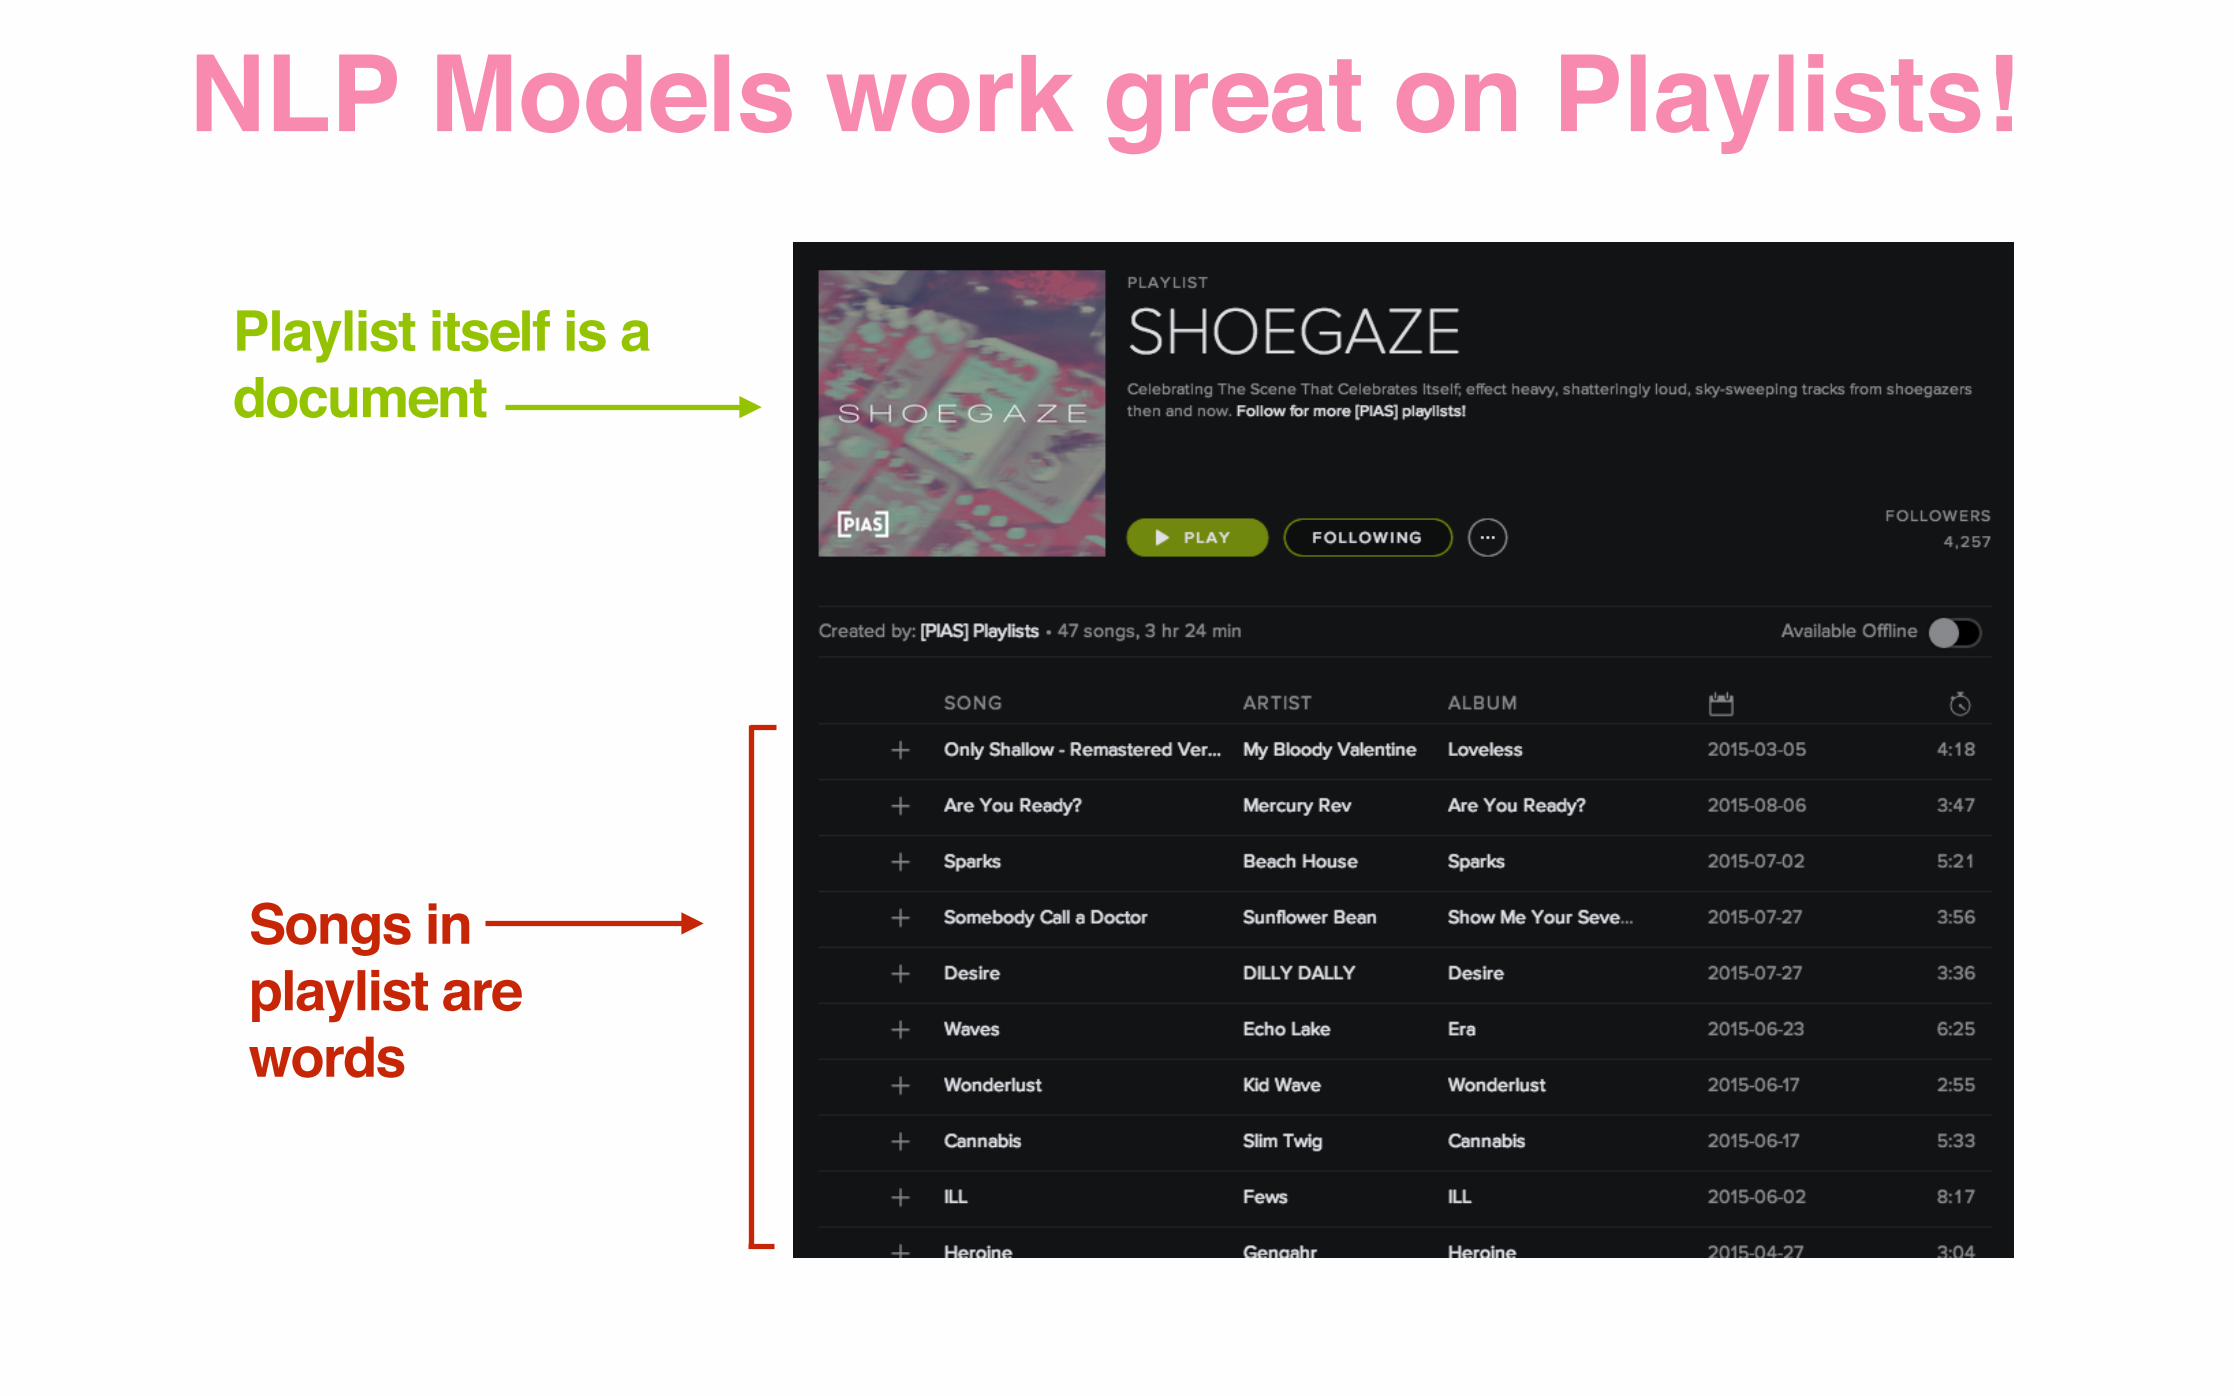
Playlist itself is a document
Songs in playlist are words
NLP Models work great on Playlists!
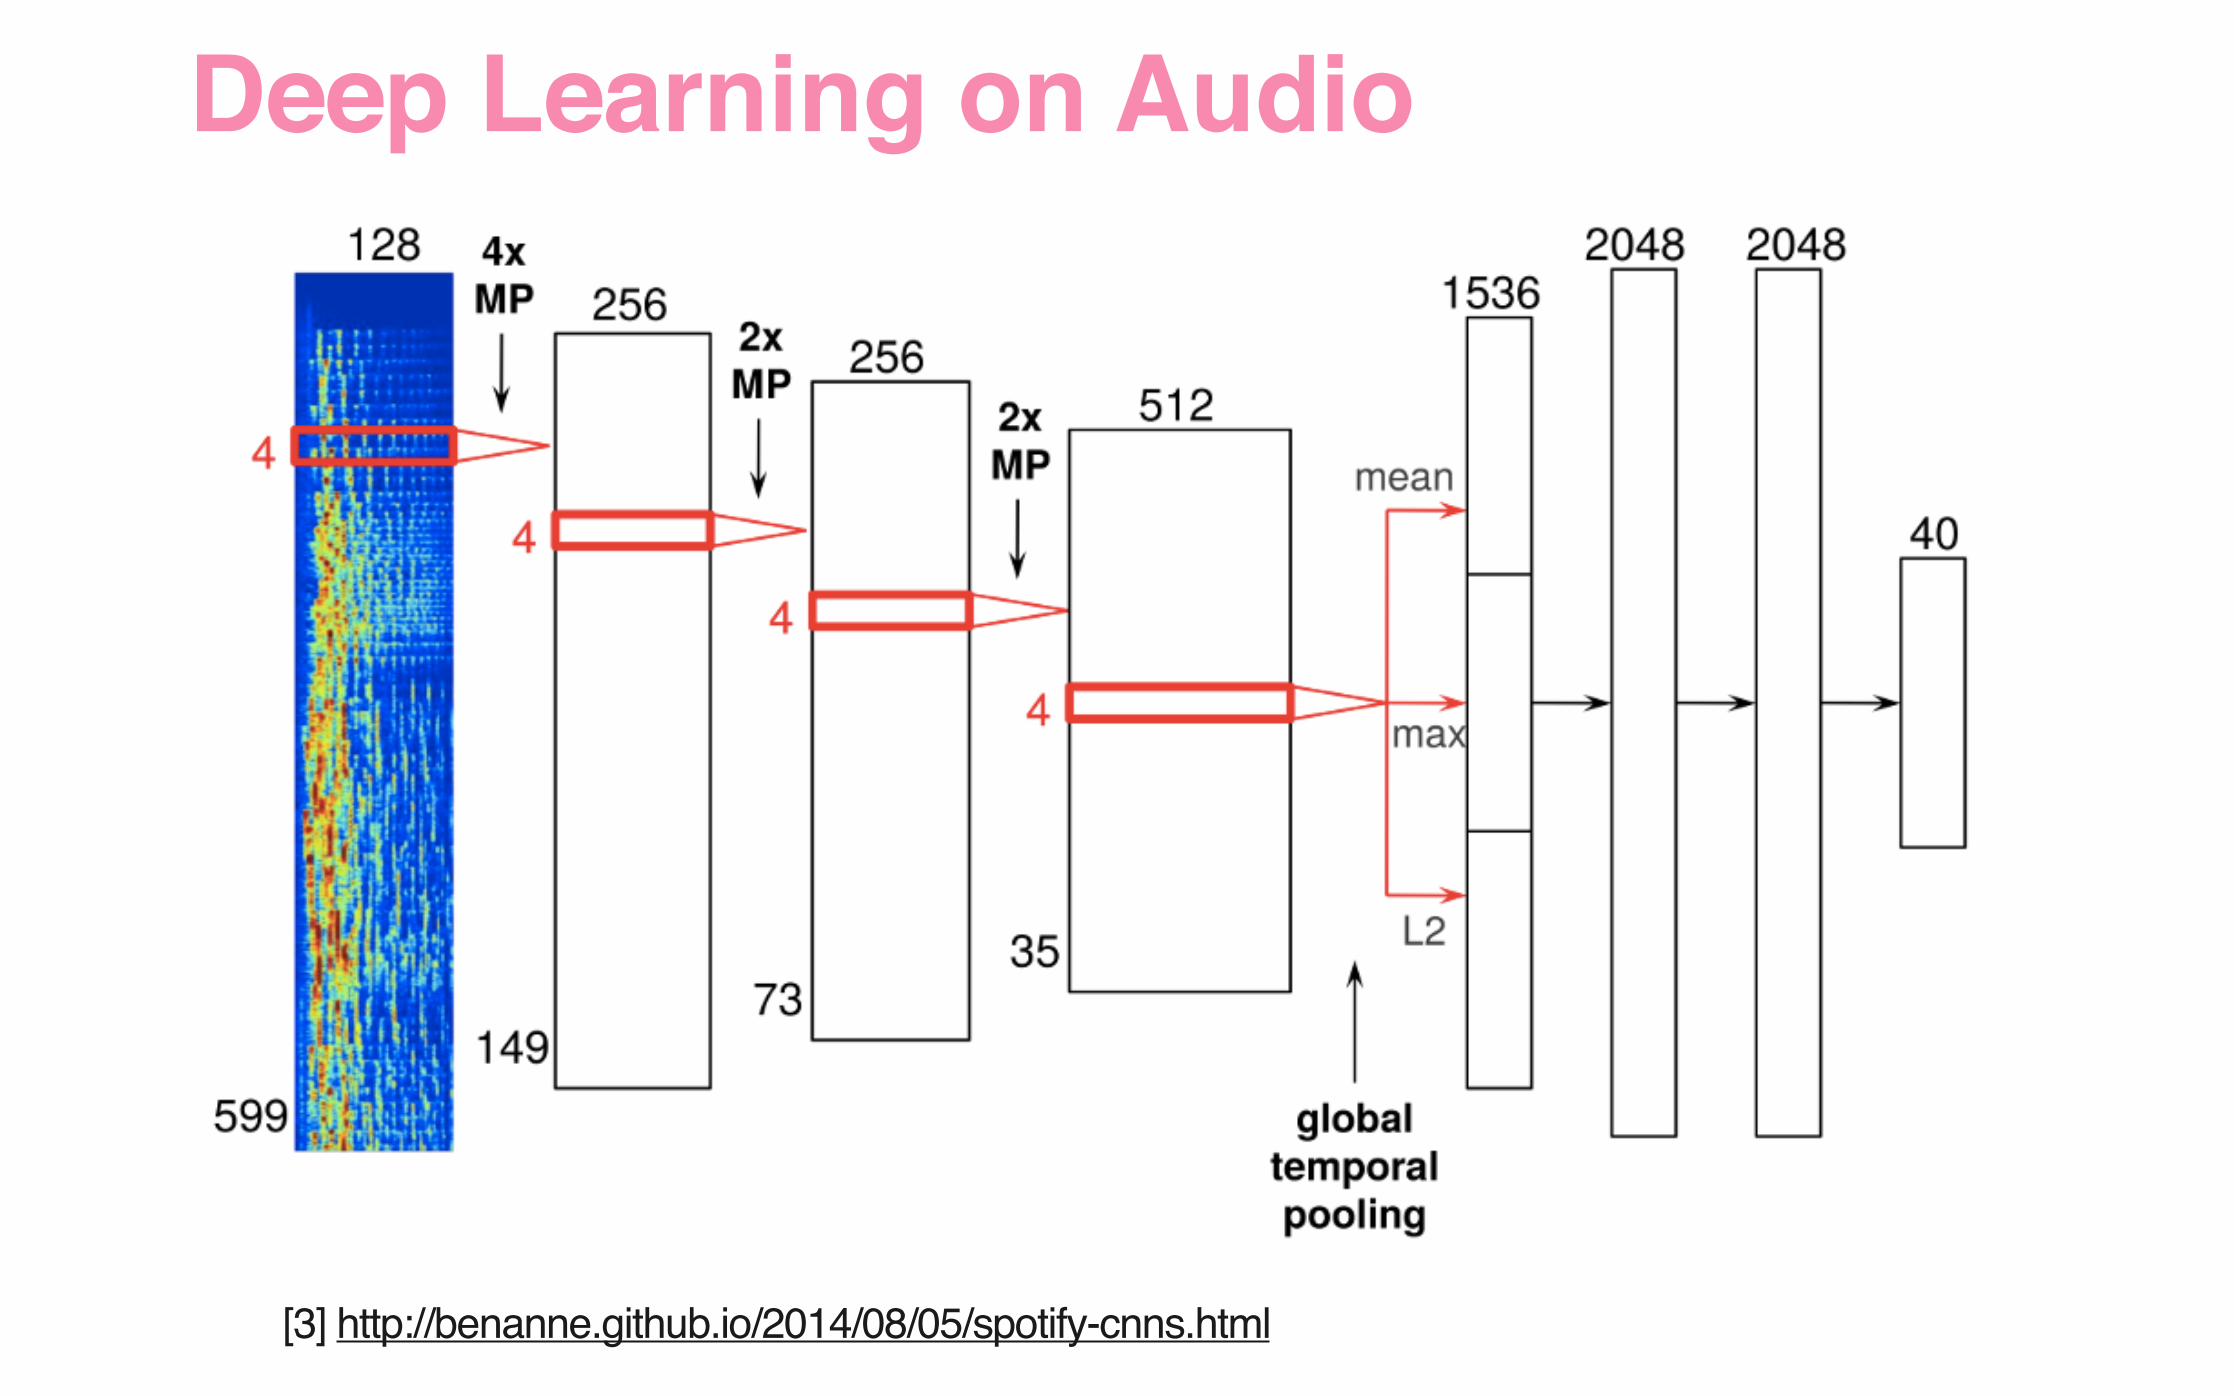
[3] http://benanne.github.io/2014/08/05/spotify-cnns.html
Deep Learning on Audio
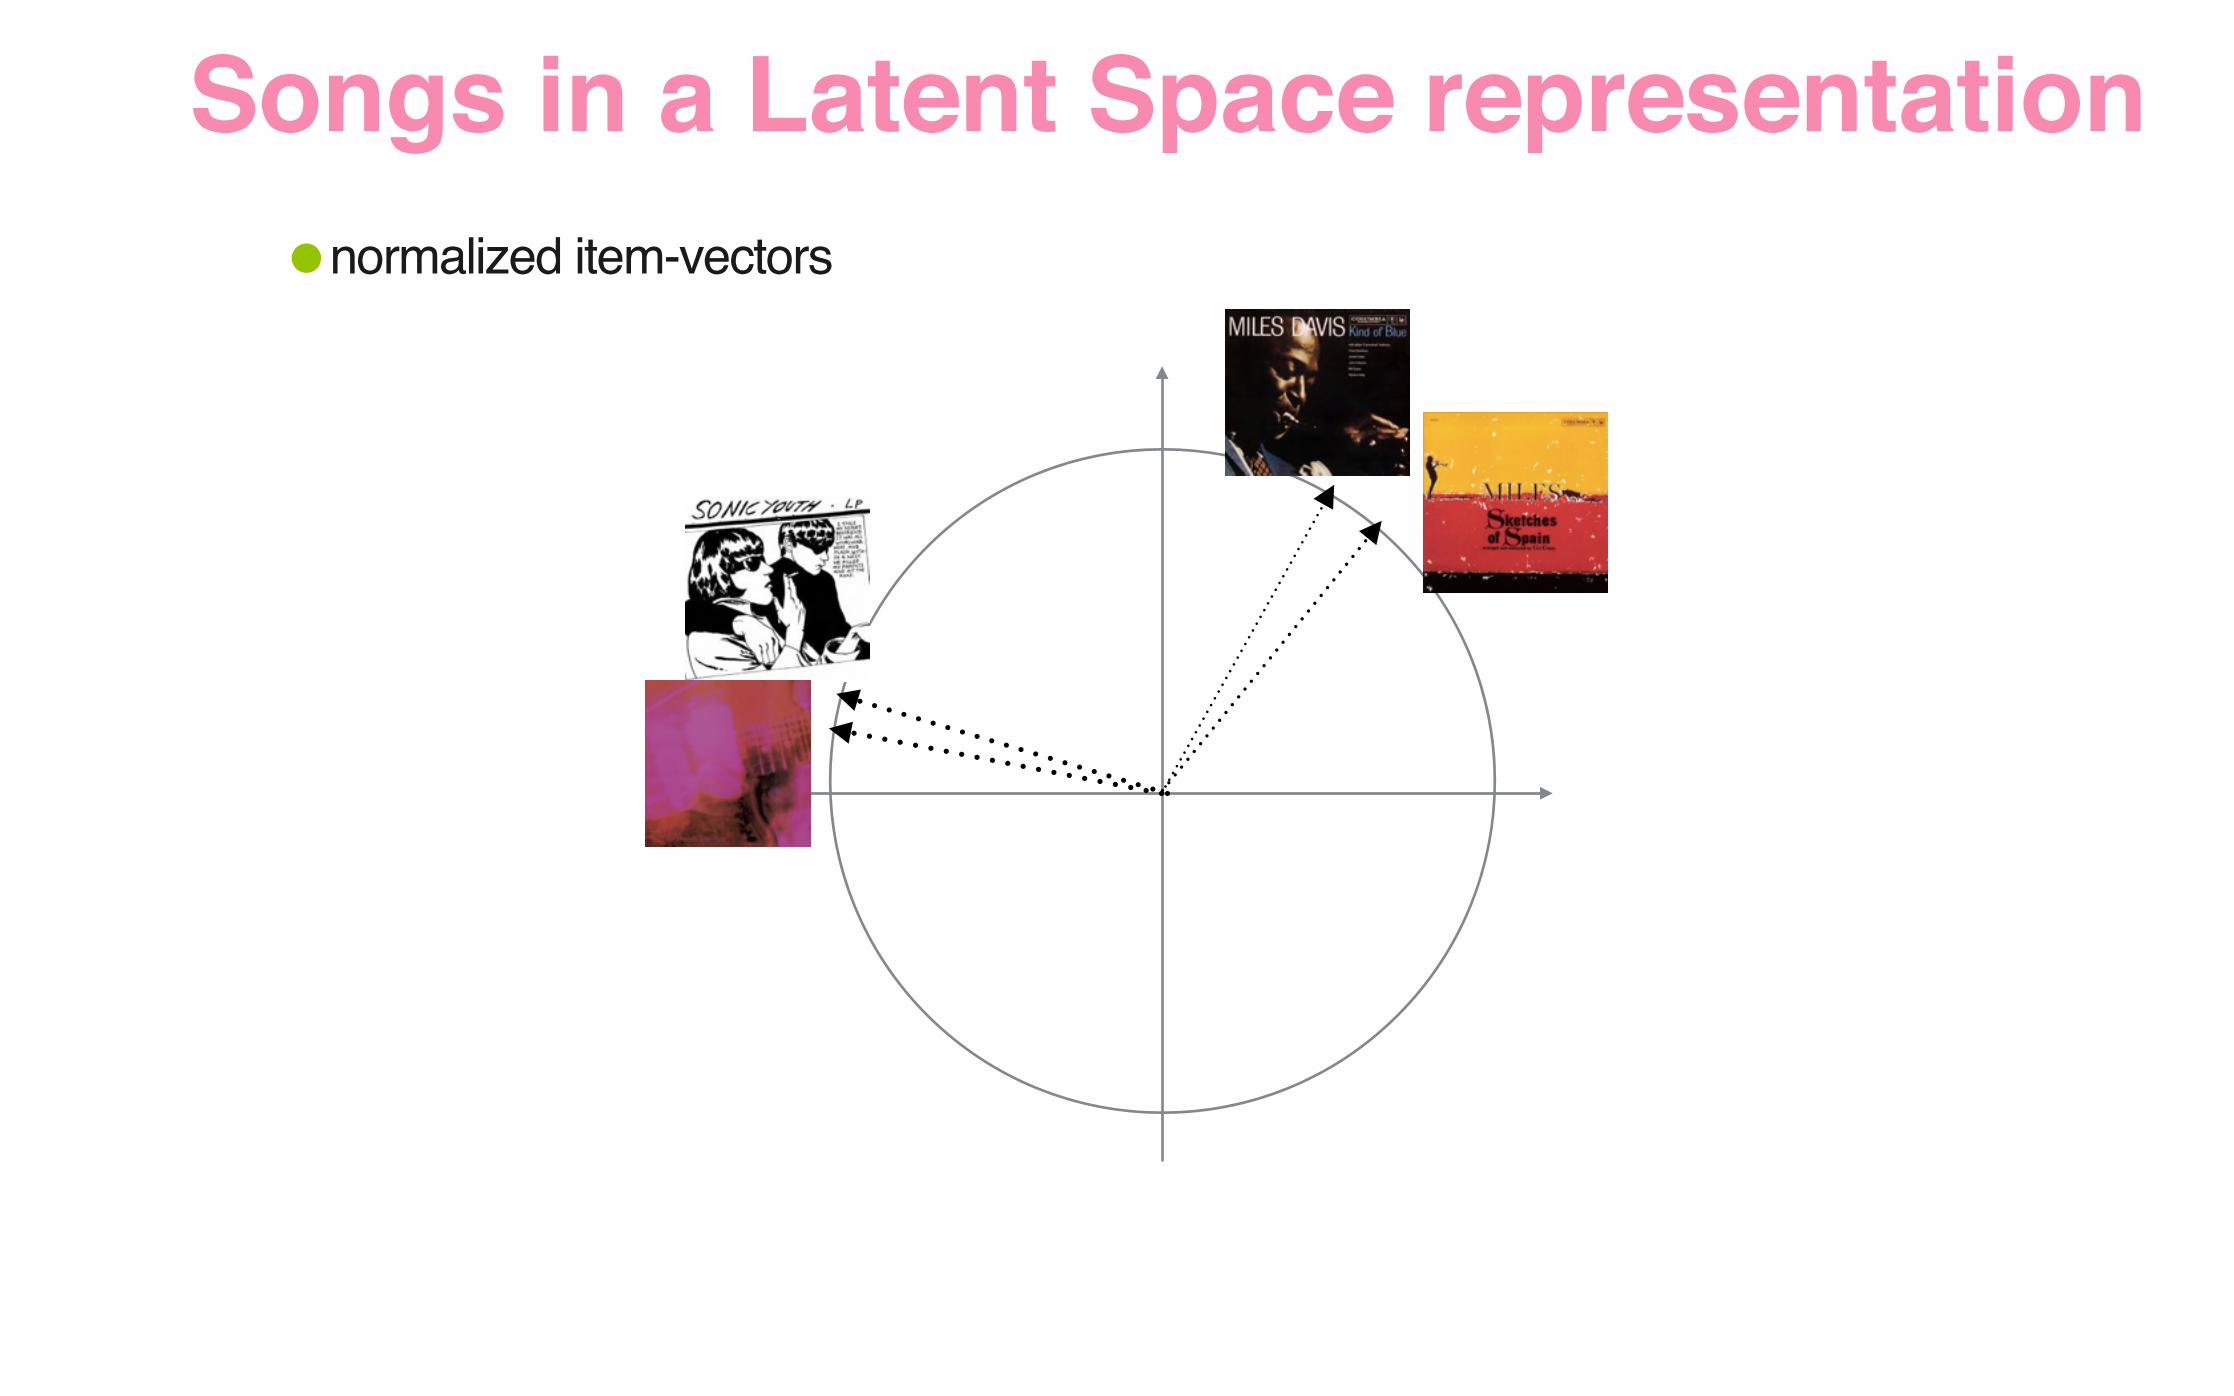
•normalized item-vectors
Songs in a Latent Space representation
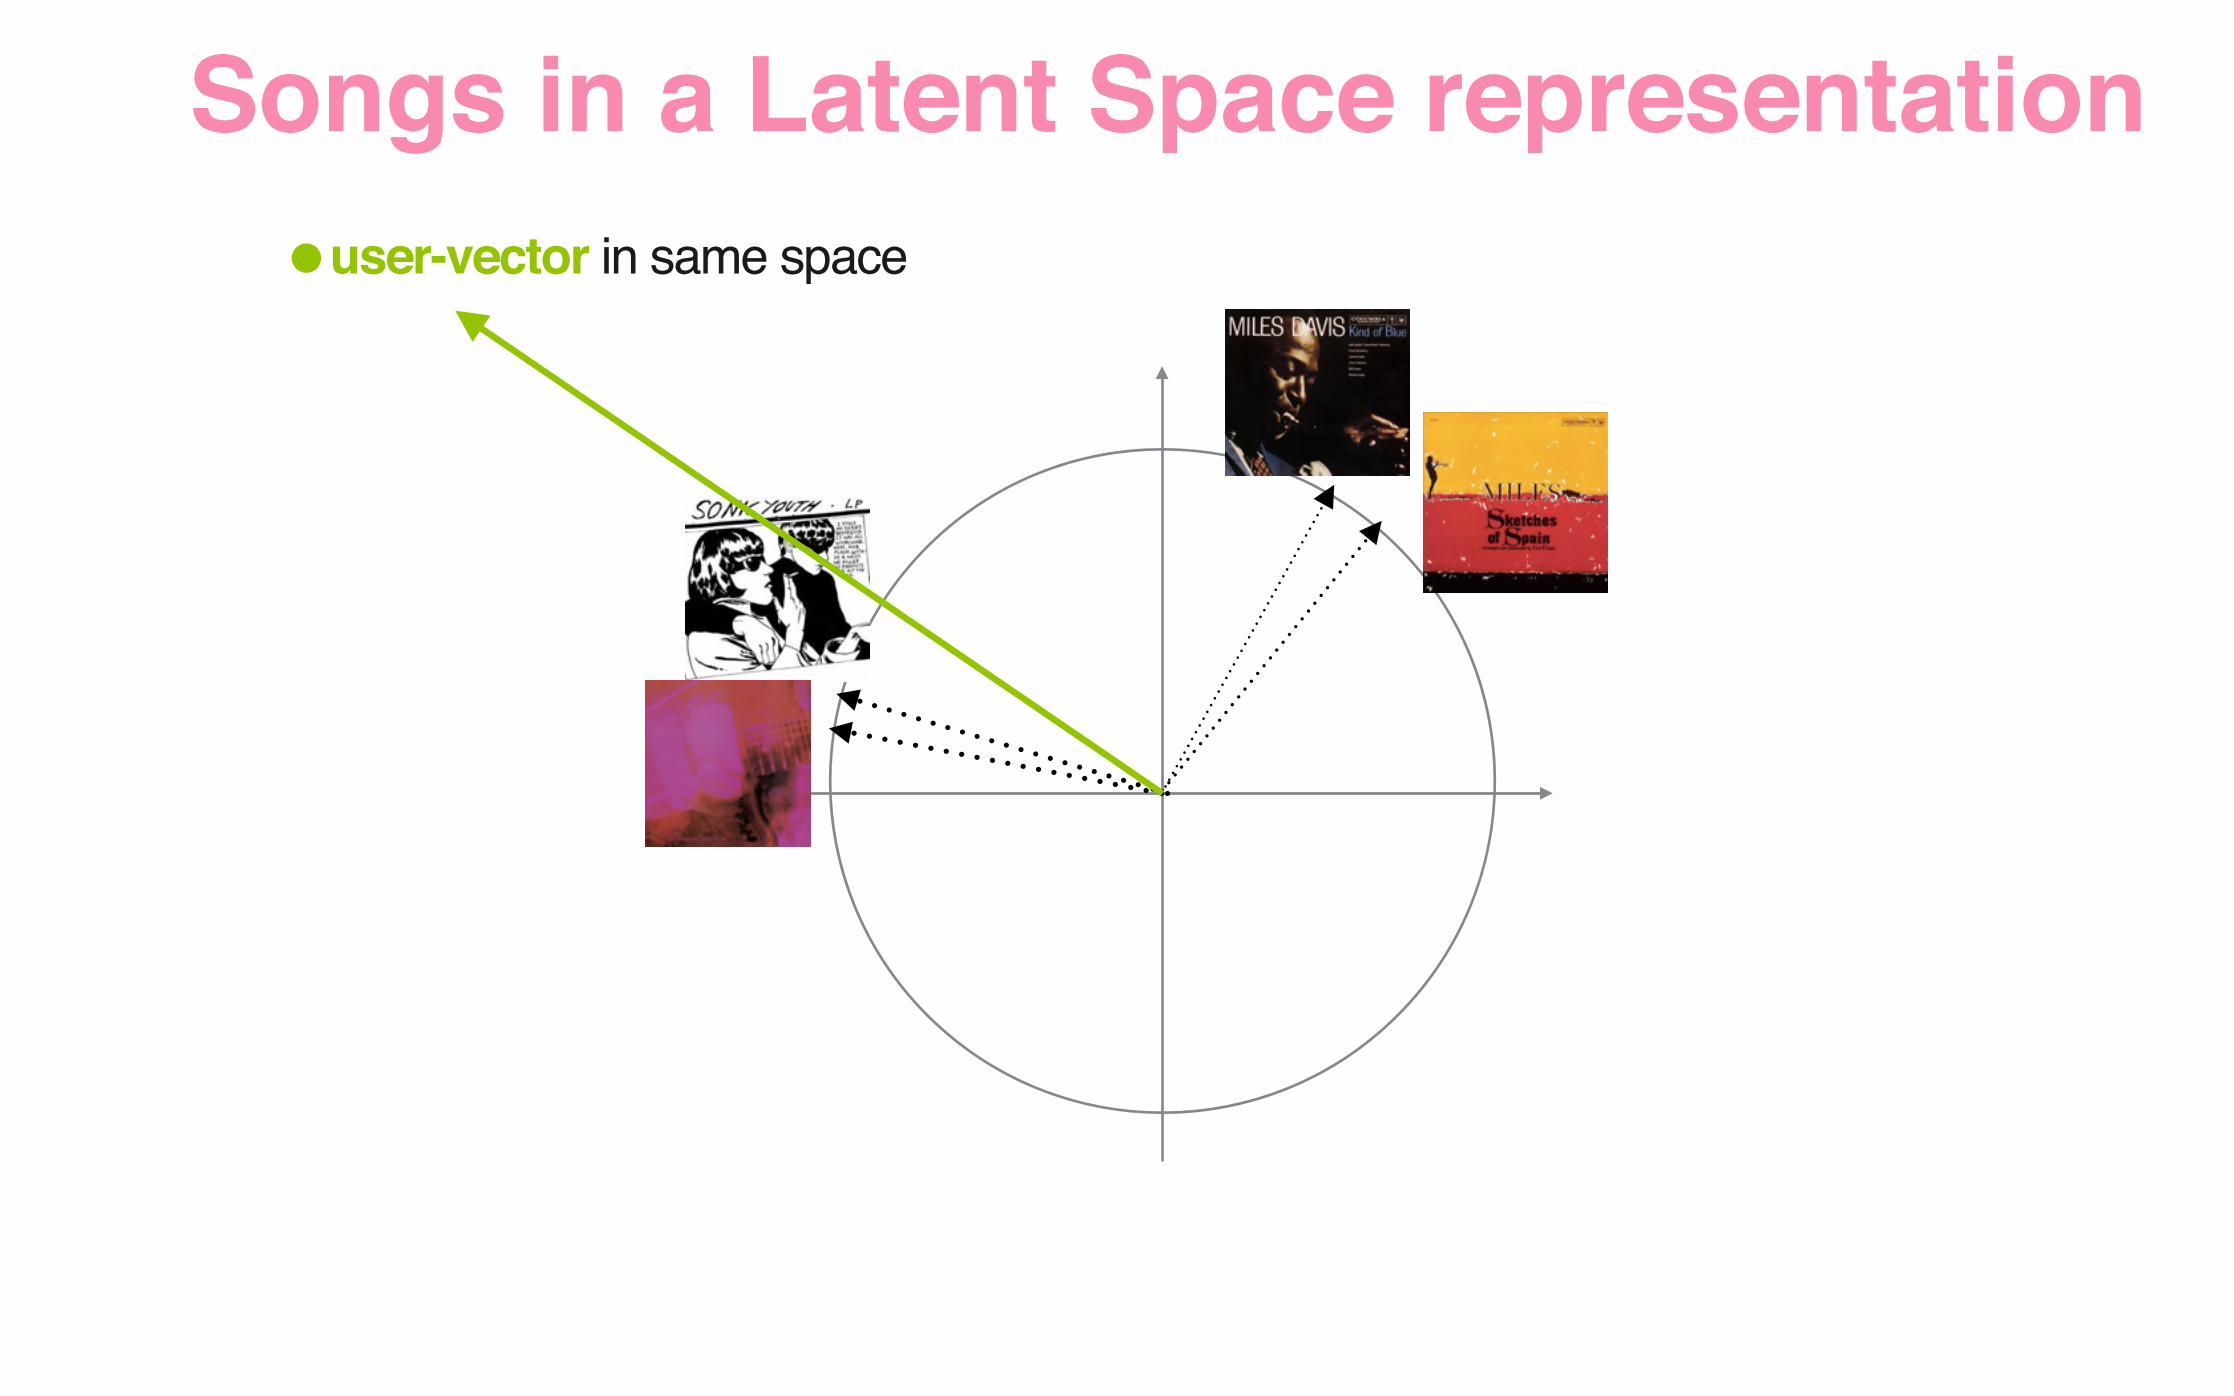
•user-vector in same space
Songs in a Latent Space representation
Lesson 3: Don’t scale until
you need to
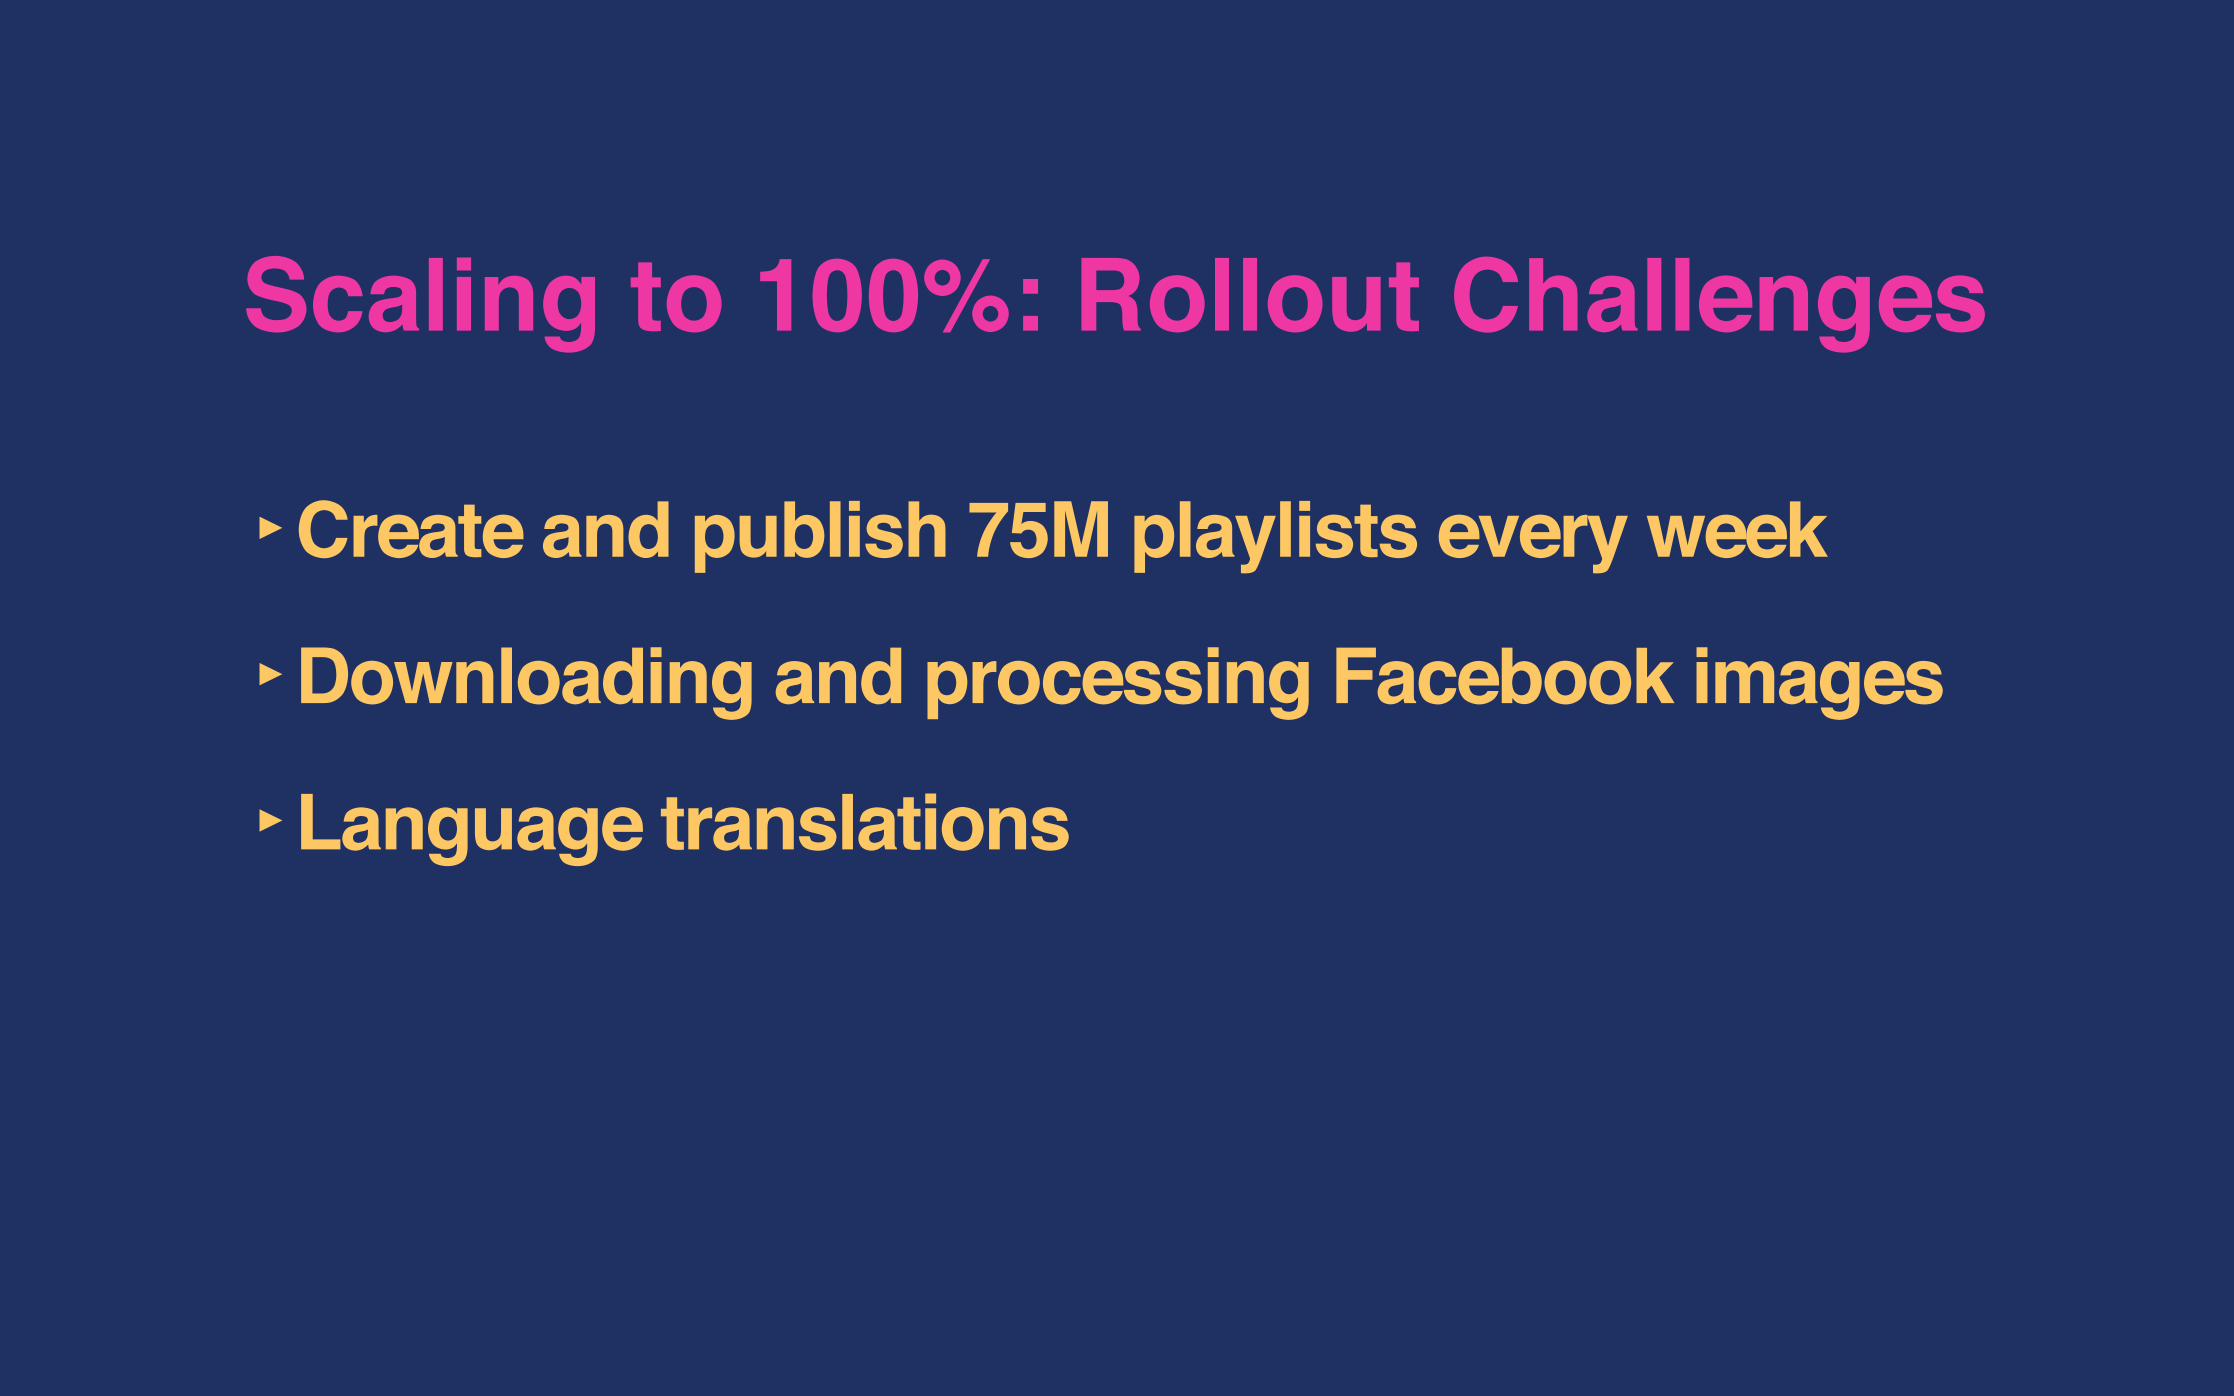
Scaling to 100%: Rollout Challenges
‣Create and publish 75M playlists every week
‣Downloading and processing Facebook images
‣Language translations
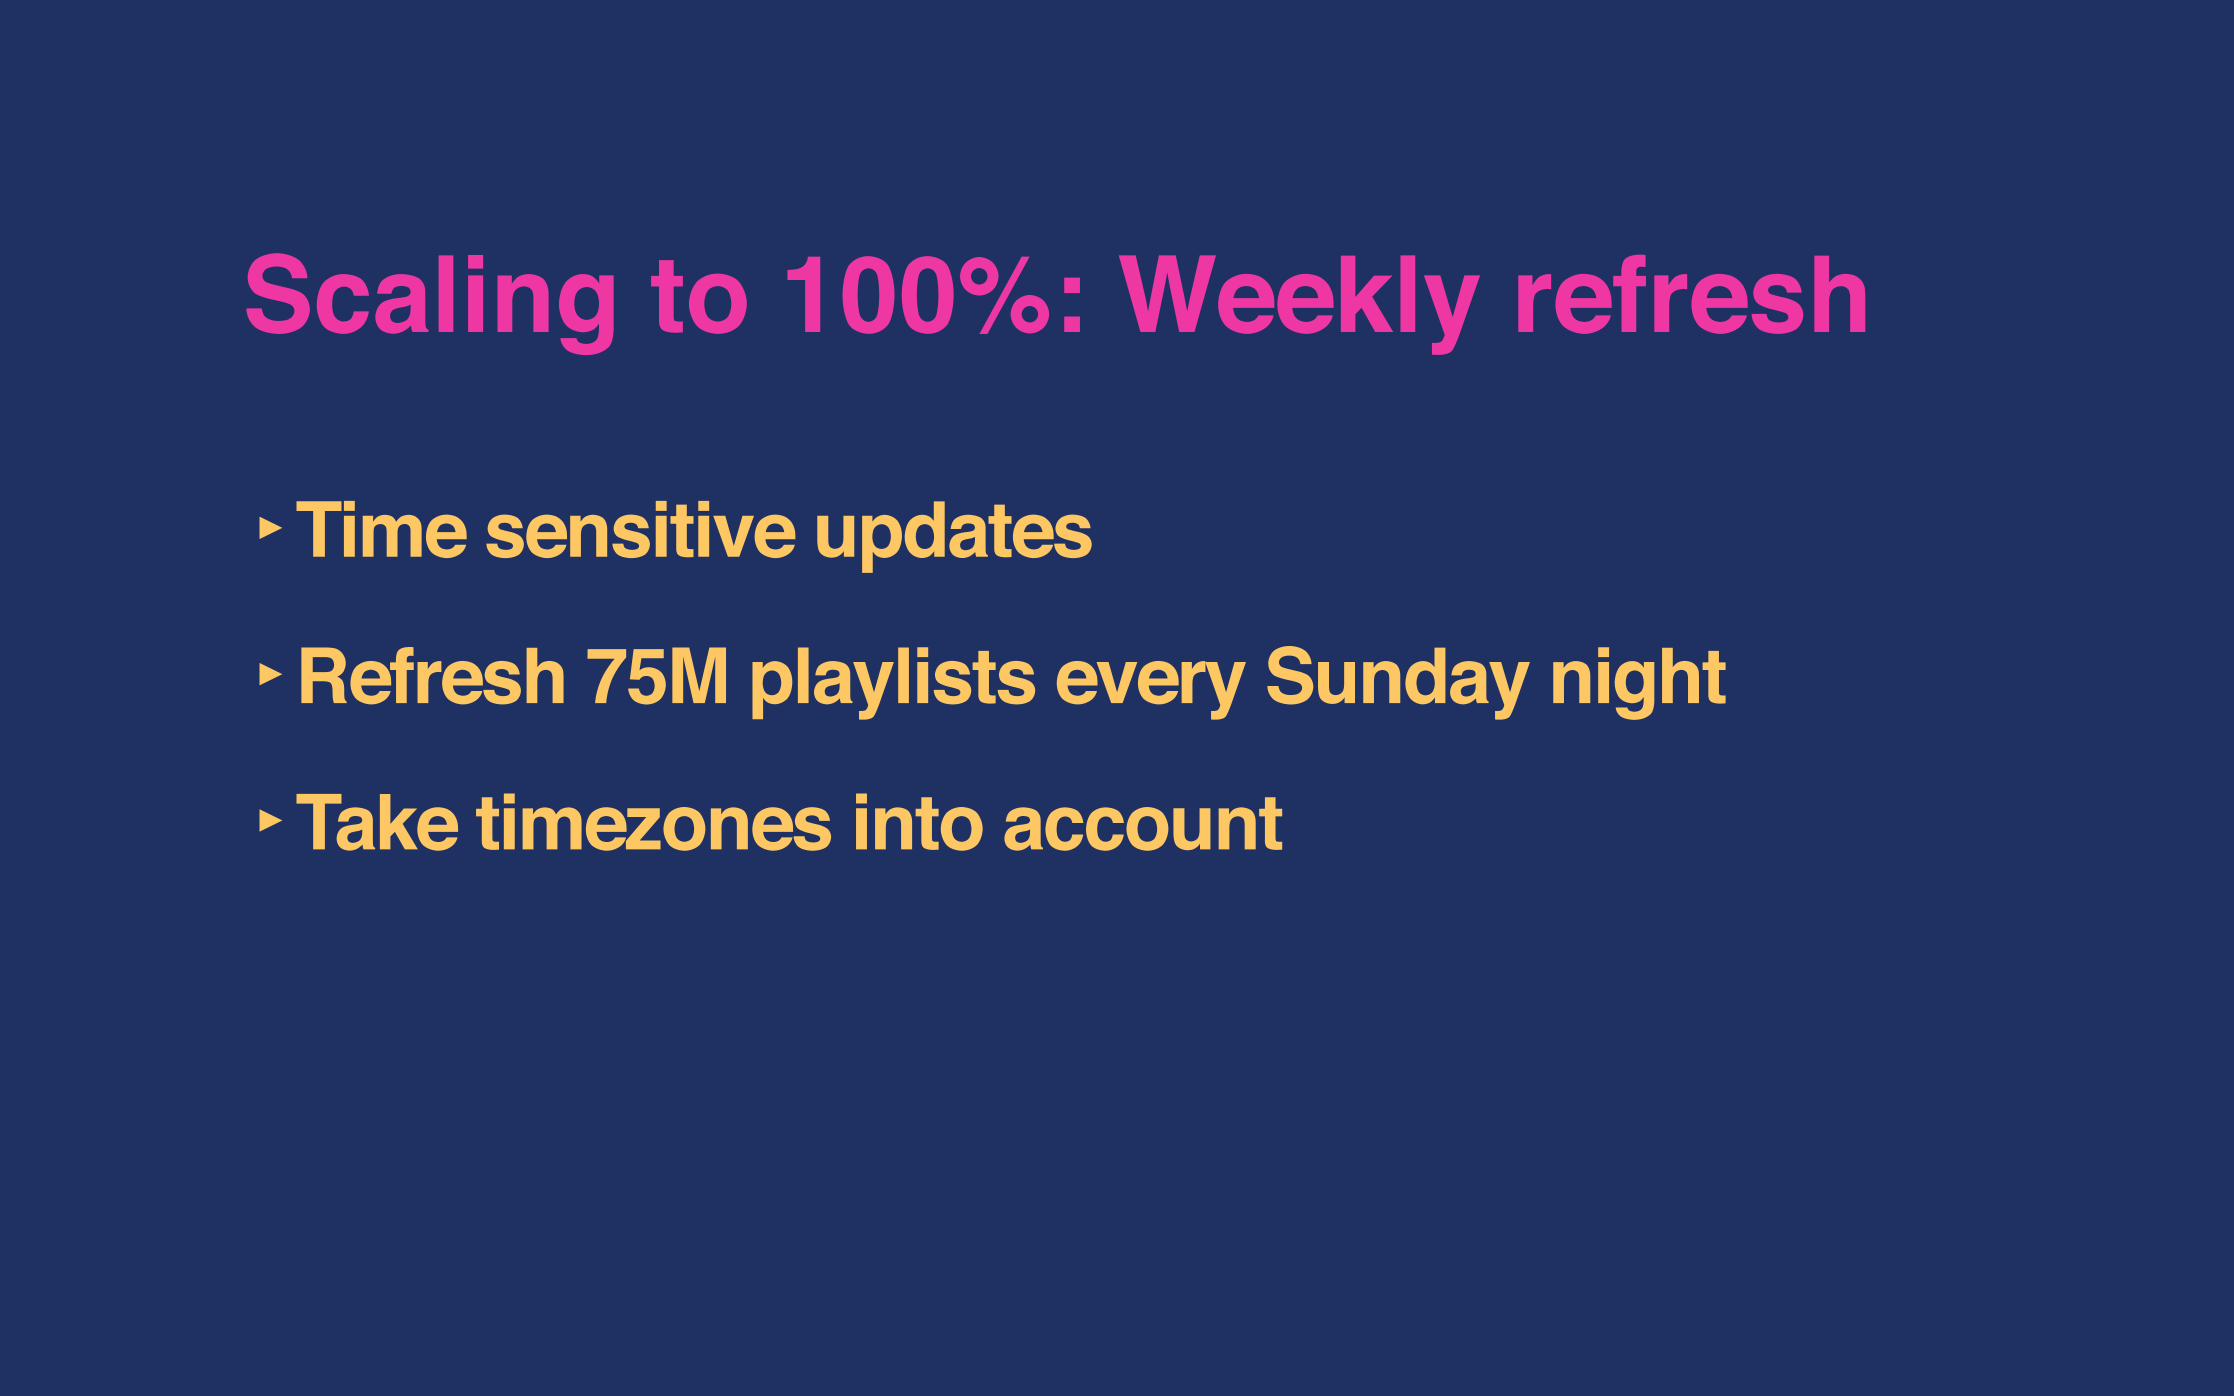
Scaling to 100%: Weekly refresh
‣Time sensitive updates
‣Refresh 75M playlists every Sunday night
‣Take timezones into account
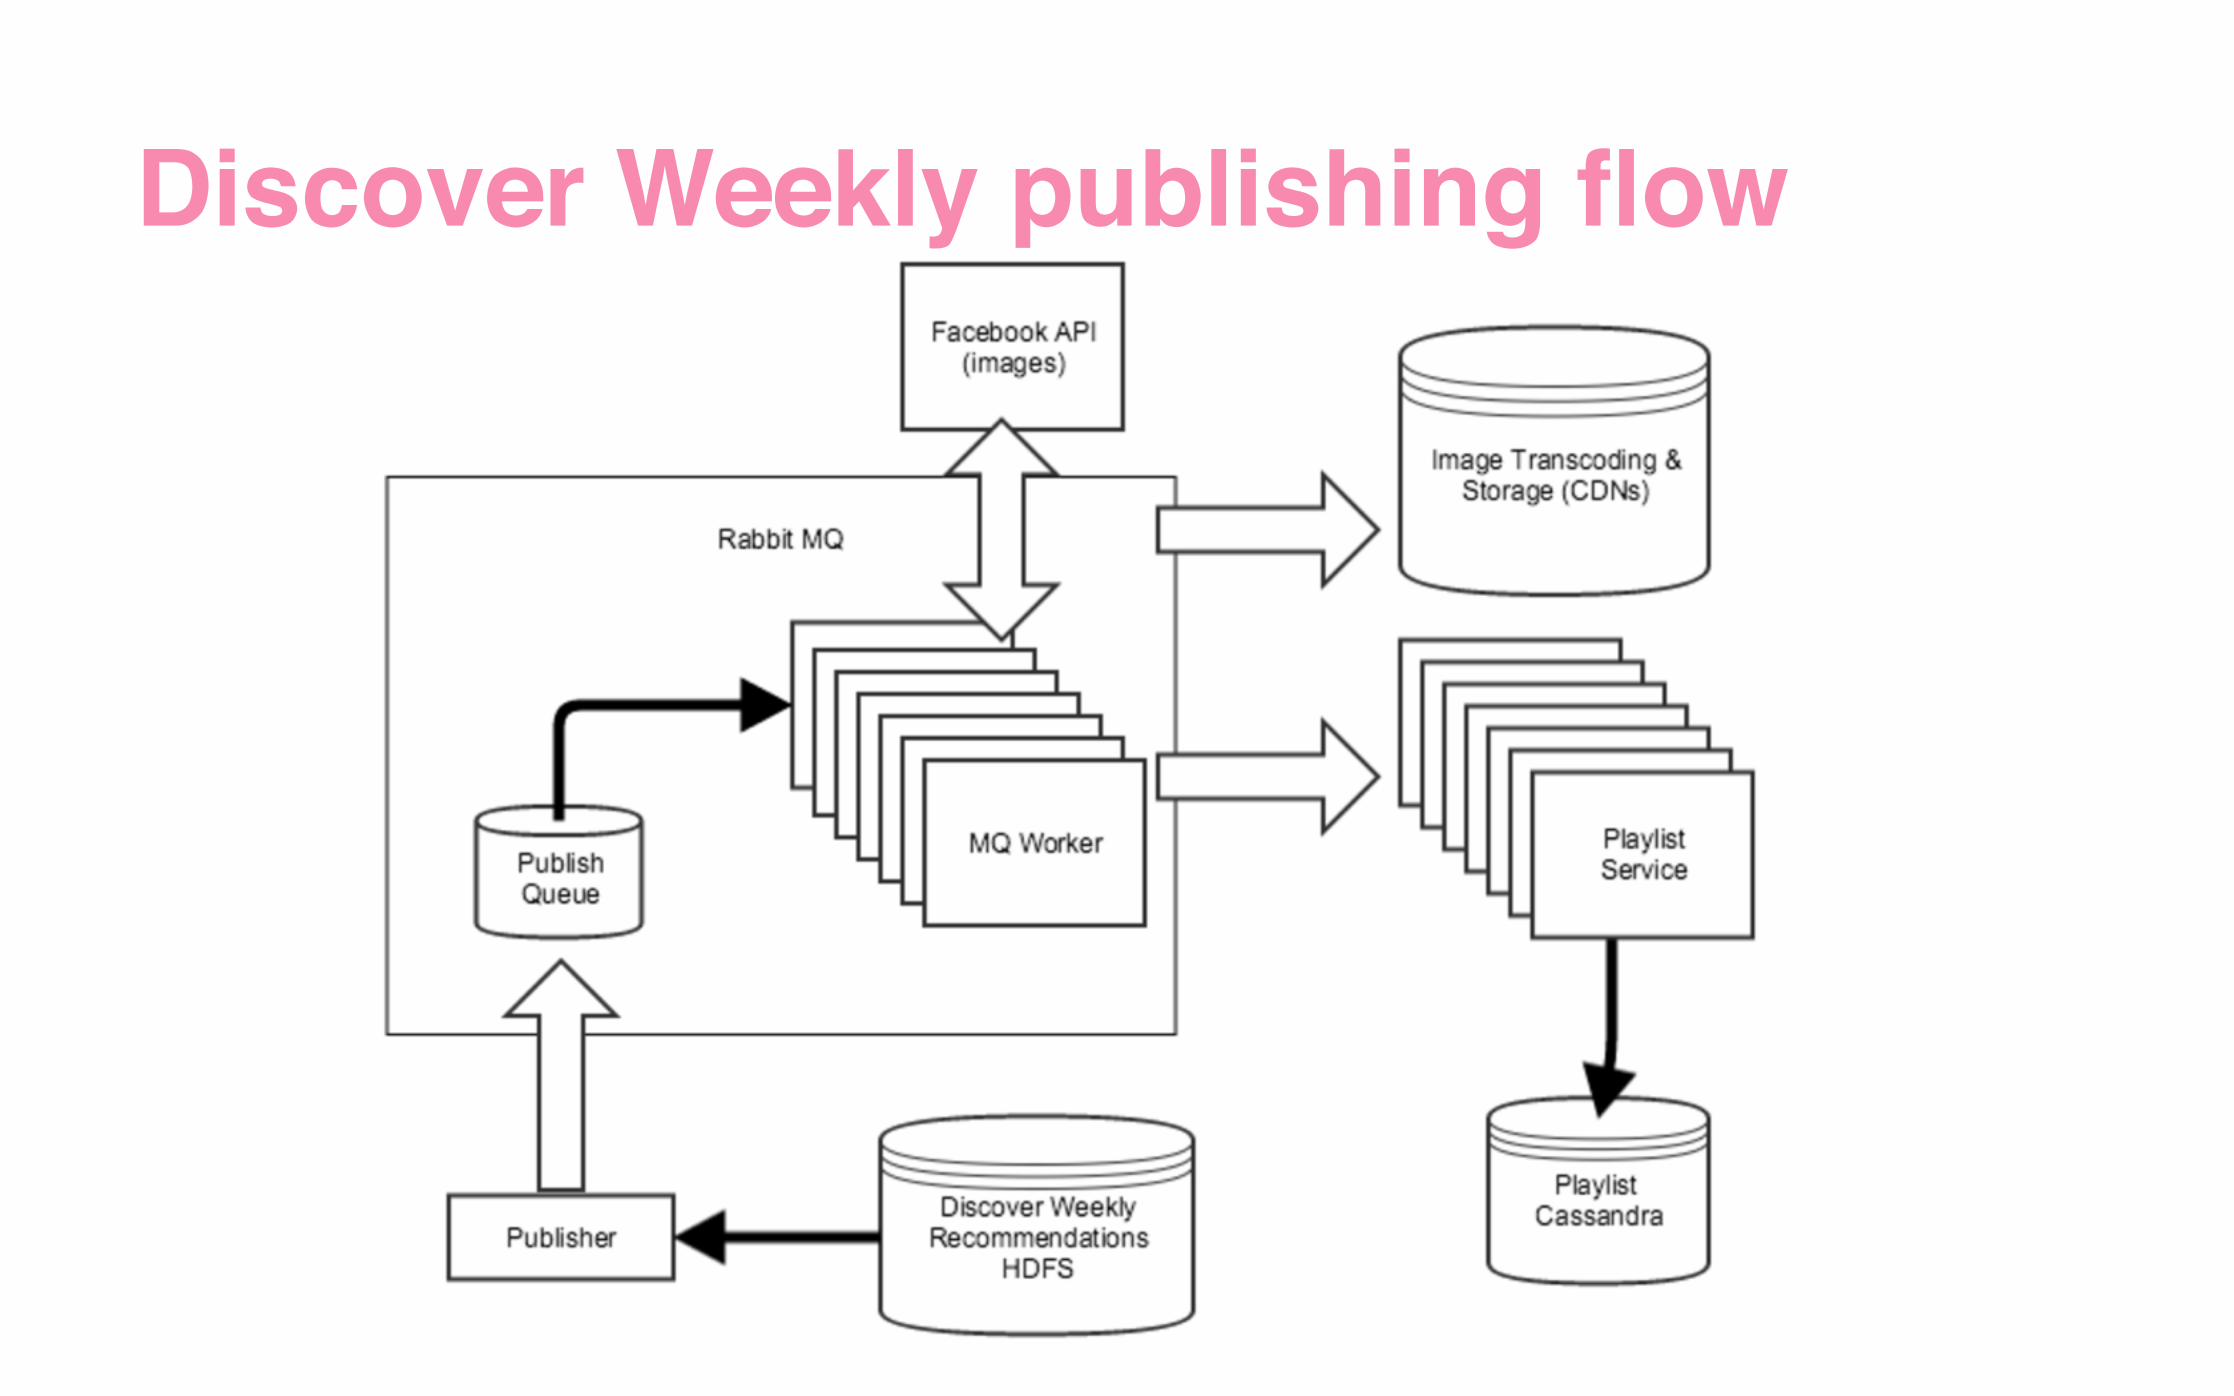
Discover Weekly publishing flow
What’s next? Iterating on content quality and interface
enhancements
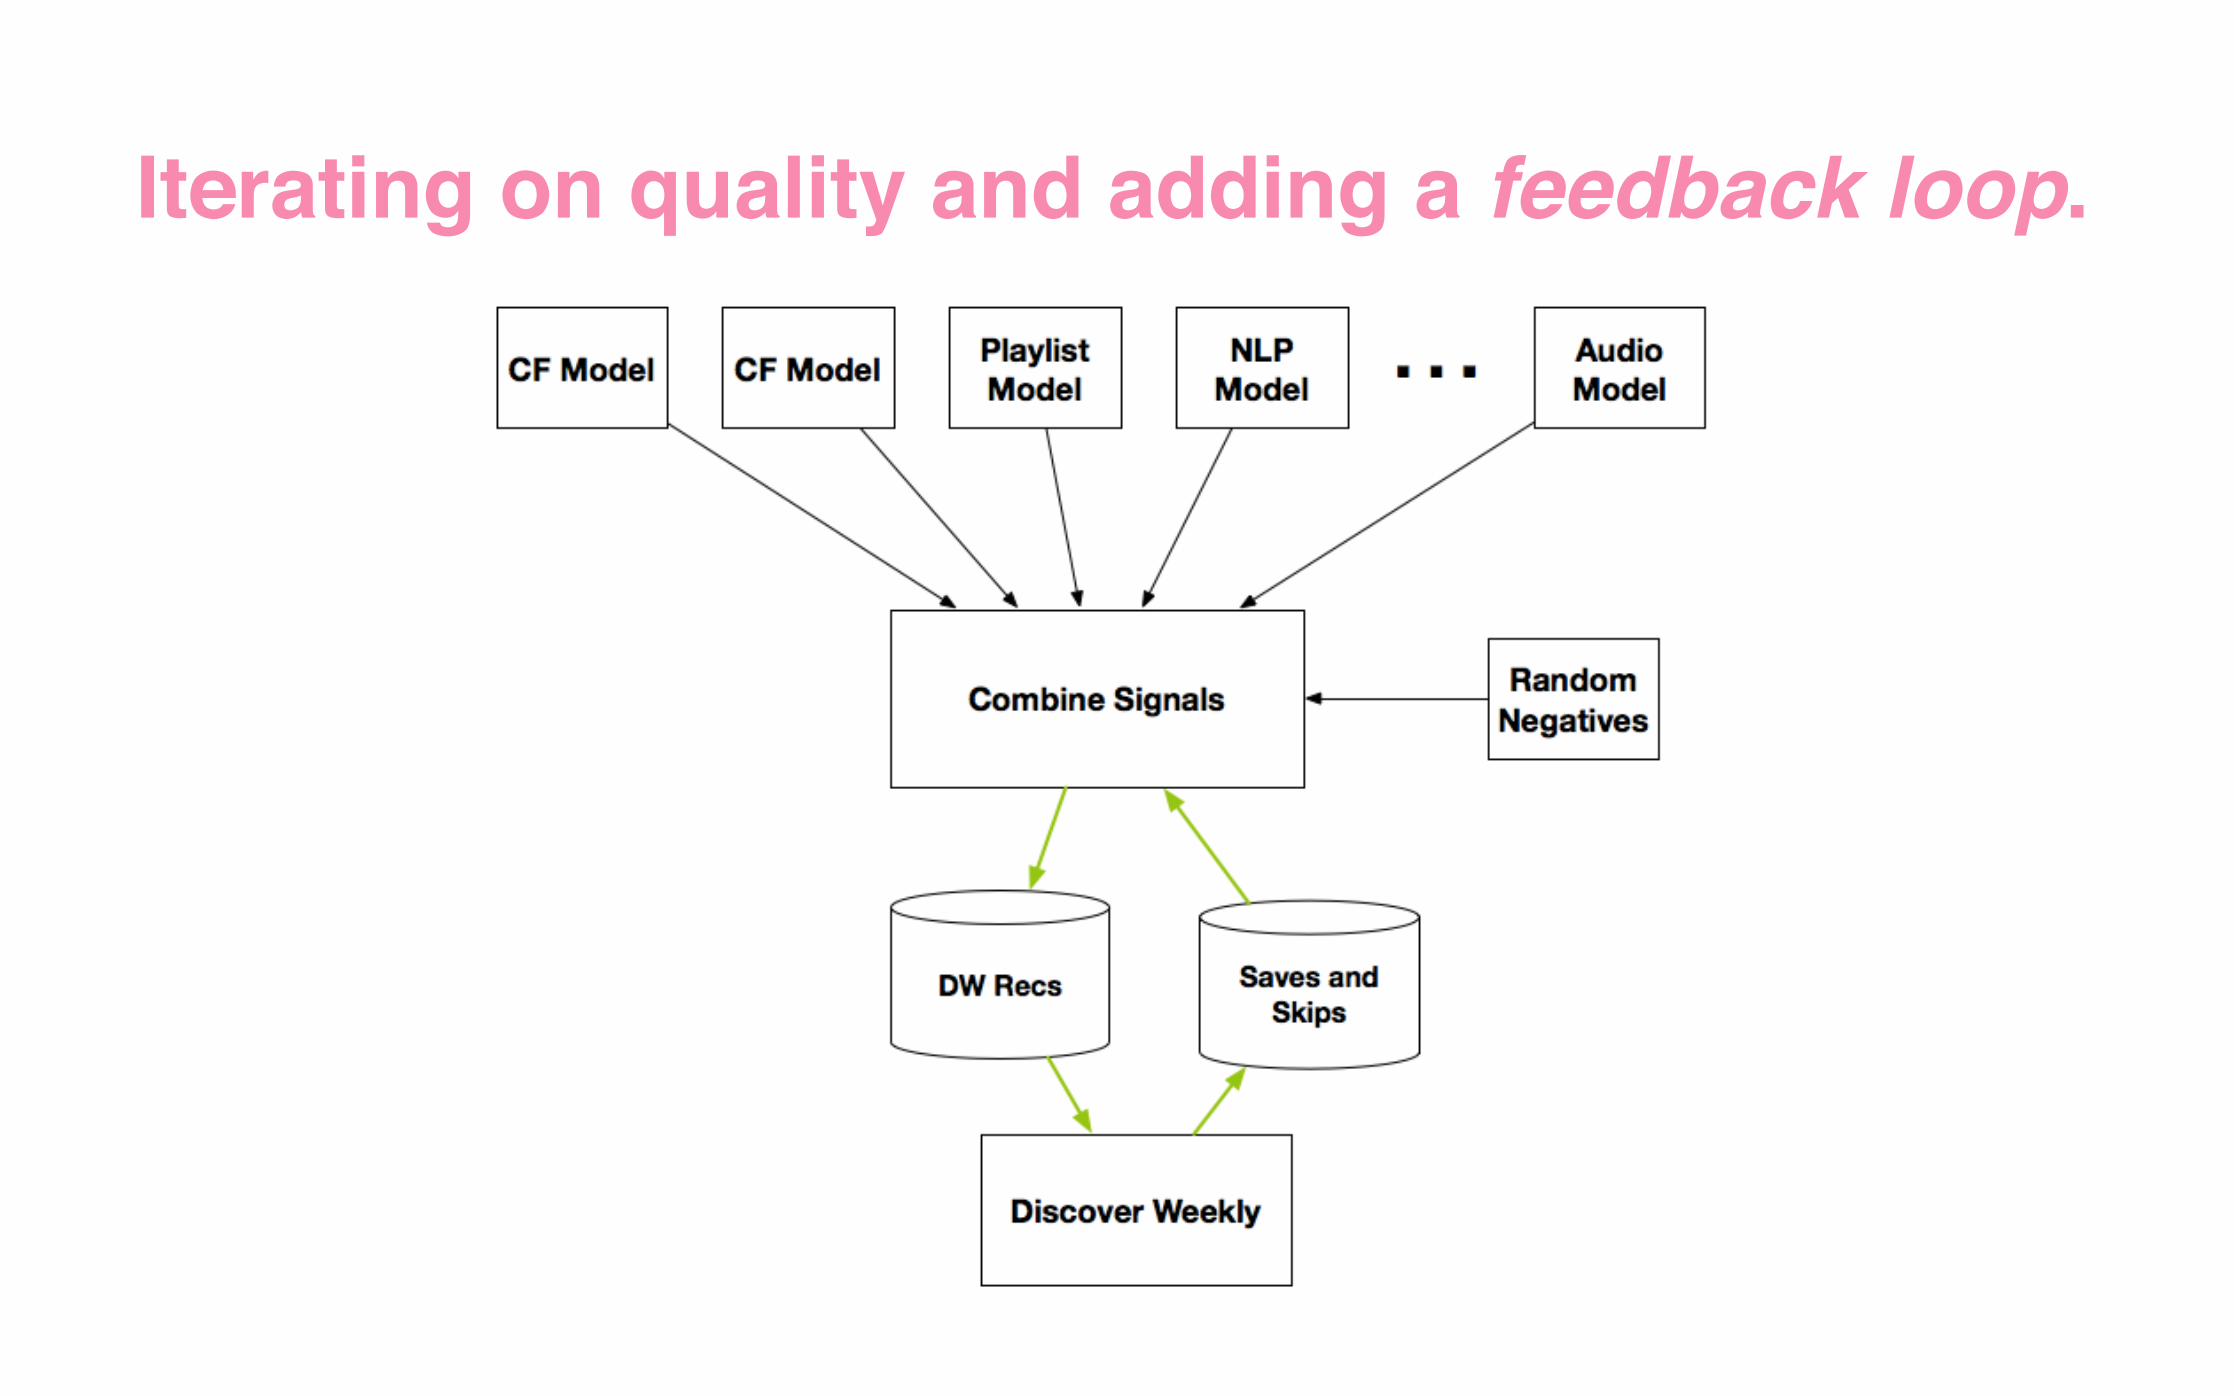
Iterating on quality and adding a feedback loop.
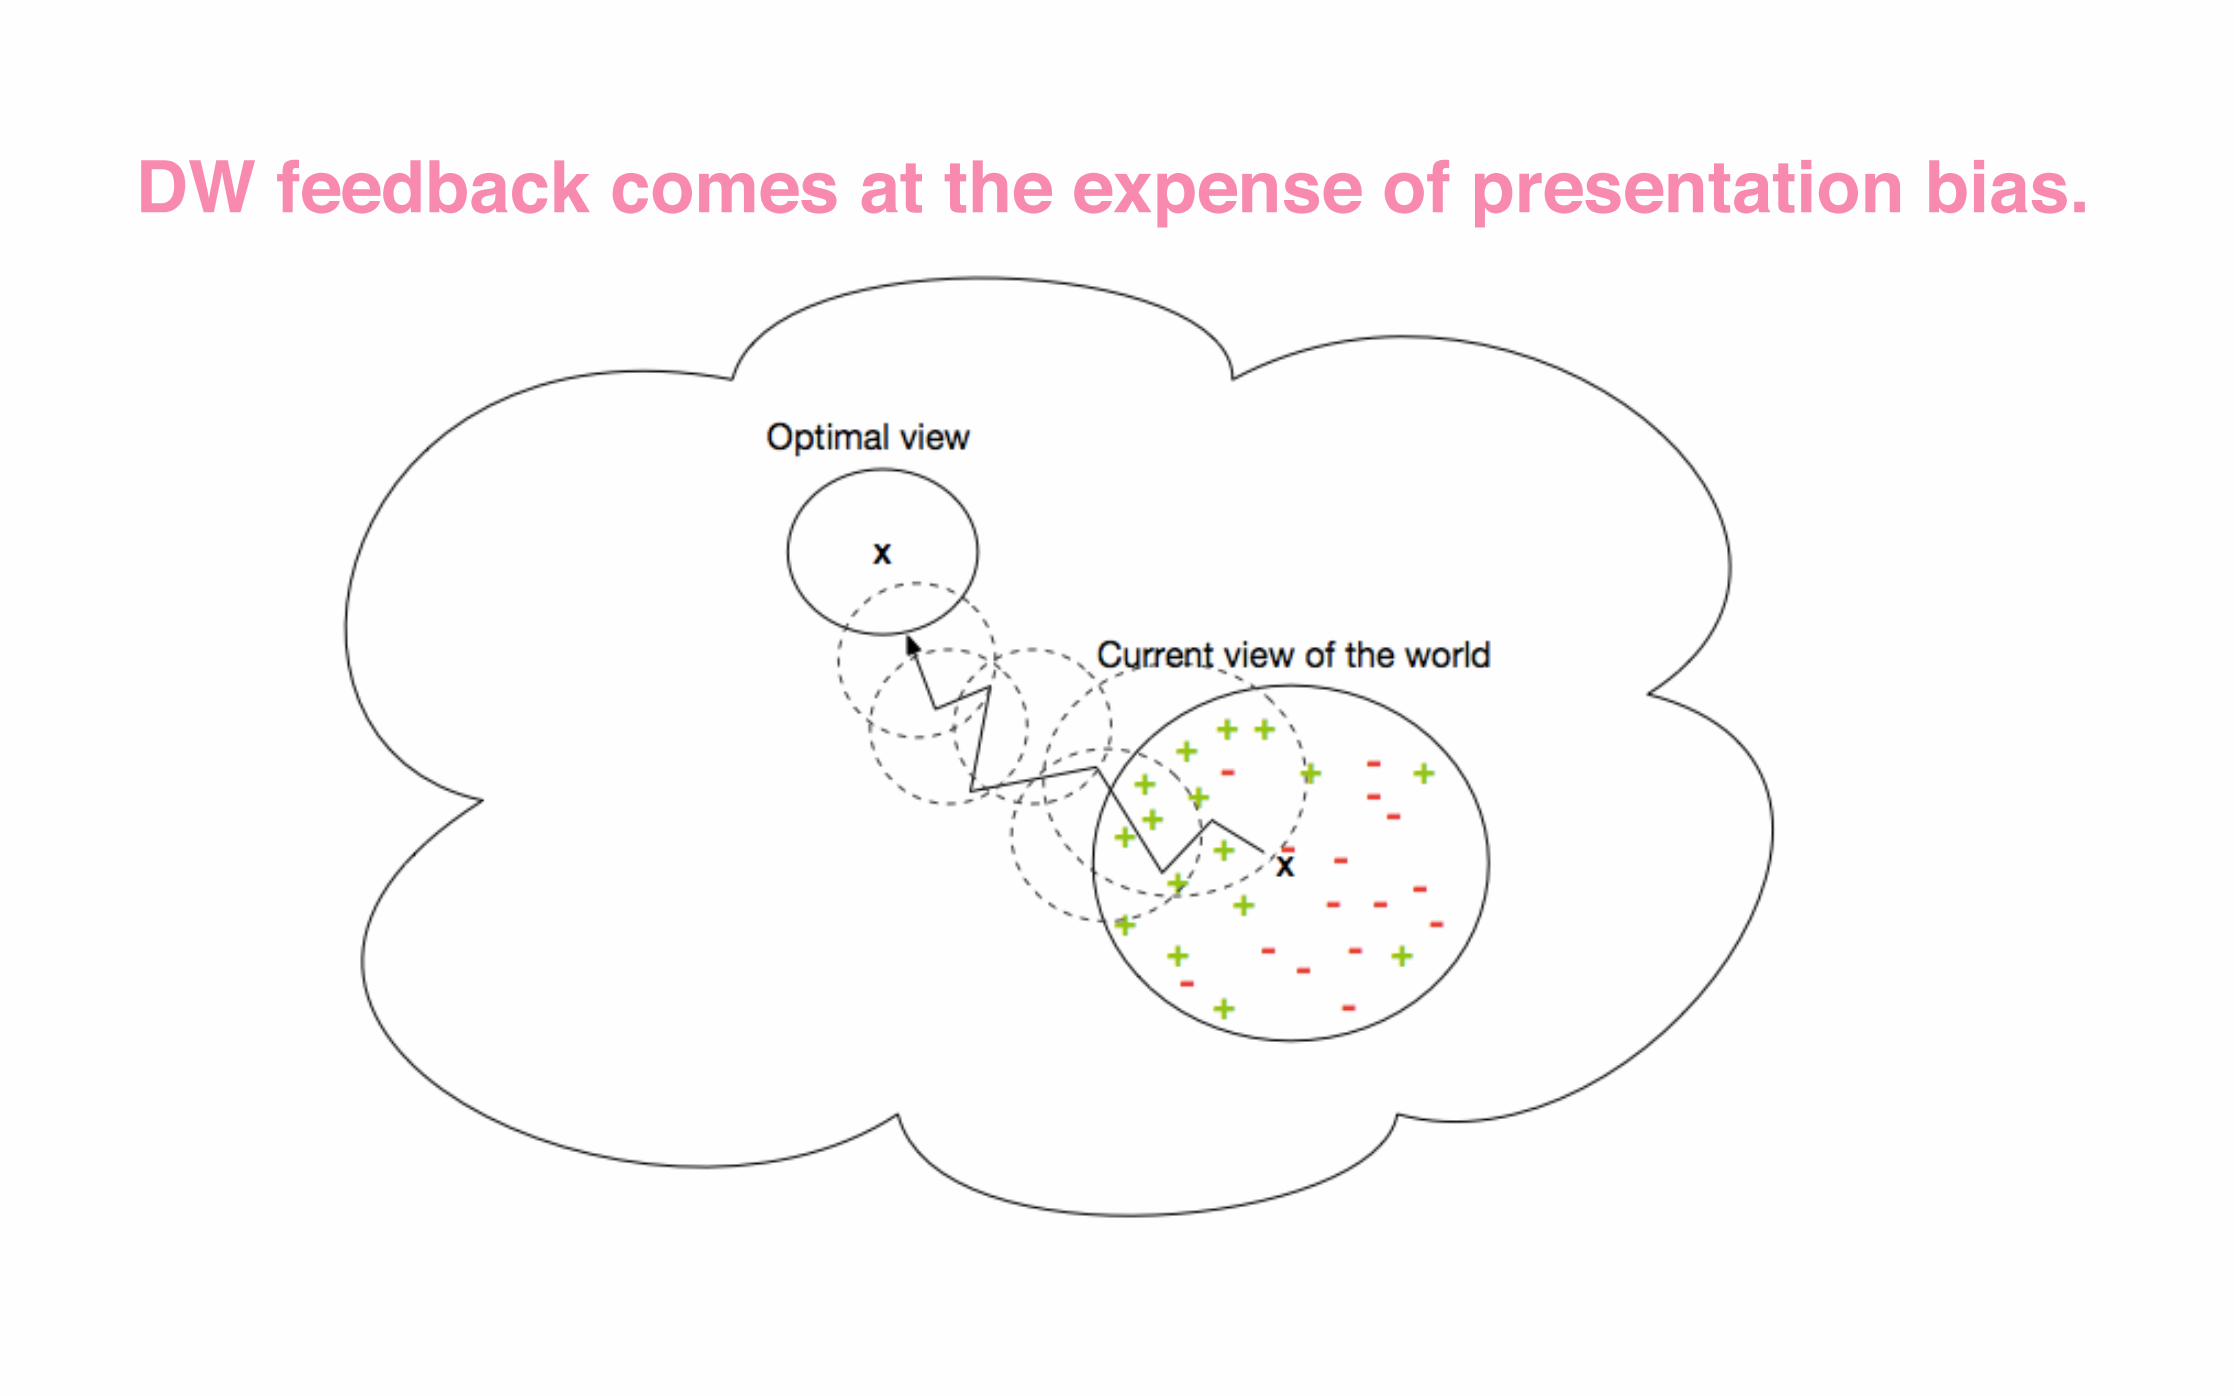
DW feedback comes at the expense of presentation bias.
Lesson 4: Users know best. In the end, AB Test everything!
Lesson 5 (final lesson!): Empower bottom-up
innovation in your org and amazing things will happen.
Thank You!(btw, we’re hiring Machine Learning and Data Engineers, come chat with us!)


![1 DACODA [Crandall et al.; CCS 2005] DA vis mal COD e A nalyzer Discover invariants in the exploit vector ( ε ) Symbolic execution on the system trace](https://img.pdfslide.net/doc/110x75/56649ea75503460f94ba9a81/1-dacoda-crandall-et-al-ccs-2005-da-vis-mal-cod-e-a-nalyzer-discover-invariants.jpg)