Embed Size (px)
Citation preview
Digital
Agenda for
Europe
Future-proofing eGovernment for
the Digital Single Market ‘An assessment of digital public service delivery in Europe’
BACKGROUND REPORT
June 2015
A study prepared for the European Commission
DG Communications Networks, Content & Technology
Page 2 of 111
This study has been prepared by Capgemini, IDC, Sogeti, and Politecnico di Milano for the Directorate General for
Communications Networks, Content and Technology.
For more information about this paper, please contact:
European Commission
Directorate General for Communications Networks, Content and Technology
Unit F.4 Knowledge Base
Gianluca Papa – Project Officer for the eGovernment Benchmark
E-mail: [email protected]
Project Team
Dinand Tinholt – Vice President, EU Lead, Capgemini
Executive Lead eGovernment Benchmark
Email: [email protected]
Niels van der Linden – Managing Consultant, Capgemini
Project Manager eGovernment Benchmark
Email: [email protected]
Written and reviewed by Dinand Tinholt, Niels van der Linden, Michiel Ehrismann (Capgemini); Gabriella
Cattaneo, Stefania Aguzzi (IDC); Laurent Jacquet, Stefaan Vanmarcke (Sogeti); Giuliano Noci, Michele Benedetti,
Giulia Marchio (Politecnico di Milano).
Internal identification
Contract number: 30-CE-0684852/00-43
SMART number: 2014/0040
DISCLAIMER
By the European Commission, Directorate-General of Communications Networks, Content and Technology.
The information and views set out in this publication are those of the author(s) and do not necessarily reflect the
official opinion of the Commission. The Commission does not guarantee the accuracy of the data included in this
study. Neither the Commission nor any person acting on the Commission’s behalf may be held responsible for
the use which may be made of the information contained therein.
ISBN: 978-92-79-48427-8
DOI: 10.2759/687905
© European Union, 2015. All rights reserved. Certain parts are licensed under conditions to the EU. Reproduction
is authorised provided the source is acknowledged.
Page 3 of 111
Executive Summary
The eGovernment Benchmark provides insight into the state-of-play of the implementation of digital public
services in Europe. For this benchmark of eGovernment services is assessed in 33 participating countries,
including all of the EU28. The assessment is done by Mystery Shoppers, who measure the quality and quantity of
online public services by acting as a user.
Under review is a set of seven life events. Each life event is measured once every two years. In 2014, three life
events were assessed: Starting up a business, Losing and finding a job, and Studying. These three life events have
also been assessed in 2012, allowing to compare European progress over time for the first time.
This report presents the basic analysis of the study and a detailed overview of the measurement and this year’s
life events. It is accompanied by an Insight Report, which provides the main insights stemming from the facts.
The study consists of four top-level benchmarks, covering important EU policy priorities:
� User Centricity - indicates to what extent (information about) a service is provided online and perceived;
� Transparency - indicates to what extent governments are transparent as regards a) their own responsibilities
and performance, b) the process of service delivery and c) personal data involved;
� Cross Border Mobility - indicates to what extent European users can use online services in another country;
� Key enablers - indicates the extent to which five technical pre-conditions are available online.
Viewing eGovernment at a generic level (across life events), the 2014 measurement shows:
� User Centricity in quantity: Europe has come a long way in providing services, or at least information about
the service, via the online channels. Few services are not online at all;
� Widening gap between quality and quantity: Last year’s measurement found that while Europe scores high
for availability of services, it scores lower on how ease or fast these services are. The gap in scores has
grown;
� Transparency improving as regards personal data: Europe has made good progress as regards the handling
of personal data. Other aspects of Transparency, e.g. on delivery of government services score unsatisfying;
� True Digital Single Market hampered by borders: eGovernment services are friendlier to domestic users
than to users from other European countries. Still, Cross Border Mobility is improving, especially for
businesses;
� Few public websites are designed for mobile devices: An analysis of the mobile friendliness shows only 27%
of the European public websites currently supports the use of devices such as smart phones and tablets.
� No progress in the supply of Key Enablers: European public organisations make no more use of Key Enablers
such as eID, or the Authentic Sources to allow pre-filling of information;
� Automation has stalled. Without more use of Authentic Sources as a Key Enabler, Europe has unsurprisingly
made hardly any gains in automating online services. This leads to unnecessary duplication of work for users.
Zooming in on individual life events, key findings include:
� Starting up a business is relatively well supported by eGovernment services. Especially support functions
such as FAQ, help and feedback functionalities score very well, as does the supply of portals. Governments
make these functionalities available to starting entrepreneurs from other European countries as well;
� Losing and finding a job can be a tricky life event for users to complete fully online. Welfare agencies make
relatively little use of eID. As a result, it is difficult to apply for unemployment benefits online in many
European countries. Notably, welfare agencies value Transparency on their own operations;
Page 4 of 111
� Studying across borders has become much easier over the past two years, as eGovernment services have
greatly improved in this regard. While online services to businesses are usually more User Centric than
citizen-oriented services, User Centricity to students is at the same level. Transparency however scores low.
A two-step clustering exercise has been carried out to place the performance of individual countries in the
context of exogenous factors such as eGoverment demand and the environment:
� eGovernment divide in Penetration and Digitisation: European countries differ among themselves in the
extent to which online services have been adopted and changed public sector, but less so in user
satisfaction.
� Individual approach to eGovernment required: The cluster analysis shows there is no one right way, as
countries can take various paths to digital maturity. To reach maturity, custom made strategies are required.
� There is always a good peer: Although the background (e.g. economic, demographic and institutional
factors) of European countries varies, all countries can find good example among their own peers. All
contextual groups have at least one country in the well performing Mature Cluster or Builders Cluster.
The eGovernment benchmark will be expanded next year with the 2015 measurement of four other life events.
Page 5 of 111
Table of Content
EXECUTIVE SUMMARY ....................................................................................................................................... 3
1 INTRODUCTION .......................................................................................................................................... 8
1.1 Digital Revolution .............................................................................................................................. 8
1.2 Who should read this report? ............................................................................................................ 8
1.3 Why read this report? ........................................................................................................................ 9
1.4 A reading guide to this report ............................................................................................................ 9
2 MEASURING EGOVERNMENT ....................................................................................................................10
2.1 Method ............................................................................................................................................10
2.1.1 Indicators............................................................................................................................11
2.1.2 Methods of data collection .................................................................................................11
2.1.3 Domains: life events. ...........................................................................................................12
2.2 Benefits of the method .....................................................................................................................13
2.2.1 The customer journey as starting point for designing services .............................................13
2.2.2 A variety of life events covering common domains ..............................................................13
2.2.3 The customer as evaluator of services .................................................................................14
2.2.4 National governments validate results ................................................................................14
2.2.5 Coherent, integrated and aligned with European Commission policy goals ..........................14
2.3 Towards a new model for monitoring eGovernment performance in Europe? ...................................15
3 SYNTHESIS OF TOP-LEVEL BENCHMARKS ...................................................................................................16
3.1 eGovernment services in various domains ........................................................................................16
3.2 Bird’s eye view on eGovernment in Europe .......................................................................................17
3.3 User Centricity ..................................................................................................................................18
3.3.1 Overview of the indicator ....................................................................................................18
3.3.2 Quality versus quantity .......................................................................................................20
3.3.3 Citizens versus businesses ...................................................................................................21
3.3.4 National versus local levels of government ..........................................................................22
3.3.5 Availability across journeys .................................................................................................23
3.3.6 Automated services ............................................................................................................24
3.3.7 Quality of User Centric eGovernment services .....................................................................24
3.3.8 Usability: Support, help and feedback .................................................................................25
3.4 Transparency to build trust and increase accountability ....................................................................26
3.4.1 Overview of the Benchmark ................................................................................................26
3.4.2 Service delivery ...................................................................................................................29
3.4.3 Public organisations ............................................................................................................30
3.4.4 Personal data ......................................................................................................................31
Page 6 of 111
3.5 Cross Border Mobility: increasing mobility of citizens and businesses ................................................31
3.5.1 Overview of the benchmark ................................................................................................32
3.5.2 Cross border mobility by life event ......................................................................................33
3.6 Key Enablers .....................................................................................................................................34
3.6.1 Overview of the benchmark ................................................................................................35
3.6.2 Key Enablers by country ......................................................................................................36
3.7 Mobile friendliness public websites ..................................................................................................37
3.8 Mandatory online services ................................................................................................................39
4 STARTING UP A BUSINESS AND EARLY TRADING OPERATIONS ..................................................................40
4.1 Introduction to the life event ............................................................................................................40
4.2 User Centric Government .................................................................................................................41
4.2.1 Online Availability ...............................................................................................................42
4.2.2 Starting business versus established businesses ..................................................................44
4.3 Transparent Government..................................................................................................................45
4.4 Cross Border Mobility .......................................................................................................................46
4.5 Key Enablers .....................................................................................................................................48
4.6 Overall..............................................................................................................................................49
5 LOSING AND FINDING A JOB......................................................................................................................51
5.1 Introduction to the life event ............................................................................................................51
5.2 User Centric Government .................................................................................................................52
5.3 Transparent Government..................................................................................................................55
5.4 Key Enablers .....................................................................................................................................57
5.5 Overall..............................................................................................................................................59
6 STUDYING .................................................................................................................................................60
6.1 Introduction to life event ..................................................................................................................60
6.2 User Centric Government .................................................................................................................60
6.3 Transparent Government..................................................................................................................63
6.4 Cross Border Mobility .......................................................................................................................65
6.5 Key Enablers .....................................................................................................................................67
6.6 Overall..............................................................................................................................................69
7 CLUSTERING OF COUNTRIES TO DRIVE LEARNING .....................................................................................70
7.1 A new framework: Two-step analysis ................................................................................................70
7.1.1 Step 1: Absolute indicators..................................................................................................70
7.1.2 Country Assessment on eGovernment Performances ..........................................................72
7.1.3 Step 2: Relative indicators ...................................................................................................74
7.1.4 Methodology and data analysis ...........................................................................................76
7.2 Step 1: Clustering countries on eGovernment performances .............................................................76
Page 7 of 111
7.2.1 Absolute indicators valorisation ..........................................................................................76
7.2.2 Country performance characteristics ...................................................................................78
7.2.3 Clusters creation .................................................................................................................79
7.3 Step 2: Understanding the impact of context-specific variables on maturity performance .................80
7.3.1 Group of countries with similar context...............................................................................80
7.3.2 The impact of the context variables on performances .........................................................81
7.3.3 The impact of socio-demographic factor .............................................................................83
7.4 Comparing country clusters to understand and improve performance ..............................................94
7.5 Improving the framework: considerations for future applications .....................................................98
ANNEX I: COUNTRY REPORTS ............................................................................................................................99
ANNEX II: EXPLANATION OF INDICATORS IN COMMON LANGUAGE ............................................................... 100
ANNEX III: RELATIVE INDICATORS ................................................................................................................... 103
ANNEX IV: LIST OF COUNTRY ACRONYMS ....................................................................................................... 106
TABLE OF FIGURES .......................................................................................................................................... 107
Page 8 of 111
1 Introduction
‘Society is in the midst of a revolution - driven by digital technology.’
Commissioner Günther Oettinger
26 February 2015 on Digital4Europe Stakeholder Meeting1
1.1 Digital Revolution
Winston Churchill said: ‘It is always wise to look ahead, but difficult to look further than you can see’. This
perfectly reflects the dilemma many public and private organisations cope with: when technology is advancing so
quickly, how can they define a sustainable strategy that allows them to improve in the longer term?
Disruptive change requires formulating new strategies. Famous innovations brought forward by companies from
Silicon Valley are well known and lighted examples of what is ahead of us. New technologies (social, mobile, big
and open data, Internet of Things) are opening up even more advanced practices and opportunities that press to
rethink current operations. Governments will need to respond to the same extent (though not necessarily in the
same way) that private sector companies need to respond to this trend.
There are two parts to the story: the first is the ability to use technology for customer engagement, better
internal processes and to change business models. Technology as means to increase value. In the case of public
organisations: to increase public value. The second lever for a successful digital journey is committed leadership.
Research2 showed that successful digital transformation did not happen bottom-up, but was steered at executive
level: setting direction, building momentum and ensuring the organisation followed through.
This report is not unique in addressing the need for digital transformation of public sector – many have done so
over the past years. This report is unique in revealing the current ‘digital status’ of Europe – by comparing
eGovernment performance of 33 countries on a rich and robust set of indicators.
1.2 Who should read this report?
Anyone who is interested in how governments are coping with today’s challenges. The Benchmarking
framework is constructed around key elements of eGovernment. Building from a very rich source of collected
research data, using different methods and in strong collaboration with participating countries, the results
provide a robust and coherent insight into the current state of play in Europe. To optimise follow-up of the
research, we have decided to report on the outcomes through two reports, each addressing different audiences.
This report is the Background report, which aims to deliver an impactful study on eGovernment. In the shorter
Insight Report, we capture the key findings and policy recommendations.
Especially those who are working with eGovernment on a daily basis. The data processed by this measurement
is broad (covering many domains) and deep (digging into the reality of the service processes from multiple
angles). The report before you is called the ‘background report’. It is aimed to provide an extensive and detailed
view of the performed measurement. It almost serves as an encyclopaedia of eGovernment performance in
Europe. The indicators that compose the framework are presented for each single life event under assessment as
well as at an aggregated level (covering the average of all life events). This report also includes the extensive
description of the peer-clustering exercise that has been performed to drive learning in Member States.
Researchers that want to reuse a rich data source to extract deeper insights. The publication of both reports
comes with a set of open, machine-readable data. This includes all life event assessments performed in 2013.
The Commission’s webpage also includes the data collected in life event assessments in 2012 as well as the
demand-side user survey amongst citizens (2012).
1 Full text at https://ec.europa.eu/commission/content/speech-digital4europe-stakeholder-meeting_en
2 ‘Leading Digital. Turning technology into business transformation’, G. Westerman, D. Bonnet, A. McAfee, HBR press, 2014.
Page 9 of 111
1.3 Why read this report?
Benchmarking is an important aspect of the European Union’s Open Method of Coordination (OMC). It is used in
order to stimulate mutual learning processes, to perform multilateral surveillance and to contribute to further
convergence of participating countries’ policies in various policy areas. eGovernment benchmarking means
undertaking a review of comparative performance of eGovernment between nations or agencies.
Benchmarking gives insight as to the state of play of eGovernment in the participating countries and is hence an
essential part of the response to current socio-economic challenges. Benchmarking analysis is used as a
comparison tool for analysing processes and performance metrics against the standard or best practices in a
given field.
The analysis includes constructing a well-defined baseline against which the subject of the study is compared in
order to analyse its performance, establish good practices and identify areas of strengths as well as inadequacies.
In the context of eGovernment, it offers insight into how services can be made ‘twice as good, in half the time,
for half the costs’ and can stimulate governments to respond faster and smarter. Benchmarking is the first step
of a continuous benchlearning and improvement cycle.
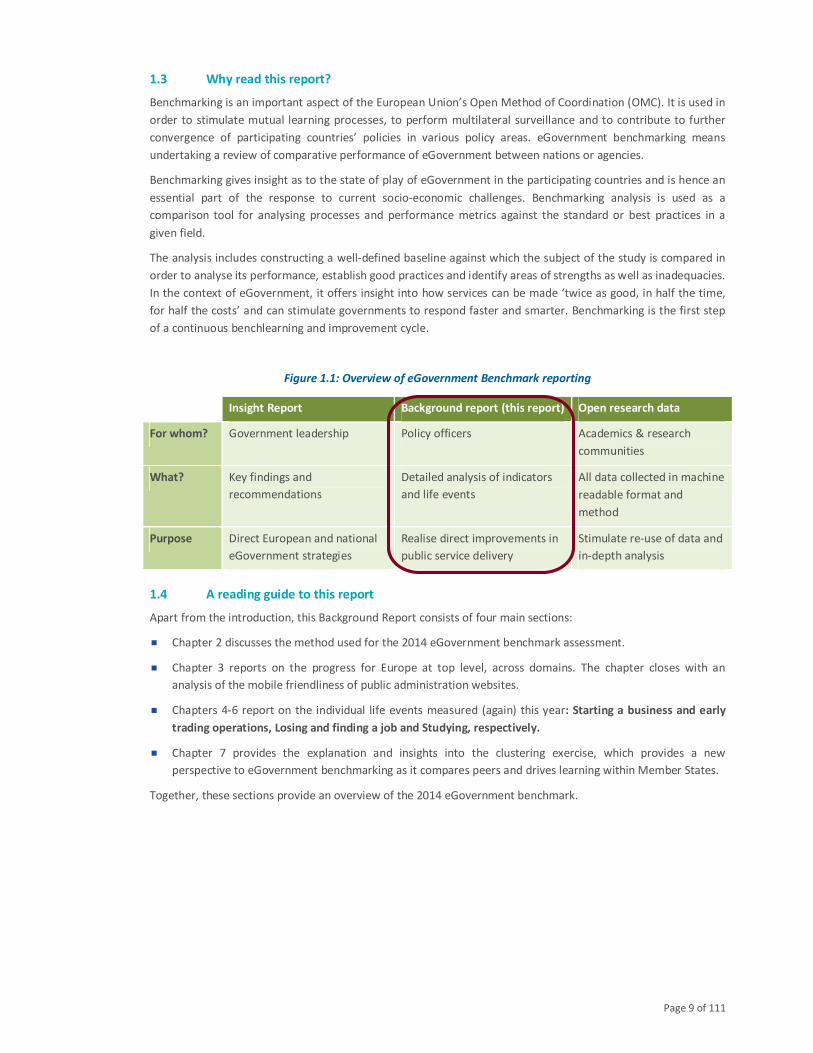
Figure 1.1: Overview of eGovernment Benchmark reporting
Insight Report Background report (this report) Open research data
For whom? Government leadership Policy officers Academics & research
communities
What? Key findings and
recommendations
Detailed analysis of indicators
and life events
All data collected in machine
readable format and
method
Purpose Direct European and national
eGovernment strategies
Realise direct improvements in
public service delivery
Stimulate re-use of data and
in-depth analysis
1.4 A reading guide to this report
Apart from the introduction, this Background Report consists of four main sections:
� Chapter 2 discusses the method used for the 2014 eGovernment benchmark assessment.
� Chapter 3 reports on the progress for Europe at top level, across domains. The chapter closes with an
analysis of the mobile friendliness of public administration websites.
� Chapters 4-6 report on the individual life events measured (again) this year: Starting a business and early
trading operations, Losing and finding a job and Studying, respectively.
� Chapter 7 provides the explanation and insights into the clustering exercise, which provides a new
perspective to eGovernment benchmarking as it compares peers and drives learning within Member States.
Together, these sections provide an overview of the 2014 eGovernment benchmark.
2 Measuring eGovernment
‘There is even more work to do to achieve a truly connected digital single market.
A market where every consumer is able to enjoy digital content and services -
wherever they are in the EU, including government services.’
Vice President Andrus Ansip
26 November 2014 in the European Parliament plenary session3
This chapter explains the measurement framework of the eGovernment Benchmark, as designed and agreed
with European Commission and participating countries. It reveals what is measured and how – and what this
means.
This chapter focuses on the method for the ‘traditional’ eGovernment benchmark framework. The methods of all
studies on top of this benchmark, such as the mobile friendliness analysis (paragraph 3.7) or the clustering of
countries (chapter 7) are described in their own sections. Furthermore, this chapter cannot discuss all details of
the eGovernment benchmark framework measurement. A more extensive discussion of the method of the
eGovernment benchmark can be found in the dedicated Method Paper, which is published on the DG CONNECT
website.4
2.1 Method
The eGovernment Benchmark has been a monitor of eGovernment performance in Europe for over a decade.
Commissioned by the European Commission, it now covers 33 countries and annually presents its findings on
modernising public sector. It builds on a solid methodological foundation which was developed in close
collaboration with Member States and the Commission. The method has evolved since 2001 to keep up with
technological and organisational developments and is aimed at supporting public administrations to achieve
cheaper, better and faster digital services.
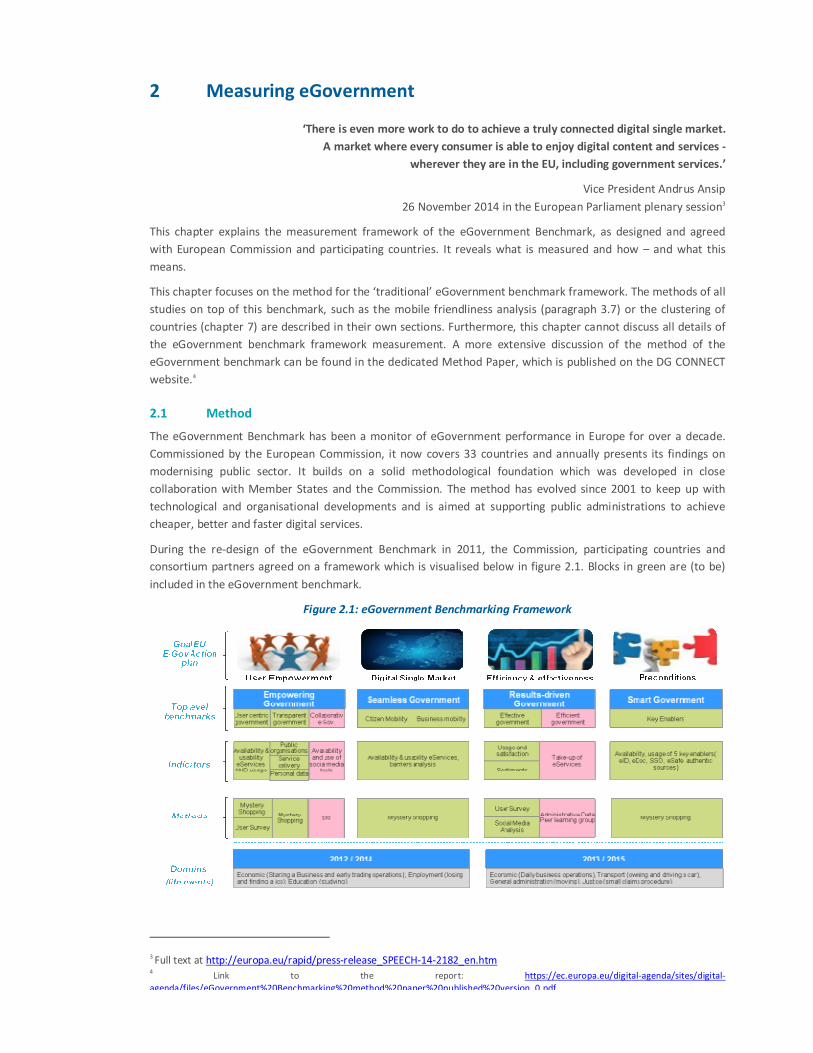
During the re-design of the eGovernment Benchmark in 2011, the Commission, participating countries and
consortium partners agreed on a framework which is visualised below in figure 2.1. Blocks in green are (to be)
included in the eGovernment benchmark.
Figure 2.1: eGovernment Benchmarking Framework
3 Full text at http://europa.eu/rapid/press-release_SPEECH-14-2182_en.htm
4 Link to the report: https://ec.europa.eu/digital-agenda/sites/digital-
agenda/files/eGovernment%20Benchmarking%20method%20paper%20published%20version_0.pdf
Page 11 of 111
As the figure shows, the framework is based on the four priority areas of the eGovernment Action plan.
European progress on the priority areas is measured with a number of indicators, which are assessed using a
particular method of data collection, in a number of domains.
Notably, not every part of the framework is assessed every year. Some parts have been measured once, while
others are included in a cycle of bi-yearly assessments. As a result, not all parts of the framework above are
included in this year’s measurement or in this year’s report. In the following paragraphs, indicators, data
collection and domains which each be discussed in turn, indicating which parts are included in this year’s
measurement.
2.1.1 Indicators
The framework is structured around four main priority areas of the eGovernment Action Plan 2011-2015: User
Empowerment, Digital Single Market, Efficiency & Effectiveness and Preconditions. These priority areas are not
indicators by themselves, but progress on every priority area is measured by one or more indicators, so-called
top level benchmarks. Four of these top level benchmarks are included in the 2014 measurement:
� User Centric Government (or User Centricity) – as measured by Mystery Shopping. This top level benchmark
assesses the availability and usability of public eServices. It is connected to the User Empowerment priority
area.
� Transparent Government (or Transparency). This top level benchmark evaluates the transparency of
government authorities’ operations and service delivery procedures and the accessibility of personal data to
users. It is connected to the User Empowerment priority area.
� Cross Border Mobility. This top level benchmark, which is shown in figure 2.1 split into Citizen Mobility and
Business Mobility, measures the availability and usability of cross border services. It is connected to the
Digital Single Market priority area.
� Key Enablers. This lop level benchmark assesses the availability of key enablers such as Single Sign On and
eID functionalities. It is connected to the Smart Government priority area.
Top level benchmarks not included in the 2014 measurement are:
� Effective Government. This top level benchmark assesses Usage, User Satisfaction and Sentiment (i.e.
perception) metrics. These indicate whether the eChannel is citizens’ and businesses’ first choice, and
whether Governments reach their User Satisfaction and Effectiveness targets. It is connected to the
Efficiency & Effectiveness priority area.
� User Centric Government (or User Centricity) – as measured by a User survey. The next section will discuss
differences stemming from the method of data collection.
Most top level benchmarks consist of multiple sub indicators, which in turn are measured by a number of
questions regarding the quality or quantity of eGovernment services on a specific aspect. The answer to these
questions comes from data collection. Sub indicators and questions will be discussed in relevant paragraphs of
the next chapters.
2.1.2 Methods of data collection
Today, the Benchmark is built on two methods of data collection, which together can assess all top level
indicators:
� Mystery Shopping: the use of Mystery Shoppers who are trained and briefed to observe, experience, and
measure a (public service) process against a detailed, objective evaluation checklist by acting as a
prospective user. Mystery shopping was the method of choice for the assessment of all top level
benchmarks under review this year.
� User survey: an end user web-aided survey with approximately 27.000 completes for the EU28+. This
method was primarily used for the assessment of priority area’s which are not included in the 2014
measurement. Therefore, this year’s report will not discuss results of the user survey in detail.
Page 12 of 111
As illustrated above, the 2014 measurement only included one method of data collection for the ‘tradional’
eGovernment benchmark: Mystery Shopping. For each life event, persona descriptions have been developed
which provide guidance to the shoppers when performing the assessment. They make the same choices as the
fictional persona would. The purpose of Mystery Shopping within the context of the benchmarking framework is
to detect whether online public service provision is organised around user’s needs.
For this purpose each researcher - Mystery Shopper - acts as a regular citizen and his ‘journey’ is time-boxed, i.e.
each mystery shopper has one day to assess one life event. This implies that when a particular feature could not
be found within reasonable time, it is answered negatively. This doesn’t per se mean the particular feature is not
online available – it does mean that it apparently wasn’t easy to find, intuitively, without too many clicks and
that it is very likely that regular citizens or entrepreneurs won’t use it or find it neither.
Mystery Shopping was, in principle, carried out by two native Mystery Shoppers from every participating
country. Mystery shoppers usually assess their own country (which is necessary as many eGovernment services
require electronic identification which is only available for country nationals). An exception is the assessment of
the Cross Border Mobility top level benchmark. For Cross Border Mobility, all participation countries were
assessed by two Mystery Shoppers from another country.
2.1.3 Domains: life events.
The benchmark concerns (e)Government as a whole, and therefore covers as much as possible of the landscape
of public services by using life events. This measurement has selected a set of seven life events that cover the
most common domains of public services, representative for both businesses and citizens. Associated with every
life event is a customer journey that businesses or citizens experiencing this life event will go through.
The seven life events are:
� Starting up a business and early trading operations;
� Regular business operations;
� Losing and finding a job;
� Moving;
� Starting a small claims procedure;
� Owning and driving a car;
� Studying.
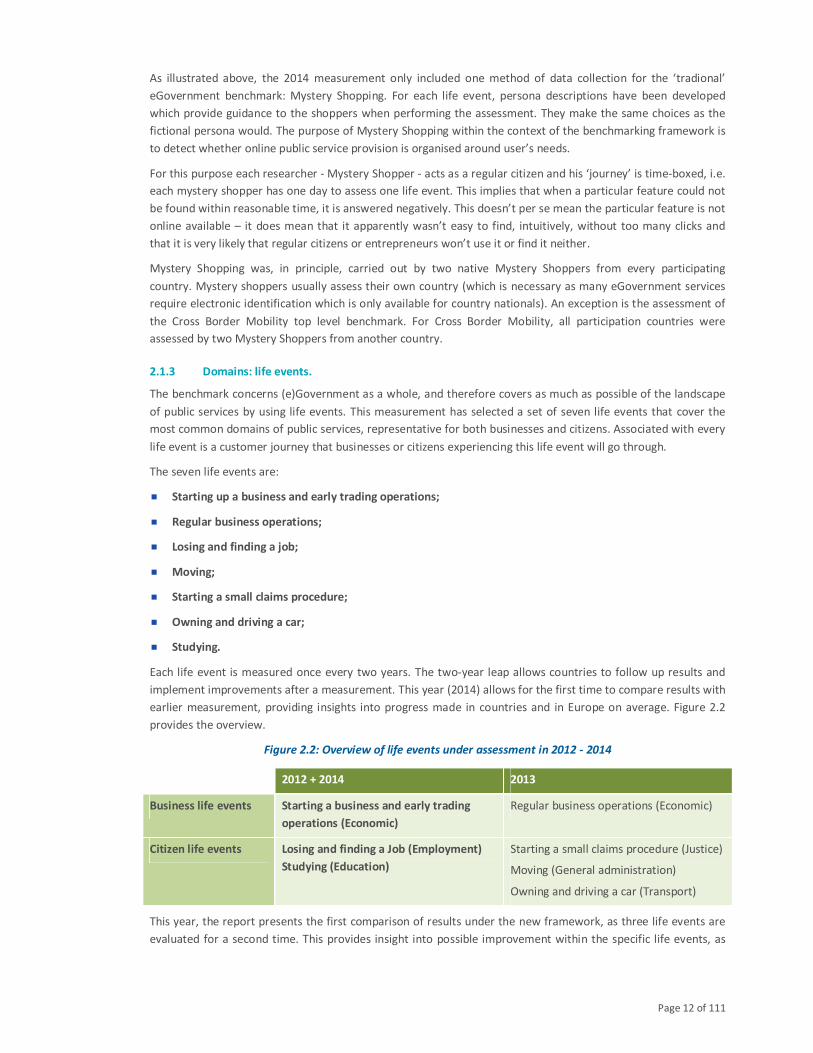
Each life event is measured once every two years. The two-year leap allows countries to follow up results and
implement improvements after a measurement. This year (2014) allows for the first time to compare results with
earlier measurement, providing insights into progress made in countries and in Europe on average. Figure 2.2
provides the overview.
Figure 2.2: Overview of life events under assessment in 2012 - 2014
2012 + 2014 2013
Business life events Starting a business and early trading
operations (Economic)
Regular business operations (Economic)
Citizen life events Losing and finding a Job (Employment)
Studying (Education)
Starting a small claims procedure (Justice)
Moving (General administration)
Owning and driving a car (Transport)
This year, the report presents the first comparison of results under the new framework, as three life events are
evaluated for a second time. This provides insight into possible improvement within the specific life events, as
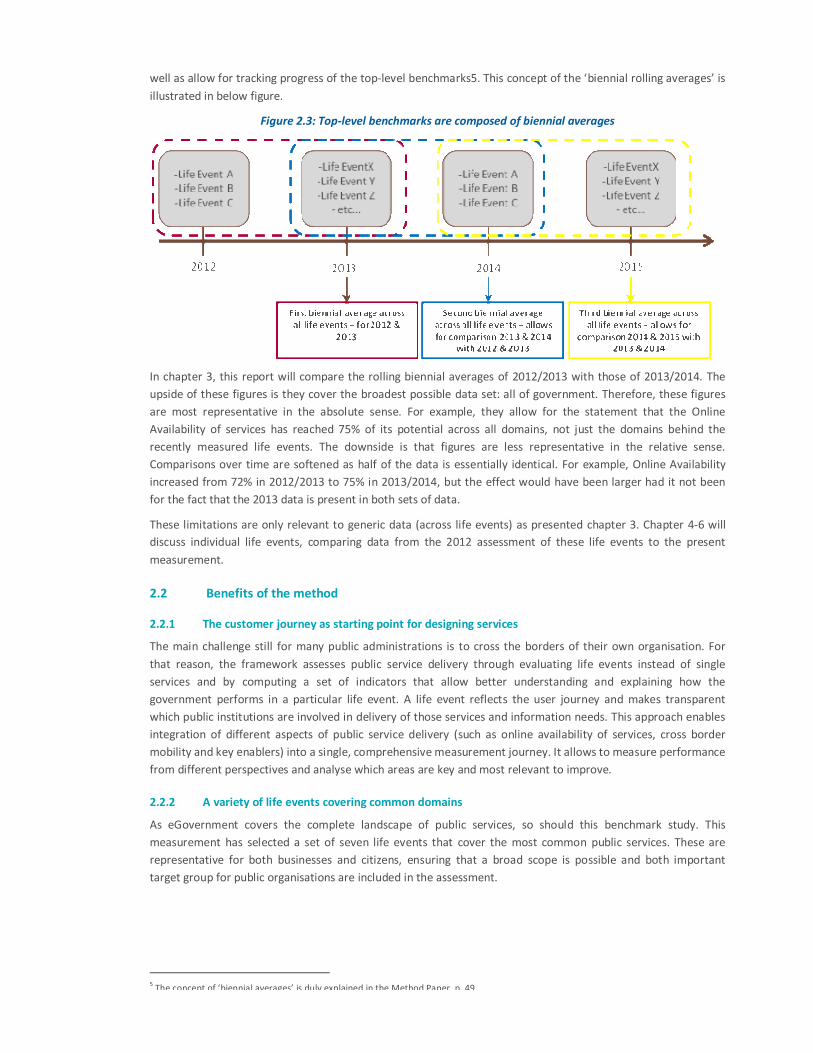
well as allow for tracking progress of the top-level benchmarks5. This concept of the ‘biennial rolling averages’ is
illustrated in below figure.
Figure 2.3: Top-level benchmarks are composed of biennial averages
In chapter 3, this report will compare the rolling biennial averages of 2012/2013 with those of 2013/2014. The
upside of these figures is they cover the broadest possible data set: all of government. Therefore, these figures
are most representative in the absolute sense. For example, they allow for the statement that the Online
Availability of services has reached 75% of its potential across all domains, not just the domains behind the
recently measured life events. The downside is that figures are less representative in the relative sense.
Comparisons over time are softened as half of the data is essentially identical. For example, Online Availability
increased from 72% in 2012/2013 to 75% in 2013/2014, but the effect would have been larger had it not been
for the fact that the 2013 data is present in both sets of data.
These limitations are only relevant to generic data (across life events) as presented chapter 3. Chapter 4-6 will
discuss individual life events, comparing data from the 2012 assessment of these life events to the present
measurement.
2.2 Benefits of the method
2.2.1 The customer journey as starting point for designing services
The main challenge still for many public administrations is to cross the borders of their own organisation. For
that reason, the framework assesses public service delivery through evaluating life events instead of single
services and by computing a set of indicators that allow better understanding and explaining how the
government performs in a particular life event. A life event reflects the user journey and makes transparent
which public institutions are involved in delivery of those services and information needs. This approach enables
integration of different aspects of public service delivery (such as online availability of services, cross border
mobility and key enablers) into a single, comprehensive measurement journey. It allows to measure performance
from different perspectives and analyse which areas are key and most relevant to improve.
2.2.2 A variety of life events covering common domains
As eGovernment covers the complete landscape of public services, so should this benchmark study. This
measurement has selected a set of seven life events that cover the most common public services. These are
representative for both businesses and citizens, ensuring that a broad scope is possible and both important
target group for public organisations are included in the assessment.
5 The concept of ‘biennial averages’ is duly explained in the Method Paper, p. 49.
Page 14 of 111
2.2.3 The customer as evaluator of services
The assessment of life events is done by Mystery Shoppers. These are trained and briefed to observe,
experience, and measure a (public service) process by acting as a prospective user.
2.2.4 National governments validate results
The method for this yearly exercise has been designed through an intense collaborative process with
participating countries representatives. They are also involved in the measurement itself, for two reasons:
� At the start of the exercise, to validate the sample and key characteristics of the services under assessment;
this ensures researchers visit the correct websites, informs them in case a certain service is not
relevant/existing or delivered automatically (without the user having to do anything).
� At the closure of the exercise, to validate the research results in collaboration with the responsible
organisations in a country and possibly correct obvious erroneous findings. There is one exception and that
concerns the ease and Speed of Use assessment, which is a personal evaluation of the life event process by
the researcher.
European Union and other participating countries continue to play a vital collaborative role in the measurement
process. Not only through the above mentioned points, but also through workshops that drive learning,
stimulate to share experiences and addressing policy recommendations to continuously improve. The continued
active engagement in this learning process enhances the value that can be derived from this survey.
2.2.5 Coherent, integrated and aligned with European Commission policy goals
The measurement is aligned with policy priorities. The benchmark should measure those elements that are of
relevance to the Commission and participating countries, in their aim to better serve citizens and businesses
while reducing costs. The framework is structured around four main pillars of the eGovernment Action Plan
2011-2015: User Empowerment, Digital Single Market, Efficiency & Effectiveness and Preconditions. These
priorities are required to achieve the wished for next generation of eGovernment services: better, cheaper and
faster. The top-level benchmarks in this framework consist of several indicators, designed to correspond with
those policy priorities, allowing analysing to what extent Europe is progressing on (elements of) these priorities.
The framework is flexible and open to innovation. Of course the measurement can’t cover every priority and
things change over time. The design of the Framework is flexible, and allows to add/modify indicators as
priorities change and there is a need to focus on new policies or new categories of stakeholders. Since the top-
level indicators are built with a bottom-up approach, the basic data can be assembled in different ways and it is
possible to introduce new methods as already proven in the past years.
The framework moves from supply to demand side measurement. As eGovernment services are increasingly
evolving around the users’ needs – measuring the performance of those services should also evolve around
users’ needs. Hence the decision to include methods and indicators assessing eGovernment from the perspective
of a regular user. This is reflected in the choice of running a citizen user survey, where representative panels of
citizens in each country provided their views on among others use of online public services, satisfaction and
perceived benefits and barriers. The choice to include Mystery Shopping as a method and a pilot on Sentiment
analysis are also testimony to that.
The eGovernment benchmark framework consists in six top-level benchmarks, constructed around four policy
priorities:
� The Top-level Benchmark on User Centric Government assesses the Availability and Usability of public
eServices (as collected through life event assessment) and examines Awareness and Barriers to use so as to
shed light on the apparent availability-usage gap (insights drawn from the demand-side user survey).
� The Top-level Benchmark on Transparent Government evaluates the Transparency of Government
authorities’ operations and service delivery procedures and the accessibility of personal data to users (the
latter being one of the most frequently demanded eServices as the Action Plan points out). This Benchmark
Page 15 of 111
leverages on the Open and Transparent Government Pilot conducted among a group of 10 participating
countries during the course of 2010. Data is collected through life event assessment by Mystery Shoppers.
� The Seamless Government Benchmarks, for both Citizens and Businesses, measures the Availability and
Usability of select high-impact cross border services. Data is collected through life event assessment by
Mystery Shoppers.
� The Top-level Benchmark on Effective Government provides for Usage, User Satisfaction and Sentiment (i.e.
perception) metrics. These indicate whether the eChannel is citizens’ and businesses’ first choice, and
whether Governments reach their User Satisfaction and Effectiveness targets. Data for these indicators is
collected through a demand side user survey.
� The Smart Government Top-level Benchmark assesses the availability of Key Enablers. Data is collected
through life event assessment by mystery shoppers.
2.3 Towards a new model for monitoring eGovernment performance in Europe?
The European eGovernment Benchmark has deepened into online service evolution since 2001, at first by
measuring basic service availability and sophistication, and since 2012 following the framework as described
above. For over a decade it has supported policy makers, provoked valuable discussions, set new ambitions, and
identified countries to learn from. However, with technology advancing at speed of light and rapidly changing the
arena for eGovernment, there is a need to keep evaluating the measurement framework to keep it relevant.
Also, the adopted method is closely related to the eGovernment Action plan which ends in 2015. This year would
also be the year that all life events have been measured twice, and possibly new focus is required to stimulate
eGovernment developments. If Europe is heading towards a new generation of eGovernment services, it is
important to understand and to measure the change in users’ needs and how governments are actually
exploiting the benefits of eGovernment.
This year’s eGovernment benchmarking reports presents elements on top of the traditional eGovernment
framework. These could provide the basis for a new model.
First, an analysis of the mobile friendliness of websites has been conducted to assess the extent to which
governments are opening up their websites for users of mobile devices such as smart phones and tablets. This is
an important element in user friendly eGovernment channels, as users should not be limited in the channels they
use.
Second, the reports include a cluster analysis of countries’ eGovernment maturity. A large amount of absolute
indicators were clustered to be able to compare countries among the same defined performance.The cross
analysis on these factors will produce relative performances of single countries (or clusters of countries) taking
into account exogenous factors in order to interpret the performance assessment from holistic perspective. The
ultimate goal is to identify and to suggest specific policies for each country in order to achieve its respective
objectives in eGovernment.
Page 16 of 111
3 Synthesis of top-level benchmarks
‘If Europe wants to lead this revolution, there is a need to accelerate the digital transformation of all
industry sectors.’
Commissioner Günther Oettinger
10 March 2015 at Date Conference6
3.1 eGovernment services in various domains
In this report, eGovernment encompasses the complete area of customer facing digital activities by public
organisations. Governments and other public actors alike have recognised the immense importance of providing
eGovernment services. The last decade has witnessed significant uptake of eGovernment to the point that many
of these services are now part of the everyday operations of publics organisation. In that sense, customer facing
eGovernment has followed the same path that the uptake of internally focussed ICT services have followed.
These services are now considered to be of strategic importance to administrations.
That is not to say that the provision and adoption of eGovernment services have reached their final stage. They
have not realised the full potential that today’s technology can offer. Previous versions of this benchmark
showed the uptake of eGovernment in Europe has steadily progressed but is still very much incomplete. Further
actions to realize this potential is needed, as well as further innovation to create new opportunities. Together,
this can create better, faster and cheaper online services.
The European Commission and the participating countries share a clear ambition to build these improved
services. In the eGovernment Action Plan7, these entities committees themselves measurable results in four
domains. First, the administrations aim to empower end users (citizens and businesses) by providing user centric
services. Second, governments want to use digital channels to create transparency, being open about service
delivery, personal data and their own organisations. A third goal is to create the Digital Single Market, which
requires digital public services across European borders free of technological barriers, administrative hassle or
standardisation issues. Their fourth goal is provide more key technological enablers, thereby setting the right
pre-conditions for eGovernment to flourish. Governments strive to pursue all four goals in an effective way,
spending taxpayers money efficiently.
Our measurement of eGovernment services is closely aligned with these goals. As was outlined in chapter 2, the
measurement covers top-level indicators corresponding to these four goals. We have assessed these indicators in
a number of domains, always aiming to work from the viewpoint of citizens and businesses. Therefore, we have
carried out an in-depth measurement for seven life events. These life events represent seven of the most
important customer journeys citizens and businesses will come across when working with government. An
example is the registration at a university and its courses when you start studying. The life events all cover both
the need for information that citizens and businesses may have as well as mandatory interactions with
government they should go through.
The measurement in this framework was carried out twice before, over 2012 and 2013. The 2012 measurement
assessed the scores for three life events while the 2013 measurement assessed the other four. Now, we return
the first three life events with the measurement over 2014. This means that for the first time since the
introduction of the new benchmark framework, the progress over time can be analysed in detail. The three life
events under review are Starting up a business, Losing and finding a job and Studying.
This chapter will present the synthesis results of the assessment, which means it will review the eGovernment
goals across life events. Paragraph 4.2 will review differences between on a g that is across all life events. This
high level analyses will be elaborated upon in the following paragraphs, respectively focussing on User
Empowerment (paragraph 4.3), Transparency (4.4), Cross Border Mobility (4.5) and Key Enablers (4.6).
6 Full text at https://ec.europa.eu/commission/2014-2019/oettinger/announcements/speech-date-conference-digital-union-and-european-
microelectronics-strategy_en 7
http://ec.europa.eu/information_society/activities/egovernment/action_plan_2011_2015/index_en.htm
Page 17 of 111
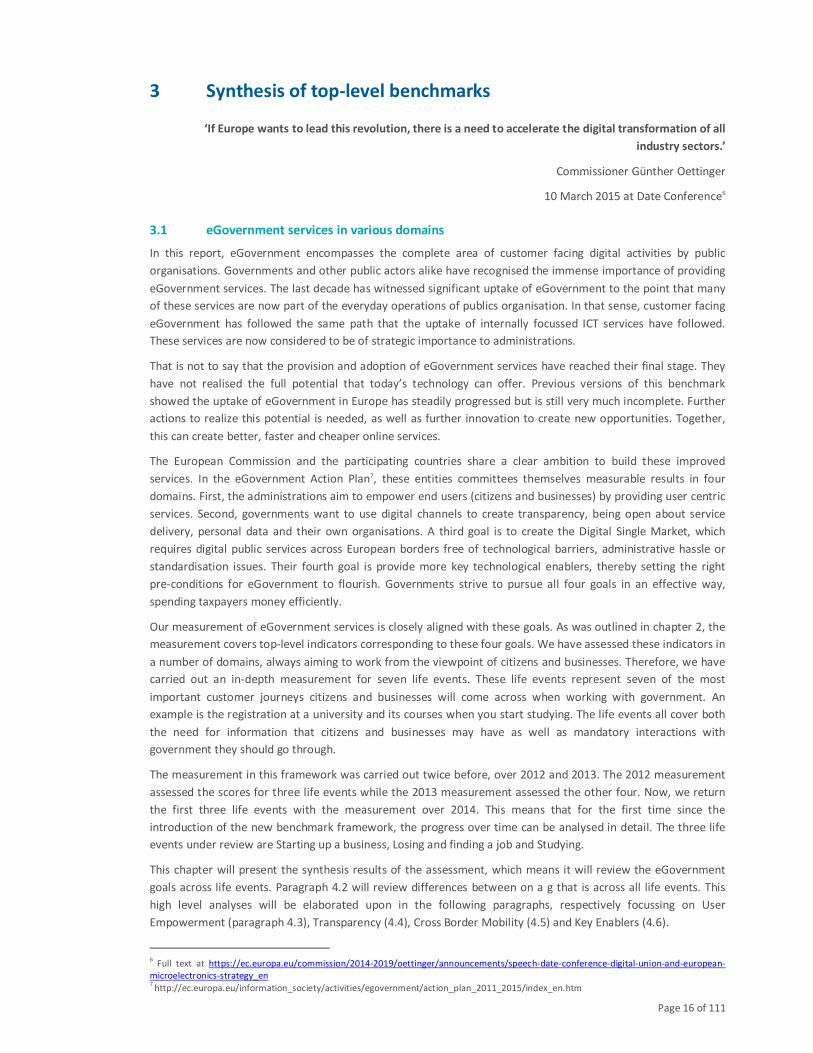
3.2 Bird’s eye view on eGovernment in Europe
The four main priority areas of the eGovernment Action Plan are shown in figure 3.1. Each of these priority areas
was assessed by one or more top level benchmarks. Data for these benchmarks was collected over time. The top
level benchmarks Effective Government and User Centricity (user survey) were measured once, in 2012. The
results were presented in earlier benchmark reports and will not be discussed in this report.
Data on the other top level benchmarks, User Centricity (mystery shopping), Transparency, Citizen Mobility,
Business Mobility and Key Enablers has been collected over three separate measurements, although every
measurement only concerned half of the life events. The life events measured in 2012 have now been measured
again, allowing for early comparisons over time.
Figure3.1: Top-level benchmarks EU28+ 2012/2013 versus 2013/2014 (%)
Figure 3.1 shows the results for all top level benchmarks. The top level benchmark with the highest score is User
Centricity (mystery shopping), with a score of 73 out of a possible 100 points. This indicates that European
eGovernment services are fairly well suited to users. By itself, this may not be enough to reach true user
empowerment as Transparency, another important part of this policy priority area, is only at 51%. The top level
benchmarks of Business Mobility and Citizen Mobility stand at 58% and 43% respectively, indicating that more
work needs to be done to create a true Digital Single Market without barriers, especially when it comes to
citizens. Key Enablers stands at 50 points, indicating that Europe is exactly half way when it comes to setting the
right pre-conditions for innovative eGovernment.
For the first time, results can be compared over time, comparing the data on life events measured in 2012 and
2013 to those measured in 2014 and 2013. Readers should note that any differences over time are softened by
the fact that both sets of data include the life events of 2013, which have only been assessed once. This means
that by definition the data sets are half identical so that large differences over time are not to be expected. Next
year’s measurement will further update the data, allowing 2012/2013–2014/2015 comparisons.
In this light, the advance in the Digital Single Market area is noteworthy. Both the Business Mobility and Citizens
Mobility score have significantly increased over time, indicating that it is gradually becoming easier for
eGovernment users to work across borders. Users are also somewhat more empowered with medium increases
in User Centricity and Transparency. Progress regarding Key Enablers seems to be stagnating, with only a
marginal gain in 2013/2014 compared to 2012/2013.
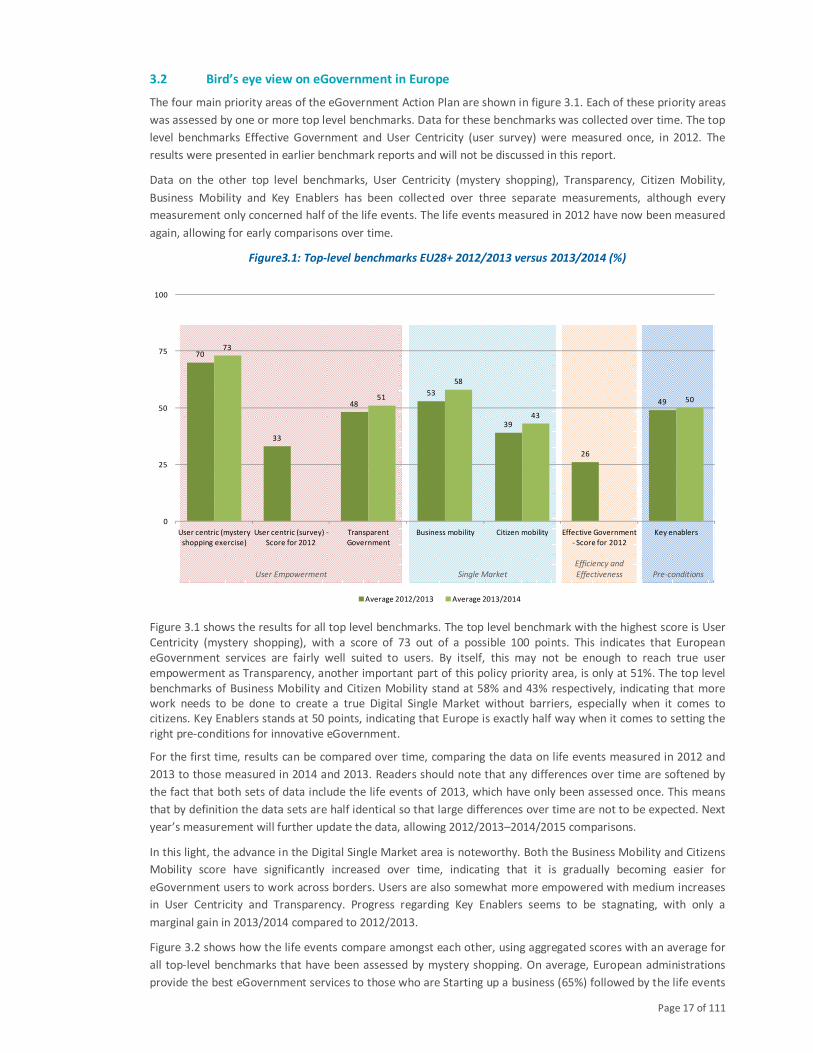
Figure 3.2 shows how the life events compare amongst each other, using aggregated scores with an average for
all top-level benchmarks that have been assessed by mystery shopping. On average, European administrations
provide the best eGovernment services to those who are Starting up a business (65%) followed by the life events
Pre-conditionsSingle Market
Efficiency and
EffectivenessUser Empowerment
70
33
48
53
39
26
49
73
51
58
43
50
0
25
50
75
100
User centric (mystery
shopping exercise)
User centric (survey) -
Score for 2012
Transparent
Government
Business mobility Citizen mobility Effective Government
- Score for 2012
Key enablers
Average 2012/2013 Average 2013/2014
of Losing and finding a job (63%) and Studying (62%). These are all life events which have now been assessed for
the second time. Services for all three life events have improved since they were first assessed in 2012, with
Studying rising 8 points (up from 54%) and Starting up a business rising 5 points. Losing and finding a job
witnessed the least progress, with its average score only rising 3 points since 2012. The two life events for
business tend to score better than the citizen related life events, with Starting up a business and Regular
business operations both at the top of their measurement set.
Figure 3.2: Aggregated EU28+ results per life event (%)
The following paragraphs will discuss in more detail how these aggregate scores came to be, focussing first on
the top level benchmark indicator of User Centricity.
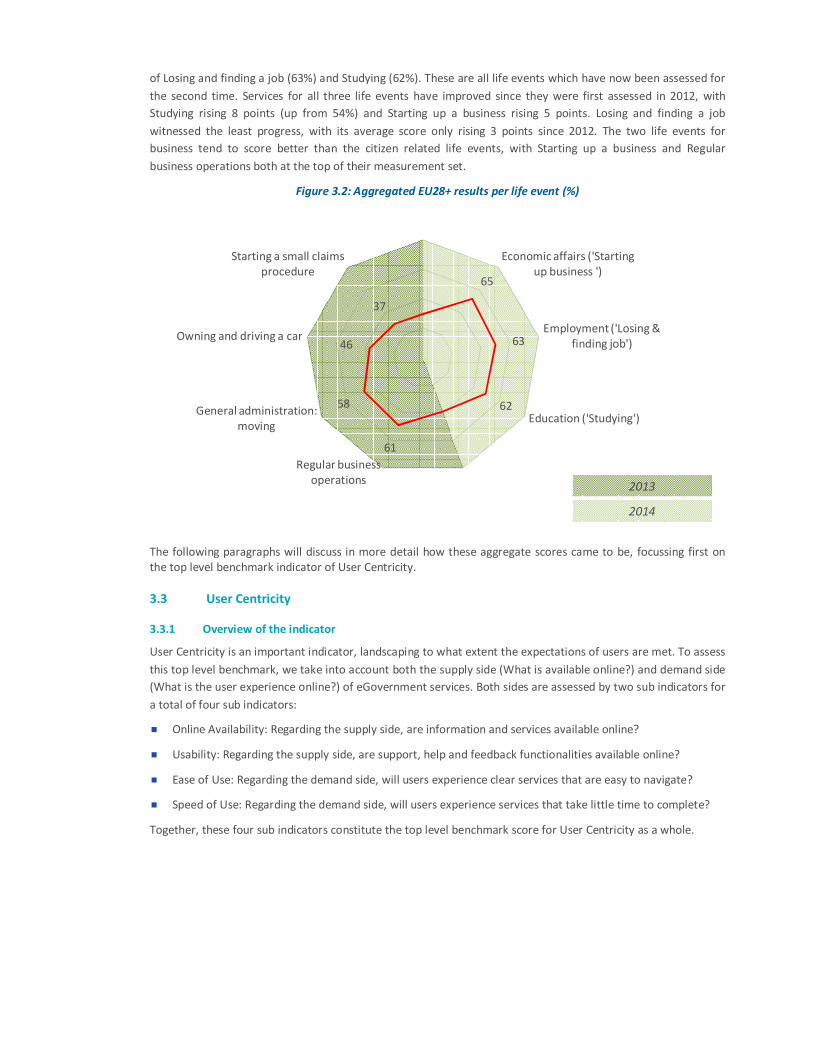
3.3 User Centricity
3.3.1 Overview of the indicator
User Centricity is an important indicator, landscaping to what extent the expectations of users are met. To assess
this top level benchmark, we take into account both the supply side (What is available online?) and demand side
(What is the user experience online?) of eGovernment services. Both sides are assessed by two sub indicators for
a total of four sub indicators:
� Online Availability: Regarding the supply side, are information and services available online?
� Usability: Regarding the supply side, are support, help and feedback functionalities available online?
� Ease of Use: Regarding the demand side, will users experience clear services that are easy to navigate?
� Speed of Use: Regarding the demand side, will users experience services that take little time to complete?
Together, these four sub indicators constitute the top level benchmark score for User Centricity as a whole.
65
63
62
61
58
46
37
Economic affairs ('Starting
up business ')
Employment ('Losing &
finding job')
Education ('Studying')
Regular business
operations
General administration:
moving
Owning and driving a car
Starting a small claims
procedure
2014
2013
Page 19 of 111
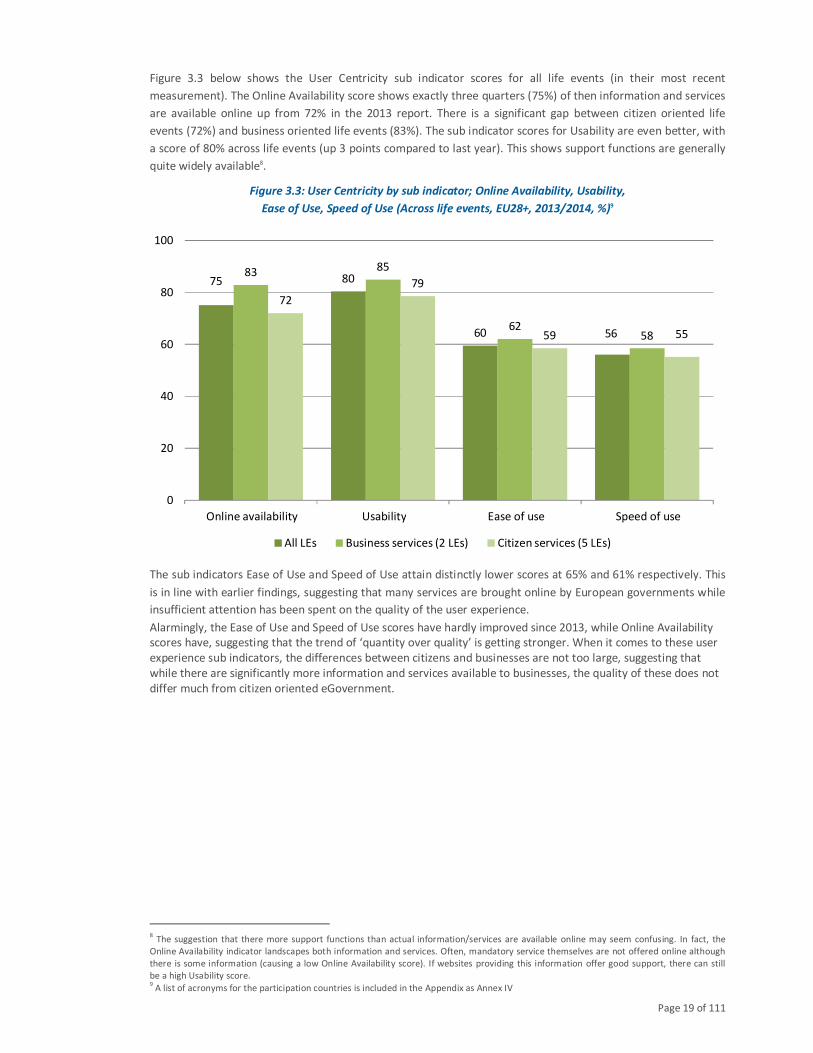
Figure 3.3 below shows the User Centricity sub indicator scores for all life events (in their most recent
measurement). The Online Availability score shows exactly three quarters (75%) of then information and services
are available online up from 72% in the 2013 report. There is a significant gap between citizen oriented life
events (72%) and business oriented life events (83%). The sub indicator scores for Usability are even better, with
a score of 80% across life events (up 3 points compared to last year). This shows support functions are generally
quite widely available8.
Figure 3.3: User Centricity by sub indicator; Online Availability, Usability,
Ease of Use, Speed of Use (Across life events, EU28+, 2013/2014, %)9
The sub indicators Ease of Use and Speed of Use attain distinctly lower scores at 65% and 61% respectively. This
is in line with earlier findings, suggesting that many services are brought online by European governments while
insufficient attention has been spent on the quality of the user experience.
Alarmingly, the Ease of Use and Speed of Use scores have hardly improved since 2013, while Online Availability
scores have, suggesting that the trend of ‘quantity over quality’ is getting stronger. When it comes to these user
experience sub indicators, the differences between citizens and businesses are not too large, suggesting that
while there are significantly more information and services available to businesses, the quality of these does not
differ much from citizen oriented eGovernment.
8 The suggestion that there more support functions than actual information/services are available online may seem confusing. In fact, the
Online Availability indicator landscapes both information and services. Often, mandatory service themselves are not offered online although
there is some information (causing a low Online Availability score). If websites providing this information offer good support, there can still
be a high Usability score. 9 A list of acronyms for the participation countries is included in the Appendix as Annex IV
75 80
60 56
83 85
6258
72
79
59 55
0
20
40
60
80
100
Online availability Usability Ease of use Speed of use
All LEs Business services (2 LEs) Citizen services (5 LEs)
Page 20 of 111
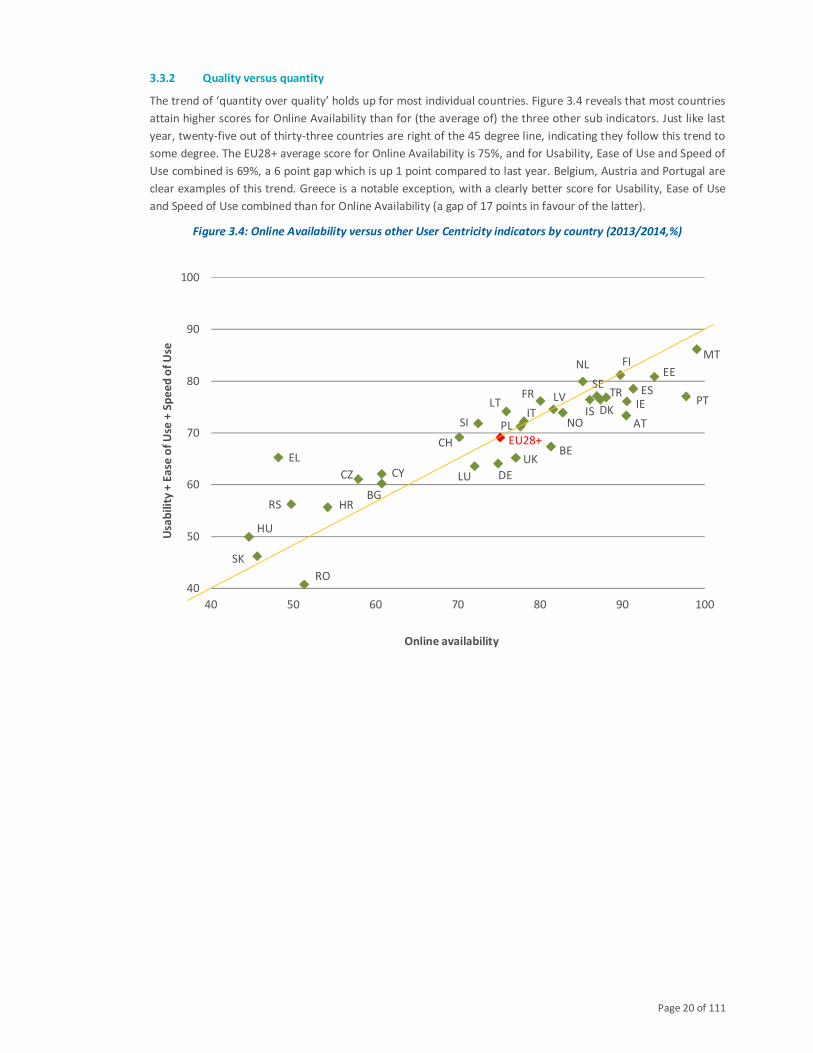
3.3.2 Quality versus quantity
The trend of ‘quantity over quality’ holds up for most individual countries. Figure 3.4 reveals that most countries
attain higher scores for Online Availability than for (the average of) the three other sub indicators. Just like last
year, twenty-five out of thirty-three countries are right of the 45 degree line, indicating they follow this trend to
some degree. The EU28+ average score for Online Availability is 75%, and for Usability, Ease of Use and Speed of
Use combined is 69%, a 6 point gap which is up 1 point compared to last year. Belgium, Austria and Portugal are
clear examples of this trend. Greece is a notable exception, with a clearly better score for Usability, Ease of Use
and Speed of Use combined than for Online Availability (a gap of 17 points in favour of the latter).
Figure 3.4: Online Availability versus other User Centricity indicators by country (2013/2014,%)
AT
BE
BG
CH
CYCZ DE
DK
EE
EL
ES
FI
FR
HR
HU
IEISIT
LT
LU
LV
MTNL
NOPL
PT
RO
RS
SE
SI
SK
TR
UK
EU28+
40
50
60
70
80
90
100
40 50 60 70 80 90 100
Usa
bil
ity
+ E
ase
of
Use
+ S
pe
ed
of
Use
Online availability
Page 21 of 111
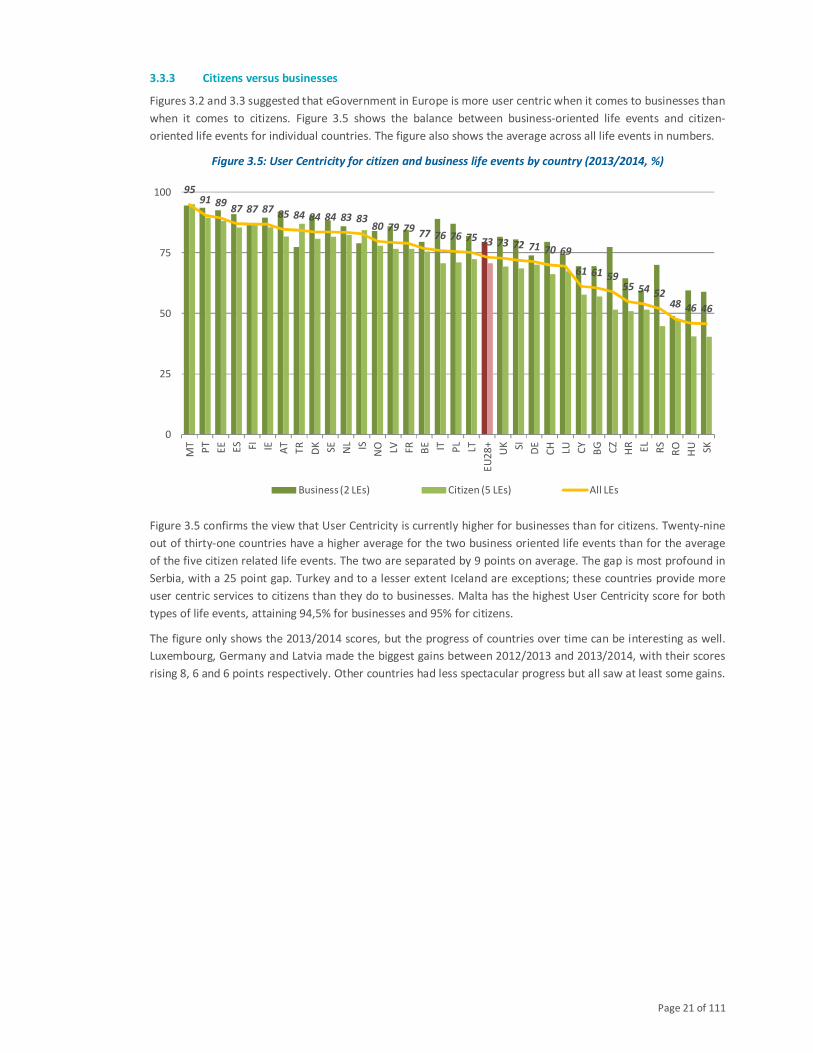
3.3.3 Citizens versus businesses
Figures 3.2 and 3.3 suggested that eGovernment in Europe is more user centric when it comes to businesses than
when it comes to citizens. Figure 3.5 shows the balance between business-oriented life events and citizen-
oriented life events for individual countries. The figure also shows the average across all life events in numbers.
Figure 3.5: User Centricity for citizen and business life events by country (2013/2014, %)
Figure 3.5 confirms the view that User Centricity is currently higher for businesses than for citizens. Twenty-nine
out of thirty-one countries have a higher average for the two business oriented life events than for the average
of the five citizen related life events. The two are separated by 9 points on average. The gap is most profound in
Serbia, with a 25 point gap. Turkey and to a lesser extent Iceland are exceptions; these countries provide more
user centric services to citizens than they do to businesses. Malta has the highest User Centricity score for both
types of life events, attaining 94,5% for businesses and 95% for citizens.
The figure only shows the 2013/2014 scores, but the progress of countries over time can be interesting as well.
Luxembourg, Germany and Latvia made the biggest gains between 2012/2013 and 2013/2014, with their scores
rising 8, 6 and 6 points respectively. Other countries had less spectacular progress but all saw at least some gains.
9591 89
87 87 87 85 84 84 84 83 8380 79 79
77 76 76 75 73 73 72 71 70 69
61 61 5955 54 52
48 46 46
0
25
50
75
100M
T
PT
EE
ES FI IE AT
TR
DK SE NL IS
NO LV FR BE IT PL
LT
EU
28
+
UK SI DE
CH LU CY
BG CZ
HR EL
RS
RO
HU SK
Business (2 LEs) Citizen (5 LEs) All LEs
Page 22 of 111
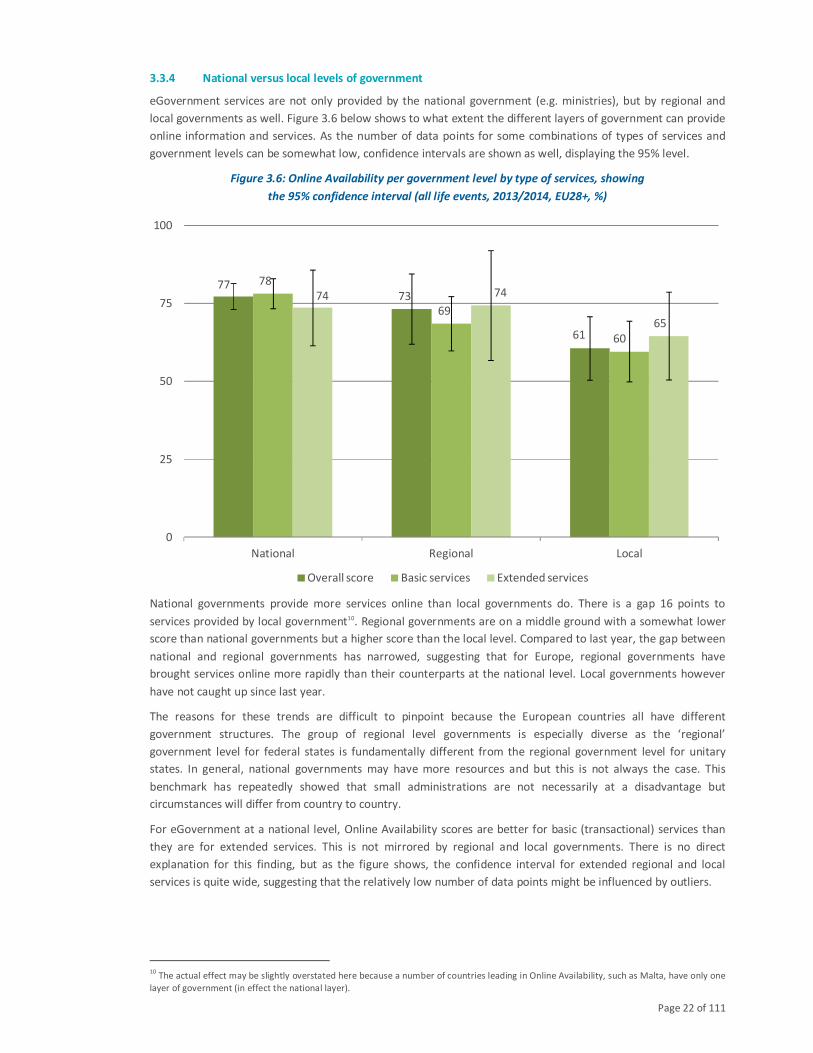
3.3.4 National versus local levels of government
eGovernment services are not only provided by the national government (e.g. ministries), but by regional and
local governments as well. Figure 3.6 below shows to what extent the different layers of government can provide
online information and services. As the number of data points for some combinations of types of services and
government levels can be somewhat low, confidence intervals are shown as well, displaying the 95% level.
Figure 3.6: Online Availability per government level by type of services, showing
the 95% confidence interval (all life events, 2013/2014, EU28+, %)
National governments provide more services online than local governments do. There is a gap 16 points to
services provided by local government10. Regional governments are on a middle ground with a somewhat lower
score than national governments but a higher score than the local level. Compared to last year, the gap between
national and regional governments has narrowed, suggesting that for Europe, regional governments have
brought services online more rapidly than their counterparts at the national level. Local governments however
have not caught up since last year.
The reasons for these trends are difficult to pinpoint because the European countries all have different
government structures. The group of regional level governments is especially diverse as the ‘regional’
government level for federal states is fundamentally different from the regional government level for unitary
states. In general, national governments may have more resources and but this is not always the case. This
benchmark has repeatedly showed that small administrations are not necessarily at a disadvantage but
circumstances will differ from country to country.
For eGovernment at a national level, Online Availability scores are better for basic (transactional) services than
they are for extended services. This is not mirrored by regional and local governments. There is no direct
explanation for this finding, but as the figure shows, the confidence interval for extended regional and local
services is quite wide, suggesting that the relatively low number of data points might be influenced by outliers.
10
The actual effect may be slightly overstated here because a number of countries leading in Online Availability, such as Malta, have only one
layer of government (in effect the national layer).
7773
61
78
69
60
74 74
65
0
25
50
75
100
National Regional Local
Overall score Basic services Extended services
Page 23 of 111
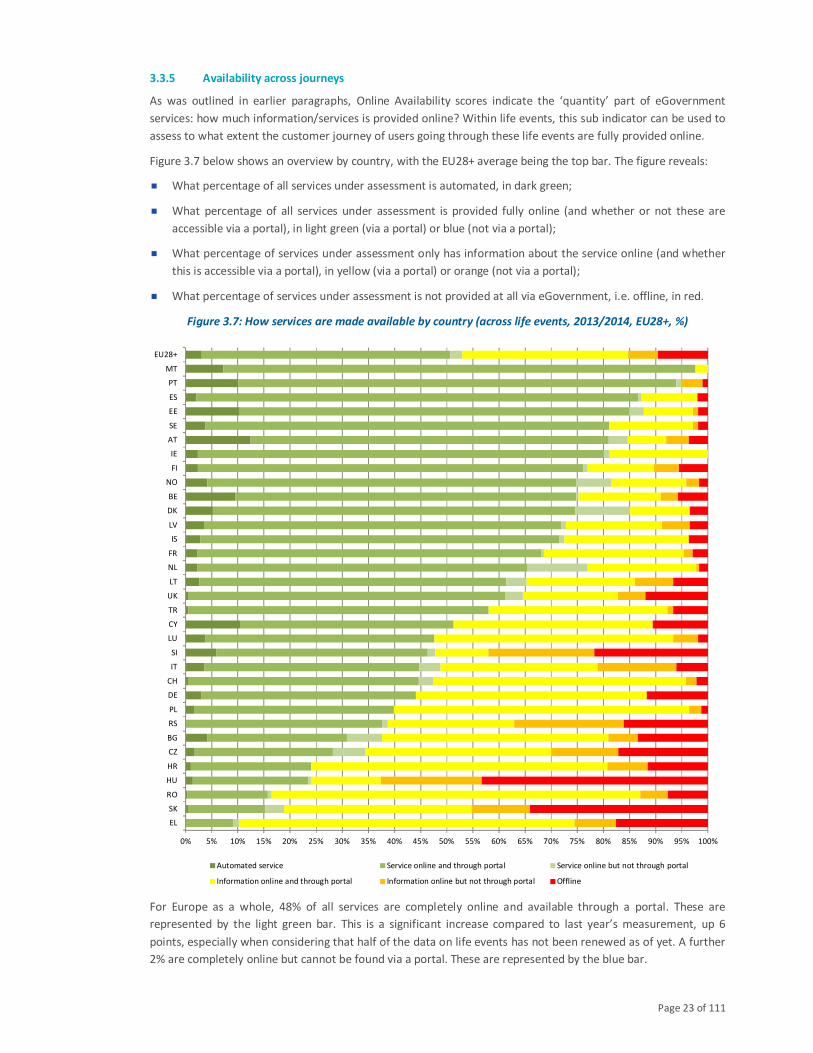
3.3.5 Availability across journeys
As was outlined in earlier paragraphs, Online Availability scores indicate the ‘quantity’ part of eGovernment
services: how much information/services is provided online? Within life events, this sub indicator can be used to
assess to what extent the customer journey of users going through these life events are fully provided online.
Figure 3.7 below shows an overview by country, with the EU28+ average being the top bar. The figure reveals:
� What percentage of all services under assessment is automated, in dark green;
� What percentage of all services under assessment is provided fully online (and whether or not these are
accessible via a portal), in light green (via a portal) or blue (not via a portal);
� What percentage of services under assessment only has information about the service online (and whether
this is accessible via a portal), in yellow (via a portal) or orange (not via a portal);
� What percentage of services under assessment is not provided at all via eGovernment, i.e. offline, in red.
Figure 3.7: How services are made available by country (across life events, 2013/2014, EU28+, %)
For Europe as a whole, 48% of all services are completely online and available through a portal. These are
represented by the light green bar. This is a significant increase compared to last year’s measurement, up 6
points, especially when considering that half of the data on life events has not been renewed as of yet. A further
2% are completely online but cannot be found via a portal. These are represented by the blue bar.
0% 5% 10% 15% 20% 25% 30% 35% 40% 45% 50% 55% 60% 65% 70% 75% 80% 85% 90% 95% 100%
EL
SK
RO
HU
HR
CZ
BG
RS
PL
DE
CH
IT
SI
LU
CY
TR
UK
LT
NL
FR
IS
LV
DK
BE
NO
FI
IE
AT
SE
EE
ES
PT
MT
EU28+
Automated service Service online and through portal Service online but not through portal
Information online and through portal Information online but not through portal Offline
Page 24 of 111
There is also a share of government interactions which are supported online by information, but not by the
actual service itself. These are represented by the yellow (when information is accessible via a portal) and orange
(when it is not) bars. Together, these constitute 37,5% of all European eGovernment interactions, which is 5
points down compared to last years’ measurement. This indicates that Europe is slowly bringing more actual
services online. Still, 37,5% is a sizeable component considering the fact that all of these services could be
provided fully online but still is not.
Across Europe, 9,5% of all interactions are completely offline, i.e. not supported by eGovernment. Notably, this is
virtually no progress compared to last years’ measurement. Almost no country succeeded in reducing the
number of completely unsupported interactions11. Interestingly, there was much more progress in setting up
complete interactions than there was in ‘just’ providing information via the online channels.
As regards the use of portals, Europe has traditionally been strong in setting up portals which linked users to
these services. Only 2,3% of all actual services and 5,7% of all information is not accessible via a portal. The last
year has witnessed little further progress as these shares are not significantly down from last years’
measurement.
When looking at individual countries, Malta and Portugal are leading examples, respectively providing 97% and
94% of all services either automated or fully online. Compared to last year, Latvia and Luxembourg have made
most progress, both providing many more services fully online. Greece provides the lowest number of services
fully online while Hungary has the most interactions completely offline. Romania is noteworthy for providing
information, but not the service itself via the online channels, as over 75% of all Romanian interaction are in this
category. When it comes to the use of portals, Cyprus is noteworthy as portals link to all of its interactions, while
Slovenia and Serbia have 22% of their services and interactions not accessible via a portal.
3.3.6 Automated services
Figure 3.7 also indicates how many services are provided automatically, meaning that the user does not have to
interact (separately for a specific service) with government. In effect, the user will not have to do anything to
receive the service. For instance, in the Netherlands after registering their company at the Companies
Registration Office (in Netherlands part of the Chambers of Commerce), the entrepreneurs automatically
receives their VAT number from the Tax Agency. Cross-agency collaboration is often needed to provide these
automated services, but benefits are large for both the users and the internal efficiency of public organisations
involved.
The new measurement indicates that 3% of all services in Europe are now automated. This is a small percentage
which has not increased at all compared to last year, suggesting that government agencies are still working in
silos – whether that be within separate domains or a specific government tier. Governments do not seem to be
making much progress in this regard. Leading European countries are Austria, Estonia and Portugal (with
respectively 12, 10 and 10 % of services delivered automatically) and from this year also Cyprus, where 11% of
the eGovernment services are now marked as automated.
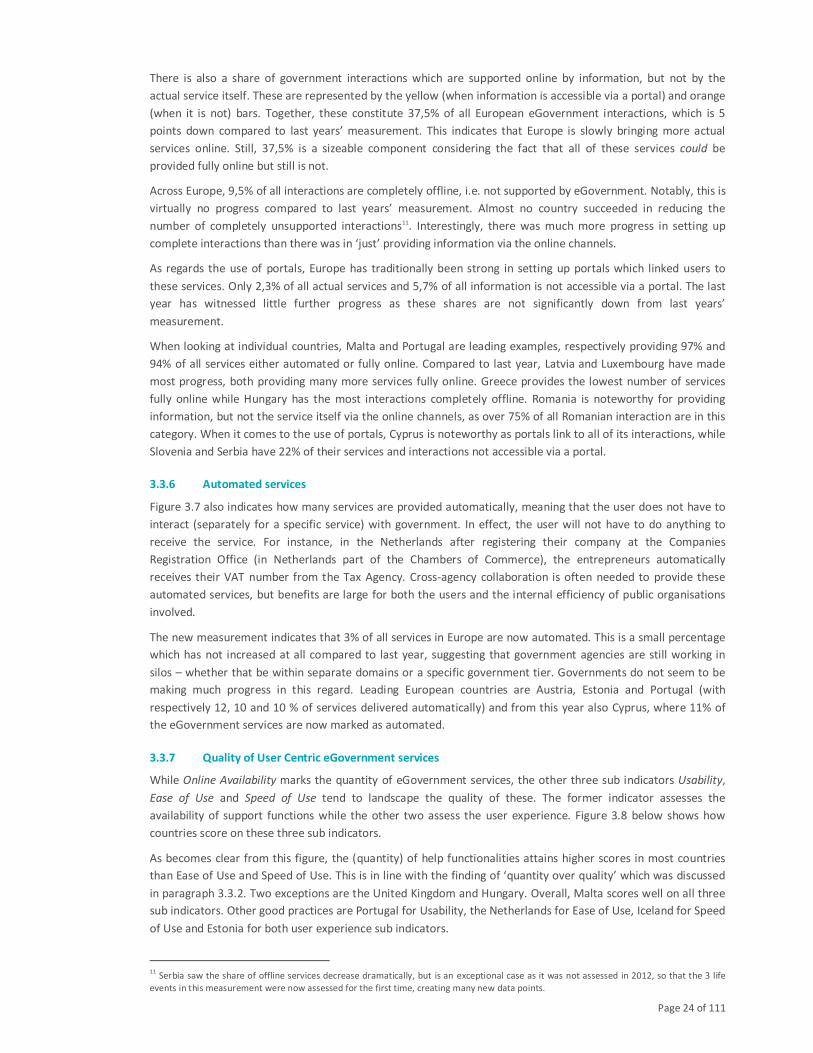
3.3.7 Quality of User Centric eGovernment services
While Online Availability marks the quantity of eGovernment services, the other three sub indicators Usability,
Ease of Use and Speed of Use tend to landscape the quality of these. The former indicator assesses the
availability of support functions while the other two assess the user experience. Figure 3.8 below shows how
countries score on these three sub indicators.
As becomes clear from this figure, the (quantity) of help functionalities attains higher scores in most countries
than Ease of Use and Speed of Use. This is in line with the finding of ‘quantity over quality’ which was discussed
in paragraph 3.3.2. Two exceptions are the United Kingdom and Hungary. Overall, Malta scores well on all three
sub indicators. Other good practices are Portugal for Usability, the Netherlands for Ease of Use, Iceland for Speed
of Use and Estonia for both user experience sub indicators.
11
Serbia saw the share of offline services decrease dramatically, but is an exceptional case as it was not assessed in 2012, so that the 3 life
events in this measurement were now assessed for the first time, creating many new data points.
Page 25 of 111
Figure 3.8: Usability, Ease of Use and Speed of Use average across Life Events by country (2013/2014, %)
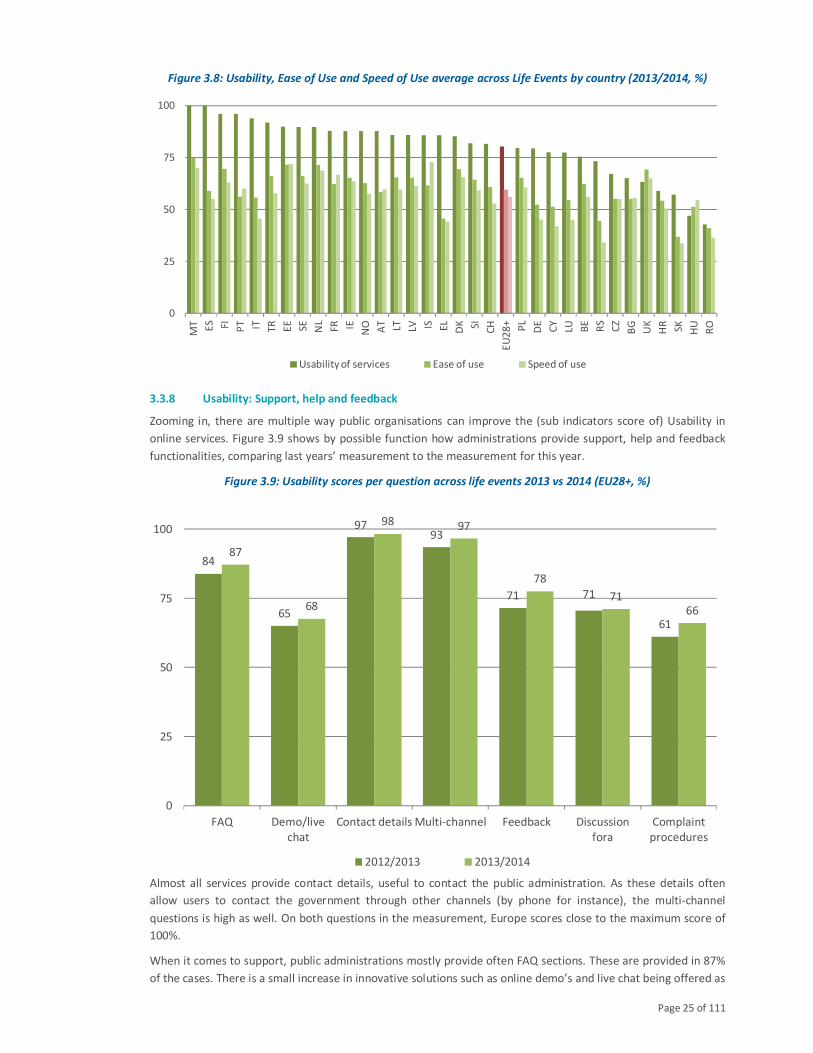
3.3.8 Usability: Support, help and feedback
Zooming in, there are multiple way public organisations can improve the (sub indicators score of) Usability in
online services. Figure 3.9 shows by possible function how administrations provide support, help and feedback
functionalities, comparing last years’ measurement to the measurement for this year.
Figure 3.9: Usability scores per question across life events 2013 vs 2014 (EU28+, %)
Almost all services provide contact details, useful to contact the public administration. As these details often
allow users to contact the government through other channels (by phone for instance), the multi-channel
questions is high as well. On both questions in the measurement, Europe scores close to the maximum score of
100%.
When it comes to support, public administrations mostly provide often FAQ sections. These are provided in 87%
of the cases. There is a small increase in innovative solutions such as online demo’s and live chat being offered as
0
25
50
75
100
MT ES FI PT IT TR
EE
SE NL
FR IE
NO AT LT LV IS EL
DK SI CH
EU
28
+
PL
DE
CY
LU BE
RS
CZ
BG
UK
HR
SK HU
RO
Usability of services Ease of use Speed of use
84
65
9793
71 71
61
87
68
98 97
78
7166
0
25
50
75
100
FAQ Demo/live
chat
Contact details Multi-channel Feedback Discussion
fora
Complaint
procedures
2012/2013 2013/2014
Page 26 of 111
well, up 3 points to 68% of all interactions. Governments have traditionally provided basic possibilities for
feedback, to a point where users can now find feedback procedures in 78% of the cases under review in the
2013/2014 set of data. This is the biggest increase of all questions, up 7 points compared to the 2012/2013 set,
indicating that feedback mechanisms are being considered as more important. Many governments tend to
provide forums as well. However, formal complaint procedures are less often available. The availability of
complaint procedures has increased but still only stands at 66%.
3.4 Transparency to build trust and increase accountability
Transparency is an important concept for European governments. It is a key element within the policy priority
area of user empowerment. When applying transparency to the online channels, it can come in many forms.
Transparency about the interactions, the use of personal data helps and the public organisation as a whole can
help build the trust of citizens. At the same time, these forms of transparency will drive a sense of accountability
as regards to policy makers. Trust and accountability are vital for any government that wants to increasingly use
technology to improve remote public service provision and its own internal organisation.
3.4.1 Overview of the Benchmark
In this benchmark we have looked at three elements, which are sub indicators for the top level benchmark of
Transparency:
Transparency of Service Delivery: specifically assesses the extent to which public administrations inform citizens
about the administrative process they have entered, i.e. from the citizens’ request for a service until the service
provision. Being transparent about how the service will be delivered means that citizens and entrepreneurs can
set expectations on time, process and delivery. It allows them to plan for their iterations with government when
convenient – instead of being highly dependent on an administration’s whims.
Transparency of Public Organisations: means that Governments publish information about themselves (e.g.
finance, organisational structure and responsibilities), and what they do (the decision-making processes,
regulations, laws). It should enable citizens to anticipate and respond to Government decisions that affect them
and hold policy makers responsible for their decisions and performance. It increases policy makers’
accountability and fiscal responsibility, and decreases the risk of fraud and corruption – still a hot topic on the
European agenda.
Transparency of Personal Data: implies that Governments proactively inform citizens about their personal data
and how, when and by whom it is being processed. Citizens want easy, electronic access to their personal data. It
increases the legitimacy and security of data processing and it improves the quality and accuracy of the personal
data stored. This in turn increases citizens’ trust in Government. Transparency of personal data is largely driven
by legislation. Most national Governments have legislation on how to deal with personal data in place and there
has been an EU Directive since 1995 (the European Data Protection Directive95/46/EC37).
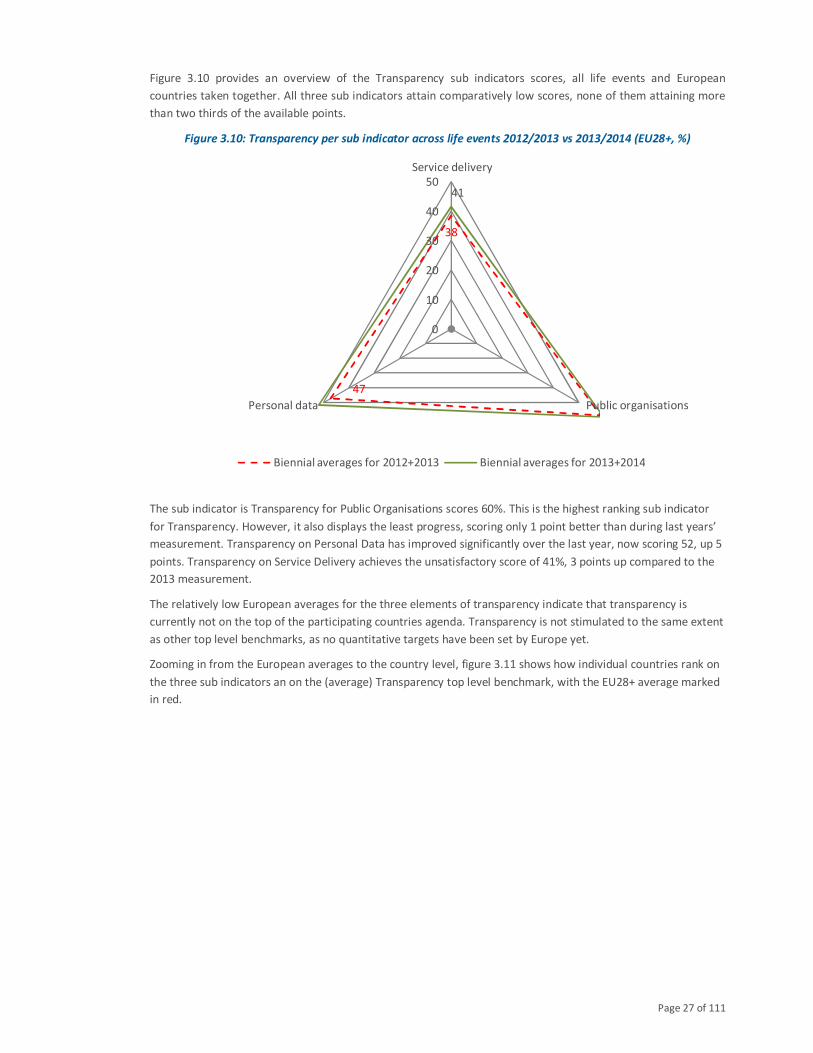
Page 27 of 111
Figure 3.10 provides an overview of the Transparency sub indicators scores, all life events and European
countries taken together. All three sub indicators attain comparatively low scores, none of them attaining more
than two thirds of the available points.
Figure 3.10: Transparency per sub indicator across life events 2012/2013 vs 2013/2014 (EU28+, %)
The sub indicator is Transparency for Public Organisations scores 60%. This is the highest ranking sub indicator
for Transparency. However, it also displays the least progress, scoring only 1 point better than during last years’
measurement. Transparency on Personal Data has improved significantly over the last year, now scoring 52, up 5
points. Transparency on Service Delivery achieves the unsatisfactory score of 41%, 3 points up compared to the
2013 measurement.
The relatively low European averages for the three elements of transparency indicate that transparency is
currently not on the top of the participating countries agenda. Transparency is not stimulated to the same extent
as other top level benchmarks, as no quantitative targets have been set by Europe yet.
Zooming in from the European averages to the country level, figure 3.11 shows how individual countries rank on
the three sub indicators an on the (average) Transparency top level benchmark, with the EU28+ average marked
in red.
38
47
41
0
10
20
30
40
50
Service delivery
Public organisationsPersonal data
Biennial averages for 2012+2013 Biennial averages for 2013+2014
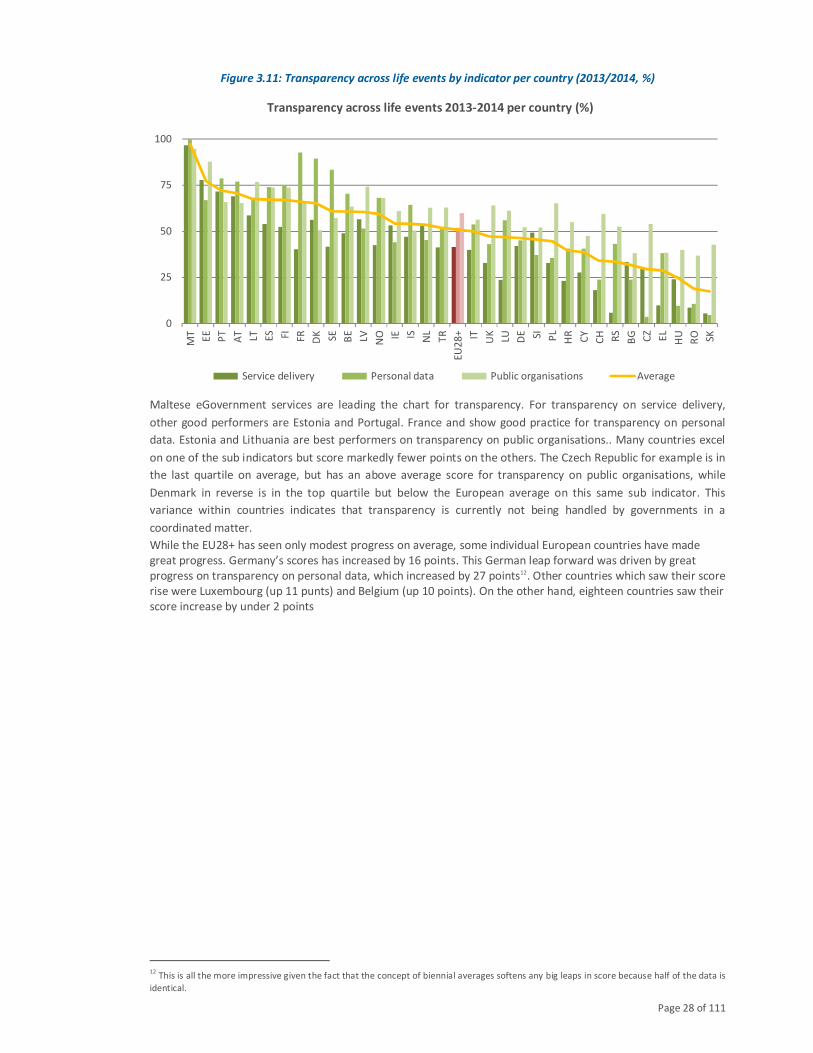
Page 28 of 111
Figure 3.11: Transparency across life events by indicator per country (2013/2014, %)
Maltese eGovernment services are leading the chart for transparency. For transparency on service delivery,
other good performers are Estonia and Portugal. France and show good practice for transparency on personal
data. Estonia and Lithuania are best performers on transparency on public organisations.. Many countries excel
on one of the sub indicators but score markedly fewer points on the others. The Czech Republic for example is in
the last quartile on average, but has an above average score for transparency on public organisations, while
Denmark in reverse is in the top quartile but below the European average on this same sub indicator. This
variance within countries indicates that transparency is currently not being handled by governments in a
coordinated matter.
While the EU28+ has seen only modest progress on average, some individual European countries have made
great progress. Germany’s scores has increased by 16 points. This German leap forward was driven by great
progress on transparency on personal data, which increased by 27 points12. Other countries which saw their score
rise were Luxembourg (up 11 punts) and Belgium (up 10 points). On the other hand, eighteen countries saw their
score increase by under 2 points
12
This is all the more impressive given the fact that the concept of biennial averages softens any big leaps in score because half of the data is
identical.
0
25
50
75
100
MT
EE
PT
AT LT ES FI FR DK SE BE
LV NO IE IS NL
TR
EU
28
+ IT UK
LU DE SI PL
HR
CY
CH RS
BG CZ
EL
HU
RO SK
Transparency across life events 2013-2014 per country (%)
Service delivery Personal data Public organisations Average
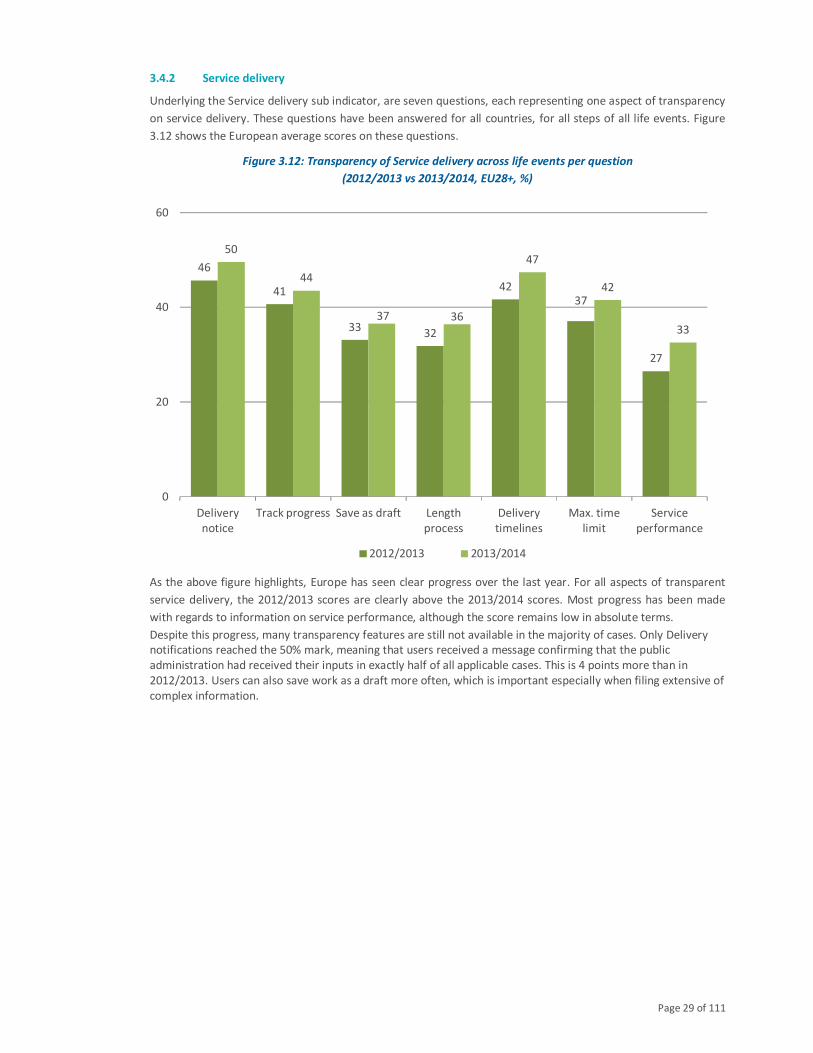
Page 29 of 111
3.4.2 Service delivery
Underlying the Service delivery sub indicator, are seven questions, each representing one aspect of transparency
on service delivery. These questions have been answered for all countries, for all steps of all life events. Figure
3.12 shows the European average scores on these questions.
Figure 3.12: Transparency of Service delivery across life events per question
(2012/2013 vs 2013/2014, EU28+, %)
As the above figure highlights, Europe has seen clear progress over the last year. For all aspects of transparent
service delivery, the 2012/2013 scores are clearly above the 2013/2014 scores. Most progress has been made
with regards to information on service performance, although the score remains low in absolute terms.
Despite this progress, many transparency features are still not available in the majority of cases. Only Delivery
notifications reached the 50% mark, meaning that users received a message confirming that the public
administration had received their inputs in exactly half of all applicable cases. This is 4 points more than in
2012/2013. Users can also save work as a draft more often, which is important especially when filing extensive of
complex information.
46
41
3332
4237
27
50
44
37 36
47
42
33
0
20
40
60
Delivery
notice
Track progress Save as draft Length
process
Delivery
timelines
Max. time
limit
Service
performance
2012/2013 2013/2014
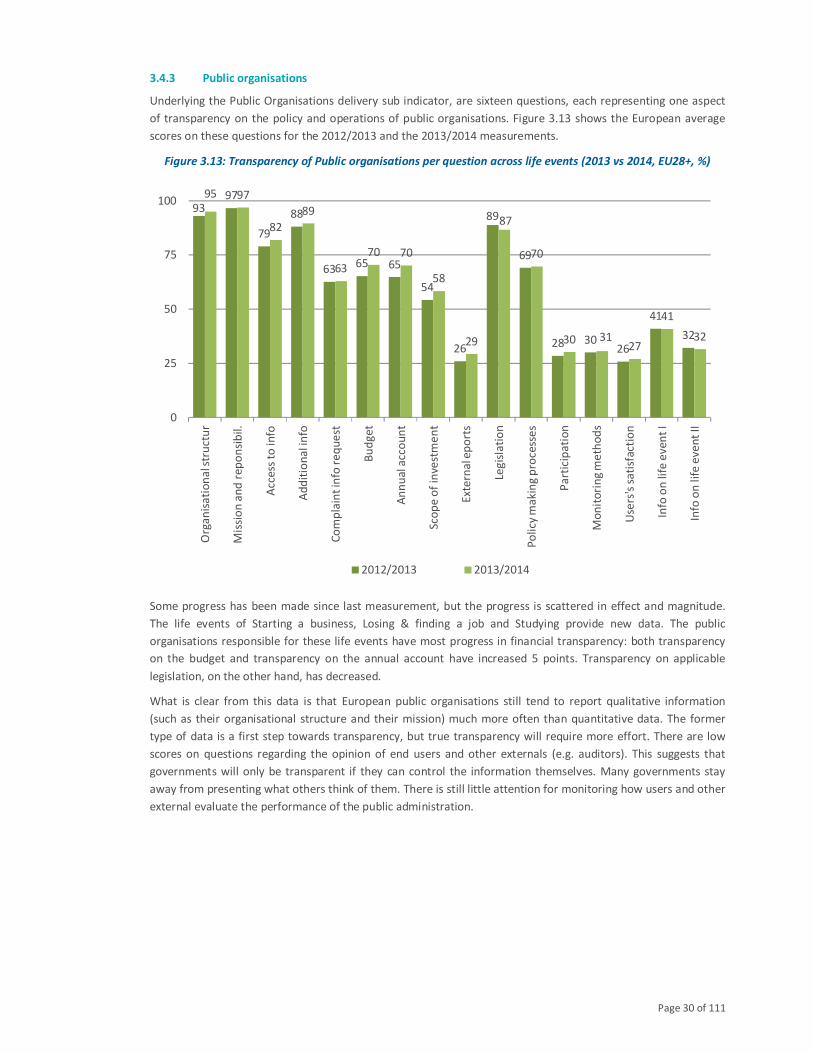
Page 30 of 111
3.4.3 Public organisations
Underlying the Public Organisations delivery sub indicator, are sixteen questions, each representing one aspect
of transparency on the policy and operations of public organisations. Figure 3.13 shows the European average
scores on these questions for the 2012/2013 and the 2013/2014 measurements.
Figure 3.13: Transparency of Public organisations per question across life events (2013 vs 2014, EU28+, %)
Some progress has been made since last measurement, but the progress is scattered in effect and magnitude.
The life events of Starting a business, Losing & finding a job and Studying provide new data. The public
organisations responsible for these life events have most progress in financial transparency: both transparency
on the budget and transparency on the annual account have increased 5 points. Transparency on applicable
legislation, on the other hand, has decreased.
What is clear from this data is that European public organisations still tend to report qualitative information
(such as their organisational structure and their mission) much more often than quantitative data. The former
type of data is a first step towards transparency, but true transparency will require more effort. There are low
scores on questions regarding the opinion of end users and other externals (e.g. auditors). This suggests that
governments will only be transparent if they can control the information themselves. Many governments stay
away from presenting what others think of them. There is still little attention for monitoring how users and other
external evaluate the performance of the public administration.
9397
79
88
6365 65
54
26
89
69
28 3026
41
32
95 97
82
89
63
70 70
58
29
87
70
30 3127
41
32
0
25
50
75
100O
rga
nis
ati
on
al s
tru
ctu
r
Mis
sio
n a
nd
re
po
nsi
bil
.
Acc
ess
to
in
fo
Ad
dit
ion
al i
nfo
Co
mp
lain
t in
fo r
eq
ue
st
Bu
dg
et
An
nu
al a
cco
un
t
Sco
pe
of
inve
stm
en
t
Ext
ern
al e
po
rts
Leg
isla
tio
n
Po
licy
ma
kin
g p
roce
sse
s
Pa
rtic
ipa
tio
n
Mo
nit
ori
ng
me
tho
ds
Use
rs's
sa
tisf
act
ion
Info
on
lif
e e
ve
nt
I
Info
on
lif
e e
ve
nt
II
2012/2013 2013/2014
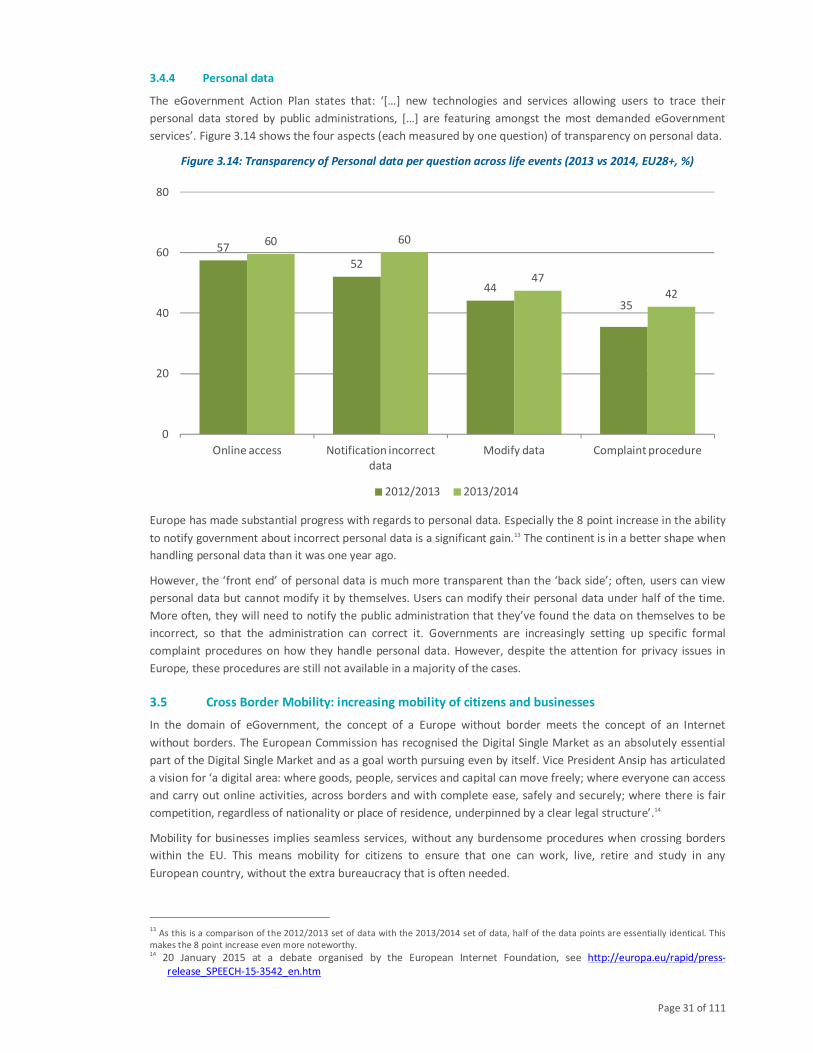
Page 31 of 111
3.4.4 Personal data
The eGovernment Action Plan states that: ‘[…] new technologies and services allowing users to trace their
personal data stored by public administrations, […] are featuring amongst the most demanded eGovernment
services’. Figure 3.14 shows the four aspects (each measured by one question) of transparency on personal data.
Figure 3.14: Transparency of Personal data per question across life events (2013 vs 2014, EU28+, %)
Europe has made substantial progress with regards to personal data. Especially the 8 point increase in the ability
to notify government about incorrect personal data is a significant gain.13 The continent is in a better shape when
handling personal data than it was one year ago.
However, the ‘front end’ of personal data is much more transparent than the ‘back side’; often, users can view
personal data but cannot modify it by themselves. Users can modify their personal data under half of the time.
More often, they will need to notify the public administration that they’ve found the data on themselves to be
incorrect, so that the administration can correct it. Governments are increasingly setting up specific formal
complaint procedures on how they handle personal data. However, despite the attention for privacy issues in
Europe, these procedures are still not available in a majority of the cases.
3.5 Cross Border Mobility: increasing mobility of citizens and businesses
In the domain of eGovernment, the concept of a Europe without border meets the concept of an Internet
without borders. The European Commission has recognised the Digital Single Market as an absolutely essential
part of the Digital Single Market and as a goal worth pursuing even by itself. Vice President Ansip has articulated
a vision for ‘a digital area: where goods, people, services and capital can move freely; where everyone can access
and carry out online activities, across borders and with complete ease, safely and securely; where there is fair
competition, regardless of nationality or place of residence, underpinned by a clear legal structure’.14
Mobility for businesses implies seamless services, without any burdensome procedures when crossing borders
within the EU. This means mobility for citizens to ensure that one can work, live, retire and study in any
European country, without the extra bureaucracy that is often needed.
13
As this is a comparison of the 2012/2013 set of data with the 2013/2014 set of data, half of the data points are essentially identical. This
makes the 8 point increase even more noteworthy. 14
20 January 2015 at a debate organised by the European Internet Foundation, see http://europa.eu/rapid/press-
release_SPEECH-15-3542_en.htm
57
52
44
35
60 60
47
42
0
20
40
60
80
Online access Notification incorrect
data
Modify data Complaint procedure
2012/2013 2013/2014
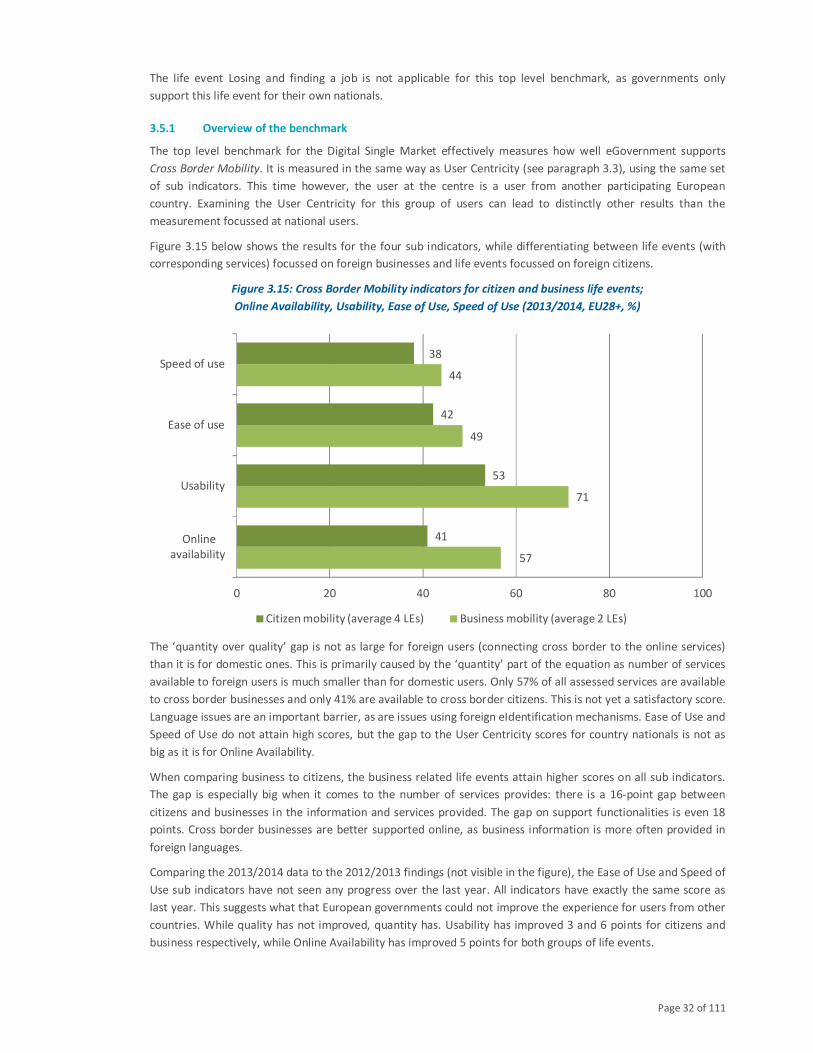
Page 32 of 111
The life event Losing and finding a job is not applicable for this top level benchmark, as governments only
support this life event for their own nationals.
3.5.1 Overview of the benchmark
The top level benchmark for the Digital Single Market effectively measures how well eGovernment supports
Cross Border Mobility. It is measured in the same way as User Centricity (see paragraph 3.3), using the same set
of sub indicators. This time however, the user at the centre is a user from another participating European
country. Examining the User Centricity for this group of users can lead to distinctly other results than the
measurement focussed at national users.
Figure 3.15 below shows the results for the four sub indicators, while differentiating between life events (with
corresponding services) focussed on foreign businesses and life events focussed on foreign citizens.
Figure 3.15: Cross Border Mobility indicators for citizen and business life events;
Online Availability, Usability, Ease of Use, Speed of Use (2013/2014, EU28+, %)
The ‘quantity over quality’ gap is not as large for foreign users (connecting cross border to the online services)
than it is for domestic ones. This is primarily caused by the ‘quantity’ part of the equation as number of services
available to foreign users is much smaller than for domestic users. Only 57% of all assessed services are available
to cross border businesses and only 41% are available to cross border citizens. This is not yet a satisfactory score.
Language issues are an important barrier, as are issues using foreign eIdentification mechanisms. Ease of Use and
Speed of Use do not attain high scores, but the gap to the User Centricity scores for country nationals is not as
big as it is for Online Availability.
When comparing business to citizens, the business related life events attain higher scores on all sub indicators.
The gap is especially big when it comes to the number of services provides: there is a 16-point gap between
citizens and businesses in the information and services provided. The gap on support functionalities is even 18
points. Cross border businesses are better supported online, as business information is more often provided in
foreign languages.
Comparing the 2013/2014 data to the 2012/2013 findings (not visible in the figure), the Ease of Use and Speed of
Use sub indicators have not seen any progress over the last year. All indicators have exactly the same score as
last year. This suggests what that European governments could not improve the experience for users from other
countries. While quality has not improved, quantity has. Usability has improved 3 and 6 points for citizens and
business respectively, while Online Availability has improved 5 points for both groups of life events.
57
71
49
44
41
53
42
38
0 20 40 60 80 100
Online
availability
Usability
Ease of use
Speed of use
Citizen mobility (average 4 LEs) Business mobility (average 2 LEs)
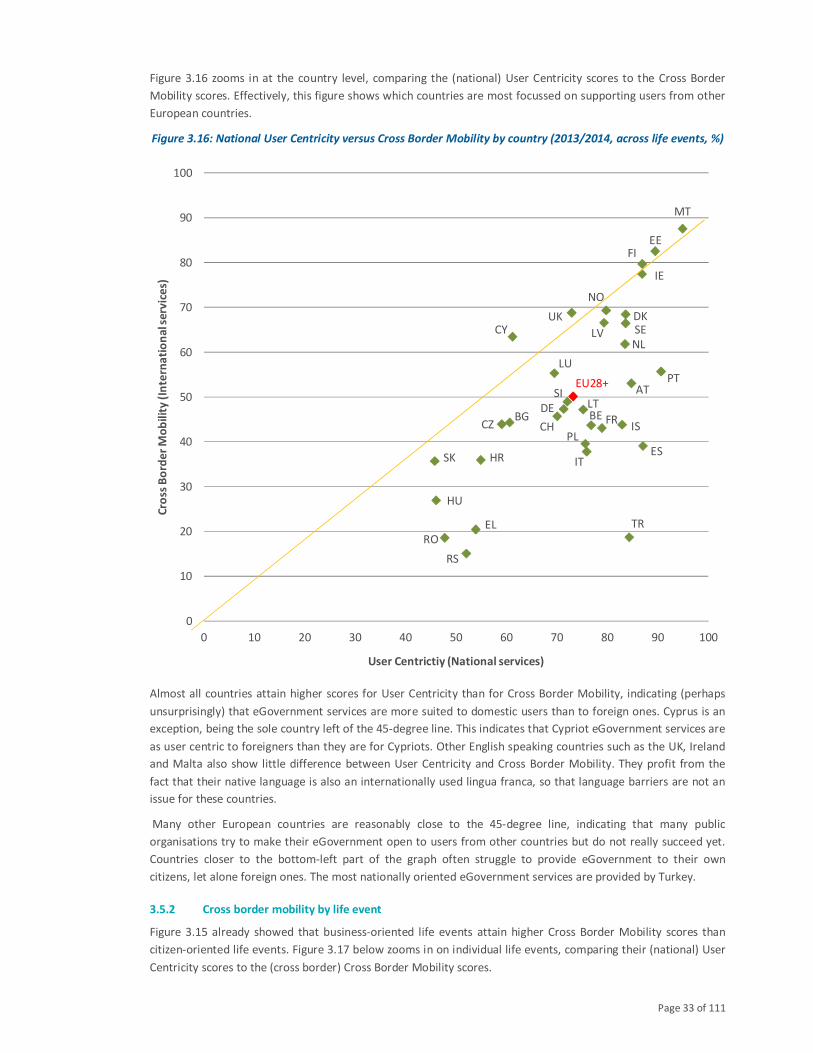
Page 33 of 111
Figure 3.16 zooms in at the country level, comparing the (national) User Centricity scores to the Cross Border
Mobility scores. Effectively, this figure shows which countries are most focussed on supporting users from other
European countries.
Figure 3.16: National User Centricity versus Cross Border Mobility by country (2013/2014, across life events, %)
Almost all countries attain higher scores for User Centricity than for Cross Border Mobility, indicating (perhaps
unsurprisingly) that eGovernment services are more suited to domestic users than to foreign ones. Cyprus is an
exception, being the sole country left of the 45-degree line. This indicates that Cypriot eGovernment services are
as user centric to foreigners than they are for Cypriots. Other English speaking countries such as the UK, Ireland
and Malta also show little difference between User Centricity and Cross Border Mobility. They profit from the
fact that their native language is also an internationally used lingua franca, so that language barriers are not an
issue for these countries.
Many other European countries are reasonably close to the 45-degree line, indicating that many public
organisations try to make their eGovernment open to users from other countries but do not really succeed yet.
Countries closer to the bottom-left part of the graph often struggle to provide eGovernment to their own
citizens, let alone foreign ones. The most nationally oriented eGovernment services are provided by Turkey.
3.5.2 Cross border mobility by life event
Figure 3.15 already showed that business-oriented life events attain higher Cross Border Mobility scores than
citizen-oriented life events. Figure 3.17 below zooms in on individual life events, comparing their (national) User
Centricity scores to the (cross border) Cross Border Mobility scores.
AT
BEBGCH
CY
CZ
DE
DK
EE
EL
ES
FI
FR
HR
HU
IE
IS
IT
LT
LU
LV
MT
NL
NO
PL
PT
RO
RS
SE
SI
SK
TR
UK
EU28+
0
10
20
30
40
50
60
70
80
90
100
0 10 20 30 40 50 60 70 80 90 100
Cro
ss B
ord
er
Mo
bil
ity
(In
tern
ati
on
al s
erv
ice
s)
User Centrictiy (National services)
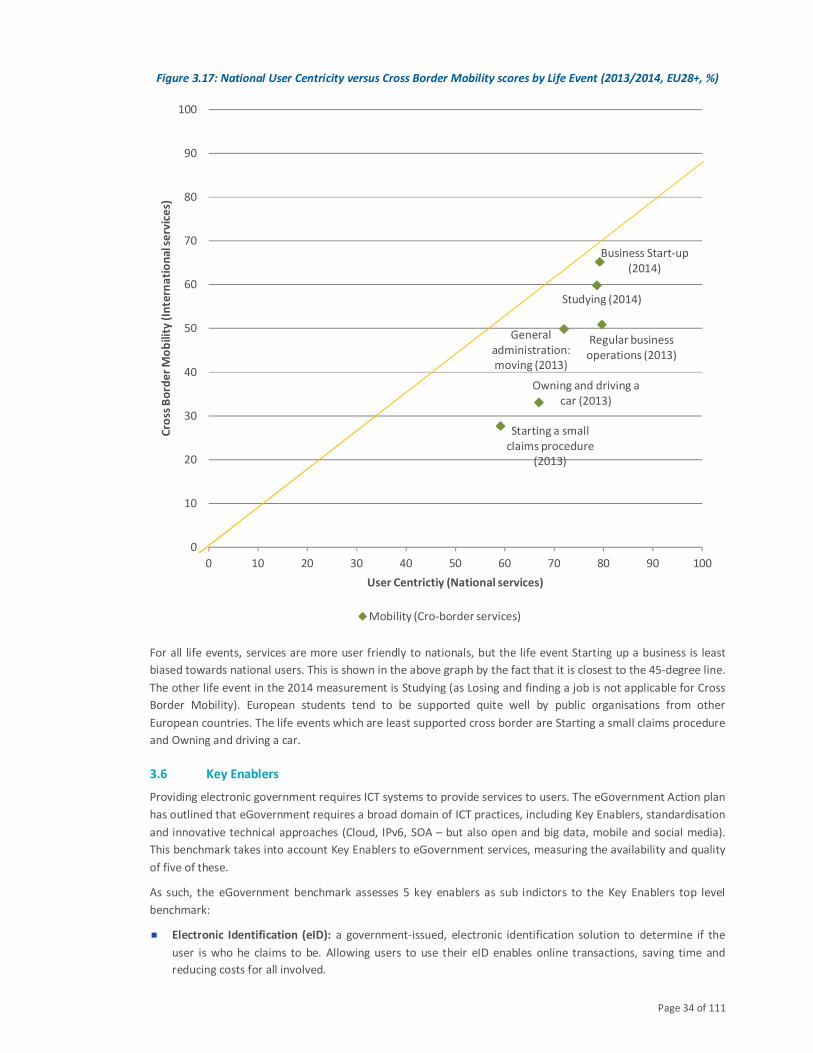
Page 34 of 111
Figure 3.17: National User Centricity versus Cross Border Mobility scores by Life Event (2013/2014, EU28+, %)
For all life events, services are more user friendly to nationals, but the life event Starting up a business is least
biased towards national users. This is shown in the above graph by the fact that it is closest to the 45-degree line.
The other life event in the 2014 measurement is Studying (as Losing and finding a job is not applicable for Cross
Border Mobility). European students tend to be supported quite well by public organisations from other
European countries. The life events which are least supported cross border are Starting a small claims procedure
and Owning and driving a car.
3.6 Key Enablers
Providing electronic government requires ICT systems to provide services to users. The eGovernment Action plan
has outlined that eGovernment requires a broad domain of ICT practices, including Key Enablers, standardisation
and innovative technical approaches (Cloud, IPv6, SOA – but also open and big data, mobile and social media).
This benchmark takes into account Key Enablers to eGovernment services, measuring the availability and quality
of five of these.
As such, the eGovernment benchmark assesses 5 key enablers as sub indictors to the Key Enablers top level
benchmark:
� Electronic Identification (eID): a government-issued, electronic identification solution to determine if the
user is who he claims to be. Allowing users to use their eID enables online transactions, saving time and
reducing costs for all involved.
Regular business
operations (2013)
General
administration:
moving (2013)
Owning and driving a
car (2013)
Starting a small
claims procedure
(2013)
Business Start-up
(2014)
Studying (2014)
0
10
20
30
40
50
60
70
80
90
100
0 10 20 30 40 50 60 70 80 90 100
Cro
ss B
ord
er
Mo
bil
ity
(In
tern
ati
on
al s
erv
ice
s)
User Centrictiy (National services)
Mobility (Cro-border services)
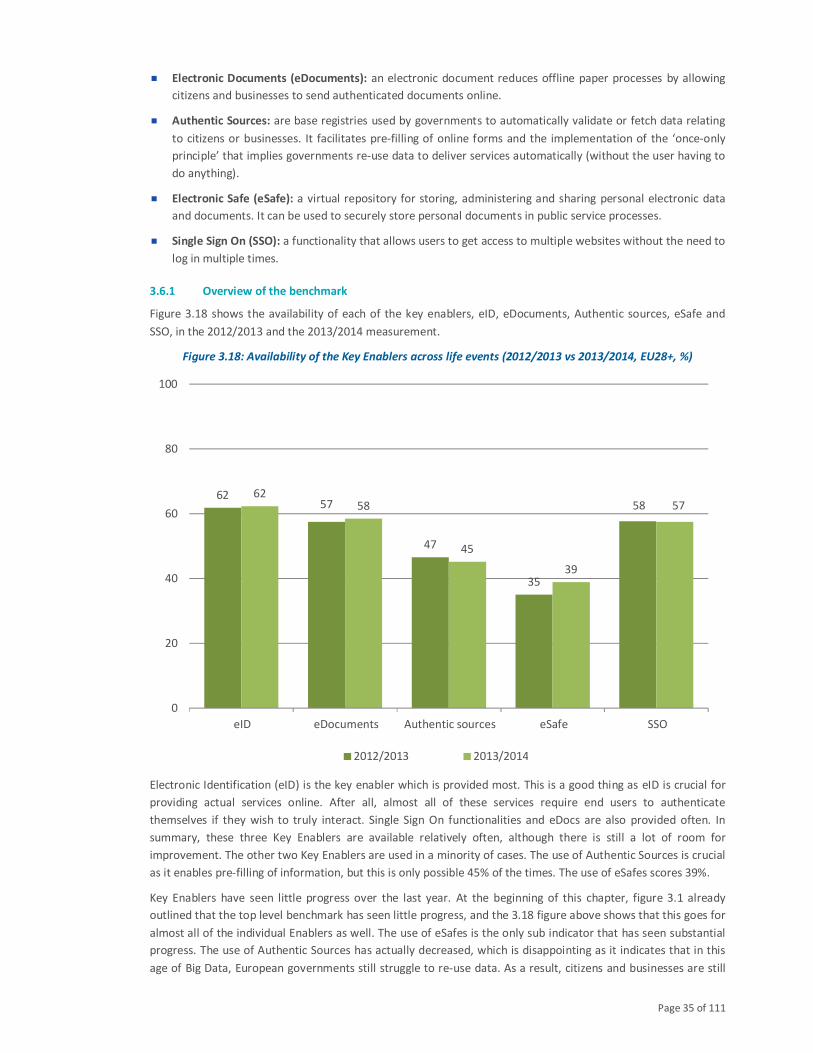
Page 35 of 111
� Electronic Documents (eDocuments): an electronic document reduces offline paper processes by allowing
citizens and businesses to send authenticated documents online.
� Authentic Sources: are base registries used by governments to automatically validate or fetch data relating
to citizens or businesses. It facilitates pre-filling of online forms and the implementation of the ‘once-only
principle’ that implies governments re-use data to deliver services automatically (without the user having to
do anything).
� Electronic Safe (eSafe): a virtual repository for storing, administering and sharing personal electronic data
and documents. It can be used to securely store personal documents in public service processes.
� Single Sign On (SSO): a functionality that allows users to get access to multiple websites without the need to
log in multiple times.
3.6.1 Overview of the benchmark
Figure 3.18 shows the availability of each of the key enablers, eID, eDocuments, Authentic sources, eSafe and
SSO, in the 2012/2013 and the 2013/2014 measurement.
Figure 3.18: Availability of the Key Enablers across life events (2012/2013 vs 2013/2014, EU28+, %)
Electronic Identification (eID) is the key enabler which is provided most. This is a good thing as eID is crucial for
providing actual services online. After all, almost all of these services require end users to authenticate
themselves if they wish to truly interact. Single Sign On functionalities and eDocs are also provided often. In
summary, these three Key Enablers are available relatively often, although there is still a lot of room for
improvement. The other two Key Enablers are used in a minority of cases. The use of Authentic Sources is crucial
as it enables pre-filling of information, but this is only possible 45% of the times. The use of eSafes scores 39%.
Key Enablers have seen little progress over the last year. At the beginning of this chapter, figure 3.1 already
outlined that the top level benchmark has seen little progress, and the 3.18 figure above shows that this goes for
almost all of the individual Enablers as well. The use of eSafes is the only sub indicator that has seen substantial
progress. The use of Authentic Sources has actually decreased, which is disappointing as it indicates that in this
age of Big Data, European governments still struggle to re-use data. As a result, citizens and businesses are still
6257
47
35
5862
58
45
39
57
0
20
40
60
80
100
eID eDocuments Authentic sources eSafe SSO
2012/2013 2013/2014
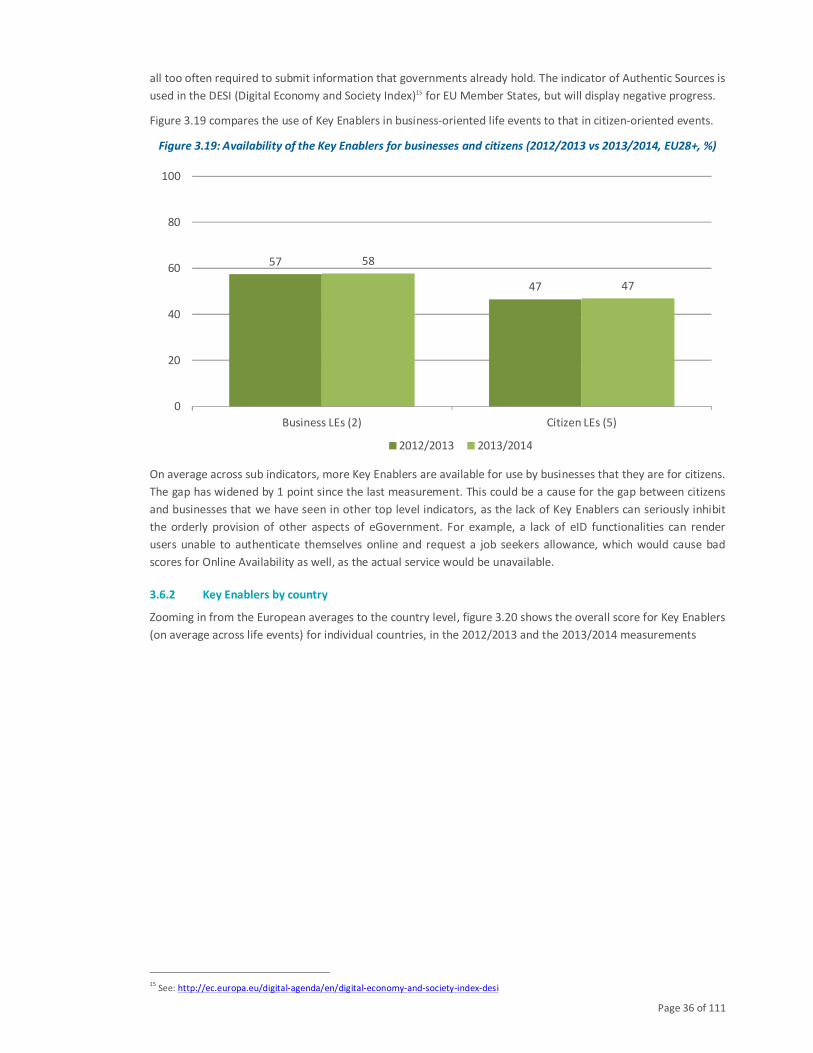
Page 36 of 111
all too often required to submit information that governments already hold. The indicator of Authentic Sources is
used in the DESI (Digital Economy and Society Index)15 for EU Member States, but will display negative progress.
Figure 3.19 compares the use of Key Enablers in business-oriented life events to that in citizen-oriented events.
Figure 3.19: Availability of the Key Enablers for businesses and citizens (2012/2013 vs 2013/2014, EU28+, %)
On average across sub indicators, more Key Enablers are available for use by businesses that they are for citizens.
The gap has widened by 1 point since the last measurement. This could be a cause for the gap between citizens
and businesses that we have seen in other top level indicators, as the lack of Key Enablers can seriously inhibit
the orderly provision of other aspects of eGovernment. For example, a lack of eID functionalities can render
users unable to authenticate themselves online and request a job seekers allowance, which would cause bad
scores for Online Availability as well, as the actual service would be unavailable.
3.6.2 Key Enablers by country
Zooming in from the European averages to the country level, figure 3.20 shows the overall score for Key Enablers
(on average across life events) for individual countries, in the 2012/2013 and the 2013/2014 measurements
15
See: http://ec.europa.eu/digital-agenda/en/digital-economy-and-society-index-desi
57
47
58
47
0
20
40
60
80
100
Business LEs (2) Citizen LEs (5)
2012/2013 2013/2014
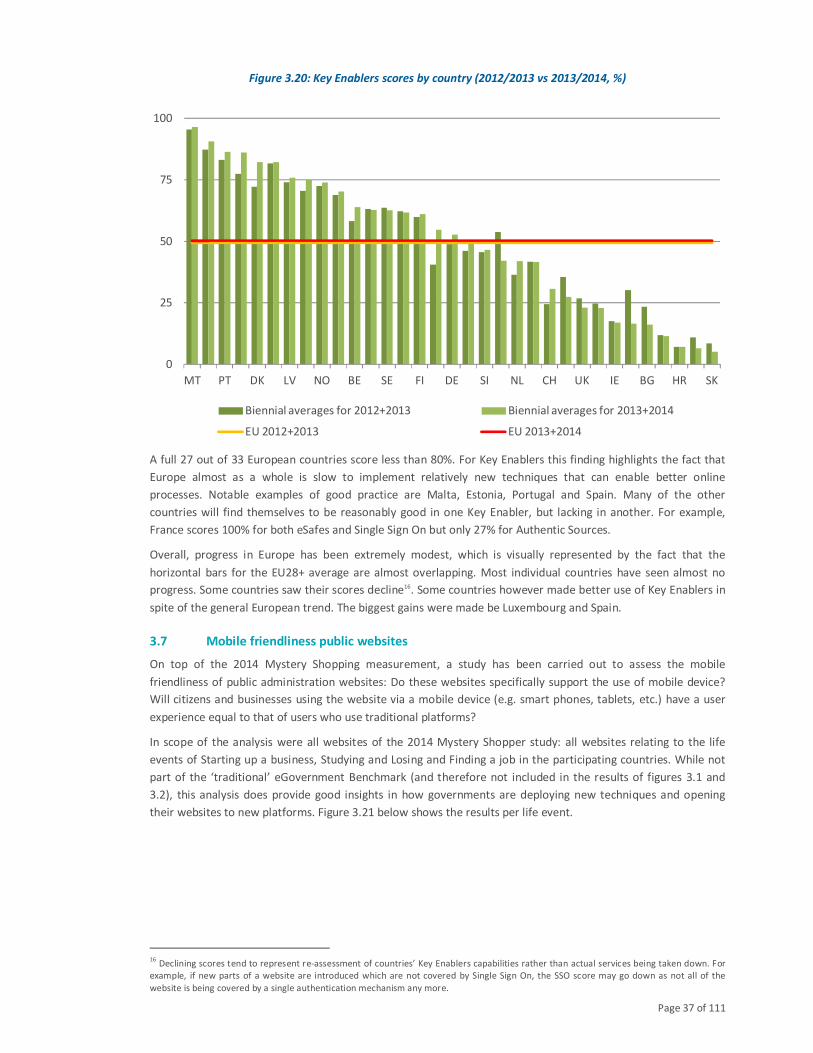
Page 37 of 111
Figure 3.20: Key Enablers scores by country (2012/2013 vs 2013/2014, %)
A full 27 out of 33 European countries score less than 80%. For Key Enablers this finding highlights the fact that
Europe almost as a whole is slow to implement relatively new techniques that can enable better online
processes. Notable examples of good practice are Malta, Estonia, Portugal and Spain. Many of the other
countries will find themselves to be reasonably good in one Key Enabler, but lacking in another. For example,
France scores 100% for both eSafes and Single Sign On but only 27% for Authentic Sources.
Overall, progress in Europe has been extremely modest, which is visually represented by the fact that the
horizontal bars for the EU28+ average are almost overlapping. Most individual countries have seen almost no
progress. Some countries saw their scores decline16. Some countries however made better use of Key Enablers in
spite of the general European trend. The biggest gains were made be Luxembourg and Spain.
3.7 Mobile friendliness public websites
On top of the 2014 Mystery Shopping measurement, a study has been carried out to assess the mobile
friendliness of public administration websites: Do these websites specifically support the use of mobile device?
Will citizens and businesses using the website via a mobile device (e.g. smart phones, tablets, etc.) have a user
experience equal to that of users who use traditional platforms?
In scope of the analysis were all websites of the 2014 Mystery Shopper study: all websites relating to the life
events of Starting up a business, Studying and Losing and Finding a job in the participating countries. While not
part of the ‘traditional’ eGovernment Benchmark (and therefore not included in the results of figures 3.1 and
3.2), this analysis does provide good insights in how governments are deploying new techniques and opening
their websites to new platforms. Figure 3.21 below shows the results per life event.
16
Declining scores tend to represent re-assessment of countries’ Key Enablers capabilities rather than actual services being taken down. For
example, if new parts of a website are introduced which are not covered by Single Sign On, the SSO score may go down as not all of the
website is being covered by a single authentication mechanism any more.
0
25
50
75
100
MT PT DK LV NO BE SE FI DE SI NL CH UK IE BG HR SK
Biennial averages for 2012+2013 Biennial averages for 2013+2014
EU 2012+2013 EU 2013+2014
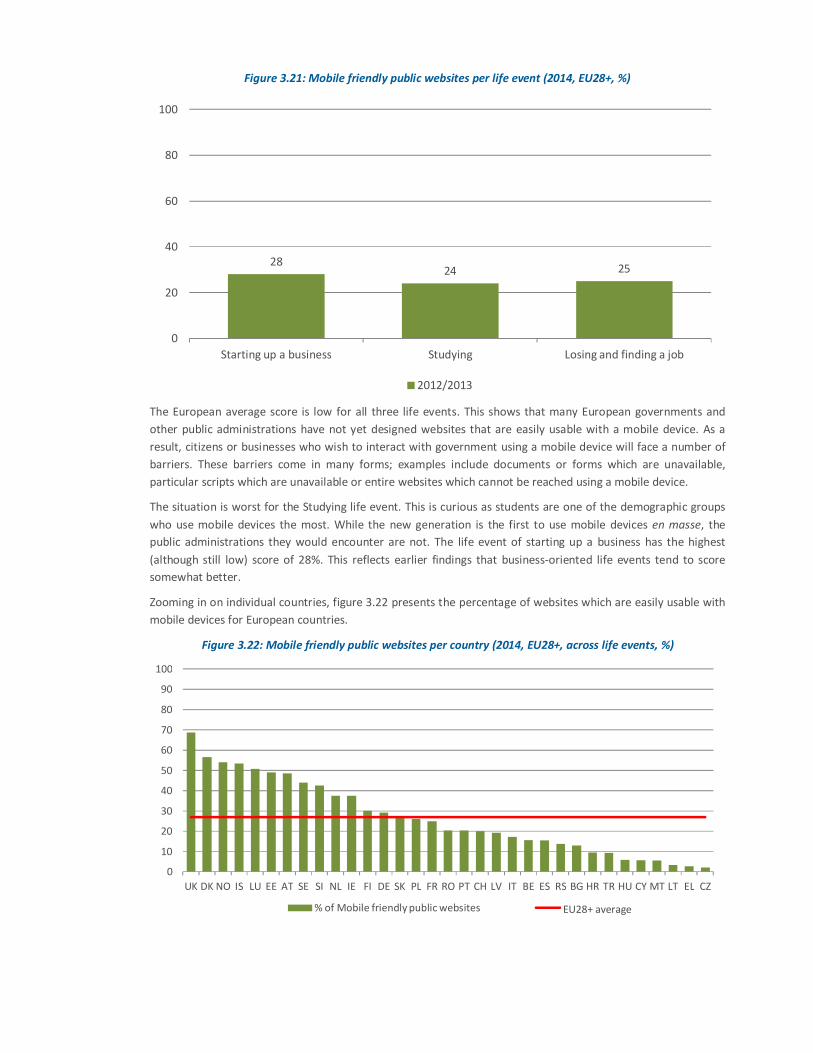
Figure 3.21: Mobile friendly public websites per life event (2014, EU28+, %)
The European average score is low for all three life events. This shows that many European governments and
other public administrations have not yet designed websites that are easily usable with a mobile device. As a
result, citizens or businesses who wish to interact with government using a mobile device will face a number of
barriers. These barriers come in many forms; examples include documents or forms which are unavailable,
particular scripts which are unavailable or entire websites which cannot be reached using a mobile device.
The situation is worst for the Studying life event. This is curious as students are one of the demographic groups
who use mobile devices the most. While the new generation is the first to use mobile devices en masse, the
public administrations they would encounter are not. The life event of starting up a business has the highest
(although still low) score of 28%. This reflects earlier findings that business-oriented life events tend to score
somewhat better.
Zooming in on individual countries, figure 3.22 presents the percentage of websites which are easily usable with
mobile devices for European countries.
Figure 3.22: Mobile friendly public websites per country (2014, EU28+, across life events, %)
2824 25
0
20
40
60
80
100
Starting up a business Studying Losing and finding a job
2012/2013
0
10
20
30
40
50
60
70
80
90
100
UK DK NO IS LU EE AT SE SI NL IE FI DE SK PL FR RO PT CH LV IT BE ES RS BG HR TR HU CY MT LT EL CZ
% of Mobile friendly public websites EU averageEU28+ average
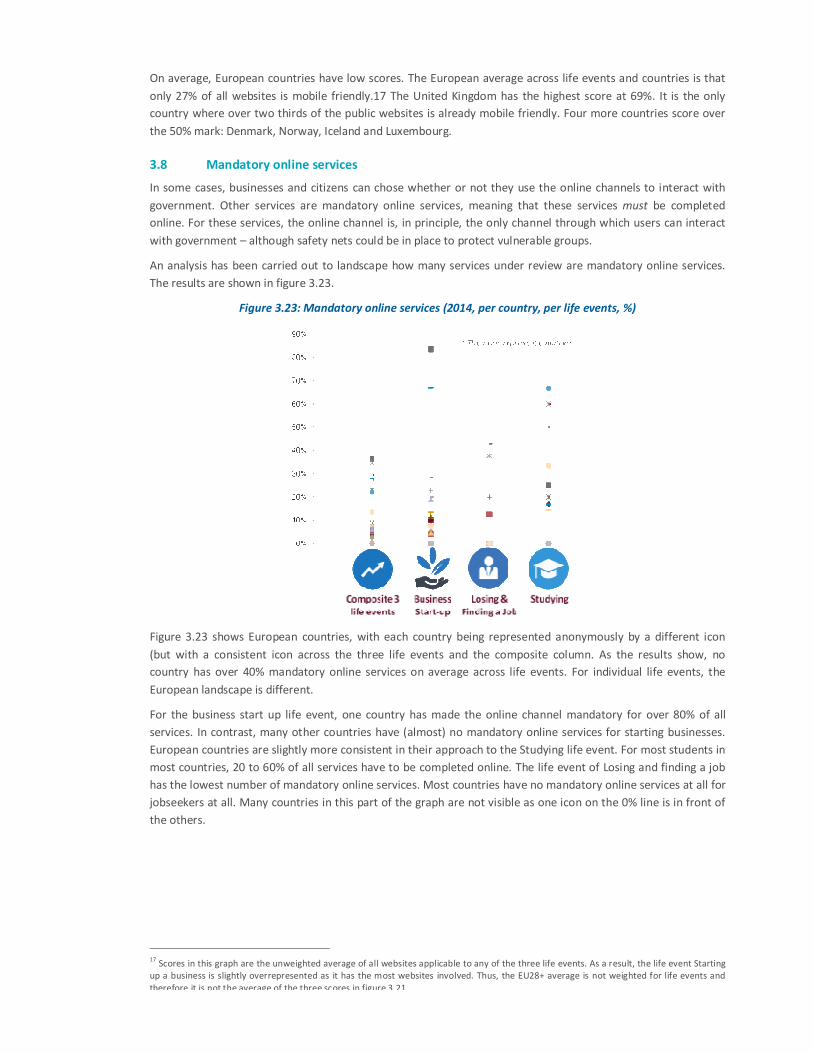
On average, European countries have low scores. The European average across life events and countries is that
only 27% of all websites is mobile friendly.17 The United Kingdom has the highest score at 69%. It is the only
country where over two thirds of the public websites is already mobile friendly. Four more countries score over
the 50% mark: Denmark, Norway, Iceland and Luxembourg.
3.8 Mandatory online services
In some cases, businesses and citizens can chose whether or not they use the online channels to interact with
government. Other services are mandatory online services, meaning that these services must be completed
online. For these services, the online channel is, in principle, the only channel through which users can interact
with government – although safety nets could be in place to protect vulnerable groups.
An analysis has been carried out to landscape how many services under review are mandatory online services.
The results are shown in figure 3.23.
Figure 3.23: Mandatory online services (2014, per country, per life events, %)
Figure 3.23 shows European countries, with each country being represented anonymously by a different icon
(but with a consistent icon across the three life events and the composite column. As the results show, no
country has over 40% mandatory online services on average across life events. For individual life events, the
European landscape is different.
For the business start up life event, one country has made the online channel mandatory for over 80% of all
services. In contrast, many other countries have (almost) no mandatory online services for starting businesses.
European countries are slightly more consistent in their approach to the Studying life event. For most students in
most countries, 20 to 60% of all services have to be completed online. The life event of Losing and finding a job
has the lowest number of mandatory online services. Most countries have no mandatory online services at all for
jobseekers at all. Many countries in this part of the graph are not visible as one icon on the 0% line is in front of
the others.
17
Scores in this graph are the unweighted average of all websites applicable to any of the three life events. As a result, the life event Starting
up a business is slightly overrepresented as it has the most websites involved. Thus, the EU28+ average is not weighted for life events and
therefore it is not the average of the three scores in figure 3.21.
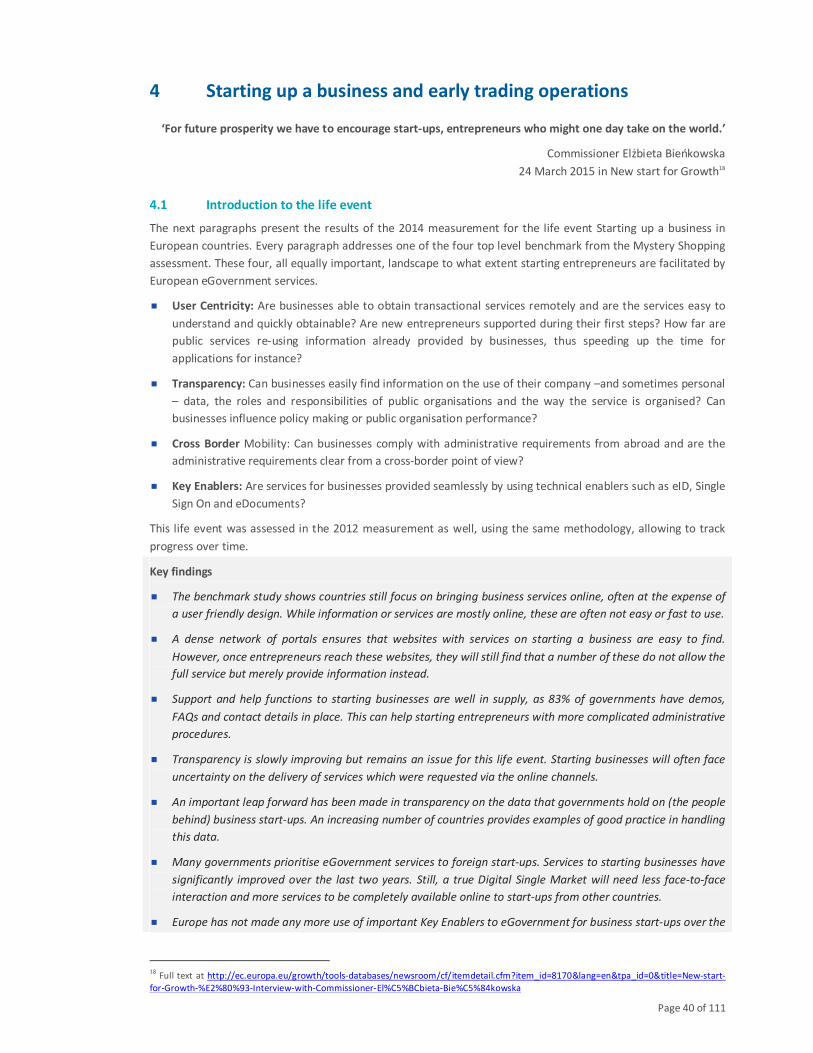
Page 40 of 111
4 Starting up a business and early trading operations
‘For future prosperity we have to encourage start-ups, entrepreneurs who might one day take on the world.’
Commissioner Elżbieta Bieńkowska
24 March 2015 in New start for Growth18
4.1 Introduction to the life event
The next paragraphs present the results of the 2014 measurement for the life event Starting up a business in
European countries. Every paragraph addresses one of the four top level benchmark from the Mystery Shopping
assessment. These four, all equally important, landscape to what extent starting entrepreneurs are facilitated by
European eGovernment services.
� User Centricity: Are businesses able to obtain transactional services remotely and are the services easy to
understand and quickly obtainable? Are new entrepreneurs supported during their first steps? How far are
public services re-using information already provided by businesses, thus speeding up the time for
applications for instance?
� Transparency: Can businesses easily find information on the use of their company –and sometimes personal
– data, the roles and responsibilities of public organisations and the way the service is organised? Can
businesses influence policy making or public organisation performance?
� Cross Border Mobility: Can businesses comply with administrative requirements from abroad and are the
administrative requirements clear from a cross-border point of view?
� Key Enablers: Are services for businesses provided seamlessly by using technical enablers such as eID, Single
Sign On and eDocuments?
This life event was assessed in the 2012 measurement as well, using the same methodology, allowing to track
progress over time.
Key findings
� The benchmark study shows countries still focus on bringing business services online, often at the expense of
a user friendly design. While information or services are mostly online, these are often not easy or fast to use.
� A dense network of portals ensures that websites with services on starting a business are easy to find.
However, once entrepreneurs reach these websites, they will still find that a number of these do not allow the
full service but merely provide information instead.
� Support and help functions to starting businesses are well in supply, as 83% of governments have demos,
FAQs and contact details in place. This can help starting entrepreneurs with more complicated administrative
procedures.
� Transparency is slowly improving but remains an issue for this life event. Starting businesses will often face
uncertainty on the delivery of services which were requested via the online channels.
� An important leap forward has been made in transparency on the data that governments hold on (the people
behind) business start-ups. An increasing number of countries provides examples of good practice in handling
this data.
� Many governments prioritise eGovernment services to foreign start-ups. Services to starting businesses have
significantly improved over the last two years. Still, a true Digital Single Market will need less face-to-face
interaction and more services to be completely available online to start-ups from other countries.
� Europe has not made any more use of important Key Enablers to eGovernment for business start-ups over the
18
Full text at http://ec.europa.eu/growth/tools-databases/newsroom/cf/itemdetail.cfm?item_id=8170&lang=en&tpa_id=0&title=New-start-
for-Growth-%E2%80%93-Interview-with-Commissioner-El%C5%BCbieta-Bie%C5%84kowska
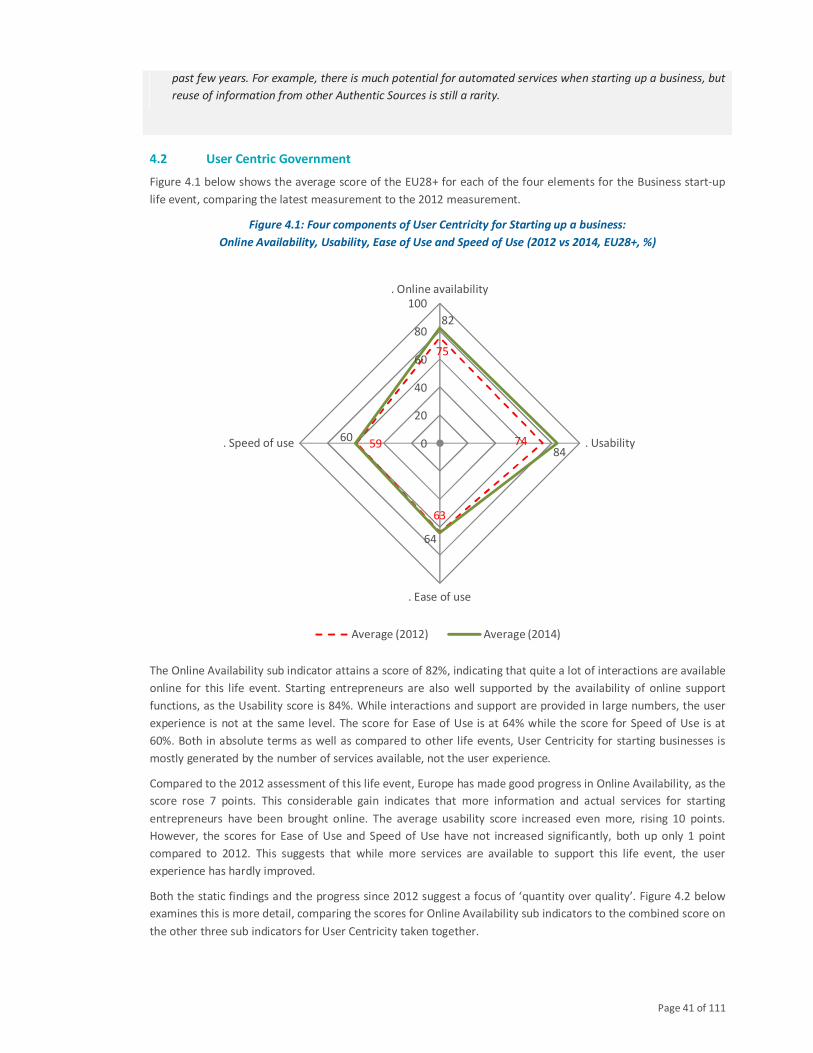
Page 41 of 111
past few years. For example, there is much potential for automated services when starting up a business, but
reuse of information from other Authentic Sources is still a rarity.
4.2 User Centric Government
Figure 4.1 below shows the average score of the EU28+ for each of the four elements for the Business start-up
life event, comparing the latest measurement to the 2012 measurement.
Figure 4.1: Four components of User Centricity for Starting up a business:
Online Availability, Usability, Ease of Use and Speed of Use (2012 vs 2014, EU28+, %)
The Online Availability sub indicator attains a score of 82%, indicating that quite a lot of interactions are available
online for this life event. Starting entrepreneurs are also well supported by the availability of online support
functions, as the Usability score is 84%. While interactions and support are provided in large numbers, the user
experience is not at the same level. The score for Ease of Use is at 64% while the score for Speed of Use is at
60%. Both in absolute terms as well as compared to other life events, User Centricity for starting businesses is
mostly generated by the number of services available, not the user experience.
Compared to the 2012 assessment of this life event, Europe has made good progress in Online Availability, as the
score rose 7 points. This considerable gain indicates that more information and actual services for starting
entrepreneurs have been brought online. The average usability score increased even more, rising 10 points.
However, the scores for Ease of Use and Speed of Use have not increased significantly, both up only 1 point
compared to 2012. This suggests that while more services are available to support this life event, the user
experience has hardly improved.
Both the static findings and the progress since 2012 suggest a focus of ‘quantity over quality’. Figure 4.2 below
examines this is more detail, comparing the scores for Online Availability sub indicators to the combined score on
the other three sub indicators for User Centricity taken together.
75
74
63
59
82
84
64
600
20
40
60
80
100
. Online availability
. Usability
. Ease of use
. Speed of use
Average (2012) Average (2014)
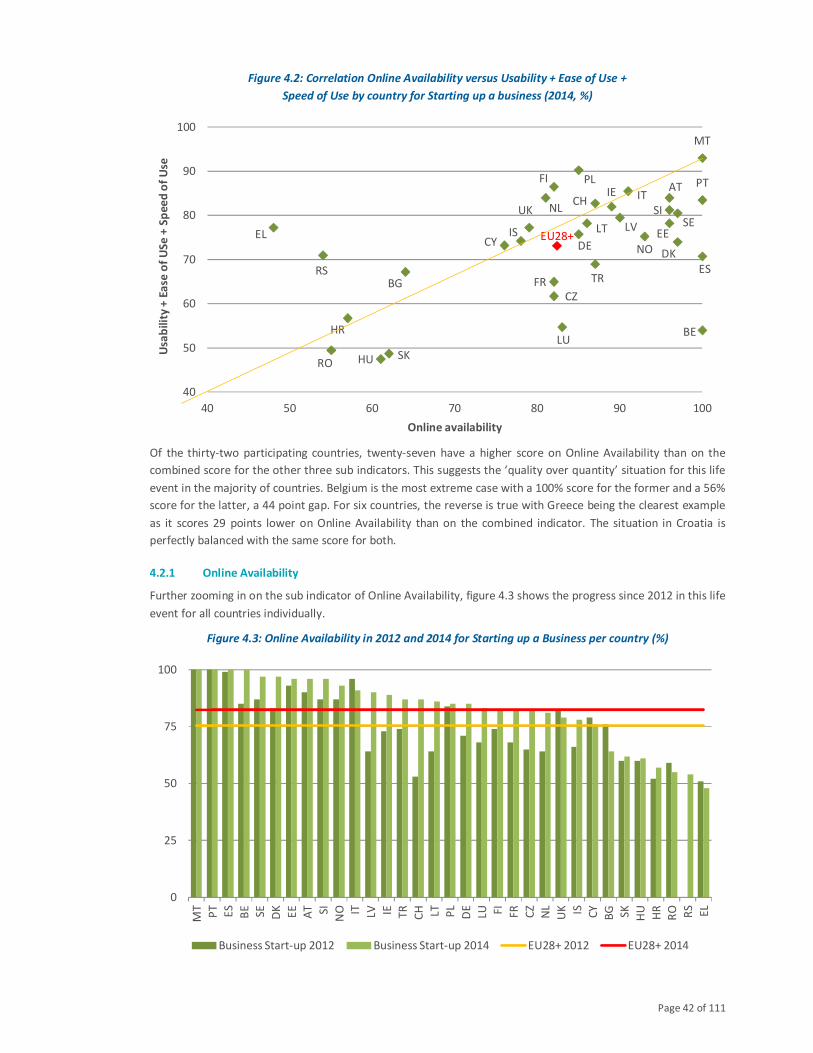
Page 42 of 111
Figure 4.2: Correlation Online Availability versus Usability + Ease of Use +
Speed of Use by country for Starting up a business (2014, %)
Of the thirty-two participating countries, twenty-seven have a higher score on Online Availability than on the
combined score for the other three sub indicators. This suggests the ‘quality over quantity’ situation for this life
event in the majority of countries. Belgium is the most extreme case with a 100% score for the former and a 56%
score for the latter, a 44 point gap. For six countries, the reverse is true with Greece being the clearest example
as it scores 29 points lower on Online Availability than on the combined indicator. The situation in Croatia is
perfectly balanced with the same score for both.
4.2.1 Online Availability
Further zooming in on the sub indicator of Online Availability, figure 4.3 shows the progress since 2012 in this life
event for all countries individually.
Figure 4.3: Online Availability in 2012 and 2014 for Starting up a Business per country (%)
AT
BE
BG
CH
CY
CZ
DEDK
EEEL
ES
FI
FR
HR
HU
IE
IS
IT
LT
LU
LV
MT
NL
NO
PL PT
RO
RS
SESI
SK
TR
UK
EU28+
40
50
60
70
80
90
100
40 50 60 70 80 90 100
Usa
bil
ity
+ E
ase
of
US
e +
Sp
ee
d o
f U
se
Online availability
0
25
50
75
100
MT
PT
ES
BE
SE
DK
EE
AT SI
NO IT LV IE TR
CH LT PL
DE
LU FI
FR
CZ
NL
UK IS CY
BG SK
HU
HR
RO RS
EL
Business Start-up 2012 Business Start-up 2014 EU28+ 2012 EU28+ 2014
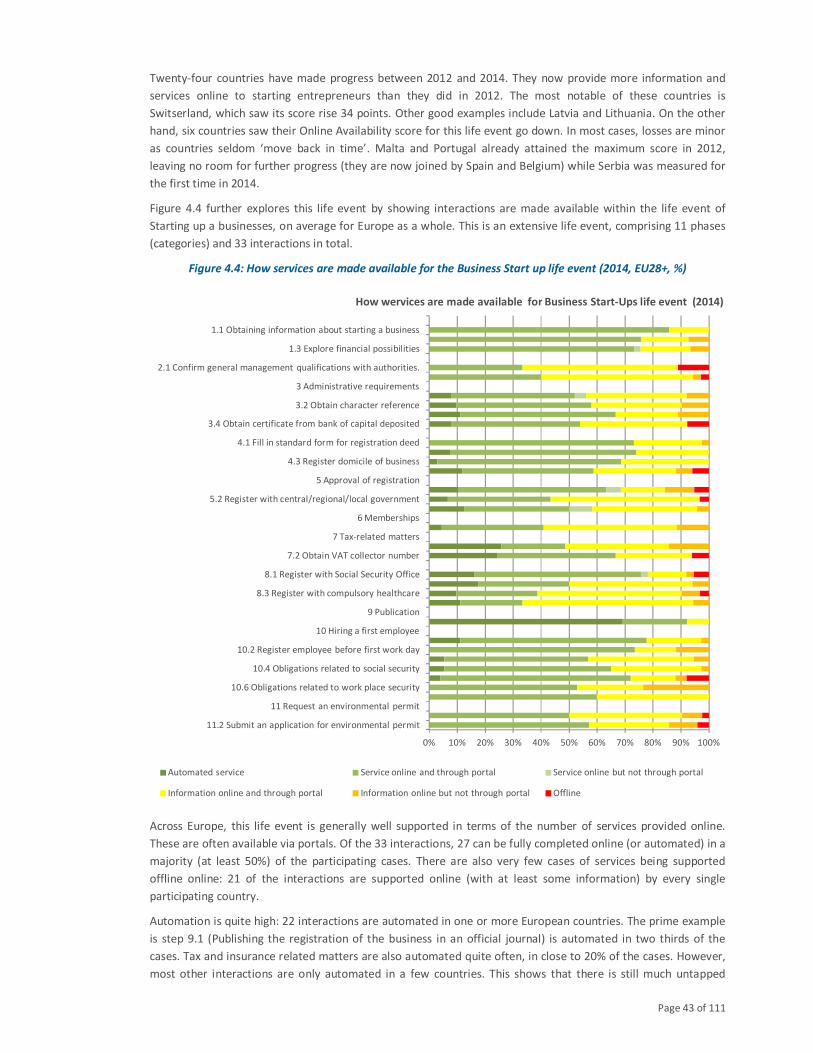
Page 43 of 111
Twenty-four countries have made progress between 2012 and 2014. They now provide more information and
services online to starting entrepreneurs than they did in 2012. The most notable of these countries is
Switserland, which saw its score rise 34 points. Other good examples include Latvia and Lithuania. On the other
hand, six countries saw their Online Availability score for this life event go down. In most cases, losses are minor
as countries seldom ‘move back in time’. Malta and Portugal already attained the maximum score in 2012,
leaving no room for further progress (they are now joined by Spain and Belgium) while Serbia was measured for
the first time in 2014.
Figure 4.4 further explores this life event by showing interactions are made available within the life event of
Starting up a businesses, on average for Europe as a whole. This is an extensive life event, comprising 11 phases
(categories) and 33 interactions in total.
Figure 4.4: How services are made available for the Business Start up life event (2014, EU28+, %)
Across Europe, this life event is generally well supported in terms of the number of services provided online.
These are often available via portals. Of the 33 interactions, 27 can be fully completed online (or automated) in a
majority (at least 50%) of the participating cases. There are also very few cases of services being supported
offline online: 21 of the interactions are supported online (with at least some information) by every single
participating country.
Automation is quite high: 22 interactions are automated in one or more European countries. The prime example
is step 9.1 (Publishing the registration of the business in an official journal) is automated in two thirds of the
cases. Tax and insurance related matters are also automated quite often, in close to 20% of the cases. However,
most other interactions are only automated in a few countries. This shows that there is still much untapped
0% 10% 20% 30% 40% 50% 60% 70% 80% 90% 100%
11.2 Submit an application for environmental permit
11 Request an environmental permit
10.6 Obligations related to work place security
10.4 Obligations related to social security
10.2 Register employee before first work day
10 Hiring a first employee
9 Publication
8.3 Register with compulsory healthcare
8.1 Register with Social Security Office
7.2 Obtain VAT collector number
7 Tax-related matters
6 Memberships
5.2 Register with central/regional/local government
5 Approval of registration
4.3 Register domicile of business
4.1 Fill in standard form for registration deed
3.4 Obtain certificate from bank of capital deposited
3.2 Obtain character reference
3 Administrative requirements
2.1 Confirm general management qualifications with authorities.
1.3 Explore financial possibilities
1.1 Obtaining information about starting a business
How wervices are made available for Business Start-Ups life event (2014)
Automated service Service online and through portal Service online but not through portal
Information online and through portal Information online but not through portal Offline
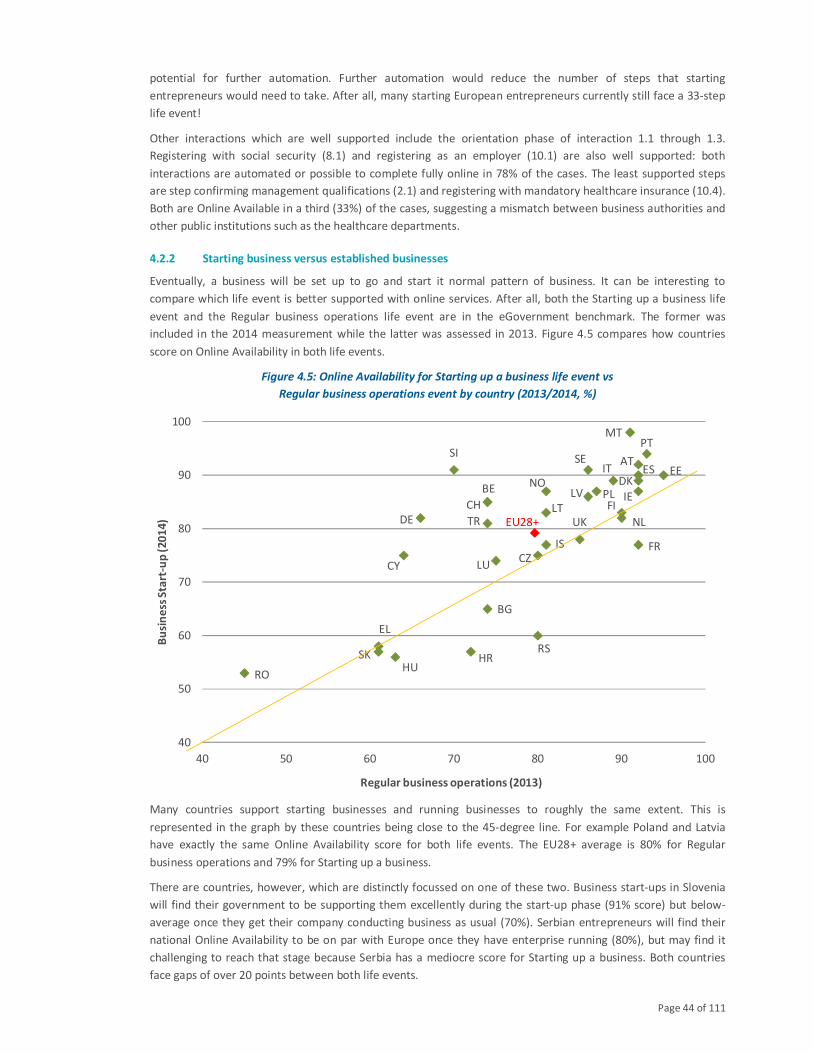
Page 44 of 111
potential for further automation. Further automation would reduce the number of steps that starting
entrepreneurs would need to take. After all, many starting European entrepreneurs currently still face a 33-step
life event!
Other interactions which are well supported include the orientation phase of interaction 1.1 through 1.3.
Registering with social security (8.1) and registering as an employer (10.1) are also well supported: both
interactions are automated or possible to complete fully online in 78% of the cases. The least supported steps
are step confirming management qualifications (2.1) and registering with mandatory healthcare insurance (10.4).
Both are Online Available in a third (33%) of the cases, suggesting a mismatch between business authorities and
other public institutions such as the healthcare departments.
4.2.2 Starting business versus established businesses
Eventually, a business will be set up to go and start it normal pattern of business. It can be interesting to
compare which life event is better supported with online services. After all, both the Starting up a business life
event and the Regular business operations life event are in the eGovernment benchmark. The former was
included in the 2014 measurement while the latter was assessed in 2013. Figure 4.5 compares how countries
score on Online Availability in both life events.
Figure 4.5: Online Availability for Starting up a business life event vs
Regular business operations event by country (2013/2014, %)
Many countries support starting businesses and running businesses to roughly the same extent. This is
represented in the graph by these countries being close to the 45-degree line. For example Poland and Latvia
have exactly the same Online Availability score for both life events. The EU28+ average is 80% for Regular
business operations and 79% for Starting up a business.
There are countries, however, which are distinctly focussed on one of these two. Business start-ups in Slovenia
will find their government to be supporting them excellently during the start-up phase (91% score) but below-
average once they get their company conducting business as usual (70%). Serbian entrepreneurs will find their
national Online Availability to be on par with Europe once they have enterprise running (80%), but may find it
challenging to reach that stage because Serbia has a mediocre score for Starting up a business. Both countries
face gaps of over 20 points between both life events.
AT
BE
BG
CH
CYCZ
DE
DKEE
EL
ES
FI
FR
HRHU
IE
IS
IT
LT
LU
LV
MT
NL
NOPL
PT
RO
RS
SESI
SK
TR UKEU28+
40
50
60
70
80
90
100
40 50 60 70 80 90 100
Bu
sin
ess
Sta
rt-u
p (
20
14
)
Regular business operations (2013)
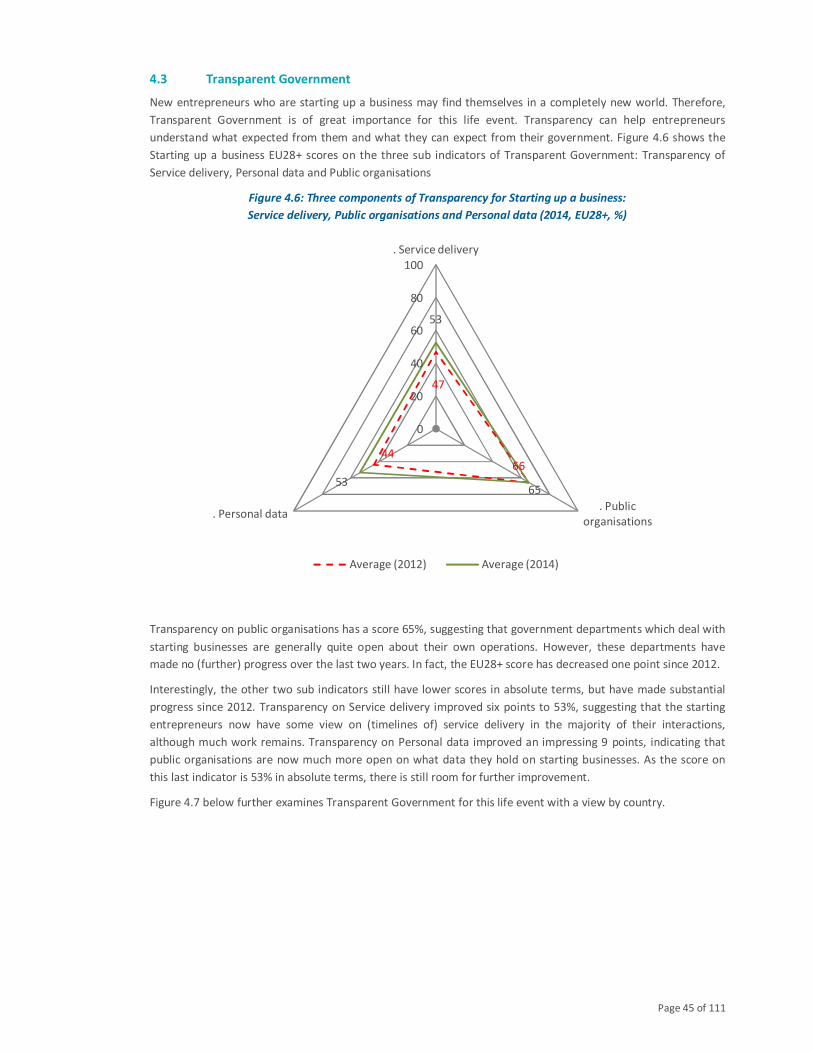
Page 45 of 111
4.3 Transparent Government
New entrepreneurs who are starting up a business may find themselves in a completely new world. Therefore,
Transparent Government is of great importance for this life event. Transparency can help entrepreneurs
understand what expected from them and what they can expect from their government. Figure 4.6 shows the
Starting up a business EU28+ scores on the three sub indicators of Transparent Government: Transparency of
Service delivery, Personal data and Public organisations
Figure 4.6: Three components of Transparency for Starting up a business:
Service delivery, Public organisations and Personal data (2014, EU28+, %)
Transparency on public organisations has a score 65%, suggesting that government departments which deal with
starting businesses are generally quite open about their own operations. However, these departments have
made no (further) progress over the last two years. In fact, the EU28+ score has decreased one point since 2012.
Interestingly, the other two sub indicators still have lower scores in absolute terms, but have made substantial
progress since 2012. Transparency on Service delivery improved six points to 53%, suggesting that the starting
entrepreneurs now have some view on (timelines of) service delivery in the majority of their interactions,
although much work remains. Transparency on Personal data improved an impressing 9 points, indicating that
public organisations are now much more open on what data they hold on starting businesses. As the score on
this last indicator is 53% in absolute terms, there is still room for further improvement.
Figure 4.7 below further examines Transparent Government for this life event with a view by country.
47
6644
53
6553
0
20
40
60
80
100
. Service delivery
. Public
organisations. Personal data
Average (2012) Average (2014)
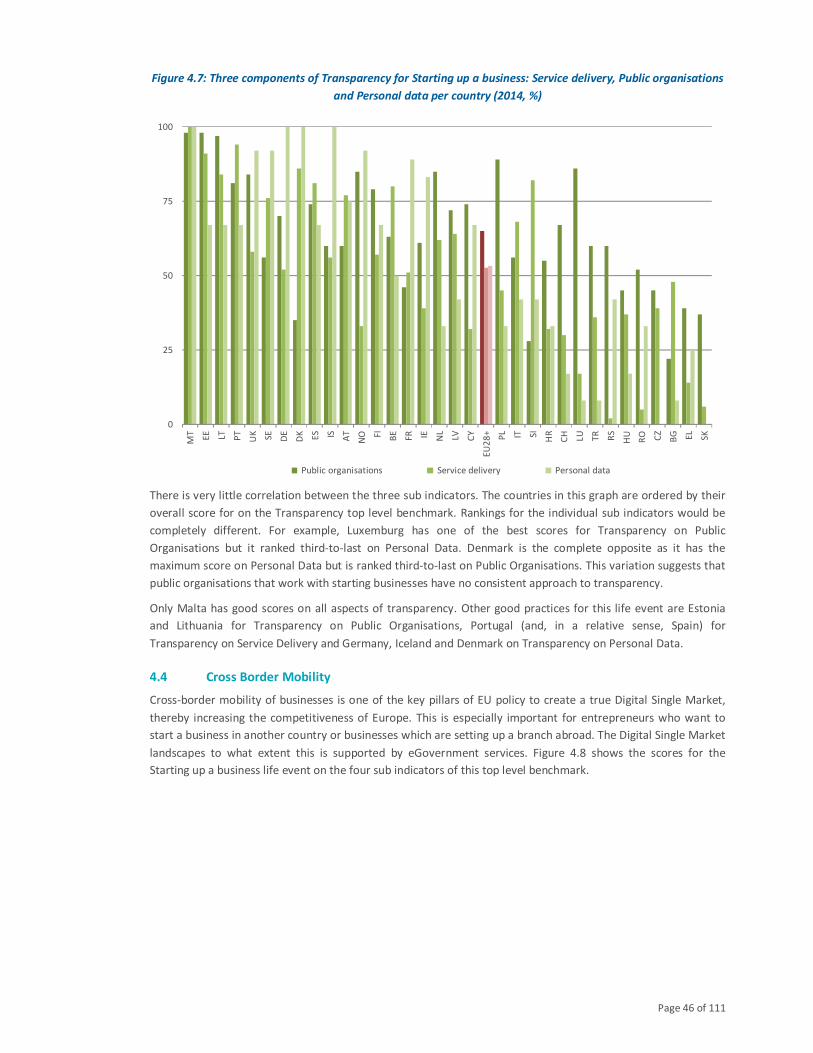
Page 46 of 111
Figure 4.7: Three components of Transparency for Starting up a business: Service delivery, Public organisations
and Personal data per country (2014, %)
There is very little correlation between the three sub indicators. The countries in this graph are ordered by their
overall score for on the Transparency top level benchmark. Rankings for the individual sub indicators would be
completely different. For example, Luxemburg has one of the best scores for Transparency on Public
Organisations but it ranked third-to-last on Personal Data. Denmark is the complete opposite as it has the
maximum score on Personal Data but is ranked third-to-last on Public Organisations. This variation suggests that
public organisations that work with starting businesses have no consistent approach to transparency.
Only Malta has good scores on all aspects of transparency. Other good practices for this life event are Estonia
and Lithuania for Transparency on Public Organisations, Portugal (and, in a relative sense, Spain) for
Transparency on Service Delivery and Germany, Iceland and Denmark on Transparency on Personal Data.
4.4 Cross Border Mobility
Cross-border mobility of businesses is one of the key pillars of EU policy to create a true Digital Single Market,
thereby increasing the competitiveness of Europe. This is especially important for entrepreneurs who want to
start a business in another country or businesses which are setting up a branch abroad. The Digital Single Market
landscapes to what extent this is supported by eGovernment services. Figure 4.8 shows the scores for the
Starting up a business life event on the four sub indicators of this top level benchmark.
0
25
50
75
100
MT
EE LT PT
UK SE
DE
DK ES IS AT
NO FI
BE
FR IE NL
LV CY
EU
28
+
PL IT SI
HR
CH
LU TR
RS
HU
RO CZ
BG EL
SK
Public organisations Service delivery Personal data
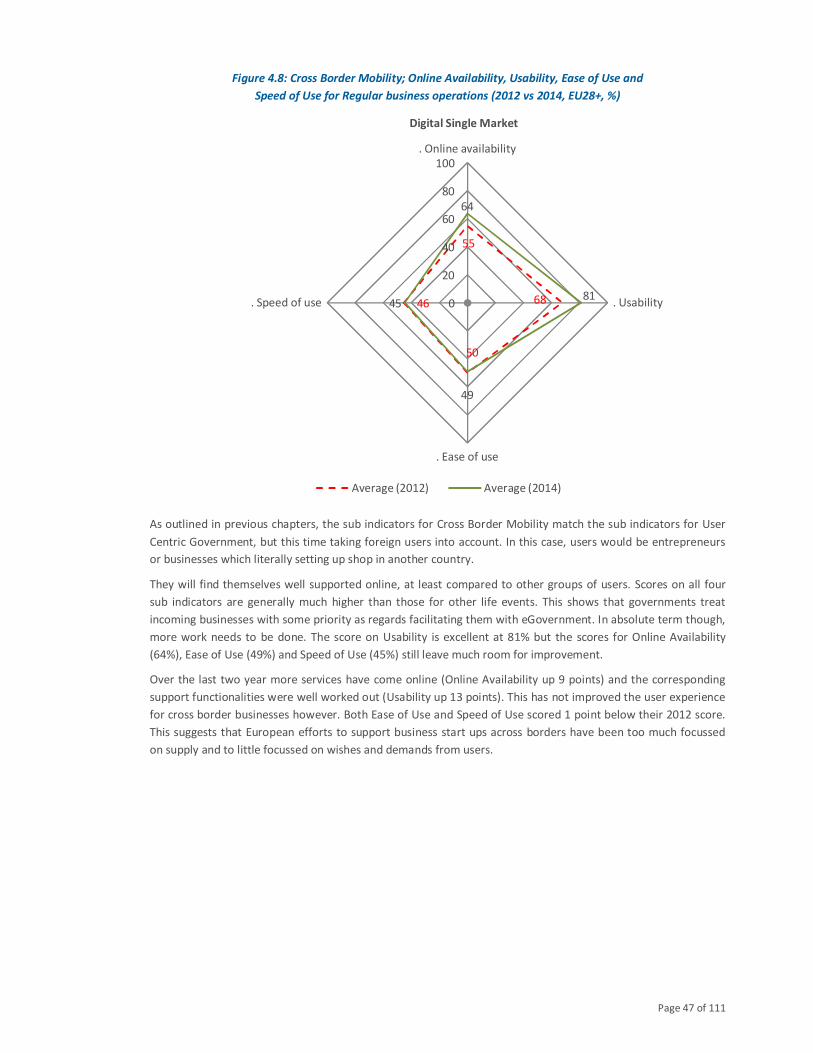
Page 47 of 111
Figure 4.8: Cross Border Mobility; Online Availability, Usability, Ease of Use and
Speed of Use for Regular business operations (2012 vs 2014, EU28+, %)
As outlined in previous chapters, the sub indicators for Cross Border Mobility match the sub indicators for User
Centric Government, but this time taking foreign users into account. In this case, users would be entrepreneurs
or businesses which literally setting up shop in another country.
They will find themselves well supported online, at least compared to other groups of users. Scores on all four
sub indicators are generally much higher than those for other life events. This shows that governments treat
incoming businesses with some priority as regards facilitating them with eGovernment. In absolute term though,
more work needs to be done. The score on Usability is excellent at 81% but the scores for Online Availability
(64%), Ease of Use (49%) and Speed of Use (45%) still leave much room for improvement.
Over the last two year more services have come online (Online Availability up 9 points) and the corresponding
support functionalities were well worked out (Usability up 13 points). This has not improved the user experience
for cross border businesses however. Both Ease of Use and Speed of Use scored 1 point below their 2012 score.
This suggests that European efforts to support business start ups across borders have been too much focussed
on supply and to little focussed on wishes and demands from users.
55
68
50
46
64
81
49
45 0
20
40
60
80
100
. Online availability
. Usability
. Ease of use
. Speed of use
Digital Single Market
Average (2012) Average (2014)
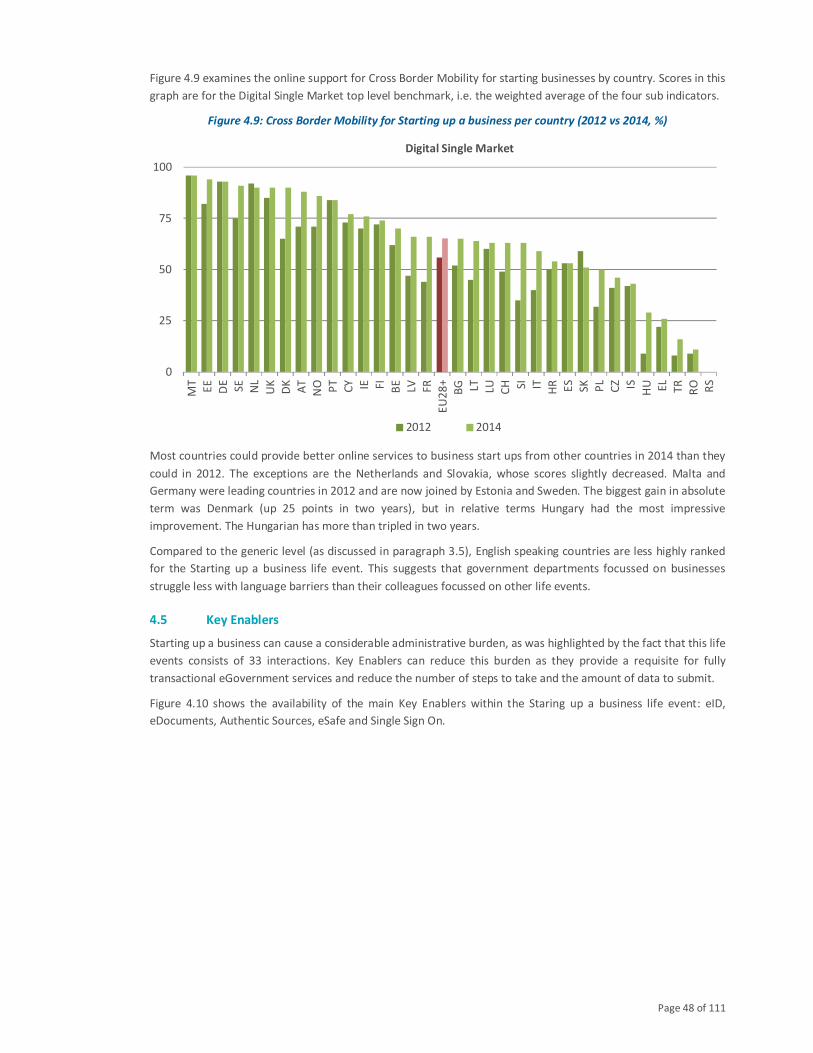
Page 48 of 111
Figure 4.9 examines the online support for Cross Border Mobility for starting businesses by country. Scores in this
graph are for the Digital Single Market top level benchmark, i.e. the weighted average of the four sub indicators.
Figure 4.9: Cross Border Mobility for Starting up a business per country (2012 vs 2014, %)
Most countries could provide better online services to business start ups from other countries in 2014 than they
could in 2012. The exceptions are the Netherlands and Slovakia, whose scores slightly decreased. Malta and
Germany were leading countries in 2012 and are now joined by Estonia and Sweden. The biggest gain in absolute
term was Denmark (up 25 points in two years), but in relative terms Hungary had the most impressive
improvement. The Hungarian has more than tripled in two years.
Compared to the generic level (as discussed in paragraph 3.5), English speaking countries are less highly ranked
for the Starting up a business life event. This suggests that government departments focussed on businesses
struggle less with language barriers than their colleagues focussed on other life events.
4.5 Key Enablers
Starting up a business can cause a considerable administrative burden, as was highlighted by the fact that this life
events consists of 33 interactions. Key Enablers can reduce this burden as they provide a requisite for fully
transactional eGovernment services and reduce the number of steps to take and the amount of data to submit.
Figure 4.10 shows the availability of the main Key Enablers within the Staring up a business life event: eID,
eDocuments, Authentic Sources, eSafe and Single Sign On.
0
25
50
75
100
MT
EE
DE
SE
NL
UK
DK
AT
NO PT
CY IE FI
BE
LV FR
EU
28
+
BG LT LU CH SI
IT HR ES
SK PL
CZ IS
HU EL
TR
RO RS
Digital Single Market
2012 2014
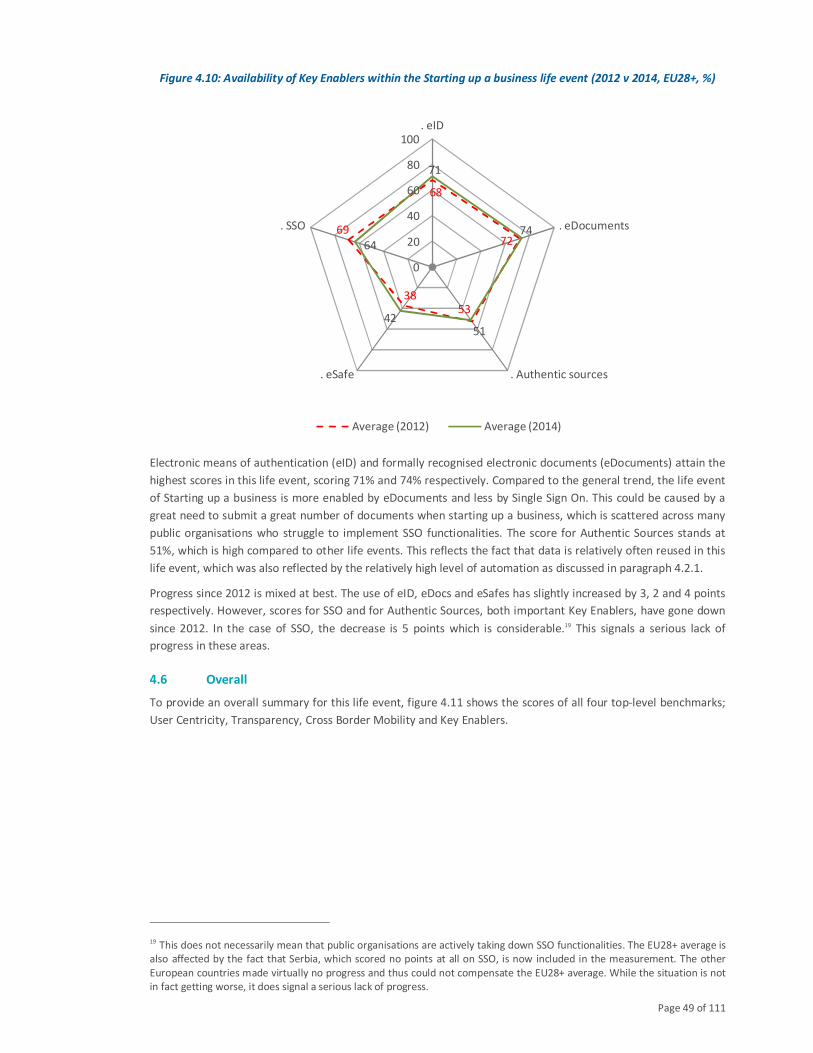
Page 49 of 111
Figure 4.10: Availability of Key Enablers within the Starting up a business life event (2012 v 2014, EU28+, %)
Electronic means of authentication (eID) and formally recognised electronic documents (eDocuments) attain the
highest scores in this life event, scoring 71% and 74% respectively. Compared to the general trend, the life event
of Starting up a business is more enabled by eDocuments and less by Single Sign On. This could be caused by a
great need to submit a great number of documents when starting up a business, which is scattered across many
public organisations who struggle to implement SSO functionalities. The score for Authentic Sources stands at
51%, which is high compared to other life events. This reflects the fact that data is relatively often reused in this
life event, which was also reflected by the relatively high level of automation as discussed in paragraph 4.2.1.
Progress since 2012 is mixed at best. The use of eID, eDocs and eSafes has slightly increased by 3, 2 and 4 points
respectively. However, scores for SSO and for Authentic Sources, both important Key Enablers, have gone down
since 2012. In the case of SSO, the decrease is 5 points which is considerable.19 This signals a serious lack of
progress in these areas.
4.6 Overall
To provide an overall summary for this life event, figure 4.11 shows the scores of all four top-level benchmarks;
User Centricity, Transparency, Cross Border Mobility and Key Enablers.
19 This does not necessarily mean that public organisations are actively taking down SSO functionalities. The EU28+ average is
also affected by the fact that Serbia, which scored no points at all on SSO, is now included in the measurement. The other
European countries made virtually no progress and thus could not compensate the EU28+ average. While the situation is not
in fact getting worse, it does signal a serious lack of progress.
68
72
5338
69
71
74
5142
64
0
20
40
60
80
100. eID
. eDocuments
. Authentic sources. eSafe
. SSO
Average (2012) Average (2014)
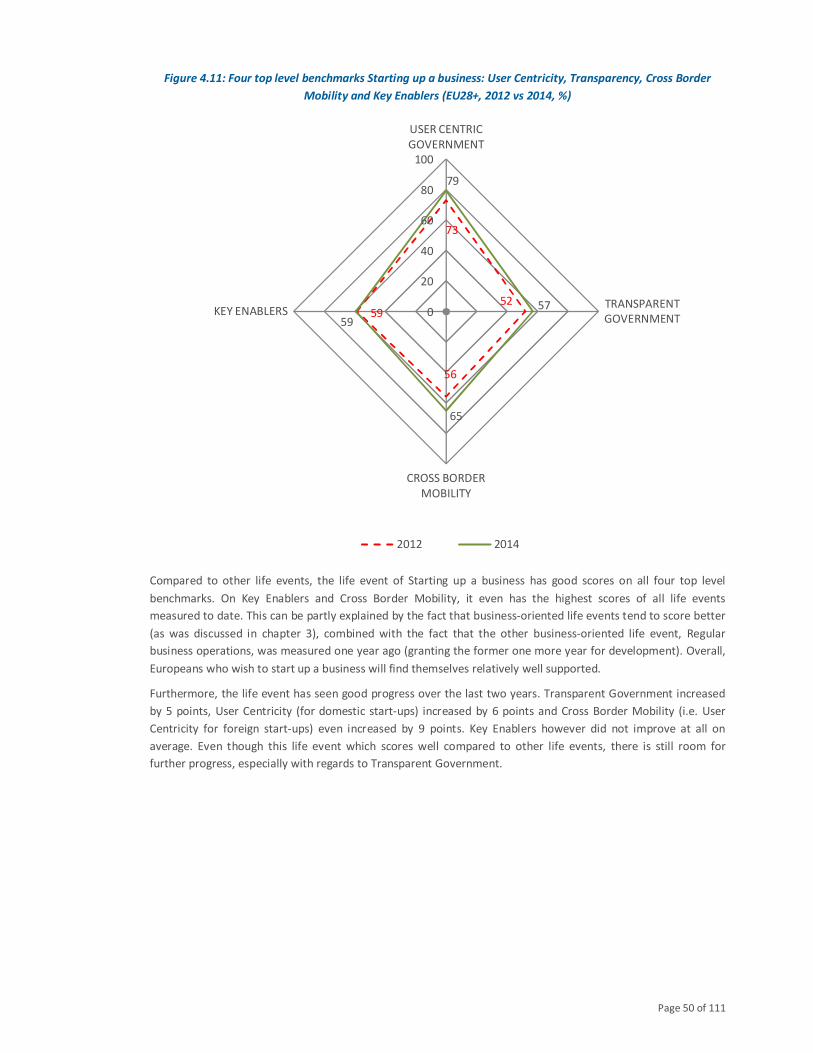
Page 50 of 111
Figure 4.11: Four top level benchmarks Starting up a business: User Centricity, Transparency, Cross Border
Mobility and Key Enablers (EU28+, 2012 vs 2014, %)
Compared to other life events, the life event of Starting up a business has good scores on all four top level
benchmarks. On Key Enablers and Cross Border Mobility, it even has the highest scores of all life events
measured to date. This can be partly explained by the fact that business-oriented life events tend to score better
(as was discussed in chapter 3), combined with the fact that the other business-oriented life event, Regular
business operations, was measured one year ago (granting the former one more year for development). Overall,
Europeans who wish to start up a business will find themselves relatively well supported.
Furthermore, the life event has seen good progress over the last two years. Transparent Government increased
by 5 points, User Centricity (for domestic start-ups) increased by 6 points and Cross Border Mobility (i.e. User
Centricity for foreign start-ups) even increased by 9 points. Key Enablers however did not improve at all on
average. Even though this life event which scores well compared to other life events, there is still room for
further progress, especially with regards to Transparent Government.
73
52
56
59
79
57
65
590
20
40
60
80
100
USER CENTRIC
GOVERNMENT
TRANSPARENT
GOVERNMENT
CROSS BORDER
MOBILITY
KEY ENABLERS
2012 2014
Page 51 of 111
5 Losing and finding a job
‘Growth and jobs, combined with skills development to make people better equipped for the jobs and for
societies of tomorrow, are in my view the best instruments to promote social inclusion.’
Commissioner Marianne Thyssen
12 February 2015 on the Opening Conference of the Belgian Chairmanship of the Council of Europe 20
5.1 Introduction to the life event
This chapter will discuss the benchmark results for the life event of Losing and finding a job. For this life event,
the eGovernment services of thirty-three European countries have been assessed on three lop level benchmark
indicators. These represent the three main aspects that citizens going through this life event will need:
� User Centricity: Are citizens able to obtain transactional services remotely and are the services easy to
understand and quickly obtainable? Are citizens really supported when they request operations? How far
are public services re-using information already provided by businesses, thus speeding up the time for
applications for instance?
� Transparency: Can businesses easily find information on the use of their company –and sometimes personal
– data, the roles and responsibilities of public organisations and the way the service is organised? Can
businesses influence policy making or public organisation performance?
� Key Enablers: Are services for businesses provided seamlessly by using technical enablers such as eID, Single
Sign On and eDocuments.
After the 2012 measurement, this is the second time that this life event is assessed using the same methodology,
allowing for comparison over time. The lop level benchmark of Cross Border Mobility is not included in the
benchmark for Losing and finding a job, because cross border eGovernment services were applicable not to be
measured for this life event.
Key findings
� eGovernment services to jobseekers have not become much more user centric over the last two years. User
experience in particular has seen little progress. These services are not significantly more user friendly or fast
to use than they were at the time of the 2012 measurement.
� The journey of ‘finding a job’ is generally well supported. Many countries provide the required services fully
online. The journey of ‘losing a job’ on the other hand is often impossible to complete fully online. Many
countries merely provide information on unemployment benefits via the online channels; actually obtaining
these benefits requires physical interaction.
� The supply of support and help functionalities is very high. Over 86% of all government agencies provide tools
such as FAQs, life chat and fora online to support jobseekers.
� The (often semi-independent) agencies concerned with this life event feel the need to be transparent on what
their organisation is, but not on how and when it will complete the requested services.
� Transparency on personal data is more of a priority now than it was two years ago. Still, procedures to view,
edit or complain about this data could be further refined.
� The use of electronic tools for identification has not increased for this life event over the last two years. This
could explain why not many services can be completed fully online.
20
Full text at http://europa.eu/rapid/press-release_SPEECH-15-4404_en.html
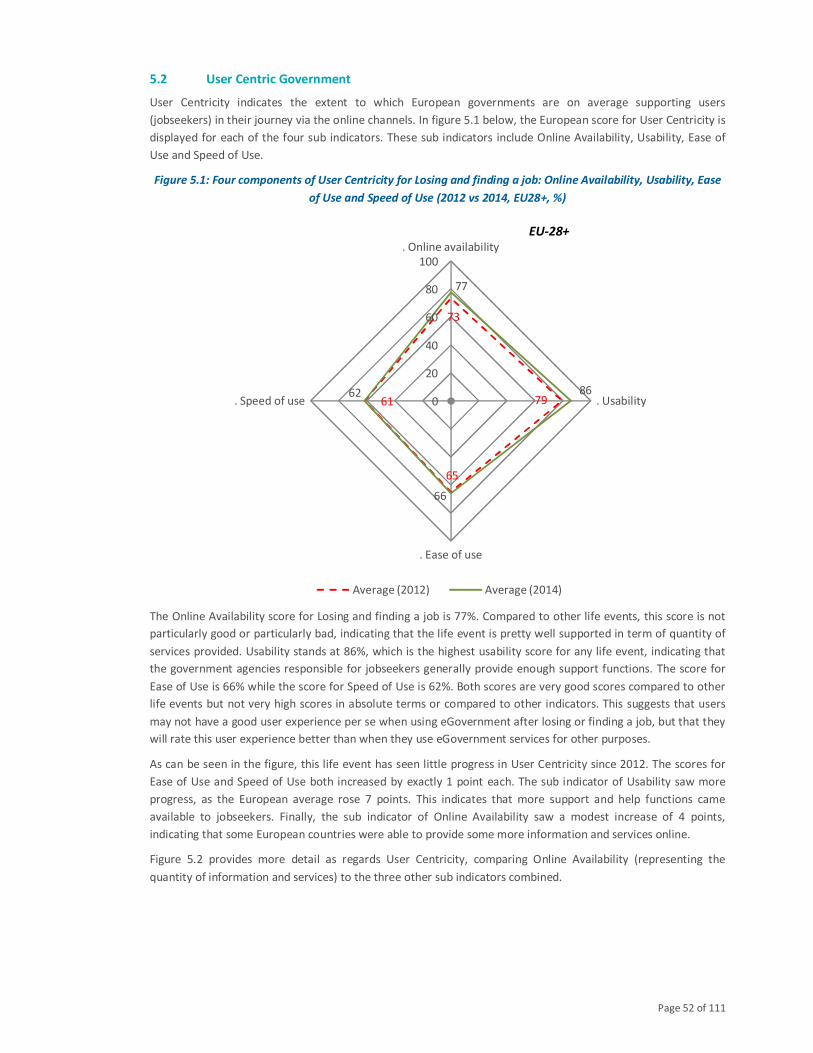
Page 52 of 111
5.2 User Centric Government
User Centricity indicates the extent to which European governments are on average supporting users
(jobseekers) in their journey via the online channels. In figure 5.1 below, the European score for User Centricity is
displayed for each of the four sub indicators. These sub indicators include Online Availability, Usability, Ease of
Use and Speed of Use.
Figure 5.1: Four components of User Centricity for Losing and finding a job: Online Availability, Usability, Ease
of Use and Speed of Use (2012 vs 2014, EU28+, %)
The Online Availability score for Losing and finding a job is 77%. Compared to other life events, this score is not
particularly good or particularly bad, indicating that the life event is pretty well supported in term of quantity of
services provided. Usability stands at 86%, which is the highest usability score for any life event, indicating that
the government agencies responsible for jobseekers generally provide enough support functions. The score for
Ease of Use is 66% while the score for Speed of Use is 62%. Both scores are very good scores compared to other
life events but not very high scores in absolute terms or compared to other indicators. This suggests that users
may not have a good user experience per se when using eGovernment after losing or finding a job, but that they
will rate this user experience better than when they use eGovernment services for other purposes.
As can be seen in the figure, this life event has seen little progress in User Centricity since 2012. The scores for
Ease of Use and Speed of Use both increased by exactly 1 point each. The sub indicator of Usability saw more
progress, as the European average rose 7 points. This indicates that more support and help functions came
available to jobseekers. Finally, the sub indicator of Online Availability saw a modest increase of 4 points,
indicating that some European countries were able to provide some more information and services online.
Figure 5.2 provides more detail as regards User Centricity, comparing Online Availability (representing the
quantity of information and services) to the three other sub indicators combined.
73
79
65
61
77
86
66
620
20
40
60
80
100
. Online availability
. Usability
. Ease of use
. Speed of use
Average (2012) Average (2014)
EU-28+
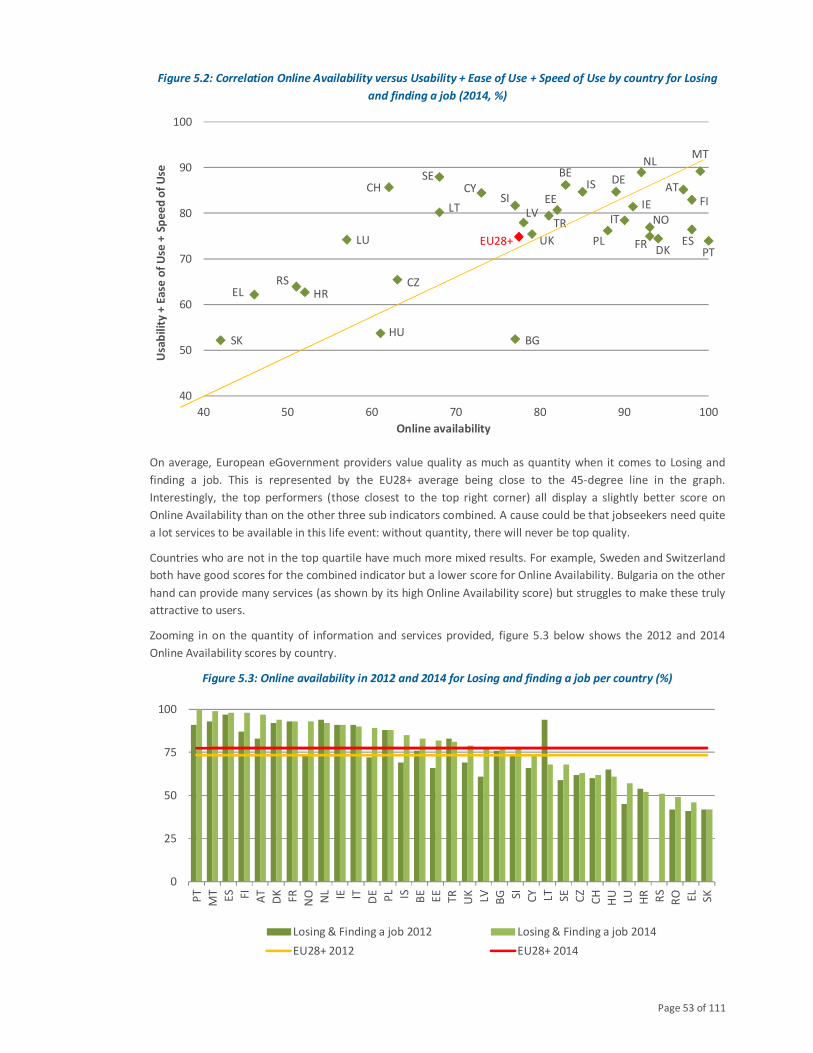
Page 53 of 111
Figure 5.2: Correlation Online Availability versus Usability + Ease of Use + Speed of Use by country for Losing
and finding a job (2014, %)
On average, European eGovernment providers value quality as much as quantity when it comes to Losing and
finding a job. This is represented by the EU28+ average being close to the 45-degree line in the graph.
Interestingly, the top performers (those closest to the top right corner) all display a slightly better score on
Online Availability than on the other three sub indicators combined. A cause could be that jobseekers need quite
a lot services to be available in this life event: without quantity, there will never be top quality.
Countries who are not in the top quartile have much more mixed results. For example, Sweden and Switzerland
both have good scores for the combined indicator but a lower score for Online Availability. Bulgaria on the other
hand can provide many services (as shown by its high Online Availability score) but struggles to make these truly
attractive to users.
Zooming in on the quantity of information and services provided, figure 5.3 below shows the 2012 and 2014
Online Availability scores by country.
Figure 5.3: Online availability in 2012 and 2014 for Losing and finding a job per country (%)
AT
BE
BG
CH CY
CZ
DE
DK
EE
EL
ES
FI
FR
HR
HU
IE
IS
ITLT
LU
LV
MTNL
NO
PLPT
RS
SE
SI
SK
TR
UKEU28+
40
50
60
70
80
90
100
40 50 60 70 80 90 100
Usa
bil
ity
+ E
ase
of
Use
+ S
pe
ed
of
Use
Online availability
0
25
50
75
100
PT
MT
ES FI
AT
DK
FR
NO NL IE IT DE
PL IS BE
EE
TR
UK
LV BG SI
CY LT SE
CZ
CH
HU LU HR RS
RO EL
SK
Losing & Finding a job 2012 Losing & Finding a job 2014
EU28+ 2012 EU28+ 2014
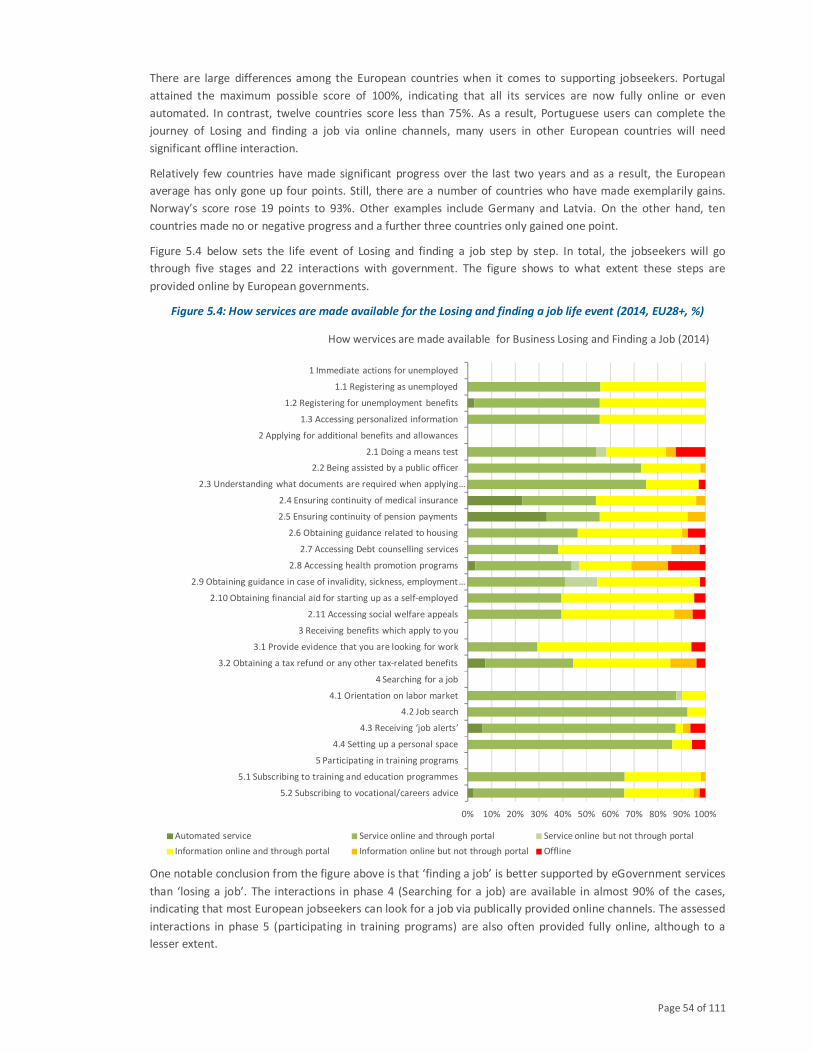
Page 54 of 111
There are large differences among the European countries when it comes to supporting jobseekers. Portugal
attained the maximum possible score of 100%, indicating that all its services are now fully online or even
automated. In contrast, twelve countries score less than 75%. As a result, Portuguese users can complete the
journey of Losing and finding a job via online channels, many users in other European countries will need
significant offline interaction.
Relatively few countries have made significant progress over the last two years and as a result, the European
average has only gone up four points. Still, there are a number of countries who have made exemplarily gains.
Norway’s score rose 19 points to 93%. Other examples include Germany and Latvia. On the other hand, ten
countries made no or negative progress and a further three countries only gained one point.
Figure 5.4 below sets the life event of Losing and finding a job step by step. In total, the jobseekers will go
through five stages and 22 interactions with government. The figure shows to what extent these steps are
provided online by European governments.
Figure 5.4: How services are made available for the Losing and finding a job life event (2014, EU28+, %)
One notable conclusion from the figure above is that ‘finding a job’ is better supported by eGovernment services
than ‘losing a job’. The interactions in phase 4 (Searching for a job) are available in almost 90% of the cases,
indicating that most European jobseekers can look for a job via publically provided online channels. The assessed
interactions in phase 5 (participating in training programs) are also often provided fully online, although to a
lesser extent.
0% 10% 20% 30% 40% 50% 60% 70% 80% 90% 100%
5.2 Subscribing to vocational/careers advice
5.1 Subscribing to training and education programmes
5 Participating in training programs
4.4 Setting up a personal space
4.3 Receiving ‘job alerts’
4.2 Job search
4.1 Orientation on labor market
4 Searching for a job
3.2 Obtaining a tax refund or any other tax-related benefits
3.1 Provide evidence that you are looking for work
3 Receiving benefits which apply to you
2.11 Accessing social welfare appeals
2.10 Obtaining financial aid for starting up as a self-employed
2.9 Obtaining guidance in case of invalidity, sickness, employment …
2.8 Accessing health promotion programs
2.7 Accessing Debt counselling services
2.6 Obtaining guidance related to housing
2.5 Ensuring continuity of pension payments
2.4 Ensuring continuity of medical insurance
2.3 Understanding what documents are required when applying …
2.2 Being assisted by a public officer
2.1 Doing a means test
2 Applying for additional benefits and allowances
1.3 Accessing personalized information
1.2 Registering for unemployment benefits
1.1 Registering as unemployed
1 Immediate actions for unemployed
How wervices are made available for Business Losing and Finding a Job (2014)
Automated service Service online and through portal Service online but not through portal
Information online and through portal Information online but not through portal Offline
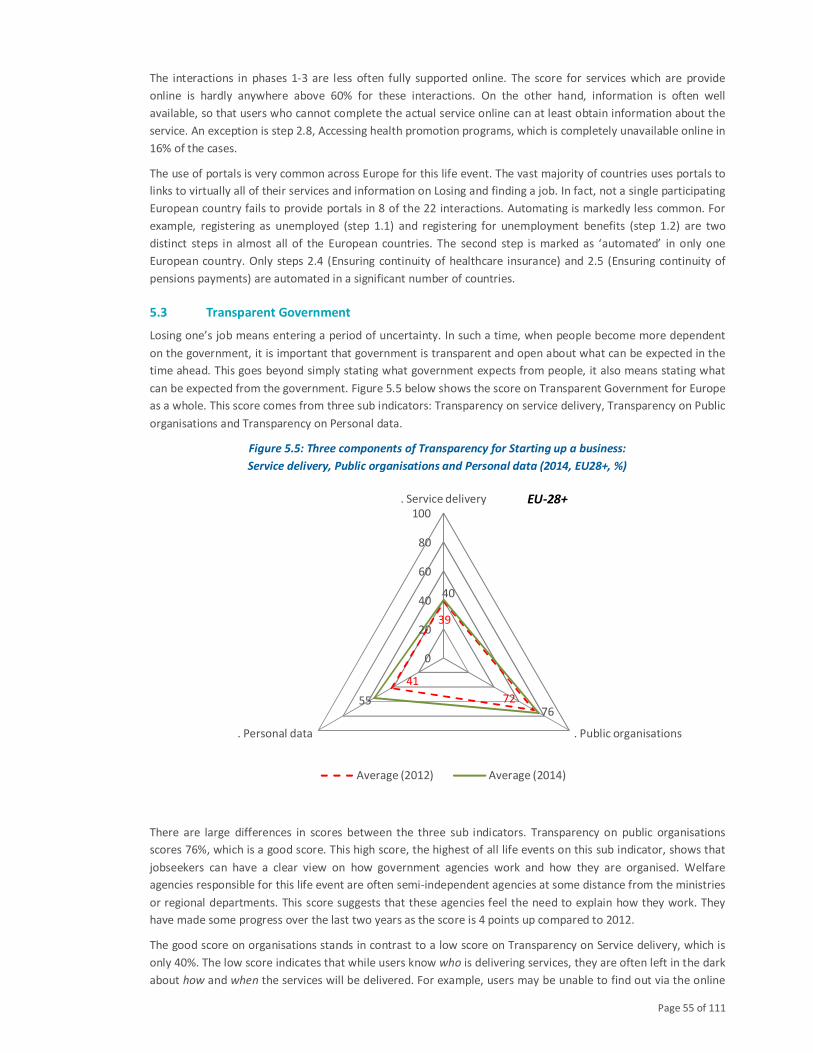
Page 55 of 111
The interactions in phases 1-3 are less often fully supported online. The score for services which are provide
online is hardly anywhere above 60% for these interactions. On the other hand, information is often well
available, so that users who cannot complete the actual service online can at least obtain information about the
service. An exception is step 2.8, Accessing health promotion programs, which is completely unavailable online in
16% of the cases.
The use of portals is very common across Europe for this life event. The vast majority of countries uses portals to
links to virtually all of their services and information on Losing and finding a job. In fact, not a single participating
European country fails to provide portals in 8 of the 22 interactions. Automating is markedly less common. For
example, registering as unemployed (step 1.1) and registering for unemployment benefits (step 1.2) are two
distinct steps in almost all of the European countries. The second step is marked as ‘automated’ in only one
European country. Only steps 2.4 (Ensuring continuity of healthcare insurance) and 2.5 (Ensuring continuity of
pensions payments) are automated in a significant number of countries.
5.3 Transparent Government
Losing one’s job means entering a period of uncertainty. In such a time, when people become more dependent
on the government, it is important that government is transparent and open about what can be expected in the
time ahead. This goes beyond simply stating what government expects from people, it also means stating what
can be expected from the government. Figure 5.5 below shows the score on Transparent Government for Europe
as a whole. This score comes from three sub indicators: Transparency on service delivery, Transparency on Public
organisations and Transparency on Personal data.
Figure 5.5: Three components of Transparency for Starting up a business:
Service delivery, Public organisations and Personal data (2014, EU28+, %)
There are large differences in scores between the three sub indicators. Transparency on public organisations
scores 76%, which is a good score. This high score, the highest of all life events on this sub indicator, shows that
jobseekers can have a clear view on how government agencies work and how they are organised. Welfare
agencies responsible for this life event are often semi-independent agencies at some distance from the ministries
or regional departments. This score suggests that these agencies feel the need to explain how they work. They
have made some progress over the last two years as the score is 4 points up compared to 2012.
The good score on organisations stands in contrast to a low score on Transparency on Service delivery, which is
only 40%. The low score indicates that while users know who is delivering services, they are often left in the dark
about how and when the services will be delivered. For example, users may be unable to find out via the online
39
72
41
40
7655
0
20
40
60
80
100
. Service delivery
. Public organisations. Personal data
Average (2012) Average (2014)
EU-28+
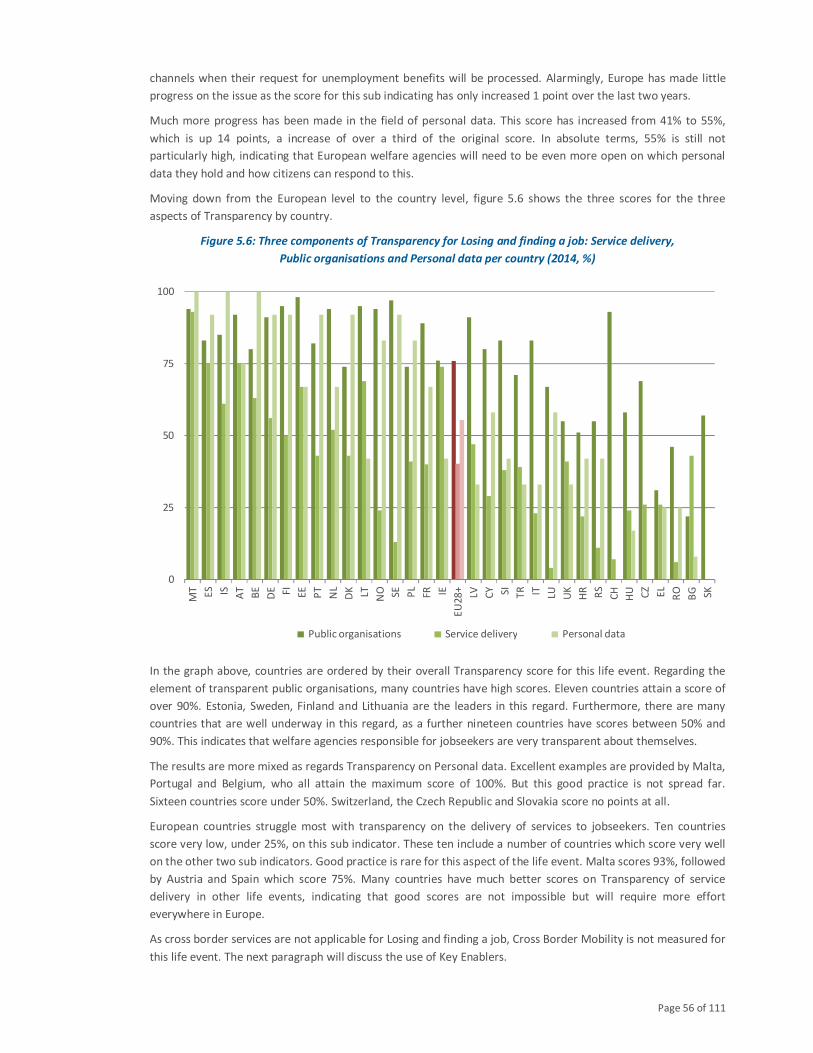
Page 56 of 111
channels when their request for unemployment benefits will be processed. Alarmingly, Europe has made little
progress on the issue as the score for this sub indicating has only increased 1 point over the last two years.
Much more progress has been made in the field of personal data. This score has increased from 41% to 55%,
which is up 14 points, a increase of over a third of the original score. In absolute terms, 55% is still not
particularly high, indicating that European welfare agencies will need to be even more open on which personal
data they hold and how citizens can respond to this.
Moving down from the European level to the country level, figure 5.6 shows the three scores for the three
aspects of Transparency by country.
Figure 5.6: Three components of Transparency for Losing and finding a job: Service delivery,
Public organisations and Personal data per country (2014, %)
In the graph above, countries are ordered by their overall Transparency score for this life event. Regarding the
element of transparent public organisations, many countries have high scores. Eleven countries attain a score of
over 90%. Estonia, Sweden, Finland and Lithuania are the leaders in this regard. Furthermore, there are many
countries that are well underway in this regard, as a further nineteen countries have scores between 50% and
90%. This indicates that welfare agencies responsible for jobseekers are very transparent about themselves.
The results are more mixed as regards Transparency on Personal data. Excellent examples are provided by Malta,
Portugal and Belgium, who all attain the maximum score of 100%. But this good practice is not spread far.
Sixteen countries score under 50%. Switzerland, the Czech Republic and Slovakia score no points at all.
European countries struggle most with transparency on the delivery of services to jobseekers. Ten countries
score very low, under 25%, on this sub indicator. These ten include a number of countries which score very well
on the other two sub indicators. Good practice is rare for this aspect of the life event. Malta scores 93%, followed
by Austria and Spain which score 75%. Many countries have much better scores on Transparency of service
delivery in other life events, indicating that good scores are not impossible but will require more effort
everywhere in Europe.
As cross border services are not applicable for Losing and finding a job, Cross Border Mobility is not measured for
this life event. The next paragraph will discuss the use of Key Enablers.
0
25
50
75
100
MT
ES IS AT
BE
DE FI EE
PT
NL
DK LT NO SE PL
FR IE
EU
28
+
LV CY SI TR IT LU UK
HR
RS
CH
HU CZ
EL
RO
BG SK
Public organisations Service delivery Personal data
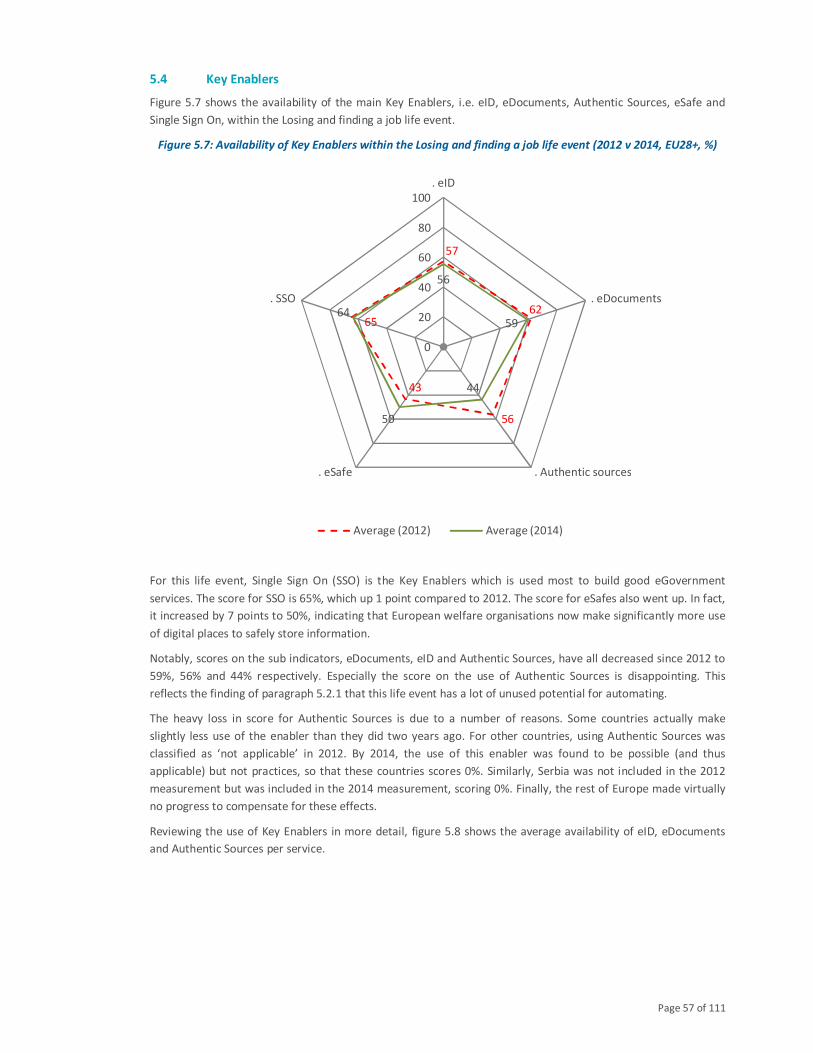
Page 57 of 111
5.4 Key Enablers
Figure 5.7 shows the availability of the main Key Enablers, i.e. eID, eDocuments, Authentic Sources, eSafe and
Single Sign On, within the Losing and finding a job life event.
Figure 5.7: Availability of Key Enablers within the Losing and finding a job life event (2012 v 2014, EU28+, %)
For this life event, Single Sign On (SSO) is the Key Enablers which is used most to build good eGovernment
services. The score for SSO is 65%, which up 1 point compared to 2012. The score for eSafes also went up. In fact,
it increased by 7 points to 50%, indicating that European welfare organisations now make significantly more use
of digital places to safely store information.
Notably, scores on the sub indicators, eDocuments, eID and Authentic Sources, have all decreased since 2012 to
59%, 56% and 44% respectively. Especially the score on the use of Authentic Sources is disappointing. This
reflects the finding of paragraph 5.2.1 that this life event has a lot of unused potential for automating.
The heavy loss in score for Authentic Sources is due to a number of reasons. Some countries actually make
slightly less use of the enabler than they did two years ago. For other countries, using Authentic Sources was
classified as ‘not applicable’ in 2012. By 2014, the use of this enabler was found to be possible (and thus
applicable) but not practices, so that these countries scores 0%. Similarly, Serbia was not included in the 2012
measurement but was included in the 2014 measurement, scoring 0%. Finally, the rest of Europe made virtually
no progress to compensate for these effects.
Reviewing the use of Key Enablers in more detail, figure 5.8 shows the average availability of eID, eDocuments
and Authentic Sources per service.
57
62
56
43
65
56
59
44
50
64
0
20
40
60
80
100
. eID
. eDocuments
. Authentic sources. eSafe
. SSO
Average (2012) Average (2014)
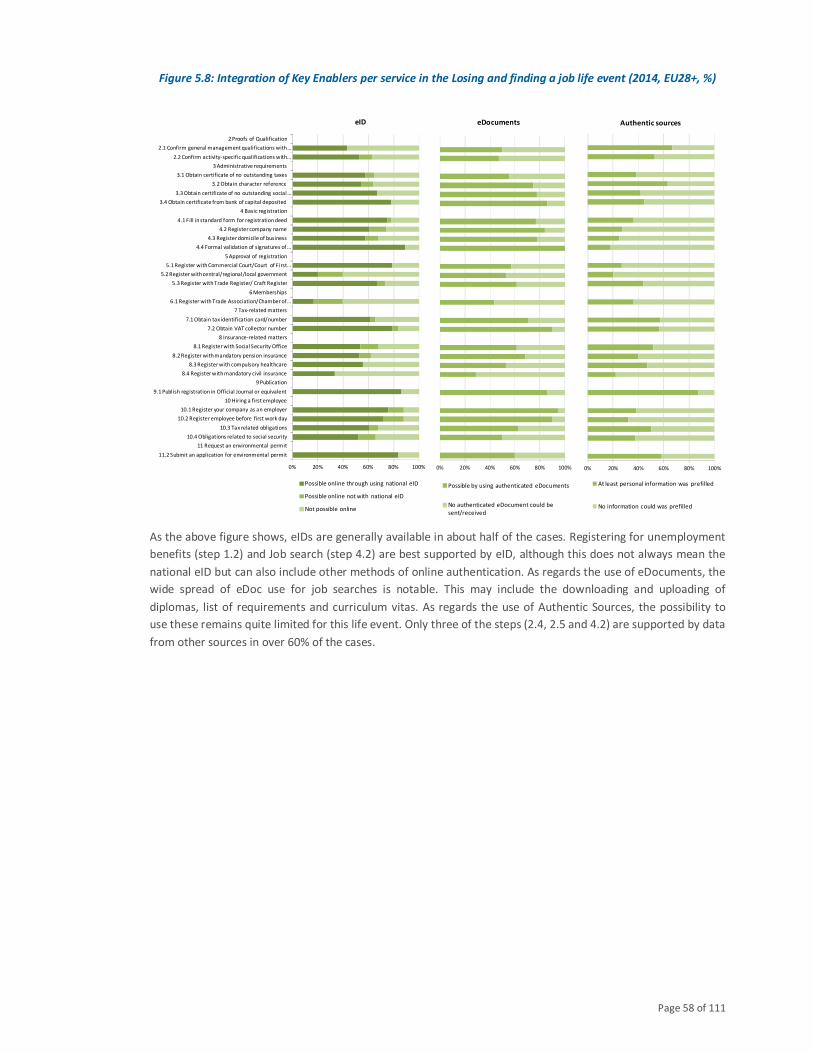
Page 58 of 111
Figure 5.8: Integration of Key Enablers per service in the Losing and finding a job life event (2014, EU28+, %)
As the above figure shows, eIDs are generally available in about half of the cases. Registering for unemployment
benefits (step 1.2) and Job search (step 4.2) are best supported by eID, although this does not always mean the
national eID but can also include other methods of online authentication. As regards the use of eDocuments, the
wide spread of eDoc use for job searches is notable. This may include the downloading and uploading of
diplomas, list of requirements and curriculum vitas. As regards the use of Authentic Sources, the possibility to
use these remains quite limited for this life event. Only three of the steps (2.4, 2.5 and 4.2) are supported by data
from other sources in over 60% of the cases.
0% 20% 40% 60% 80% 100%
11.2 Submit an application for environmental permit
11 Request an environmental permit
10.4 Obligations related to social security
10.3 Tax related obligations
10.2 Register employee before first work day
10.1 Register your company as an employer
10 Hiring a first employee
9.1 Publish registration in Official Journal or equivalent
9 Publication
8.4 Register with mandatory civil insurance
8.3 Register with compulsory healthcare
8.2 Register with mandatory pension insurance
8.1 Register with Social Security Office
8 Insurance-related matters
7.2 Obtain VAT collector number
7.1 Obtain tax identification card/number
7 Tax-related matters
6.1 Register with Trade Association/Chamber of …
6 Memberships
5.3 Register with Trade Register/ Craft Register
5.2 Register with central/regional/local government
5.1 Register with Commercial Court/Court of First …
5 Approval of registration
4.4 Formal validation of signatures of …
4.3 Register domicile of business
4.2 Register company name
4.1 Fill in standard form for registration deed
4 Basic registration
3.4 Obtain certificate from bank of capital deposited
3.3 Obtain certificate of no outstanding social …
3.2 Obtain character reference
3.1 Obtain certificate of no outstanding taxes
3 Administrative requirements
2.2 Confirm activity-specific qualifications with …
2.1 Confirm general management qualifications with …
2 Proofs of Qualification
eID
Possible online through using national eID
Possible online not with national eID
Not possible online
0% 20% 40% 60% 80% 100%
eDocuments
Possible by using authenticated eDocuments
No authenticated eDocument could be
sent/received
0% 20% 40% 60% 80% 100%
Authentic sources
At least personal information was prefilled
No information could was prefilled
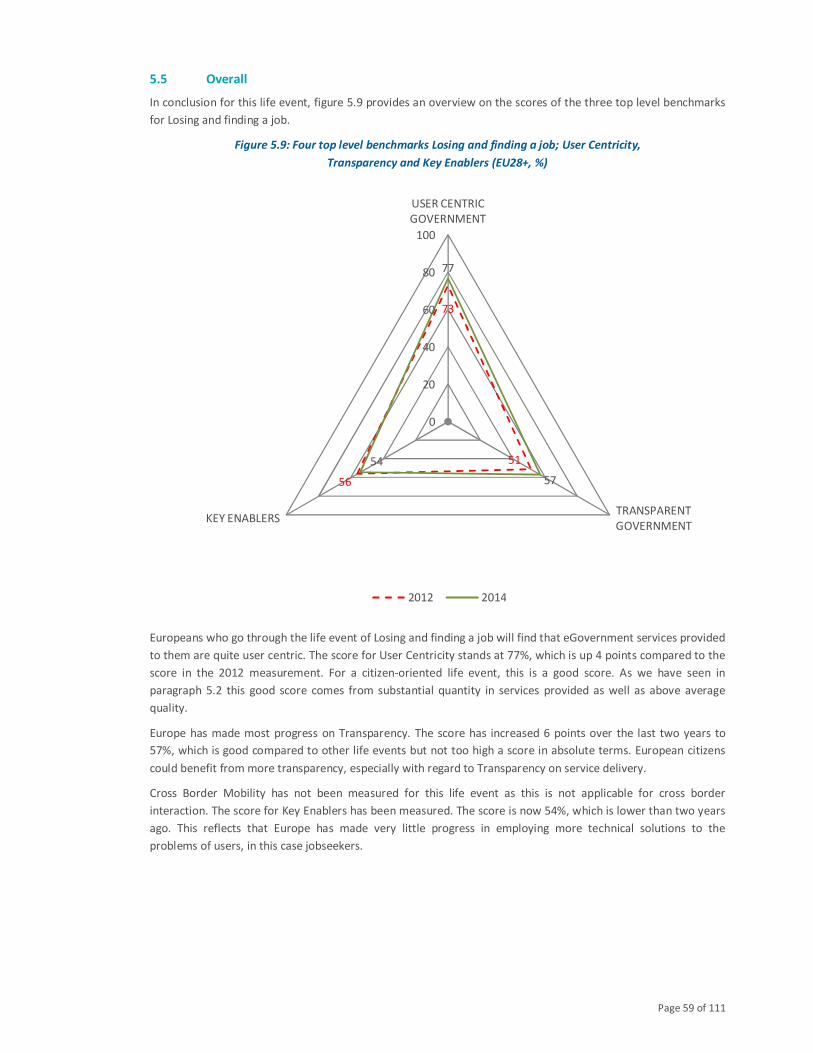
Page 59 of 111
5.5 Overall
In conclusion for this life event, figure 5.9 provides an overview on the scores of the three top level benchmarks
for Losing and finding a job.
Figure 5.9: Four top level benchmarks Losing and finding a job; User Centricity,
Transparency and Key Enablers (EU28+, %)
Europeans who go through the life event of Losing and finding a job will find that eGovernment services provided
to them are quite user centric. The score for User Centricity stands at 77%, which is up 4 points compared to the
score in the 2012 measurement. For a citizen-oriented life event, this is a good score. As we have seen in
paragraph 5.2 this good score comes from substantial quantity in services provided as well as above average
quality.
Europe has made most progress on Transparency. The score has increased 6 points over the last two years to
57%, which is good compared to other life events but not too high a score in absolute terms. European citizens
could benefit from more transparency, especially with regard to Transparency on service delivery.
Cross Border Mobility has not been measured for this life event as this is not applicable for cross border
interaction. The score for Key Enablers has been measured. The score is now 54%, which is lower than two years
ago. This reflects that Europe has made very little progress in employing more technical solutions to the
problems of users, in this case jobseekers.
73
51
56
77
57
54
0
20
40
60
80
100
USER CENTRIC
GOVERNMENT
TRANSPARENT
GOVERNMENTKEY ENABLERS
2012 2014
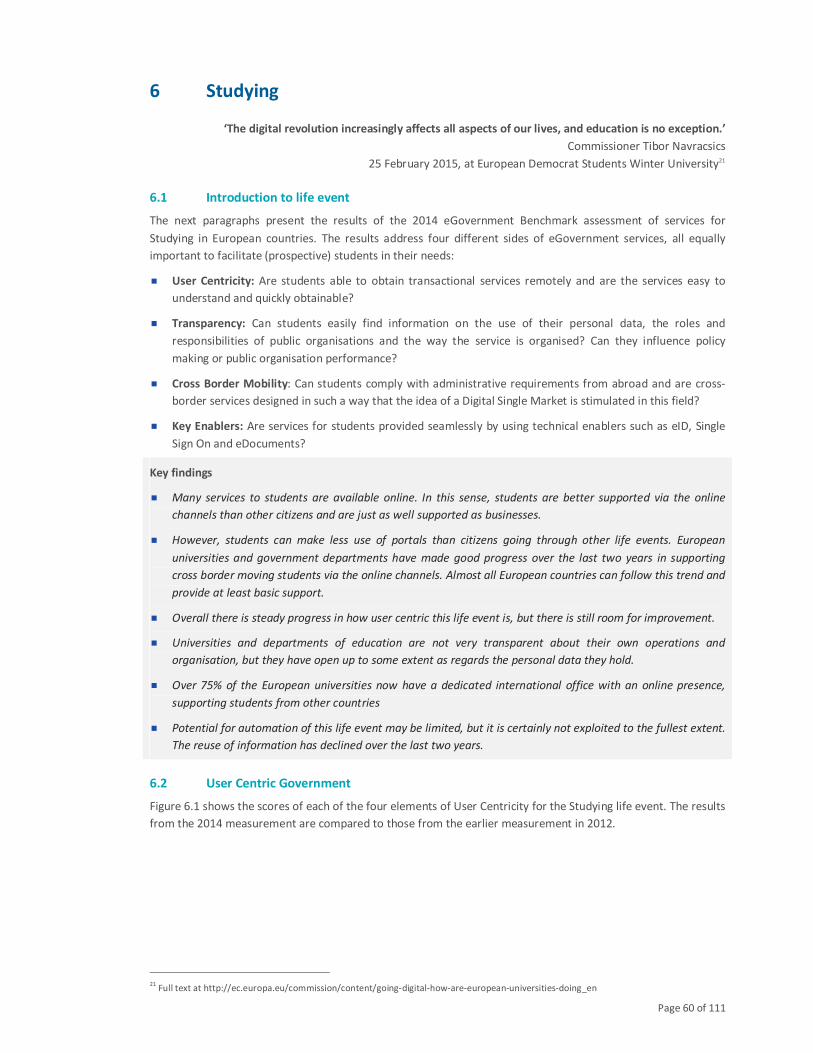
Page 60 of 111
6 Studying
‘The digital revolution increasingly affects all aspects of our lives, and education is no exception.’
Commissioner Tibor Navracsics
25 February 2015, at European Democrat Students Winter University21
6.1 Introduction to life event
The next paragraphs present the results of the 2014 eGovernment Benchmark assessment of services for
Studying in European countries. The results address four different sides of eGovernment services, all equally
important to facilitate (prospective) students in their needs:
� User Centricity: Are students able to obtain transactional services remotely and are the services easy to
understand and quickly obtainable?
� Transparency: Can students easily find information on the use of their personal data, the roles and
responsibilities of public organisations and the way the service is organised? Can they influence policy
making or public organisation performance?
� Cross Border Mobility: Can students comply with administrative requirements from abroad and are cross-
border services designed in such a way that the idea of a Digital Single Market is stimulated in this field?
� Key Enablers: Are services for students provided seamlessly by using technical enablers such as eID, Single
Sign On and eDocuments?
Key findings
� Many services to students are available online. In this sense, students are better supported via the online
channels than other citizens and are just as well supported as businesses.
� However, students can make less use of portals than citizens going through other life events. European
universities and government departments have made good progress over the last two years in supporting
cross border moving students via the online channels. Almost all European countries can follow this trend and
provide at least basic support.
� Overall there is steady progress in how user centric this life event is, but there is still room for improvement.
� Universities and departments of education are not very transparent about their own operations and
organisation, but they have open up to some extent as regards the personal data they hold.
� Over 75% of the European universities now have a dedicated international office with an online presence,
supporting students from other countries
� Potential for automation of this life event may be limited, but it is certainly not exploited to the fullest extent.
The reuse of information has declined over the last two years.
6.2 User Centric Government
Figure 6.1 shows the scores of each of the four elements of User Centricity for the Studying life event. The results
from the 2014 measurement are compared to those from the earlier measurement in 2012.
21
Full text at http://ec.europa.eu/commission/content/going-digital-how-are-european-universities-doing_en
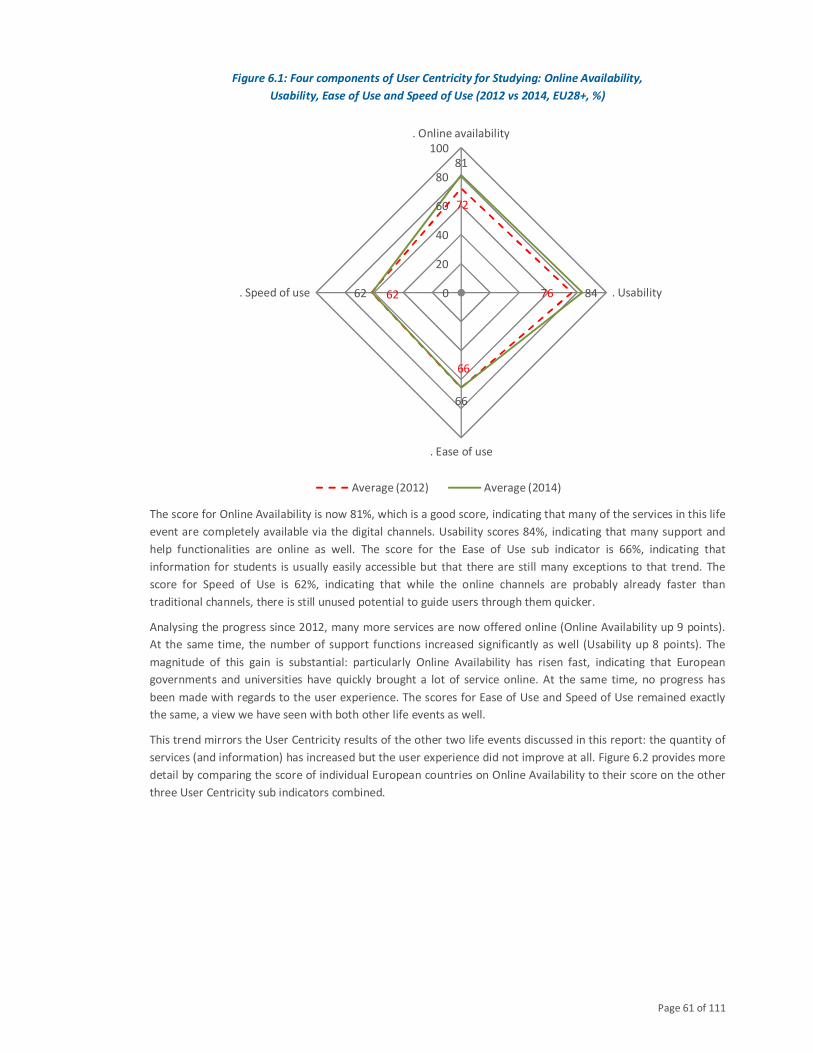
Page 61 of 111
Figure 6.1: Four components of User Centricity for Studying: Online Availability,
Usability, Ease of Use and Speed of Use (2012 vs 2014, EU28+, %)
The score for Online Availability is now 81%, which is a good score, indicating that many of the services in this life
event are completely available via the digital channels. Usability scores 84%, indicating that many support and
help functionalities are online as well. The score for the Ease of Use sub indicator is 66%, indicating that
information for students is usually easily accessible but that there are still many exceptions to that trend. The
score for Speed of Use is 62%, indicating that while the online channels are probably already faster than
traditional channels, there is still unused potential to guide users through them quicker.
Analysing the progress since 2012, many more services are now offered online (Online Availability up 9 points).
At the same time, the number of support functions increased significantly as well (Usability up 8 points). The
magnitude of this gain is substantial: particularly Online Availability has risen fast, indicating that European
governments and universities have quickly brought a lot of service online. At the same time, no progress has
been made with regards to the user experience. The scores for Ease of Use and Speed of Use remained exactly
the same, a view we have seen with both other life events as well.
This trend mirrors the User Centricity results of the other two life events discussed in this report: the quantity of
services (and information) has increased but the user experience did not improve at all. Figure 6.2 provides more
detail by comparing the score of individual European countries on Online Availability to their score on the other
three User Centricity sub indicators combined.
72
76
66
62
81
84
66
62 0
20
40
60
80
100
. Online availability
. Usability
. Ease of use
. Speed of use
Average (2012) Average (2014)
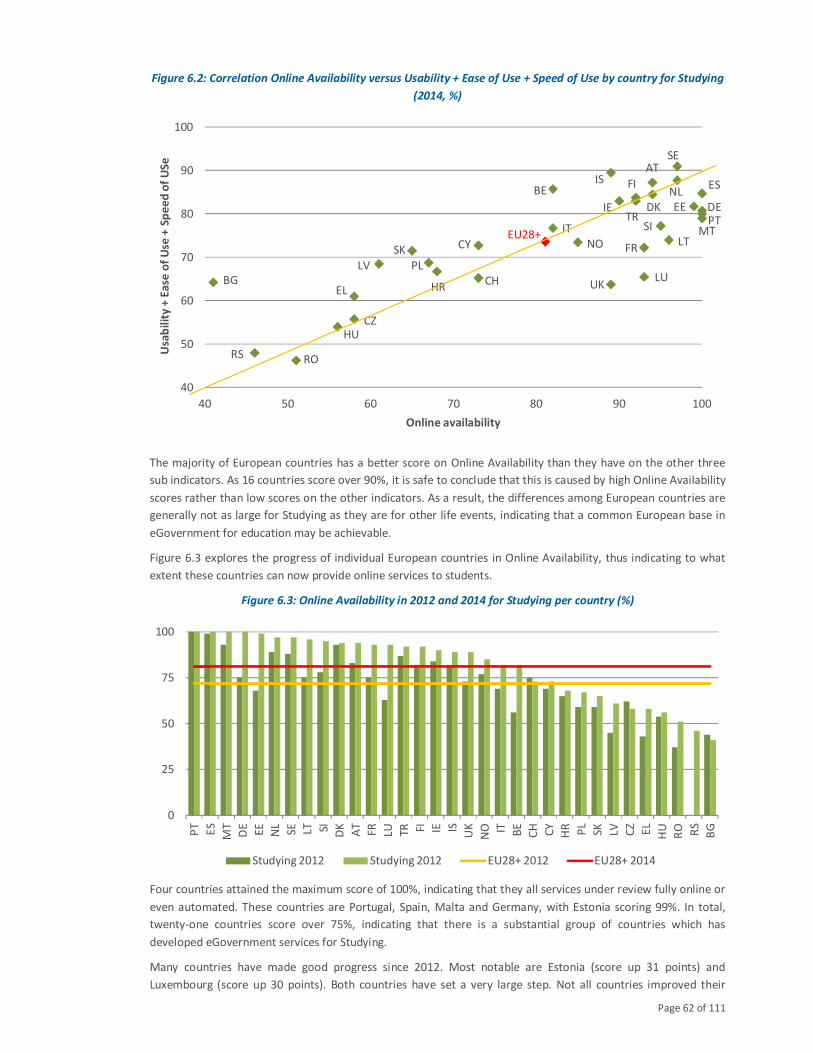
Page 62 of 111
Figure 6.2: Correlation Online Availability versus Usability + Ease of Use + Speed of Use by country for Studying
(2014, %)
The majority of European countries has a better score on Online Availability than they have on the other three
sub indicators. As 16 countries score over 90%, it is safe to conclude that this is caused by high Online Availability
scores rather than low scores on the other indicators. As a result, the differences among European countries are
generally not as large for Studying as they are for other life events, indicating that a common European base in
eGovernment for education may be achievable.
Figure 6.3 explores the progress of individual European countries in Online Availability, thus indicating to what
extent these countries can now provide online services to students.
Figure 6.3: Online Availability in 2012 and 2014 for Studying per country (%)
Four countries attained the maximum score of 100%, indicating that they all services under review fully online or
even automated. These countries are Portugal, Spain, Malta and Germany, with Estonia scoring 99%. In total,
twenty-one countries score over 75%, indicating that there is a substantial group of countries which has
developed eGovernment services for Studying.
Many countries have made good progress since 2012. Most notable are Estonia (score up 31 points) and
Luxembourg (score up 30 points). Both countries have set a very large step. Not all countries improved their
AT
BE
BG CH
CY
CZ
DEDK EE
EL
ESFI
FR
HR
HU
IE
IS
ITLT
LULV
MT
NL
NO
PL
PT
RORS
SE
SI
SK
TR
UK
EU28+
40
50
60
70
80
90
100
40 50 60 70 80 90 100
Usa
bil
ity
+ E
ase
of
Use
+ S
pe
ed
of
US
e
Online availability
0
25
50
75
100
PT
ES
MT
DE
EE
NL
SE LT SI DK
AT
FR
LU TR FI IE IS
UK
NO IT BE
CH CY
HR PL
SK LV CZ
EL
HU
RO RS
BG
Studying 2012 Studying 2012 EU28+ 2012 EU28+ 2014
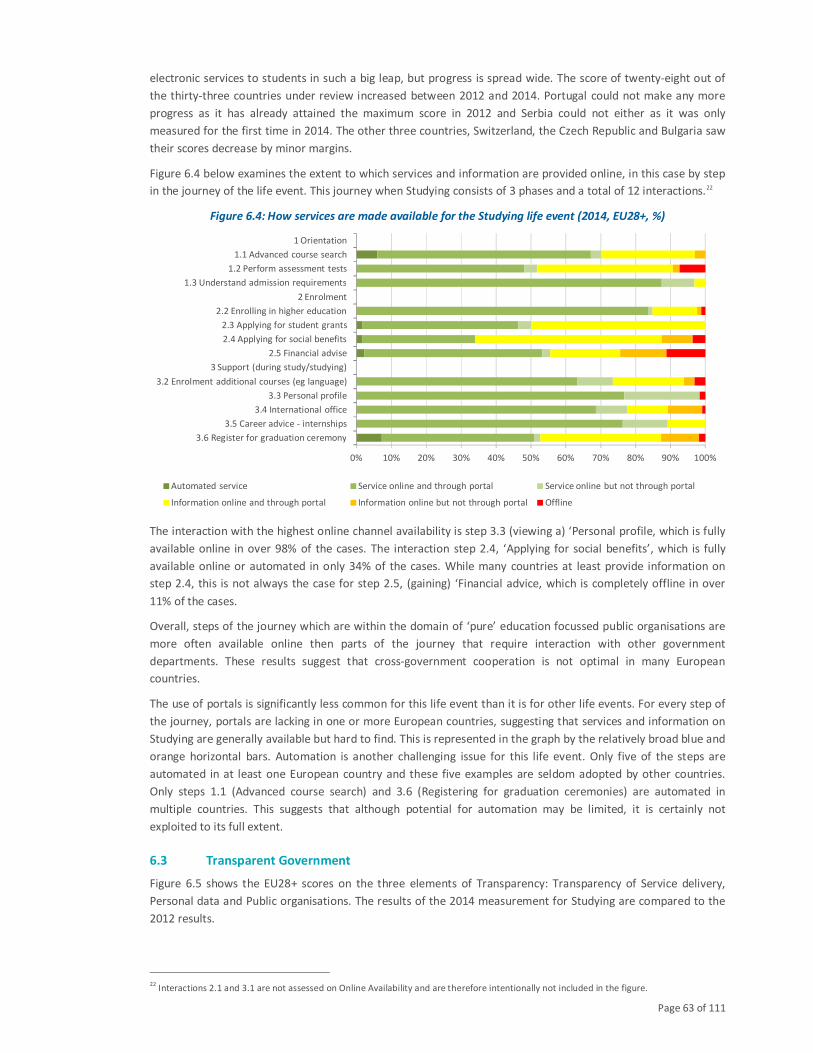
Page 63 of 111
electronic services to students in such a big leap, but progress is spread wide. The score of twenty-eight out of
the thirty-three countries under review increased between 2012 and 2014. Portugal could not make any more
progress as it has already attained the maximum score in 2012 and Serbia could not either as it was only
measured for the first time in 2014. The other three countries, Switzerland, the Czech Republic and Bulgaria saw
their scores decrease by minor margins.
Figure 6.4 below examines the extent to which services and information are provided online, in this case by step
in the journey of the life event. This journey when Studying consists of 3 phases and a total of 12 interactions.22
Figure 6.4: How services are made available for the Studying life event (2014, EU28+, %)
The interaction with the highest online channel availability is step 3.3 (viewing a) ‘Personal profile, which is fully
available online in over 98% of the cases. The interaction step 2.4, ‘Applying for social benefits’, which is fully
available online or automated in only 34% of the cases. While many countries at least provide information on
step 2.4, this is not always the case for step 2.5, (gaining) ‘Financial advice, which is completely offline in over
11% of the cases.
Overall, steps of the journey which are within the domain of ‘pure’ education focussed public organisations are
more often available online then parts of the journey that require interaction with other government
departments. These results suggest that cross-government cooperation is not optimal in many European
countries.
The use of portals is significantly less common for this life event than it is for other life events. For every step of
the journey, portals are lacking in one or more European countries, suggesting that services and information on
Studying are generally available but hard to find. This is represented in the graph by the relatively broad blue and
orange horizontal bars. Automation is another challenging issue for this life event. Only five of the steps are
automated in at least one European country and these five examples are seldom adopted by other countries.
Only steps 1.1 (Advanced course search) and 3.6 (Registering for graduation ceremonies) are automated in
multiple countries. This suggests that although potential for automation may be limited, it is certainly not
exploited to its full extent.
6.3 Transparent Government
Figure 6.5 shows the EU28+ scores on the three elements of Transparency: Transparency of Service delivery,
Personal data and Public organisations. The results of the 2014 measurement for Studying are compared to the
2012 results.
22
Interactions 2.1 and 3.1 are not assessed on Online Availability and are therefore intentionally not included in the figure.
0% 10% 20% 30% 40% 50% 60% 70% 80% 90% 100%
3.6 Register for graduation ceremony
3.5 Career advice - internships
3.4 International office
3.3 Personal profile
3.2 Enrolment additional courses (eg language)
3 Support (during study/studying)
2.5 Financial advise
2.4 Applying for social benefits
2.3 Applying for student grants
2.2 Enrolling in higher education
2 Enrolment
1.3 Understand admission requirements
1.2 Perform assessment tests
1.1 Advanced course search
1 Orientation
Automated service Service online and through portal Service online but not through portal
Information online and through portal Information online but not through portal Offline
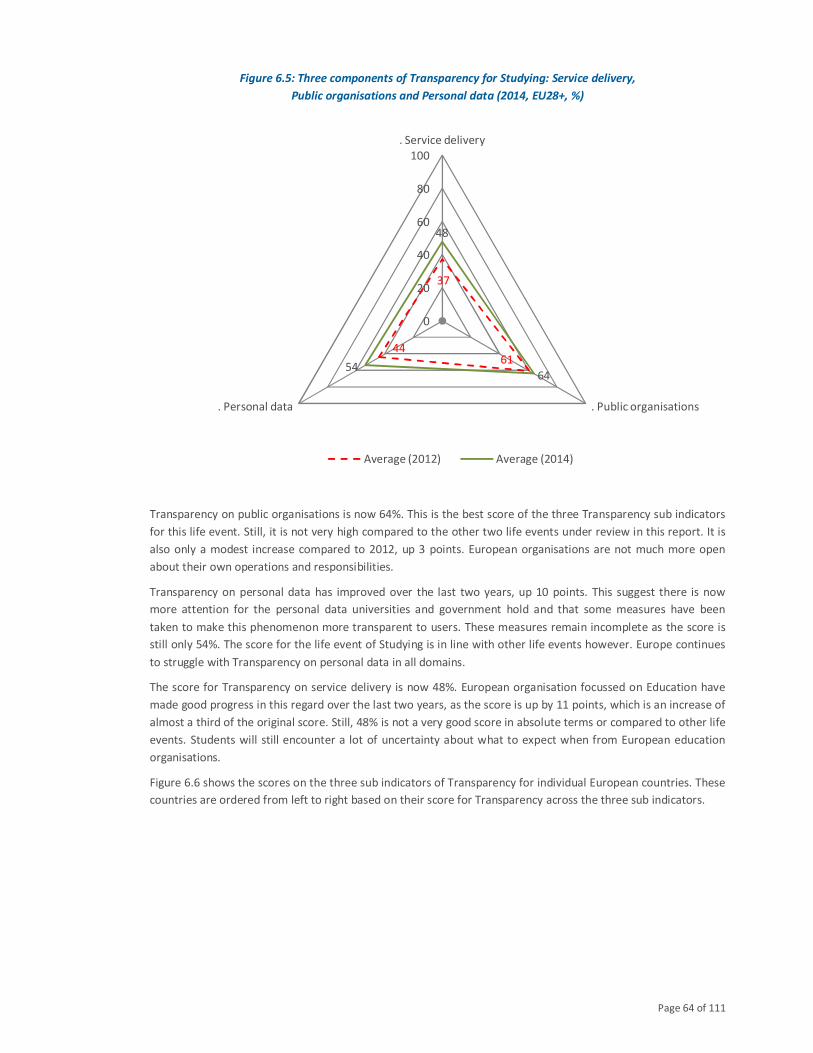
Page 64 of 111
Figure 6.5: Three components of Transparency for Studying: Service delivery,
Public organisations and Personal data (2014, EU28+, %)
Transparency on public organisations is now 64%. This is the best score of the three Transparency sub indicators
for this life event. Still, it is not very high compared to the other two life events under review in this report. It is
also only a modest increase compared to 2012, up 3 points. European organisations are not much more open
about their own operations and responsibilities.
Transparency on personal data has improved over the last two years, up 10 points. This suggest there is now
more attention for the personal data universities and government hold and that some measures have been
taken to make this phenomenon more transparent to users. These measures remain incomplete as the score is
still only 54%. The score for the life event of Studying is in line with other life events however. Europe continues
to struggle with Transparency on personal data in all domains.
The score for Transparency on service delivery is now 48%. European organisation focussed on Education have
made good progress in this regard over the last two years, as the score is up by 11 points, which is an increase of
almost a third of the original score. Still, 48% is not a very good score in absolute terms or compared to other life
events. Students will still encounter a lot of uncertainty about what to expect when from European education
organisations.
Figure 6.6 shows the scores on the three sub indicators of Transparency for individual European countries. These
countries are ordered from left to right based on their score for Transparency across the three sub indicators.
37
6144
48
6454
0
20
40
60
80
100
. Service delivery
. Public organisations. Personal data
Average (2012) Average (2014)
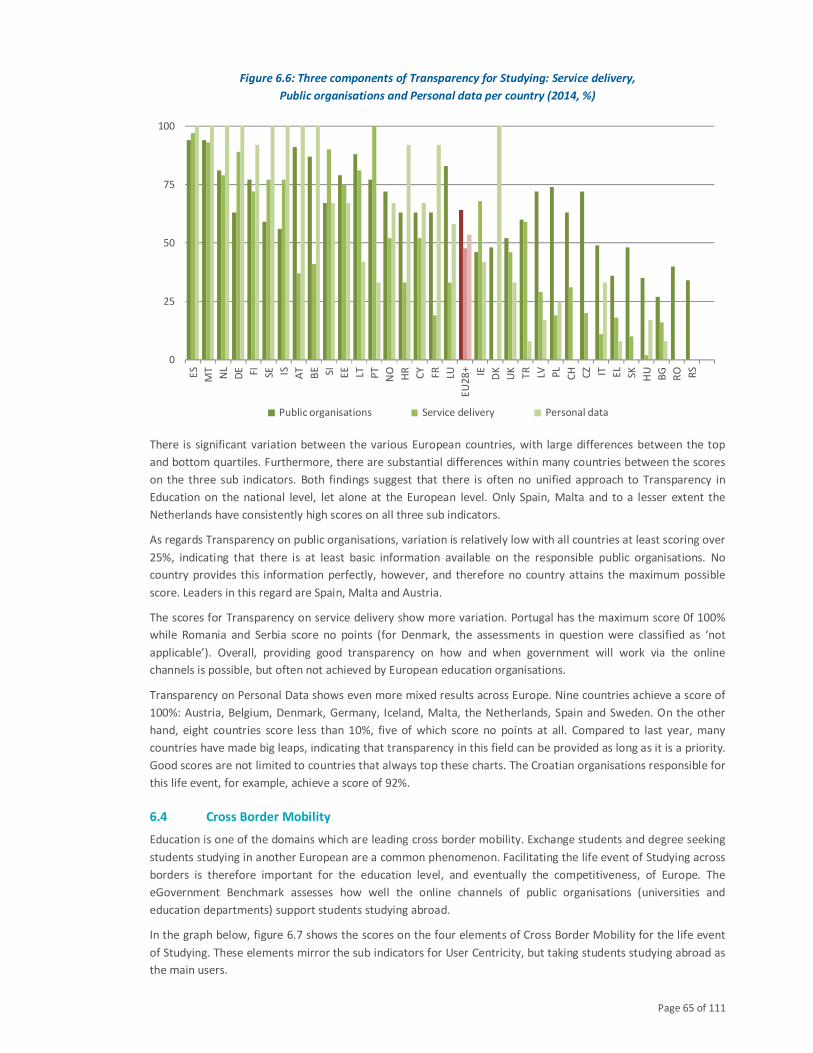
Page 65 of 111
Figure 6.6: Three components of Transparency for Studying: Service delivery,
Public organisations and Personal data per country (2014, %)
There is significant variation between the various European countries, with large differences between the top
and bottom quartiles. Furthermore, there are substantial differences within many countries between the scores
on the three sub indicators. Both findings suggest that there is often no unified approach to Transparency in
Education on the national level, let alone at the European level. Only Spain, Malta and to a lesser extent the
Netherlands have consistently high scores on all three sub indicators.
As regards Transparency on public organisations, variation is relatively low with all countries at least scoring over
25%, indicating that there is at least basic information available on the responsible public organisations. No
country provides this information perfectly, however, and therefore no country attains the maximum possible
score. Leaders in this regard are Spain, Malta and Austria.
The scores for Transparency on service delivery show more variation. Portugal has the maximum score 0f 100%
while Romania and Serbia score no points (for Denmark, the assessments in question were classified as ‘not
applicable’). Overall, providing good transparency on how and when government will work via the online
channels is possible, but often not achieved by European education organisations.
Transparency on Personal Data shows even more mixed results across Europe. Nine countries achieve a score of
100%: Austria, Belgium, Denmark, Germany, Iceland, Malta, the Netherlands, Spain and Sweden. On the other
hand, eight countries score less than 10%, five of which score no points at all. Compared to last year, many
countries have made big leaps, indicating that transparency in this field can be provided as long as it is a priority.
Good scores are not limited to countries that always top these charts. The Croatian organisations responsible for
this life event, for example, achieve a score of 92%.
6.4 Cross Border Mobility
Education is one of the domains which are leading cross border mobility. Exchange students and degree seeking
students studying in another European are a common phenomenon. Facilitating the life event of Studying across
borders is therefore important for the education level, and eventually the competitiveness, of Europe. The
eGovernment Benchmark assesses how well the online channels of public organisations (universities and
education departments) support students studying abroad.
In the graph below, figure 6.7 shows the scores on the four elements of Cross Border Mobility for the life event
of Studying. These elements mirror the sub indicators for User Centricity, but taking students studying abroad as
the main users.
0
25
50
75
100
ES
MT
NL
DE FI SE IS AT
BE SI EE
LT PT
NO
HR
CY
FR LU
EU
28
+ IE DK
UK
TR
LV PL
CH CZ IT EL
SK HU
BG
RO RS
Public organisations Service delivery Personal data
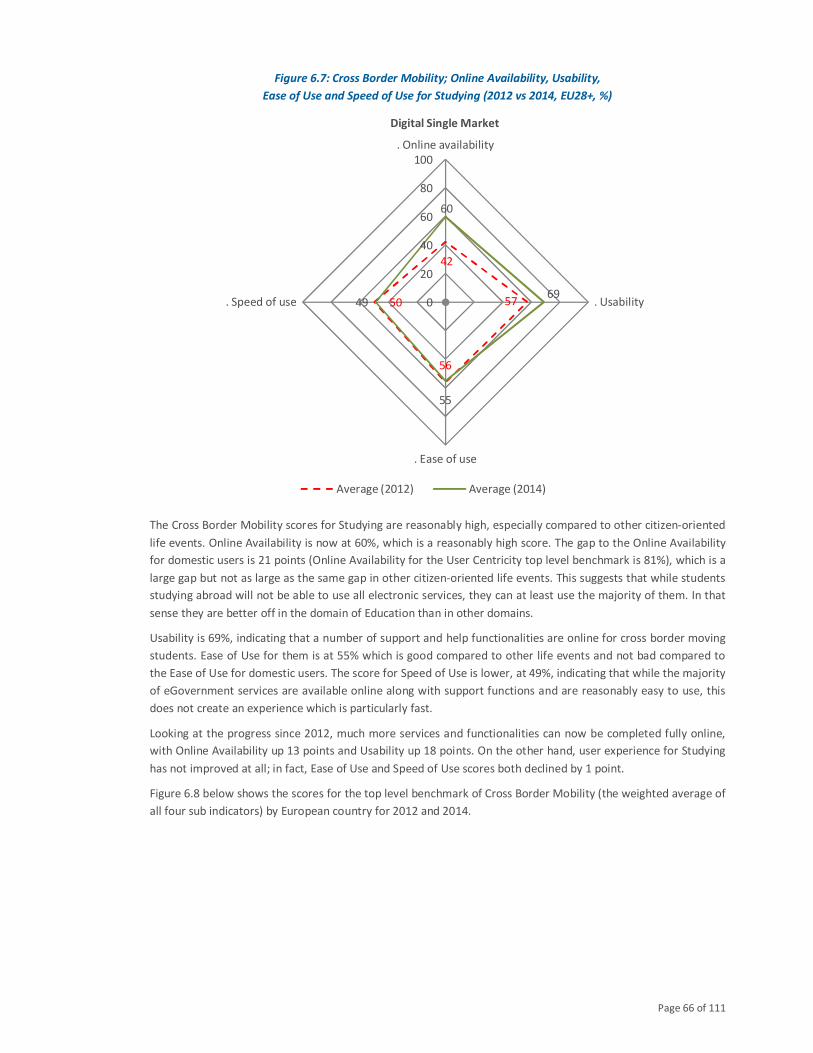
Page 66 of 111
Figure 6.7: Cross Border Mobility; Online Availability, Usability,
Ease of Use and Speed of Use for Studying (2012 vs 2014, EU28+, %)
The Cross Border Mobility scores for Studying are reasonably high, especially compared to other citizen-oriented
life events. Online Availability is now at 60%, which is a reasonably high score. The gap to the Online Availability
for domestic users is 21 points (Online Availability for the User Centricity top level benchmark is 81%), which is a
large gap but not as large as the same gap in other citizen-oriented life events. This suggests that while students
studying abroad will not be able to use all electronic services, they can at least use the majority of them. In that
sense they are better off in the domain of Education than in other domains.
Usability is 69%, indicating that a number of support and help functionalities are online for cross border moving
students. Ease of Use for them is at 55% which is good compared to other life events and not bad compared to
the Ease of Use for domestic users. The score for Speed of Use is lower, at 49%, indicating that while the majority
of eGovernment services are available online along with support functions and are reasonably easy to use, this
does not create an experience which is particularly fast.
Looking at the progress since 2012, much more services and functionalities can now be completed fully online,
with Online Availability up 13 points and Usability up 18 points. On the other hand, user experience for Studying
has not improved at all; in fact, Ease of Use and Speed of Use scores both declined by 1 point.
Figure 6.8 below shows the scores for the top level benchmark of Cross Border Mobility (the weighted average of
all four sub indicators) by European country for 2012 and 2014.
42
57
56
50
60
69
55
49 0
20
40
60
80
100
. Online availability
. Usability
. Ease of use
. Speed of use
Digital Single Market
Average (2012) Average (2014)
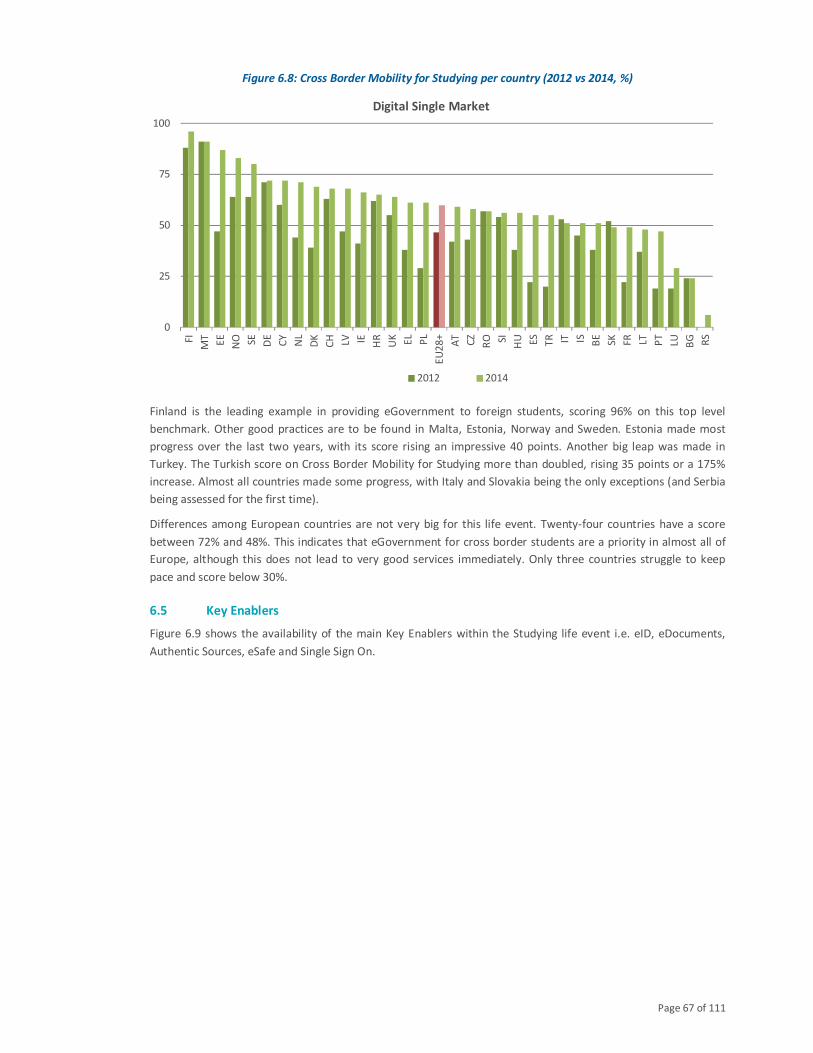
Page 67 of 111
Figure 6.8: Cross Border Mobility for Studying per country (2012 vs 2014, %)
Finland is the leading example in providing eGovernment to foreign students, scoring 96% on this top level
benchmark. Other good practices are to be found in Malta, Estonia, Norway and Sweden. Estonia made most
progress over the last two years, with its score rising an impressive 40 points. Another big leap was made in
Turkey. The Turkish score on Cross Border Mobility for Studying more than doubled, rising 35 points or a 175%
increase. Almost all countries made some progress, with Italy and Slovakia being the only exceptions (and Serbia
being assessed for the first time).
Differences among European countries are not very big for this life event. Twenty-four countries have a score
between 72% and 48%. This indicates that eGovernment for cross border students are a priority in almost all of
Europe, although this does not lead to very good services immediately. Only three countries struggle to keep
pace and score below 30%.
6.5 Key Enablers
Figure 6.9 shows the availability of the main Key Enablers within the Studying life event i.e. eID, eDocuments,
Authentic Sources, eSafe and Single Sign On.
0
25
50
75
100
FI
MT
EE
NO SE DE
CY
NL
DK
CH LV IE HR
UK EL
PL
EU
28
+
AT
CZ
RO SI
HU ES
TR IT IS BE
SK FR LT PT
LU BG RS
Digital Single Market
2012 2014
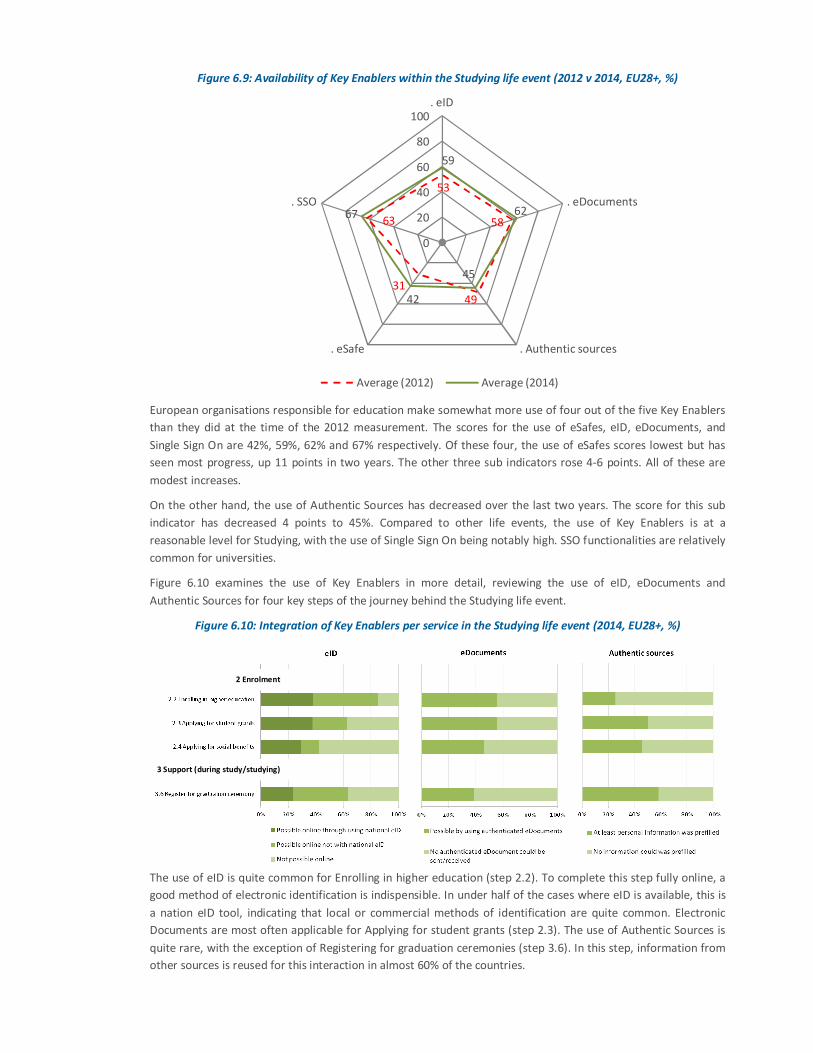
Figure 6.9: Availability of Key Enablers within the Studying life event (2012 v 2014, EU28+, %)
European organisations responsible for education make somewhat more use of four out of the five Key Enablers
than they did at the time of the 2012 measurement. The scores for the use of eSafes, eID, eDocuments, and
Single Sign On are 42%, 59%, 62% and 67% respectively. Of these four, the use of eSafes scores lowest but has
seen most progress, up 11 points in two years. The other three sub indicators rose 4-6 points. All of these are
modest increases.
On the other hand, the use of Authentic Sources has decreased over the last two years. The score for this sub
indicator has decreased 4 points to 45%. Compared to other life events, the use of Key Enablers is at a
reasonable level for Studying, with the use of Single Sign On being notably high. SSO functionalities are relatively
common for universities.
Figure 6.10 examines the use of Key Enablers in more detail, reviewing the use of eID, eDocuments and
Authentic Sources for four key steps of the journey behind the Studying life event.
Figure 6.10: Integration of Key Enablers per service in the Studying life event (2014, EU28+, %)
The use of eID is quite common for Enrolling in higher education (step 2.2). To complete this step fully online, a
good method of electronic identification is indispensible. In under half of the cases where eID is available, this is
a nation eID tool, indicating that local or commercial methods of identification are quite common. Electronic
Documents are most often applicable for Applying for student grants (step 2.3). The use of Authentic Sources is
quite rare, with the exception of Registering for graduation ceremonies (step 3.6). In this step, information from
other sources is reused for this interaction in almost 60% of the countries.
53
58
4931
63
59
62
45
42
67
0
20
40
60
80
100. eID
. eDocuments
. Authentic sources. eSafe
. SSO
Average (2012) Average (2014)
2 Enrolment
3 Support (during study/studying)
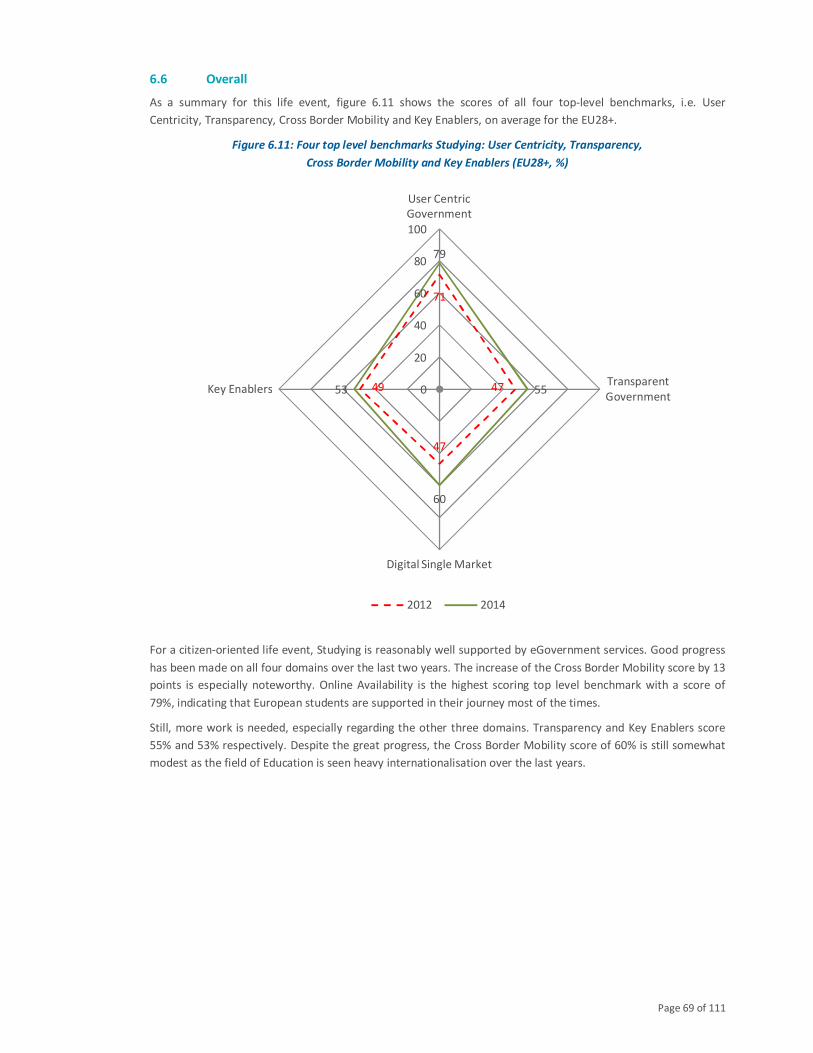
Page 69 of 111
6.6 Overall
As a summary for this life event, figure 6.11 shows the scores of all four top-level benchmarks, i.e. User
Centricity, Transparency, Cross Border Mobility and Key Enablers, on average for the EU28+.
Figure 6.11: Four top level benchmarks Studying: User Centricity, Transparency,
Cross Border Mobility and Key Enablers (EU28+, %)
For a citizen-oriented life event, Studying is reasonably well supported by eGovernment services. Good progress
has been made on all four domains over the last two years. The increase of the Cross Border Mobility score by 13
points is especially noteworthy. Online Availability is the highest scoring top level benchmark with a score of
79%, indicating that European students are supported in their journey most of the times.
Still, more work is needed, especially regarding the other three domains. Transparency and Key Enablers score
55% and 53% respectively. Despite the great progress, the Cross Border Mobility score of 60% is still somewhat
modest as the field of Education is seen heavy internationalisation over the last years.
71
47
47
49
79
55
60
53 0
20
40
60
80
100
User Centric
Government
Transparent
Government
Digital Single Market
Key Enablers
2012 2014
Page 70 of 111
7 Clustering of countries to drive learning
‘Better regulation means efficient rules, minimum burdens for business and consumers, effective competition
and high-quality services across pan-European markets.’
Vice President Andrus Ansip
26 November 2014, in the European Parliament plenary session23
The European eGovernment Benchmark has evaluated online service evolution since 2001, at first by measuring
basic service availability and sophistication. For over a decade it has supported policy makers, provoked valuable
discussions, set new ambitions, and identified countries to learn from. A sustainable eGovernment should
produce efficiency. Hence, innovation polices objectives should take into account not only the diffusion of online
services and the citizen eGovernment usage, but also, for example, the degree of digalitisation of the back office,
as a proxy of a Country ability to manage eGovernment projects in order to improve public administration
efficiency and effectiveness through the correct use of ICT. Hence, new eGovernment performance indicators
should be taken into consideration.
Moreover, despite investments and efforts in eGovernment, the results obtained by some countries do not seem
to improve strongly over time and the use of eGovernment still remains at a low level. What are the factors that
hinder the innovation actions? How can the characteristics of a country in terms of educational level of the
population, different level centralisation of the government organisation, availability of adequate ICT
infrastructures, etc influence the eGovernment performances and, hence, an eGovernment strategy?
Even if the strategic objectives remain the same, the operational objectives (and hence the actions to be taken in
order to achieve them) can differ from country to country. Therefore, in order to define the specific
eGovernment policies and strategies that a country should implement, it is important to understand:
� The impact of a specific context on eGovernment maturity performances;
� The contextual differences of countries with similar performances;
� The differences between countries with similar context but reaching different performances.
To understand these three factors, this year’s eGovernment benchmarking report presents a new element that
could provide the basis for future developments: a country clustering exercise based on a two-step analysis.
7.1 A new explorative framework: Two-step analysis
The new element covers 30 out of the 33 countries that participate in the eGovernment Benchmark. Serbia,
Switzerland and Turkey cannot be included yet as too much data on these countries is missing in the various
datasets. All other countries are analysed in two steps.
7.1.1 Step 1: Absolute indicators
The first step of the analysis is to assess and to compare the eGovernment through new performance indicators
able to measure a country’s maturity, in terms of the ability of the Public administration to manage innovation,
to improve efficiency and effectiveness through processes’ digitisation, while maximising the advantages for its
users.
In the first step, eGovernment maturity is assessed through four dimensions, so-called absolute indicators. Figure
7.1 presents the relationship between the eGovernment Action Plan policy priority areas and the absolute
indicators.
23 Full text at http://europa.eu/rapid/press-release_SPEECH-14-2182_en.htm
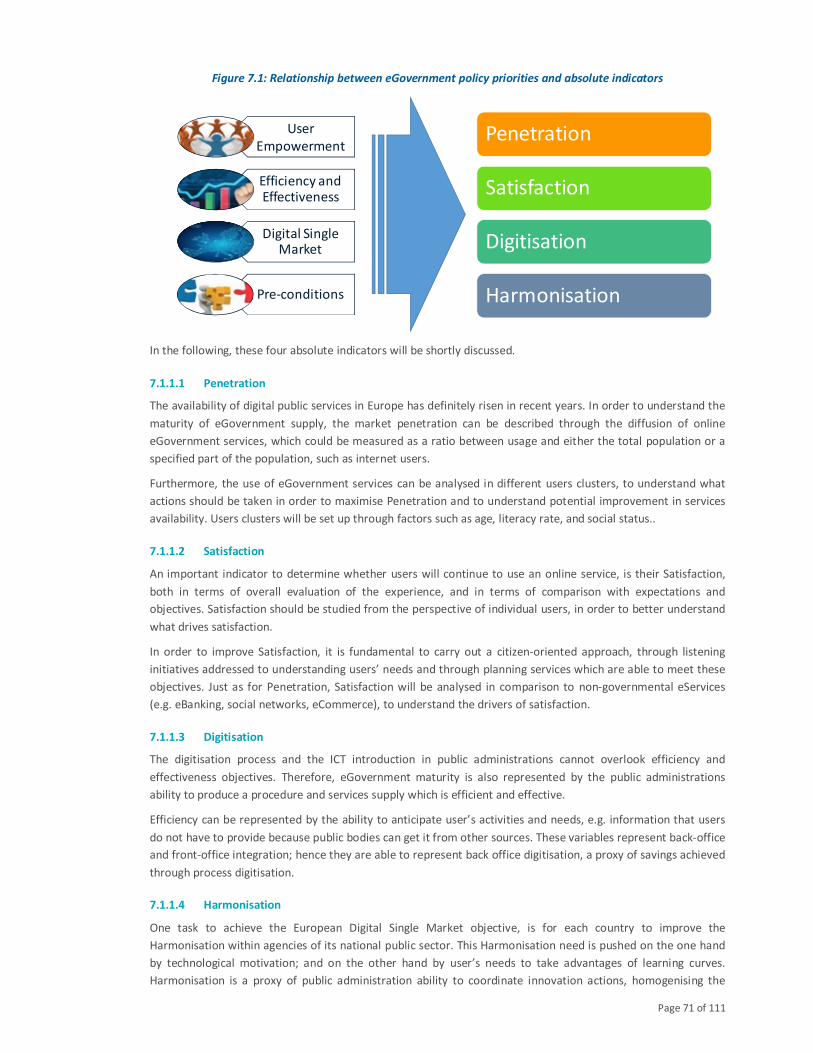
Page 71 of 111
Figure 7.1: Relationship between eGovernment policy priorities and absolute indicators
In the following, these four absolute indicators will be shortly discussed.
7.1.1.1 Penetration
The availability of digital public services in Europe has definitely risen in recent years. In order to understand the
maturity of eGovernment supply, the market penetration can be described through the diffusion of online
eGovernment services, which could be measured as a ratio between usage and either the total population or a
specified part of the population, such as internet users.
Furthermore, the use of eGovernment services can be analysed in different users clusters, to understand what
actions should be taken in order to maximise Penetration and to understand potential improvement in services
availability. Users clusters will be set up through factors such as age, literacy rate, and social status..
7.1.1.2 Satisfaction
An important indicator to determine whether users will continue to use an online service, is their Satisfaction,
both in terms of overall evaluation of the experience, and in terms of comparison with expectations and
objectives. Satisfaction should be studied from the perspective of individual users, in order to better understand
what drives satisfaction.
In order to improve Satisfaction, it is fundamental to carry out a citizen-oriented approach, through listening
initiatives addressed to understanding users’ needs and through planning services which are able to meet these
objectives. Just as for Penetration, Satisfaction will be analysed in comparison to non-governmental eServices
(e.g. eBanking, social networks, eCommerce), to understand the drivers of satisfaction.
7.1.1.3 Digitisation
The digitisation process and the ICT introduction in public administrations cannot overlook efficiency and
effectiveness objectives. Therefore, eGovernment maturity is also represented by the public administrations
ability to produce a procedure and services supply which is efficient and effective.
Efficiency can be represented by the ability to anticipate user’s activities and needs, e.g. information that users
do not have to provide because public bodies can get it from other sources. These variables represent back-office
and front-office integration; hence they are able to represent back office digitisation, a proxy of savings achieved
through process digitisation.
7.1.1.4 Harmonisation
One task to achieve the European Digital Single Market objective, is for each country to improve the
Harmonisation within agencies of its national public sector. This Harmonisation need is pushed on the one hand
by technological motivation; and on the other hand by user’s needs to take advantages of learning curves.
Harmonisation is a proxy of public administration ability to coordinate innovation actions, homogenising the
User
Empowerment
Efficiency and Effectiveness
Digital Single Market
Pre-conditions
Penetration
Satisfaction
Digitisation
Harmonisation
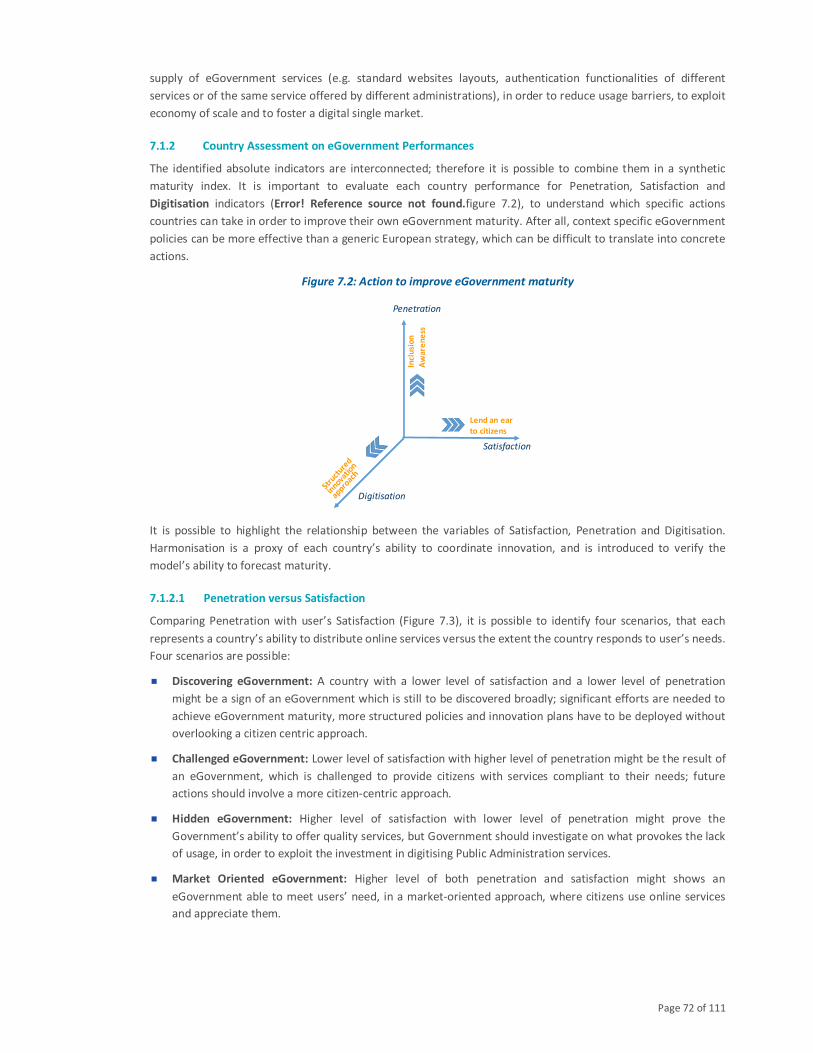
Page 72 of 111
supply of eGovernment services (e.g. standard websites layouts, authentication functionalities of different
services or of the same service offered by different administrations), in order to reduce usage barriers, to exploit
economy of scale and to foster a digital single market.
7.1.2 Country Assessment on eGovernment Performances
The identified absolute indicators are interconnected; therefore it is possible to combine them in a synthetic
maturity index. It is important to evaluate each country performance for Penetration, Satisfaction and
Digitisation indicators (Error! Reference source not found.figure 7.2), to understand which specific actions
countries can take in order to improve their own eGovernment maturity. After all, context specific eGovernment
policies can be more effective than a generic European strategy, which can be difficult to translate into concrete
actions.
Figure 7.2: Action to improve eGovernment maturity
It is possible to highlight the relationship between the variables of Satisfaction, Penetration and Digitisation.
Harmonisation is a proxy of each country’s ability to coordinate innovation, and is introduced to verify the
model’s ability to forecast maturity.
7.1.2.1 Penetration versus Satisfaction
Comparing Penetration with user’s Satisfaction (Figure 7.3), it is possible to identify four scenarios, that each
represents a country’s ability to distribute online services versus the extent the country responds to user’s needs.
Four scenarios are possible:
� Discovering eGovernment: A country with a lower level of satisfaction and a lower level of penetration
might be a sign of an eGovernment which is still to be discovered broadly; significant efforts are needed to
achieve eGovernment maturity, more structured policies and innovation plans have to be deployed without
overlooking a citizen centric approach.
� Challenged eGovernment: Lower level of satisfaction with higher level of penetration might be the result of
an eGovernment, which is challenged to provide citizens with services compliant to their needs; future
actions should involve a more citizen-centric approach.
� Hidden eGovernment: Higher level of satisfaction with lower level of penetration might prove the
Government’s ability to offer quality services, but Government should investigate on what provokes the lack
of usage, in order to exploit the investment in digitising Public Administration services.
� Market Oriented eGovernment: Higher level of both penetration and satisfaction might shows an
eGovernment able to meet users’ need, in a market-oriented approach, where citizens use online services
and appreciate them.
Satisfaction
Penetration
Digitisation
Lend an ear
to citizens
Incl
usi
on
Aw
are
ne
ss
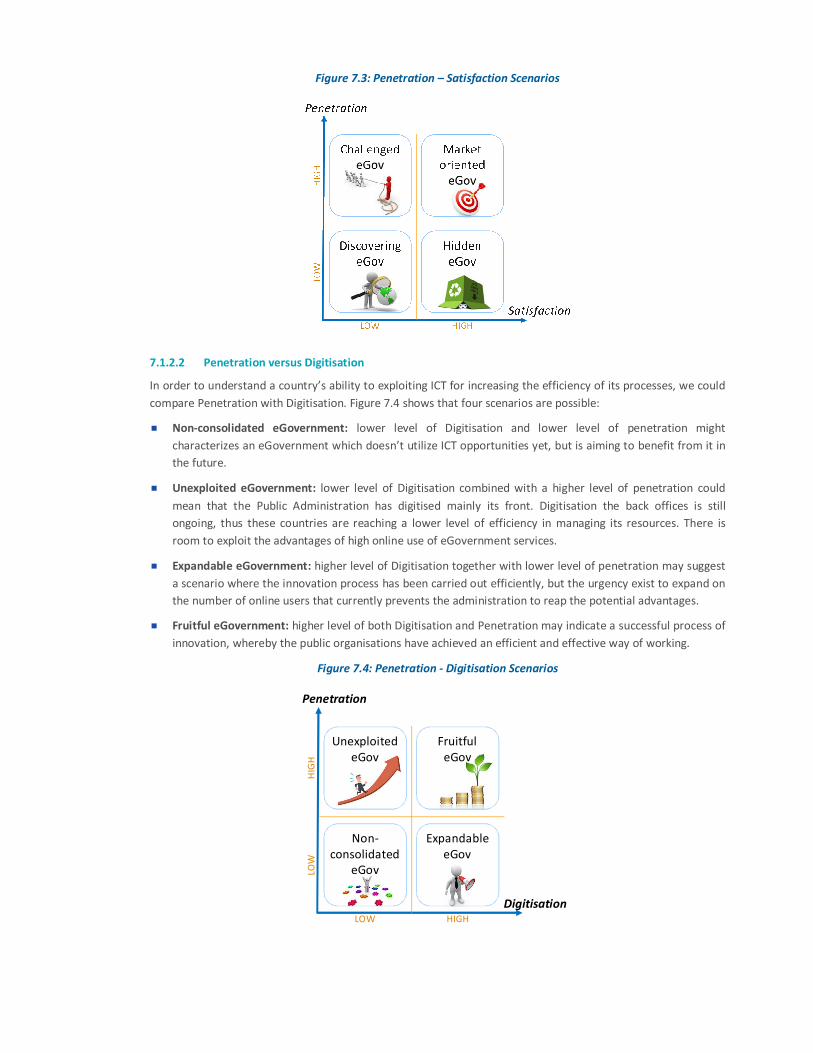
Figure 7.3: Penetration – Satisfaction Scenarios
7.1.2.2 Penetration versus Digitisation
In order to understand a country’s ability to exploiting ICT for increasing the efficiency of its processes, we could
compare Penetration with Digitisation. Figure 7.4 shows that four scenarios are possible:
� Non-consolidated eGovernment: lower level of Digitisation and lower level of penetration might
characterizes an eGovernment which doesn’t utilize ICT opportunities yet, but is aiming to benefit from it in
the future.
� Unexploited eGovernment: lower level of Digitisation combined with a higher level of penetration could
mean that the Public Administration has digitised mainly its front. Digitisation the back offices is still
ongoing, thus these countries are reaching a lower level of efficiency in managing its resources. There is
room to exploit the advantages of high online use of eGovernment services.
� Expandable eGovernment: higher level of Digitisation together with lower level of penetration may suggest
a scenario where the innovation process has been carried out efficiently, but the urgency exist to expand on
the number of online users that currently prevents the administration to reap the potential advantages.
� Fruitful eGovernment: higher level of both Digitisation and Penetration may indicate a successful process of
innovation, whereby the public organisations have achieved an efficient and effective way of working.
Figure 7.4: Penetration - Digitisation Scenarios
Non-
consolidated
eGov
Expandable
eGov
Unexploited
eGov
Fruitful
eGov
HIGH
HIG
HLO
W
LOW
Digitisation
Penetration
Page 74 of 111
7.1.2.3 Satisfaction versus Digitisation
Comparing Satisfaction with process Digitisation (Figure 7.5) allows us to represent a country’s ability to lead the
internal innovation process without overlooking citizens’ needs, and to manage internal-external equilibrium.
Four scenarios are identified:
� Early eGovernment: lower level of Digitisation and satisfaction might show the difficulties for a Public
Administration to develop eGovernment services that fulfil user’s needs and at the same time to generate a
higher level of efficiency in digitising its internal processes. For these governments, it is important to
understand if the causes are related to exogenous or endogenous factors.
� Narrow eGovernment: lower level of Digitisation and higher level of satisfaction may reveal a perception of
high quality of online services by citizens, but these online services are supported by internal process
digitisation only to a limited extent and consequently leave room for governments to improve on the latter
and to harvest.
� Growing eGovernment: higher level of Digitisation combined with lower level of satisfaction may show an
eGovernment with strong focus on digitising internal processes but so far without a strong correlation with
user’s needs..Growing the satisfaction of users will lead to the next scenario.
� Fulfilling eGovernment: higher level of both Digitisation and satisfaction may represent an eGovernment
fulfilment, where the digitisation process serves as an example for others and services on offer respond to
users’ needs.
Figure 7.5: Satisfaction - Digitisation Scenarios
Having assessed the eGovernment maturity using these absolute indicators, this maturity can be set in the right
context using a number of relative variables.
7.1.3 Step 2: Relative indicators
Consequently, a second step of the analysis is performed in order to understand how the eGovernment
performance of individual countries is influenced by exogenous factors shaping a specific context.
There are three categories of these contextual, or relative, indicators. These three categories, visualised in the
below, are:
� Government supply: The spread of eGovernment services, including investments and efforts in innovation,
diffusion and quality of services;
� eGovernment demand: Citizens’ willingness to use online services. This includes factors that enable citizens
to use the online channel, such as eReadiness, Awareness and Attitude of citizens;
� Environment: Readiness of the background. Some exogenous factors that are considered are socio-
demographic data, ICT Readiness and Governance structure.
EarlyeGov Growing
eGov
Narrow
eGov
Fulfilling
eGov
HIGH
HIG
HLO
W
LOW
Digitisation
Satisfaction
Page 75 of 111
Figure 7.6: eGovernment maturity framework
All three categories consist of a number of sub-indicators. First of all, eGovernment Supply sub indicators are:
� Investments: each country’s performance should be compared with the effort in innovation realised, in
order to understand which actions lead to better results; this effort could be represented trough the
percentage of public expenditure in ICT, or the level of European Union funding spent in public
administration innovation.
� Diffusion of services: heterogeneous availability of different services per country. Availability of
eGovernment services can be measured with standard statistical indicators provided by Eurostat or each
country’s statistical institutes and they refer, for example, to the availability of online services, online
features availability, and interaction level online.
� Quality of services: added value provided by online services rather than offline services, which increases if
the whole service procedure is offered online. To compare service offerings in different EU countries in
terms of the services availability and their quality, the mystery shopping methodology can be used to
measure services’ usability and the integration of IT enablers in the service delivery chain.
Secondly, eGovernment Demand sub indicators which enable citizens in using the online channels include:
� User’s eReadiness: citizens’ readiness is a prerequisite to use eGovernment services; this could be observed
through use of other non-governmental online services, such as eCommerce, internet banking, and social
networks. Finally the user’s readiness to eGovernment adoption can be also analysed in terms of trust in
government as a proxy of propensity of public online services demand.
� Awareness: public administrations which offer online services should plan intensive communication
initiatives, in order to inform citizen on the availability of services. Citizens’ awareness still represents a
barrier to eGovernment diffusion.
� Attitude: online services should be designed in order to respond to specific users’ needs. Perceived benefits
of using electronic services/eGovernment channels, the preferences of citizens and businesses for future
use. That is, if the respondents were to use a service again, how likely that they would re-use the same
channel for contact or access. The issue of future use is further elaborated by measuring indications on
specific barriers to as well as potential motivators for (increased) future use.
Third, environmental variables need to be taken into consideration. Sub indicators for this category include:
� Socio-demographic data: standard demographic data including gender, age, educational level, or
geographical characteristics such as the number of municipalities or population density can be integrated
with others variables to analyse users’ needs and the propensity to use online services. Also, a corruption
index could be used as a proxy of transparency and information asymmetry of governments, factors which
could explain part of resistance to change.
� ICT Readiness: eGovernment maturity depends on a country’s readiness to deal with new ICT opportunities,
represented by the availability of infrastructure and enabling technologies. In addition to standard indicators
such as broadband or free Wi-Fi coverage, number of IT device per capita, adoption of advanced technology
standard (e.g. Single Sign On), it could also be interesting to look at countries’ efforts to improve eReadiness,
for example, through the percentage of GDP invested in ICT.
� Governance structure: there is a significant impact on eGovernment output generated by the
administrative, political, and decisional structure of each country. This aspect includes the ability to legislate.
Supply
Demand
Environment
Page 76 of 111
This can be measured by average time of laws’ implementation, governance factors represented by the
presence of coordinating agencies, and the average time to convert European directives. In order to
understand government readiness and innovations commitment, we could compare eGovernment maturity
to other innovation process in public administration, such as time to manage public work in general, or more
specifically the procurement process, measured by, for example, the average time to manage a public
purchase.
Figures III.1 – III.3 in Annex III list and describe the single indicators considered.
7.1.4 Methodology and data analysis
Using these absolute and relative indicators, a cluster analysis was conducted in order to identify clusters of
countries with similar eGovernment maturity performances, and clusters of countries with a similar context.
Comparing these clusters will build understanding of the context impact on performances.
Cluster analysis is a technique for exploratory statistical data analysis, which divides a set of objects into groups
(clusters) that are meaningful and useful. The objects in the same cluster are more similar in some sense (the
clustering variables) to each other than to those in other clusters. Researchers should identify the variables (i.e.
the clustering variables) which represent the objects’ characteristics of interests; then one of several statistical
algorithms could be applied to divide the objects by calculating the distances among the objects in terms of the
clustering variables. Statistically, the optimal number of the clusters represents the solution which provides the
most distinctive clusters. Then the clusters should be profiled and the result be interpreted. An object in one
cluster should have similar values and patterns in the clustering variables as other objects in the same cluster;
and it should be considerably different in the clustering variables from the objects in other clusters.
In order to reduce the dependence of the dataset on relative variables and to enhance the interpretability of the
data analysis results, where several variables share a mutual dimension, they are aggregated together. Such
grouping of variables are further verified by a factor analysis which is a statistical method aiming at identify
unobserved variables (i.e. factors) whose variations are reflected by the variations of all the single variables.
Usually there is lower number of unobserved variables (i.e. factors) than the number of observed variables; thus
factor analysis is often applied to reduce the data dimension and to prepare the dataset for further analysis.
7.2 Step 1: Clustering countries on eGovernment performances
The clustering exercise proposed in this year’s eGovernment benchmark report aims at providing the basis for
future developments. The valorisation of the indicators has been made through the available dataset, which may
still have limitations at this point. Future versions of the report could be aimed at improving and building out the
data collection framework in order to obtain indicators more fitting with the new methodology.
7.2.1 Absolute indicators valorisation
This phase’s scope was to identify indicators able to represent eGovernment maturity coherently with the Action
Plan objectives. As discussed in paragraph 7.1.1, the absolute indicators identified are Penetration, Digitisation,
Satisfaction and Harmonisation. Figure 7.7 shows the valorisation of these indicators.
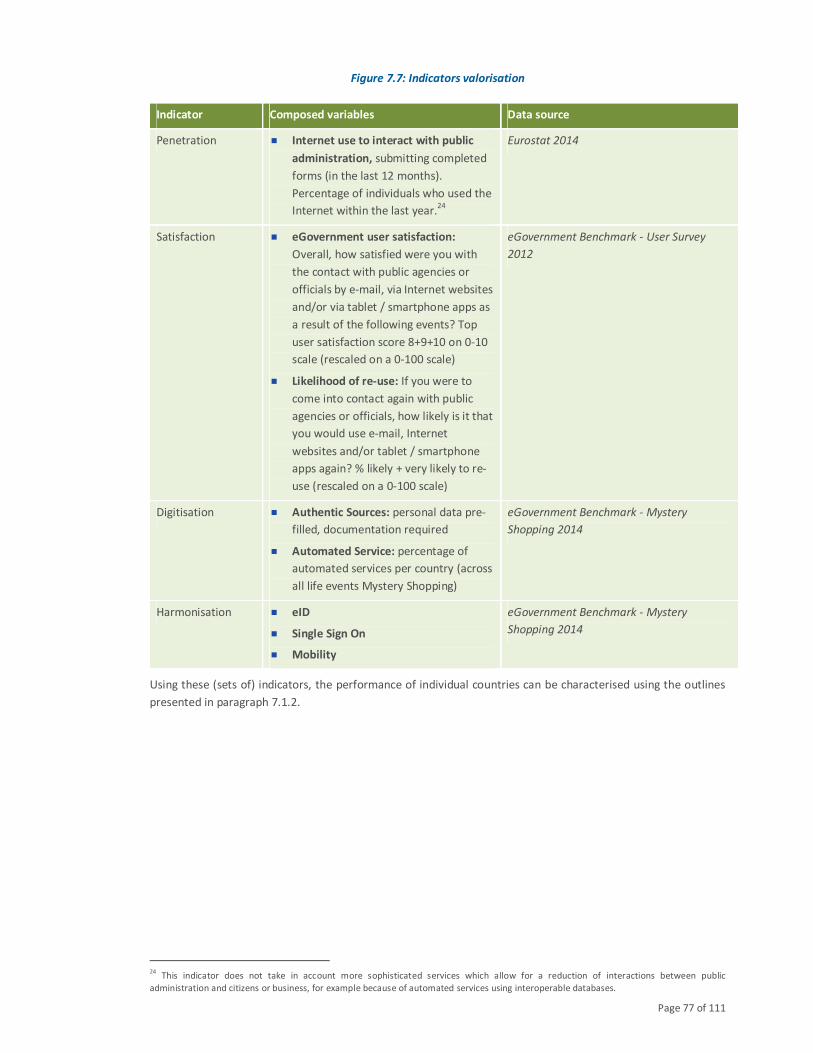
Page 77 of 111
Figure 7.7: Indicators valorisation
Using these (sets of) indicators, the performance of individual countries can be characterised using the outlines
presented in paragraph 7.1.2.
24
This indicator does not take in account more sophisticated services which allow for a reduction of interactions between public
administration and citizens or business, for example because of automated services using interoperable databases.
Indicator Composed variables Data source
Penetration � Internet use to interact with public
administration, submitting completed
forms (in the last 12 months).
Percentage of individuals who used the
Internet within the last year.24
Eurostat 2014
Satisfaction � eGovernment user satisfaction:
Overall, how satisfied were you with
the contact with public agencies or
officials by e-mail, via Internet websites
and/or via tablet / smartphone apps as
a result of the following events? Top
user satisfaction score 8+9+10 on 0-10
scale (rescaled on a 0-100 scale)
� Likelihood of re-use: If you were to
come into contact again with public
agencies or officials, how likely is it that
you would use e-mail, Internet
websites and/or tablet / smartphone
apps again? % likely + very likely to re-
use (rescaled on a 0-100 scale)
eGovernment Benchmark - User Survey
2012
Digitisation � Authentic Sources: personal data pre-
filled, documentation required
� Automated Service: percentage of
automated services per country (across
all life events Mystery Shopping)
eGovernment Benchmark - Mystery
Shopping 2014
Harmonisation � eID
� Single Sign On
� Mobility
eGovernment Benchmark - Mystery
Shopping 2014
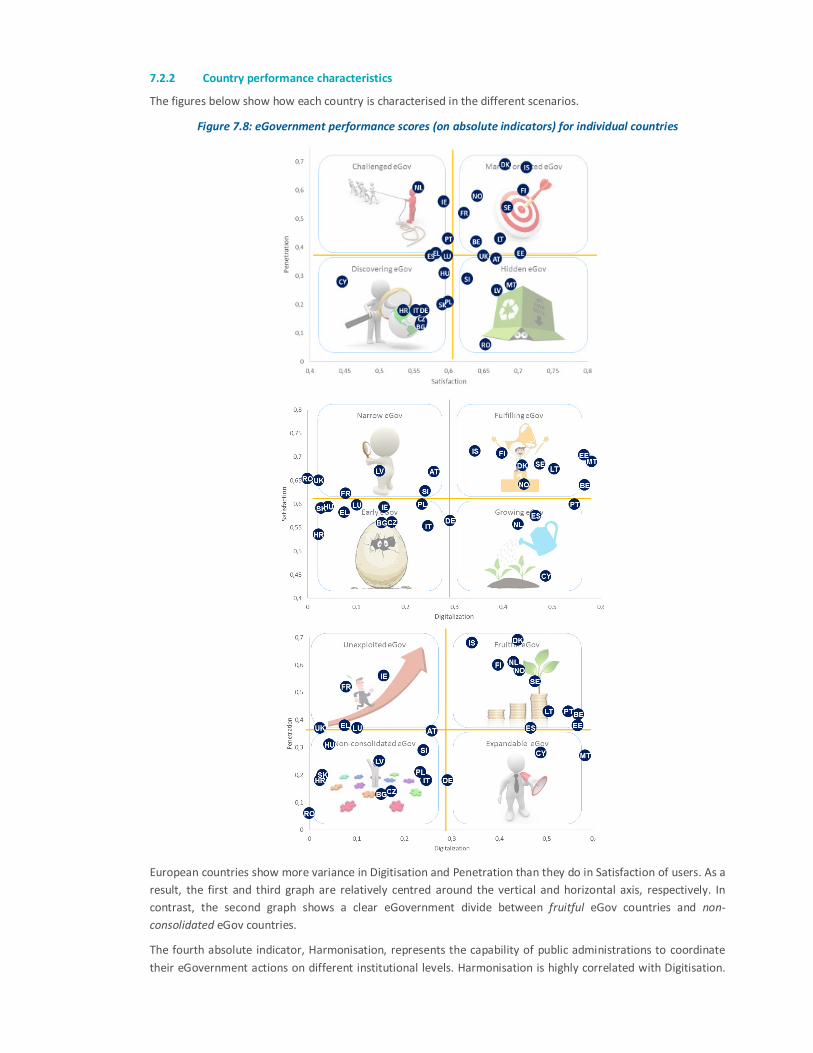
7.2.2 Country performance characteristics
The figures below show how each country is characterised in the different scenarios.
Figure 7.8: eGovernment performance scores (on absolute indicators) for individual countries
European countries show more variance in Digitisation and Penetration than they do in Satisfaction of users. As a
result, the first and third graph are relatively centred around the vertical and horizontal axis, respectively. In
contrast, the second graph shows a clear eGovernment divide between fruitful eGov countries and non-
consolidated eGov countries.
The fourth absolute indicator, Harmonisation, represents the capability of public administrations to coordinate
their eGovernment actions on different institutional levels. Harmonisation is highly correlated with Digitisation.
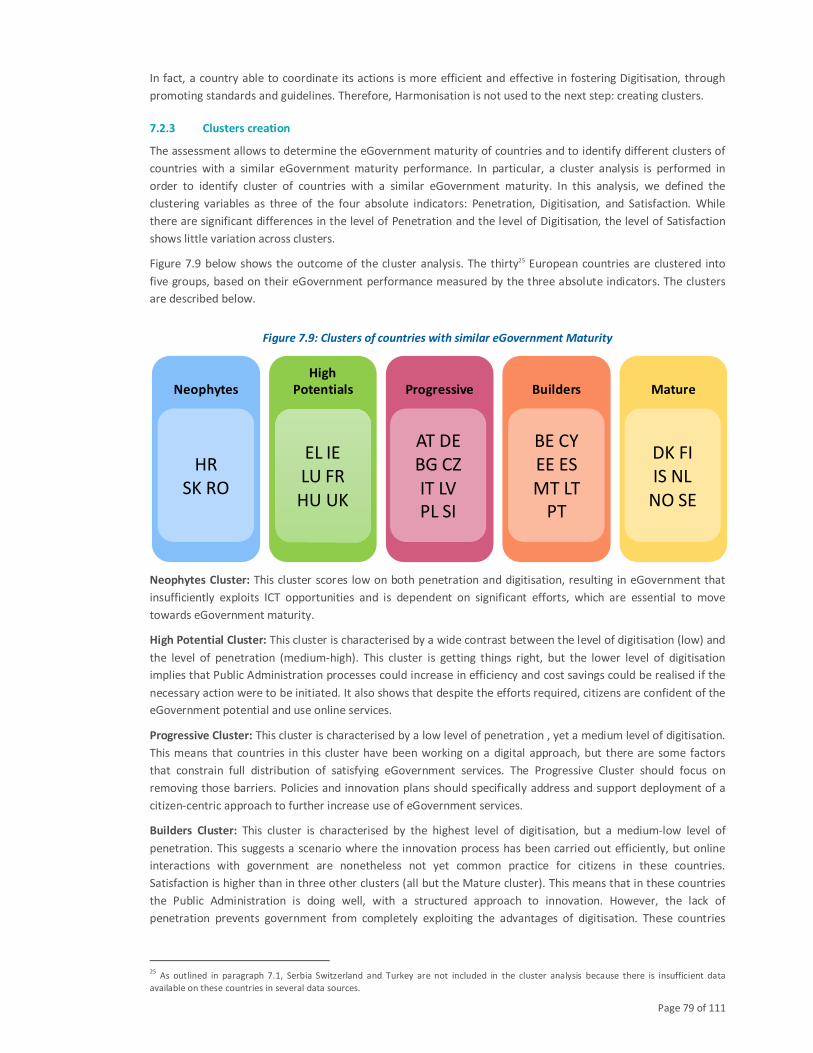
Page 79 of 111
In fact, a country able to coordinate its actions is more efficient and effective in fostering Digitisation, through
promoting standards and guidelines. Therefore, Harmonisation is not used to the next step: creating clusters.
7.2.3 Clusters creation
The assessment allows to determine the eGovernment maturity of countries and to identify different clusters of
countries with a similar eGovernment maturity performance. In particular, a cluster analysis is performed in
order to identify cluster of countries with a similar eGovernment maturity. In this analysis, we defined the
clustering variables as three of the four absolute indicators: Penetration, Digitisation, and Satisfaction. While
there are significant differences in the level of Penetration and the level of Digitisation, the level of Satisfaction
shows little variation across clusters.
Figure 7.9 below shows the outcome of the cluster analysis. The thirty25 European countries are clustered into
five groups, based on their eGovernment performance measured by the three absolute indicators. The clusters
are described below.
Figure 7.9: Clusters of countries with similar eGovernment Maturity
Neophytes Cluster: This cluster scores low on both penetration and digitisation, resulting in eGovernment that
insufficiently exploits ICT opportunities and is dependent on significant efforts, which are essential to move
towards eGovernment maturity.
High Potential Cluster: This cluster is characterised by a wide contrast between the level of digitisation (low) and
the level of penetration (medium-high). This cluster is getting things right, but the lower level of digitisation
implies that Public Administration processes could increase in efficiency and cost savings could be realised if the
necessary action were to be initiated. It also shows that despite the efforts required, citizens are confident of the
eGovernment potential and use online services.
Progressive Cluster: This cluster is characterised by a low level of penetration , yet a medium level of digitisation.
This means that countries in this cluster have been working on a digital approach, but there are some factors
that constrain full distribution of satisfying eGovernment services. The Progressive Cluster should focus on
removing those barriers. Policies and innovation plans should specifically address and support deployment of a
citizen-centric approach to further increase use of eGovernment services.
Builders Cluster: This cluster is characterised by the highest level of digitisation, but a medium-low level of
penetration. This suggests a scenario where the innovation process has been carried out efficiently, but online
interactions with government are nonetheless not yet common practice for citizens in these countries.
Satisfaction is higher than in three other clusters (all but the Mature cluster). This means that in these countries
the Public Administration is doing well, with a structured approach to innovation. However, the lack of
penetration prevents government from completely exploiting the advantages of digitisation. These countries
25
As outlined in paragraph 7.1, Serbia Switzerland and Turkey are not included in the cluster analysis because there is insufficient data
available on these countries in several data sources.
Neophytes
High
Potentials Progressive Builders Mature
HR
SK RO
EL IE
LU FR
HU UK
AT DE
BG CZ
IT LV
PL SI
BE CY
EE ES
MT LT
PT
DK FI
IS NL
NO SE
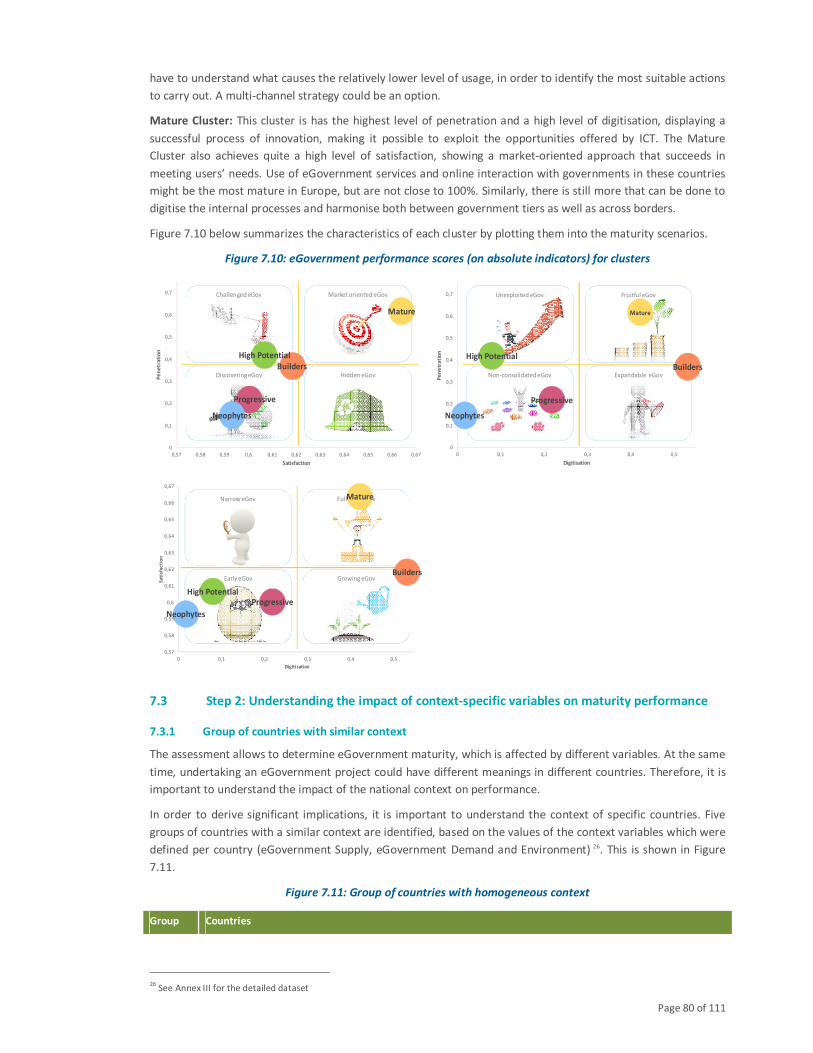
Page 80 of 111
have to understand what causes the relatively lower level of usage, in order to identify the most suitable actions
to carry out. A multi-channel strategy could be an option.
Mature Cluster: This cluster is has the highest level of penetration and a high level of digitisation, displaying a
successful process of innovation, making it possible to exploit the opportunities offered by ICT. The Mature
Cluster also achieves quite a high level of satisfaction, showing a market-oriented approach that succeeds in
meeting users’ needs. Use of eGovernment services and online interaction with governments in these countries
might be the most mature in Europe, but are not close to 100%. Similarly, there is still more that can be done to
digitise the internal processes and harmonise both between government tiers as well as across borders.
Figure 7.10 below summarizes the characteristics of each cluster by plotting them into the maturity scenarios.
Figure 7.10: eGovernment performance scores (on absolute indicators) for clusters
7.3 Step 2: Understanding the impact of context-specific variables on maturity performance
7.3.1 Group of countries with similar context
The assessment allows to determine eGovernment maturity, which is affected by different variables. At the same
time, undertaking an eGovernment project could have different meanings in different countries. Therefore, it is
important to understand the impact of the national context on performance.
In order to derive significant implications, it is important to understand the context of specific countries. Five
groups of countries with a similar context are identified, based on the values of the context variables which were
defined per country (eGovernment Supply, eGovernment Demand and Environment) 26. This is shown in Figure
7.11.
Figure 7.11: Group of countries with homogeneous context
Group Countries
26
See Annex III for the detailed dataset
DiscoveringeGov
Challenged eGov Market oriented eGov
Hidden eGov
Progressive
High Potential
Mature
Neophytes
Builders
0
0,1
0,2
0,3
0,4
0,5
0,6
0,7
0,57 0,58 0,59 0,6 0,61 0,62 0,63 0,64 0,65 0,66 0,67
Pe
ne
tra
tio
n
Satisfaction
Non-consolidatedeGov
Fruitful eGovUnexploited eGov
Expandable eGov
Progressive
High Potential
Mature
Neophytes
Builders
0
0,1
0,2
0,3
0,4
0,5
0,6
0,7
0 0,1 0,2 0,3 0,4 0,5
Pe
ne
tra
tio
n
Digitisation
Growing eGov
FulfillingeGovNarrow eGov
Early eGov
ProgressiveHigh Potential
Mature
Neophytes
Builders
0,57
0,58
0,59
0,6
0,61
0,62
0,63
0,64
0,65
0,66
0,67
0 0,1 0,2 0,3 0,4 0,5
Sa
tisf
ac
tio
n
Digitisation
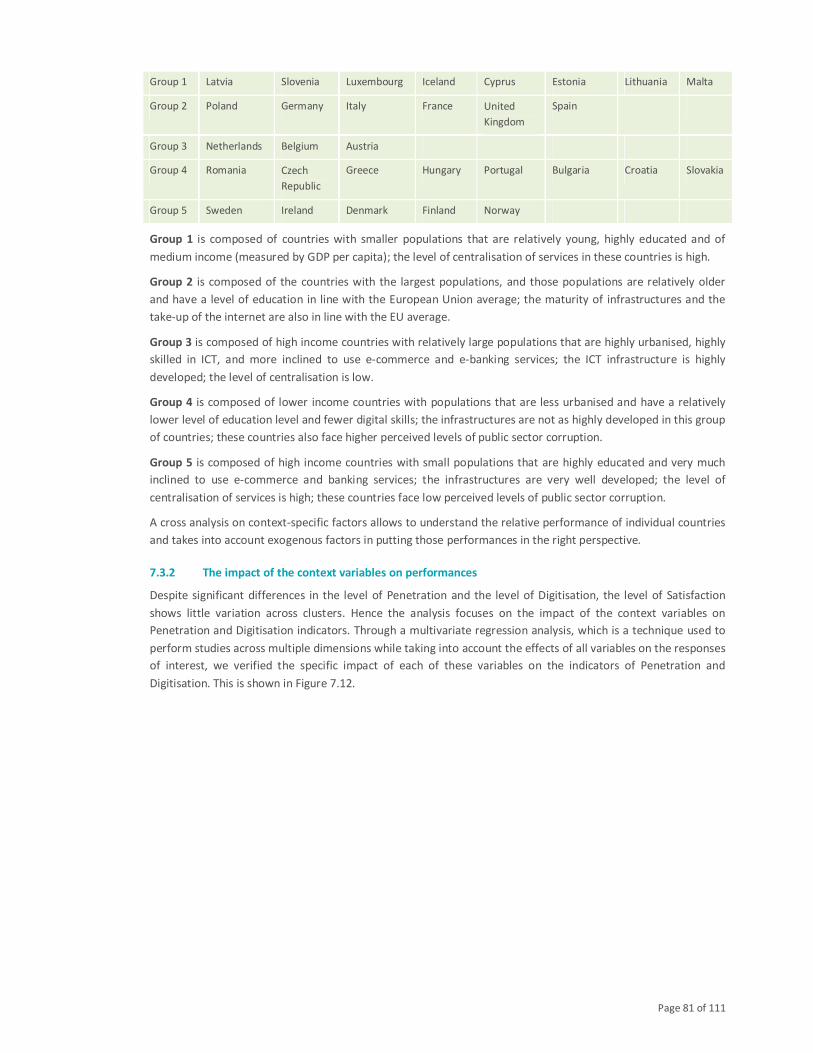
Page 81 of 111
Group 1 Latvia Slovenia Luxembourg Iceland Cyprus Estonia Lithuania Malta
Group 2 Poland Germany Italy France United
Kingdom
Spain
Group 3 Netherlands Belgium Austria
Group 4 Romania Czech
Republic
Greece Hungary Portugal Bulgaria Croatia Slovakia
Group 5 Sweden Ireland Denmark Finland Norway
Group 1 is composed of countries with smaller populations that are relatively young, highly educated and of
medium income (measured by GDP per capita); the level of centralisation of services in these countries is high.
Group 2 is composed of the countries with the largest populations, and those populations are relatively older
and have a level of education in line with the European Union average; the maturity of infrastructures and the
take-up of the internet are also in line with the EU average.
Group 3 is composed of high income countries with relatively large populations that are highly urbanised, highly
skilled in ICT, and more inclined to use e-commerce and e-banking services; the ICT infrastructure is highly
developed; the level of centralisation is low.
Group 4 is composed of lower income countries with populations that are less urbanised and have a relatively
lower level of education level and fewer digital skills; the infrastructures are not as highly developed in this group
of countries; these countries also face higher perceived levels of public sector corruption.
Group 5 is composed of high income countries with small populations that are highly educated and very much
inclined to use e-commerce and banking services; the infrastructures are very well developed; the level of
centralisation of services is high; these countries face low perceived levels of public sector corruption.
A cross analysis on context-specific factors allows to understand the relative performance of individual countries
and takes into account exogenous factors in putting those performances in the right perspective.
7.3.2 The impact of the context variables on performances
Despite significant differences in the level of Penetration and the level of Digitisation, the level of Satisfaction
shows little variation across clusters. Hence the analysis focuses on the impact of the context variables on
Penetration and Digitisation indicators. Through a multivariate regression analysis, which is a technique used to
perform studies across multiple dimensions while taking into account the effects of all variables on the responses
of interest, we verified the specific impact of each of these variables on the indicators of Penetration and
Digitisation. This is shown in Figure 7.12.
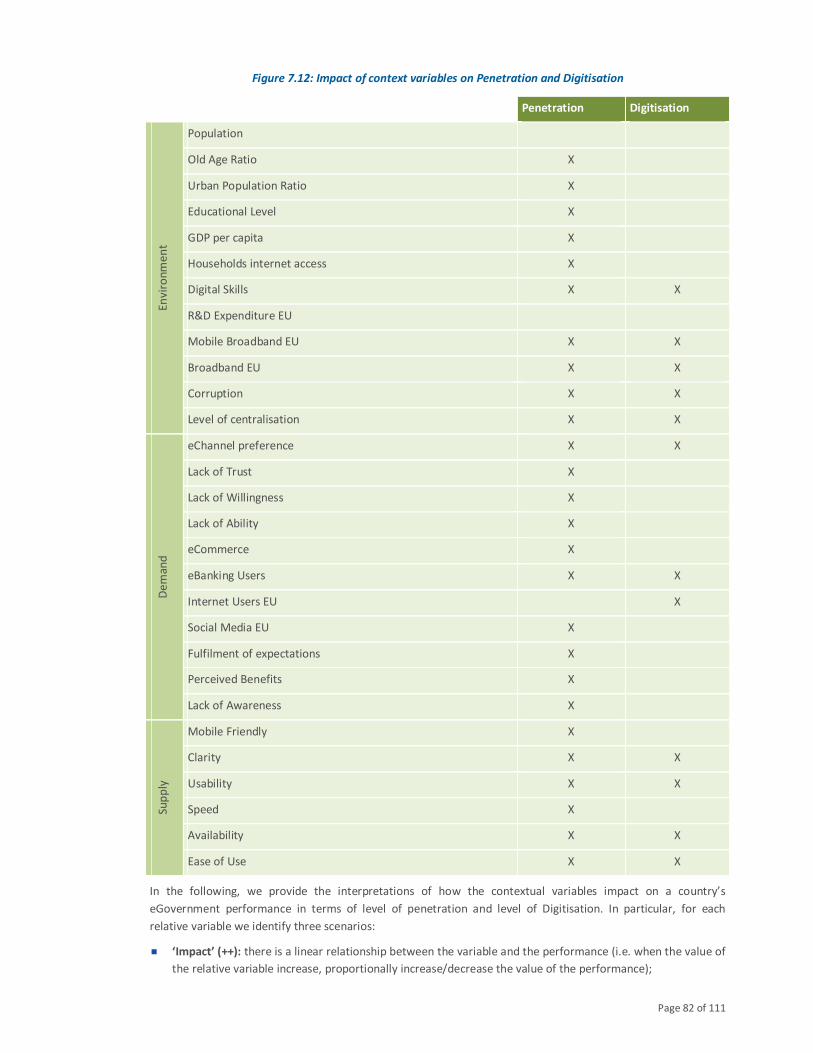
Page 82 of 111
Figure 7.12: Impact of context variables on Penetration and Digitisation
Penetration Digitisation
En
vir
on
me
nt
Population
Old Age Ratio X
Urban Population Ratio X
Educational Level X
GDP per capita X
Households internet access X
Digital Skills X X
R&D Expenditure EU
Mobile Broadband EU X X
Broadband EU X X
Corruption X X
Level of centralisation X X
De
ma
nd
eChannel preference X X
Lack of Trust X
Lack of Willingness X
Lack of Ability X
eCommerce X
eBanking Users X X
Internet Users EU X
Social Media EU X
Fulfilment of expectations X
Perceived Benefits X
Lack of Awareness X
Su
pp
ly
Mobile Friendly X
Clarity X X
Usability X X
Speed X
Availability X X
Ease of Use X X
In the following, we provide the interpretations of how the contextual variables impact on a country’s
eGovernment performance in terms of level of penetration and level of Digitisation. In particular, for each
relative variable we identify three scenarios:
� ‘Impact’ (++): there is a linear relationship between the variable and the performance (i.e. when the value of
the relative variable increase, proportionally increase/decrease the value of the performance);
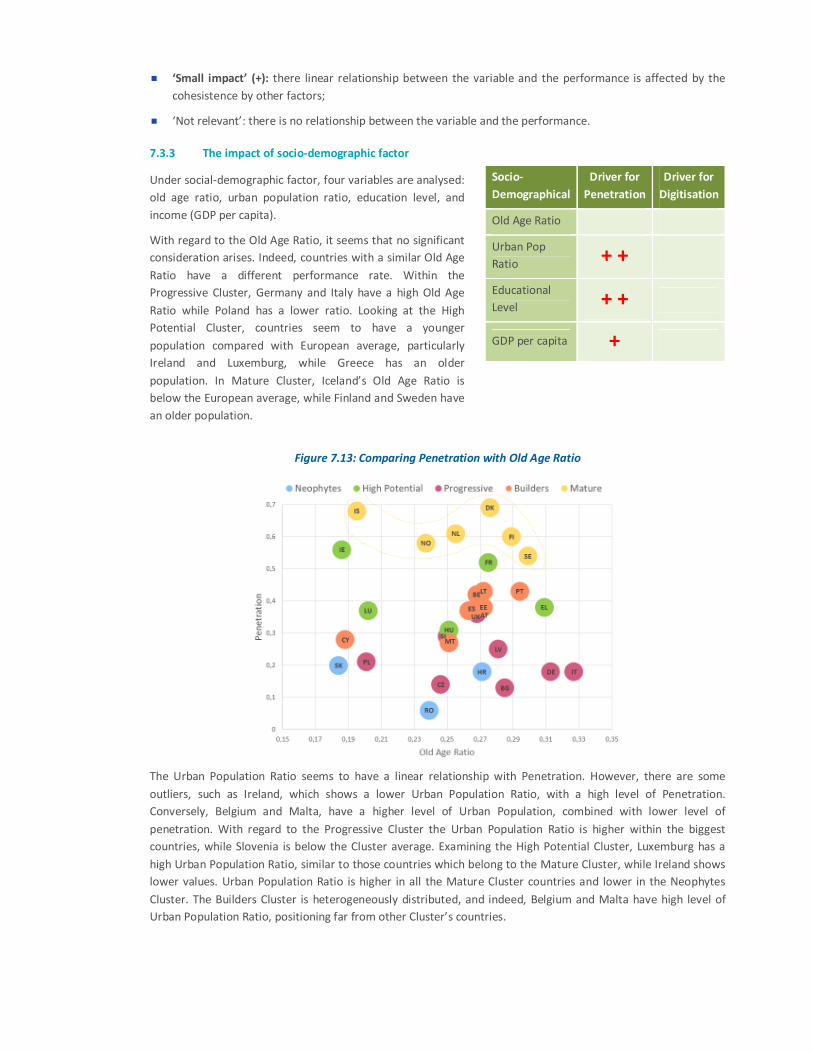
� ‘Small impact’ (+): there linear relationship between the variable and the performance is affected by the
cohesistence by other factors;
� ‘Not relevant’: there is no relationship between the variable and the performance.
7.3.3 The impact of socio-demographic factor
Under social-demographic factor, four variables are analysed:
old age ratio, urban population ratio, education level, and
income (GDP per capita).
With regard to the Old Age Ratio, it seems that no significant
consideration arises. Indeed, countries with a similar Old Age
Ratio have a different performance rate. Within the
Progressive Cluster, Germany and Italy have a high Old Age
Ratio while Poland has a lower ratio. Looking at the High
Potential Cluster, countries seem to have a younger
population compared with European average, particularly
Ireland and Luxemburg, while Greece has an older
population. In Mature Cluster, Iceland’s Old Age Ratio is
below the European average, while Finland and Sweden have
an older population.
Socio-
Demographical
Driver for
Penetration
Driver for
Digitisation
Old Age Ratio
Urban Pop
Ratio + +
Educational
Level + +
GDP per capita +
Figure 7.13: Comparing Penetration with Old Age Ratio
The Urban Population Ratio seems to have a linear relationship with Penetration. However, there are some
outliers, such as Ireland, which shows a lower Urban Population Ratio, with a high level of Penetration.
Conversely, Belgium and Malta, have a higher level of Urban Population, combined with lower level of
penetration. With regard to the Progressive Cluster the Urban Population Ratio is higher within the biggest
countries, while Slovenia is below the Cluster average. Examining the High Potential Cluster, Luxemburg has a
high Urban Population Ratio, similar to those countries which belong to the Mature Cluster, while Ireland shows
lower values. Urban Population Ratio is higher in all the Mature Cluster countries and lower in the Neophytes
Cluster. The Builders Cluster is heterogeneously distributed, and indeed, Belgium and Malta have high level of
Urban Population Ratio, positioning far from other Cluster’s countries.
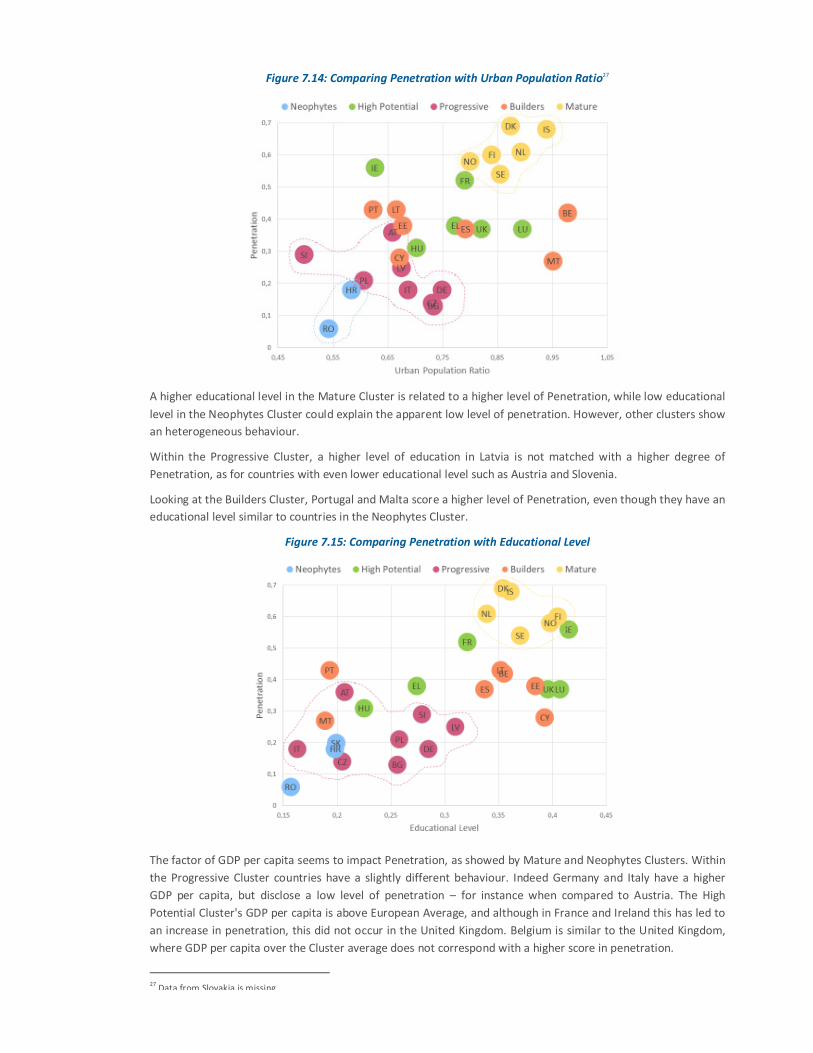
Figure 7.14: Comparing Penetration with Urban Population Ratio27
A higher educational level in the Mature Cluster is related to a higher level of Penetration, while low educational
level in the Neophytes Cluster could explain the apparent low level of penetration. However, other clusters show
an heterogeneous behaviour.
Within the Progressive Cluster, a higher level of education in Latvia is not matched with a higher degree of
Penetration, as for countries with even lower educational level such as Austria and Slovenia.
Looking at the Builders Cluster, Portugal and Malta score a higher level of Penetration, even though they have an
educational level similar to countries in the Neophytes Cluster.
Figure 7.15: Comparing Penetration with Educational Level
The factor of GDP per capita seems to impact Penetration, as showed by Mature and Neophytes Clusters. Within
the Progressive Cluster countries have a slightly different behaviour. Indeed Germany and Italy have a higher
GDP per capita, but disclose a low level of penetration – for instance when compared to Austria. The High
Potential Cluster's GDP per capita is above European Average, and although in France and Ireland this has led to
an increase in penetration, this did not occur in the United Kingdom. Belgium is similar to the United Kingdom,
where GDP per capita over the Cluster average does not correspond with a higher score in penetration.
27
Data from Slovakia is missing
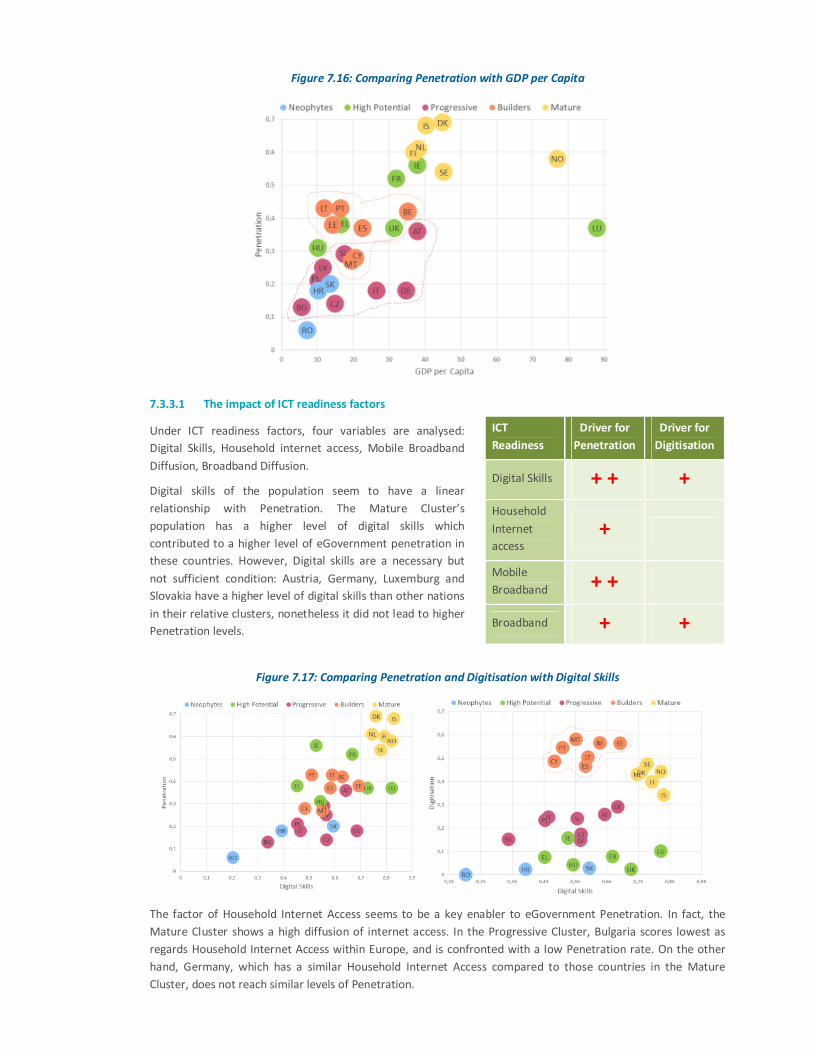
Figure 7.16: Comparing Penetration with GDP per Capita
7.3.3.1 The impact of ICT readiness factors
Under ICT readiness factors, four variables are analysed:
Digital Skills, Household internet access, Mobile Broadband
Diffusion, Broadband Diffusion.
Digital skills of the population seem to have a linear
relationship with Penetration. The Mature Cluster’s
population has a higher level of digital skills which
contributed to a higher level of eGovernment penetration in
these countries. However, Digital skills are a necessary but
not sufficient condition: Austria, Germany, Luxemburg and
Slovakia have a higher level of digital skills than other nations
in their relative clusters, nonetheless it did not lead to higher
Penetration levels.
ICT
Readiness
Driver for
Penetration
Driver for
Digitisation
Digital Skills + + +
Household
Internet
access
+
Mobile
Broadband + +
Broadband + +
Figure 7.17: Comparing Penetration and Digitisation with Digital Skills
The factor of Household Internet Access seems to be a key enabler to eGovernment Penetration. In fact, the
Mature Cluster shows a high diffusion of internet access. In the Progressive Cluster, Bulgaria scores lowest as
regards Household Internet Access within Europe, and is confronted with a low Penetration rate. On the other
hand, Germany, which has a similar Household Internet Access compared to those countries in the Mature
Cluster, does not reach similar levels of Penetration.
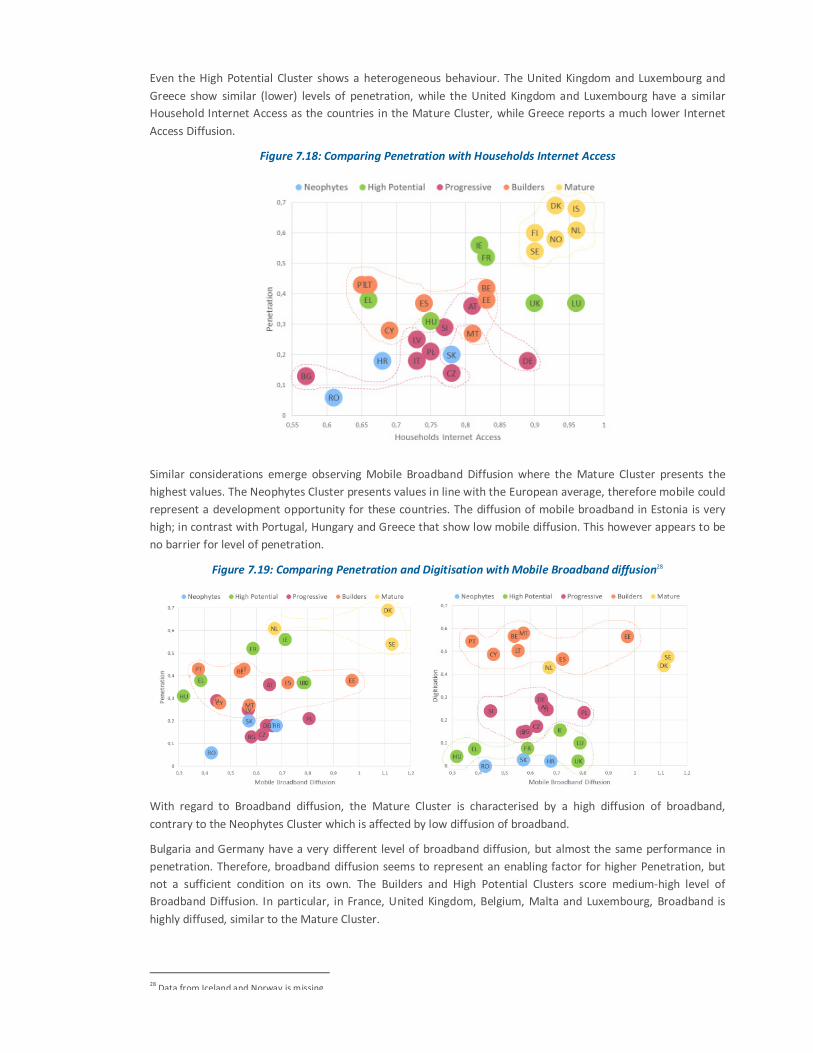
Even the High Potential Cluster shows a heterogeneous behaviour. The United Kingdom and Luxembourg and
Greece show similar (lower) levels of penetration, while the United Kingdom and Luxembourg have a similar
Household Internet Access as the countries in the Mature Cluster, while Greece reports a much lower Internet
Access Diffusion.
Figure 7.18: Comparing Penetration with Households Internet Access
Similar considerations emerge observing Mobile Broadband Diffusion where the Mature Cluster presents the
highest values. The Neophytes Cluster presents values in line with the European average, therefore mobile could
represent a development opportunity for these countries. The diffusion of mobile broadband in Estonia is very
high; in contrast with Portugal, Hungary and Greece that show low mobile diffusion. This however appears to be
no barrier for level of penetration.
Figure 7.19: Comparing Penetration and Digitisation with Mobile Broadband diffusion28
With regard to Broadband diffusion, the Mature Cluster is characterised by a high diffusion of broadband,
contrary to the Neophytes Cluster which is affected by low diffusion of broadband.
Bulgaria and Germany have a very different level of broadband diffusion, but almost the same performance in
penetration. Therefore, broadband diffusion seems to represent an enabling factor for higher Penetration, but
not a sufficient condition on its own. The Builders and High Potential Clusters score medium-high level of
Broadband Diffusion. In particular, in France, United Kingdom, Belgium, Malta and Luxembourg, Broadband is
highly diffused, similar to the Mature Cluster.
28
Data from Iceland and Norway is missing
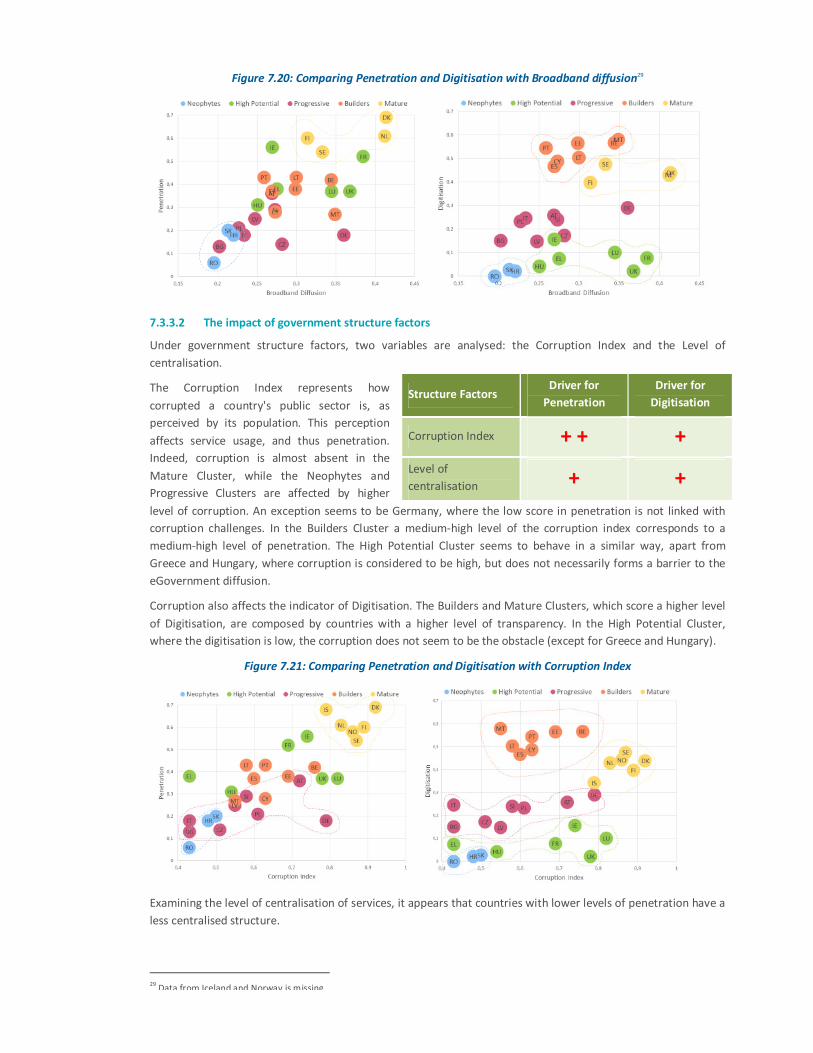
Figure 7.20: Comparing Penetration and Digitisation with Broadband diffusion29
7.3.3.2 The impact of government structure factors
Under government structure factors, two variables are analysed: the Corruption Index and the Level of
centralisation.
The Corruption Index represents how
corrupted a country's public sector is, as
perceived by its population. This perception
affects service usage, and thus penetration.
Indeed, corruption is almost absent in the
Mature Cluster, while the Neophytes and
Progressive Clusters are affected by higher
level of corruption. An exception seems to be Germany, where the low score in penetration is not linked with
corruption challenges. In the Builders Cluster a medium-high level of the corruption index corresponds to a
medium-high level of penetration. The High Potential Cluster seems to behave in a similar way, apart from
Greece and Hungary, where corruption is considered to be high, but does not necessarily forms a barrier to the
eGovernment diffusion.
Corruption also affects the indicator of Digitisation. The Builders and Mature Clusters, which score a higher level
of Digitisation, are composed by countries with a higher level of transparency. In the High Potential Cluster,
where the digitisation is low, the corruption does not seem to be the obstacle (except for Greece and Hungary).
Figure 7.21: Comparing Penetration and Digitisation with Corruption Index
Examining the level of centralisation of services, it appears that countries with lower levels of penetration have a
less centralised structure.
29
Data from Iceland and Norway is missing
Structure Factors Driver for
Penetration
Driver for
Digitisation
Corruption Index + + +
Level of
centralisation + +
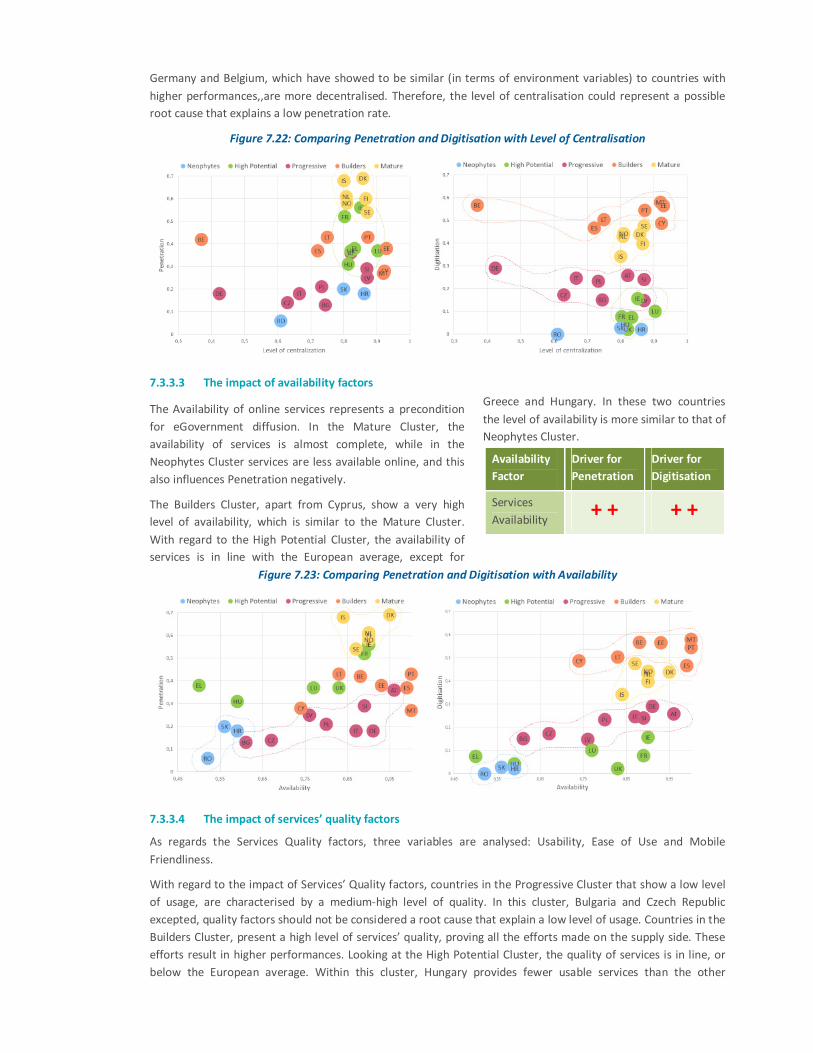
Germany and Belgium, which have showed to be similar (in terms of environment variables) to countries with
higher performances,,are more decentralised. Therefore, the level of centralisation could represent a possible
root cause that explains a low penetration rate.
Figure 7.22: Comparing Penetration and Digitisation with Level of Centralisation
7.3.3.3 The impact of availability factors
The Availability of online services represents a precondition
for eGovernment diffusion. In the Mature Cluster, the
availability of services is almost complete, while in the
Neophytes Cluster services are less available online, and this
also influences Penetration negatively.
The Builders Cluster, apart from Cyprus, show a very high
level of availability, which is similar to the Mature Cluster.
With regard to the High Potential Cluster, the availability of
services is in line with the European average, except for
Greece and Hungary. In these two countries
the level of availability is more similar to that of
Neophytes Cluster.
Availability
Factor
Driver for
Penetration
Driver for
Digitisation
Services
Availability + + + +
Figure 7.23: Comparing Penetration and Digitisation with Availability
7.3.3.4 The impact of services’ quality factors
As regards the Services Quality factors, three variables are analysed: Usability, Ease of Use and Mobile
Friendliness.
With regard to the impact of Services’ Quality factors, countries in the Progressive Cluster that show a low level
of usage, are characterised by a medium-high level of quality. In this cluster, Bulgaria and Czech Republic
excepted, quality factors should not be considered a root cause that explain a low level of usage. Countries in the
Builders Cluster, present a high level of services’ quality, proving all the efforts made on the supply side. These
efforts result in higher performances. Looking at the High Potential Cluster, the quality of services is in line, or
below the European average. Within this cluster, Hungary provides fewer usable services than the other
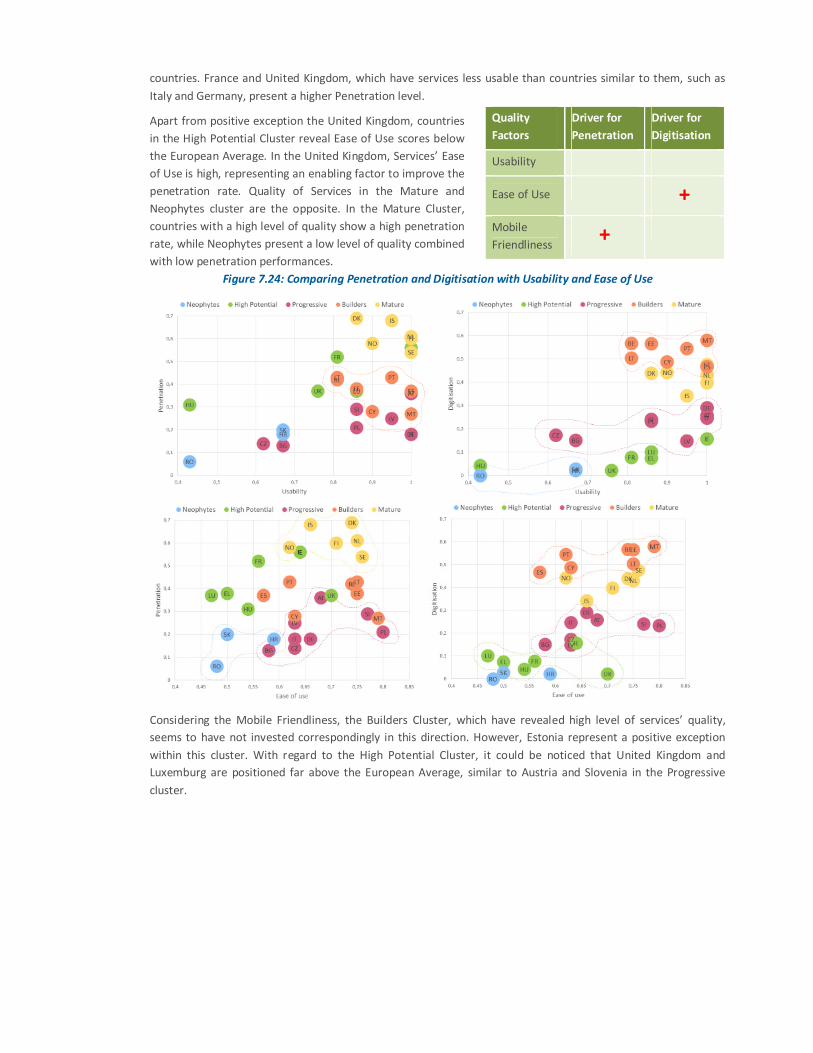
countries. France and United Kingdom, which have services less usable than countries similar to them, such as
Italy and Germany, present a higher Penetration level.
Apart from positive exception the United Kingdom, countries
in the High Potential Cluster reveal Ease of Use scores below
the European Average. In the United Kingdom, Services’ Ease
of Use is high, representing an enabling factor to improve the
penetration rate. Quality of Services in the Mature and
Neophytes cluster are the opposite. In the Mature Cluster,
countries with a high level of quality show a high penetration
rate, while Neophytes present a low level of quality combined
with low penetration performances.
Quality
Factors
Driver for
Penetration
Driver for
Digitisation
Usability
Ease of Use +
Mobile
Friendliness +
Figure 7.24: Comparing Penetration and Digitisation with Usability and Ease of Use
Considering the Mobile Friendliness, the Builders Cluster, which have revealed high level of services’ quality,
seems to have not invested correspondingly in this direction. However, Estonia represent a positive exception
within this cluster. With regard to the High Potential Cluster, it could be noticed that United Kingdom and
Luxemburg are positioned far above the European Average, similar to Austria and Slovenia in the Progressive
cluster.
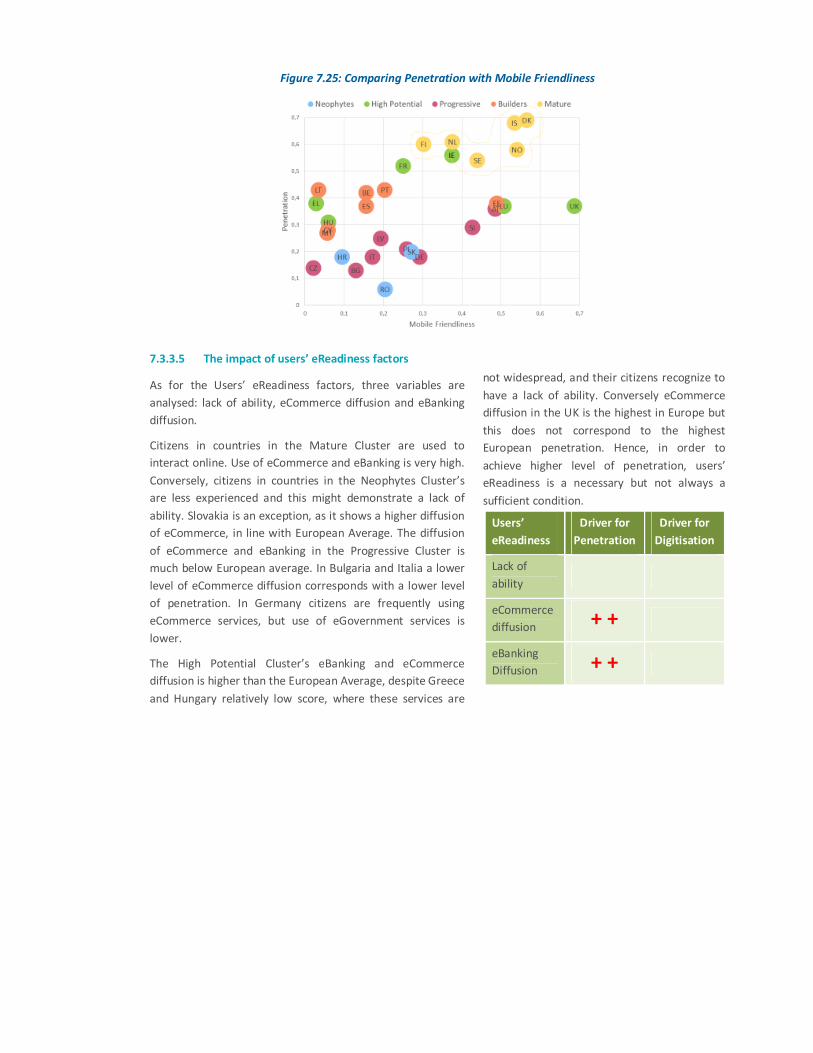
Figure 7.25: Comparing Penetration with Mobile Friendliness
7.3.3.5 The impact of users’ eReadiness factors
As for the Users’ eReadiness factors, three variables are
analysed: lack of ability, eCommerce diffusion and eBanking
diffusion.
Citizens in countries in the Mature Cluster are used to
interact online. Use of eCommerce and eBanking is very high.
Conversely, citizens in countries in the Neophytes Cluster’s
are less experienced and this might demonstrate a lack of
ability. Slovakia is an exception, as it shows a higher diffusion
of eCommerce, in line with European Average. The diffusion
of eCommerce and eBanking in the Progressive Cluster is
much below European average. In Bulgaria and Italia a lower
level of eCommerce diffusion corresponds with a lower level
of penetration. In Germany citizens are frequently using
eCommerce services, but use of eGovernment services is
lower.
The High Potential Cluster’s eBanking and eCommerce
diffusion is higher than the European Average, despite Greece
and Hungary relatively low score, where these services are
not widespread, and their citizens recognize to
have a lack of ability. Conversely eCommerce
diffusion in the UK is the highest in Europe but
this does not correspond to the highest
European penetration. Hence, in order to
achieve higher level of penetration, users’
eReadiness is a necessary but not always a
sufficient condition.
Users’
eReadiness
Driver for
Penetration
Driver for
Digitisation
Lack of
ability
eCommerce
diffusion + +
eBanking
Diffusion + +
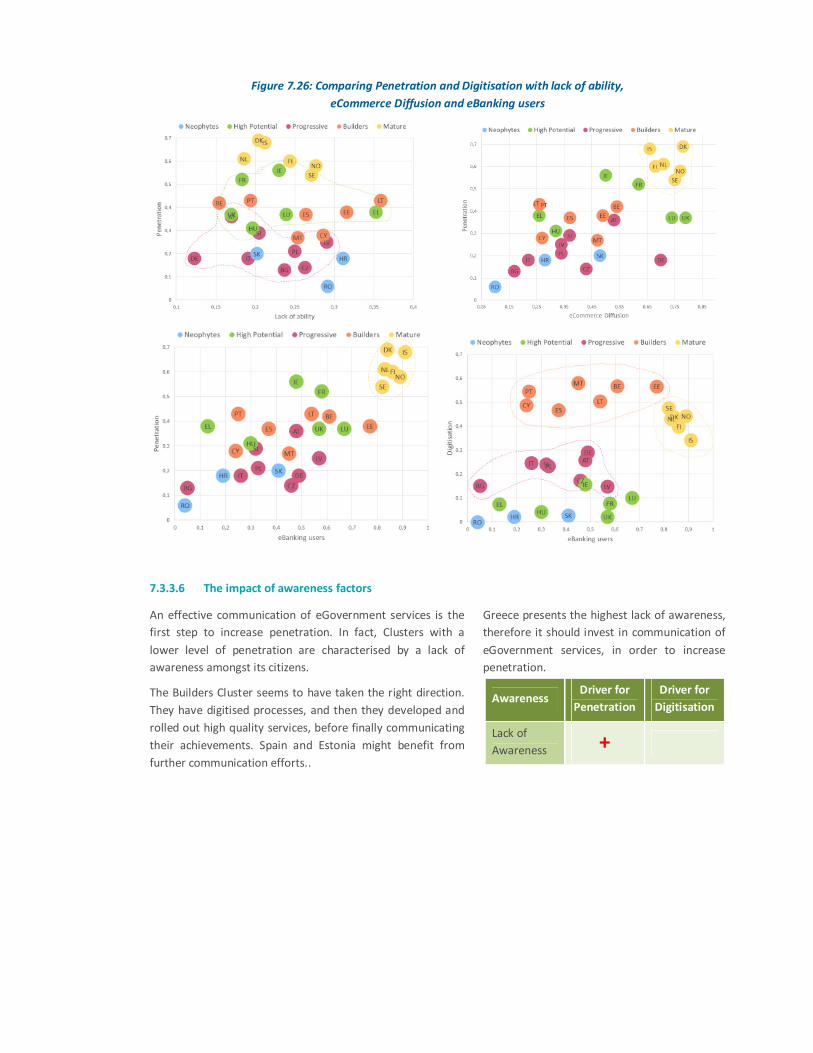
Figure 7.26: Comparing Penetration and Digitisation with lack of ability,
eCommerce Diffusion and eBanking users
7.3.3.6 The impact of awareness factors
An effective communication of eGovernment services is the
first step to increase penetration. In fact, Clusters with a
lower level of penetration are characterised by a lack of
awareness amongst its citizens.
The Builders Cluster seems to have taken the right direction.
They have digitised processes, and then they developed and
rolled out high quality services, before finally communicating
their achievements. Spain and Estonia might benefit from
further communication efforts..
Greece presents the highest lack of awareness,
therefore it should invest in communication of
eGovernment services, in order to increase
penetration.
Awareness Driver for
Penetration
Driver for
Digitisation
Lack of
Awareness +
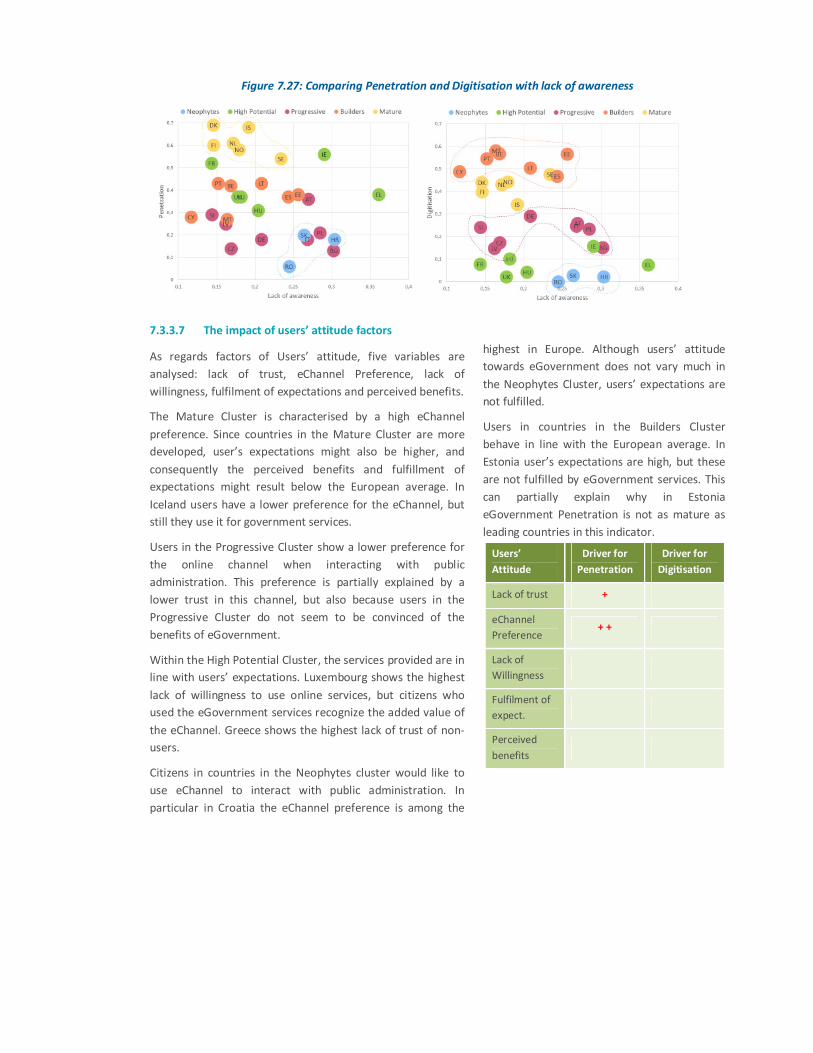
Figure 7.27: Comparing Penetration and Digitisation with lack of awareness
7.3.3.7 The impact of users’ attitude factors
As regards factors of Users’ attitude, five variables are
analysed: lack of trust, eChannel Preference, lack of
willingness, fulfilment of expectations and perceived benefits.
The Mature Cluster is characterised by a high eChannel
preference. Since countries in the Mature Cluster are more
developed, user’s expectations might also be higher, and
consequently the perceived benefits and fulfillment of
expectations might result below the European average. In
Iceland users have a lower preference for the eChannel, but
still they use it for government services.
Users in the Progressive Cluster show a lower preference for
the online channel when interacting with public
administration. This preference is partially explained by a
lower trust in this channel, but also because users in the
Progressive Cluster do not seem to be convinced of the
benefits of eGovernment.
Within the High Potential Cluster, the services provided are in
line with users’ expectations. Luxembourg shows the highest
lack of willingness to use online services, but citizens who
used the eGovernment services recognize the added value of
the eChannel. Greece shows the highest lack of trust of non-
users.
Citizens in countries in the Neophytes cluster would like to
use eChannel to interact with public administration. In
particular in Croatia the eChannel preference is among the
highest in Europe. Although users’ attitude
towards eGovernment does not vary much in
the Neophytes Cluster, users’ expectations are
not fulfilled.
Users in countries in the Builders Cluster
behave in line with the European average. In
Estonia user’s expectations are high, but these
are not fulfilled by eGovernment services. This
can partially explain why in Estonia
eGovernment Penetration is not as mature as
leading countries in this indicator.
Users’
Attitude
Driver for
Penetration
Driver for
Digitisation
Lack of trust +
eChannel
Preference + +
Lack of
Willingness
Fulfilment of
expect.
Perceived
benefits
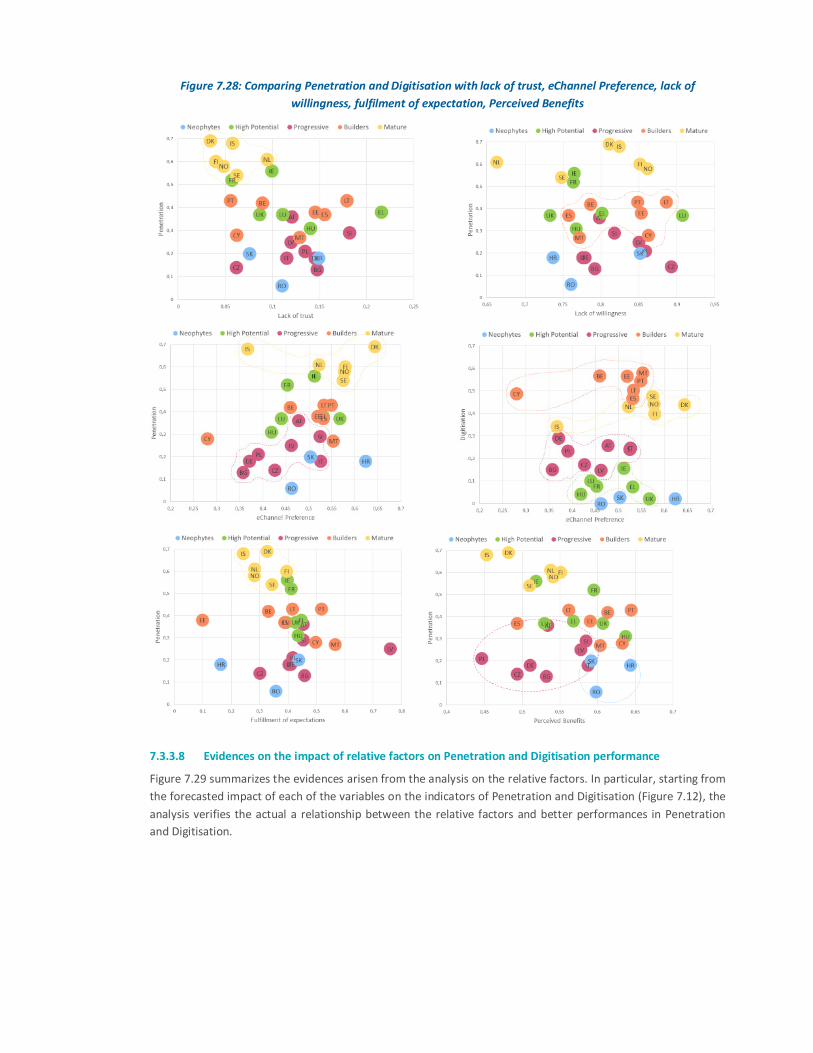
Figure 7.28: Comparing Penetration and Digitisation with lack of trust, eChannel Preference, lack of
willingness, fulfilment of expectation, Perceived Benefits
7.3.3.8 Evidences on the impact of relative factors on Penetration and Digitisation performance
Figure 7.29 summarizes the evidences arisen from the analysis on the relative factors. In particular, starting from
the forecasted impact of each of the variables on the indicators of Penetration and Digitisation (Figure 7.12), the
analysis verifies the actual a relationship between the relative factors and better performances in Penetration
and Digitisation.
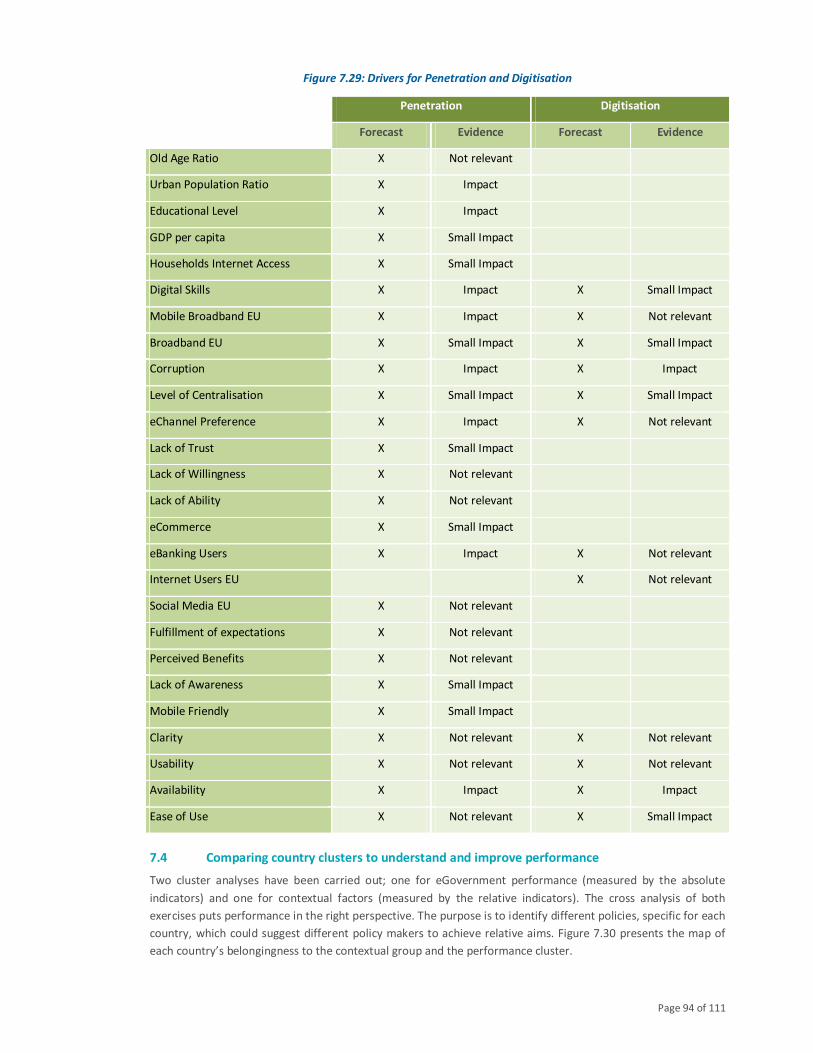
Page 94 of 111
Figure 7.29: Drivers for Penetration and Digitisation
Penetration Digitisation
Forecast Evidence Forecast Evidence
Old Age Ratio X Not relevant
Urban Population Ratio X Impact
Educational Level X Impact
GDP per capita X Small Impact
Households Internet Access X Small Impact
Digital Skills X Impact X Small Impact
Mobile Broadband EU X Impact X Not relevant
Broadband EU X Small Impact X Small Impact
Corruption X Impact X Impact
Level of Centralisation X Small Impact X Small Impact
eChannel Preference X Impact X Not relevant
Lack of Trust X Small Impact
Lack of Willingness X Not relevant
Lack of Ability X Not relevant
eCommerce X Small Impact
eBanking Users X Impact X Not relevant
Internet Users EU X Not relevant
Social Media EU X Not relevant
Fulfillment of expectations X Not relevant
Perceived Benefits X Not relevant
Lack of Awareness X Small Impact
Mobile Friendly X Small Impact
Clarity X Not relevant X Not relevant
Usability X Not relevant X Not relevant
Availability X Impact X Impact
Ease of Use X Not relevant X Small Impact
7.4 Comparing country clusters to understand and improve performance
Two cluster analyses have been carried out; one for eGovernment performance (measured by the absolute
indicators) and one for contextual factors (measured by the relative indicators). The cross analysis of both
exercises puts performance in the right perspective. The purpose is to identify different policies, specific for each
country, which could suggest different policy makers to achieve relative aims. Figure 7.30 presents the map of
each country’s belongingness to the contextual group and the performance cluster.
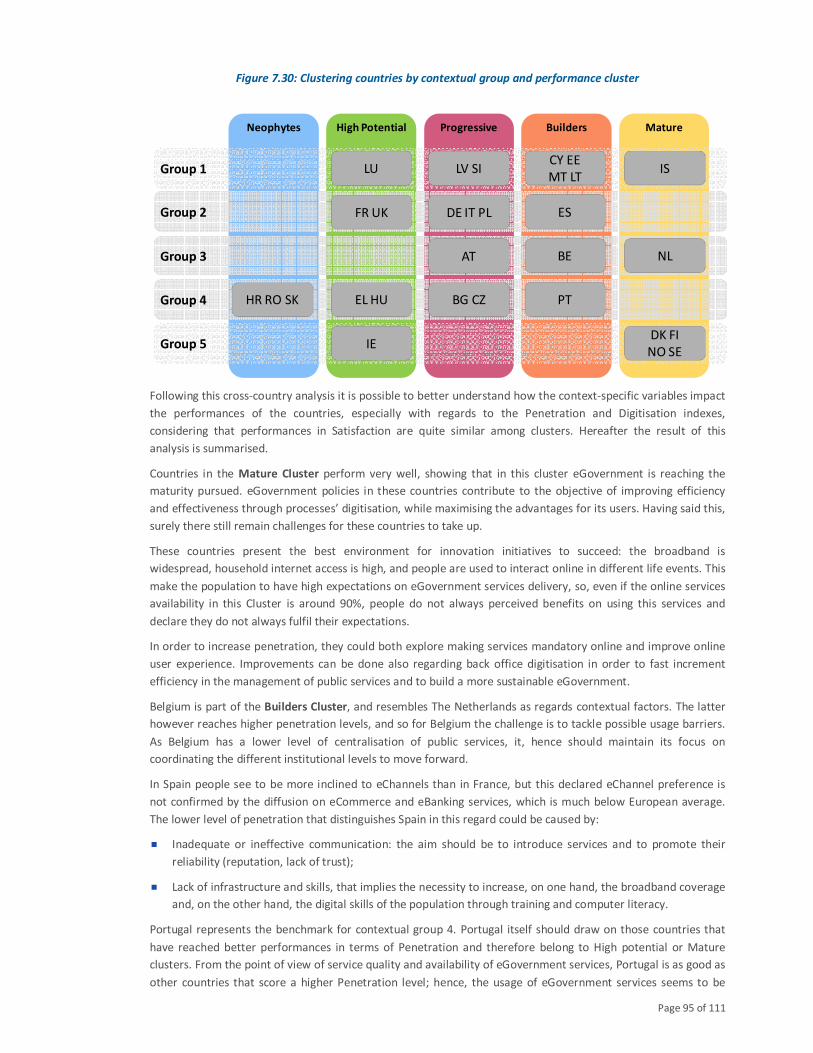
Page 95 of 111
Figure 7.30: Clustering countries by contextual group and performance cluster
Following this cross-country analysis it is possible to better understand how the context-specific variables impact
the performances of the countries, especially with regards to the Penetration and Digitisation indexes,
considering that performances in Satisfaction are quite similar among clusters. Hereafter the result of this
analysis is summarised.
Countries in the Mature Cluster perform very well, showing that in this cluster eGovernment is reaching the
maturity pursued. eGovernment policies in these countries contribute to the objective of improving efficiency
and effectiveness through processes’ digitisation, while maximising the advantages for its users. Having said this,
surely there still remain challenges for these countries to take up.
These countries present the best environment for innovation initiatives to succeed: the broadband is
widespread, household internet access is high, and people are used to interact online in different life events. This
make the population to have high expectations on eGovernment services delivery, so, even if the online services
availability in this Cluster is around 90%, people do not always perceived benefits on using this services and
declare they do not always fulfil their expectations.
In order to increase penetration, they could both explore making services mandatory online and improve online
user experience. Improvements can be done also regarding back office digitisation in order to fast increment
efficiency in the management of public services and to build a more sustainable eGovernment.
Belgium is part of the Builders Cluster, and resembles The Netherlands as regards contextual factors. The latter
however reaches higher penetration levels, and so for Belgium the challenge is to tackle possible usage barriers.
As Belgium has a lower level of centralisation of public services, it, hence should maintain its focus on
coordinating the different institutional levels to move forward.
In Spain people see to be more inclined to eChannels than in France, but this declared eChannel preference is
not confirmed by the diffusion on eCommerce and eBanking services, which is much below European average.
The lower level of penetration that distinguishes Spain in this regard could be caused by:
� Inadequate or ineffective communication: the aim should be to introduce services and to promote their
reliability (reputation, lack of trust);
� Lack of infrastructure and skills, that implies the necessity to increase, on one hand, the broadband coverage
and, on the other hand, the digital skills of the population through training and computer literacy.
Portugal represents the benchmark for contextual group 4. Portugal itself should draw on those countries that
have reached better performances in terms of Penetration and therefore belong to High potential or Mature
clusters. From the point of view of service quality and availability of eGovernment services, Portugal is as good as
other countries that score a higher Penetration level; hence, the usage of eGovernment services seems to be
Neophytes High Potential Progressive Builders Mature
Group 1
Group 2
Group 3
Group 4
Group 5
LV SI
DE IT PL
AT
BG CZ
LU
FR UK
EL HU
IE
IS
NL
DK FI
NO SE
HR RO SK
CY EE
MT LT
ES
BE
PT
Page 96 of 111
influenced by more structural factors, such as a low level of computer skills of the population. These weaknesses
imply scarce willingness to interact online, as a low level of eBanking usage and of internet access demonstrate.
Some proposals may include raising public awareness on the use of ICT, increasing digital literacy alongside a
multi-channel strategy to exploit the potential that Portugal has.
Malta, Cyprus and Lithuania have similar skill gaps and computer literacy challenges, and even use of eBanking
turns out quite low, especially in Cyprus. In Estonia digital skills, ICT infrastructure and eBanking diffusion are
above European average; eCommerce diffusion is in line with European average in Estonia and Malta, but is
much below EU average in Cyprus and Lithuania. Communication actions are necessary to make people aware
that these services exist and meet their needs, especially in Estonia where the lack of awareness is high and the
perceived benefits are low, even if eGovernment services’ quality is high.
In the Progressive Cluster, when comparing Latvia and Slovenia to countries with similar level of Digitisation and
Penetration, are affected by some structural factors that prevent improvement. These are for instance an aging
population that lives in rural areas, low digital skills and low access to the internet by households. Besides these
countries also face high perception of corruption and hence they may be affected by a greater resistance to
change. On the other side, people seem to be interested to interact online with the public sector, even compared
to other countries that are in the same cluster. This becomes clear when looking at the eChannel preferences, at
the relative good levels of eBanking usage and eCommerce diffusion slightly below EU average. In addition, when
services are available online, people seem to appreciate them (so-called high fulfilment of expectation).
Therefore, especially Latvia should primarily focus on increasing the supply of services (compared to the present
low level of availability) and on communicating these actions (compared to the present lack of awareness). The
communication must focus not only on increasing awareness of the services, but more generally on promoting
the use of technology and the internet (digital literacy). However, the relative high perception of corruption in
the public sector could be a limit for these countries to achieve same levels of performance as their peer
countries (for instance Iceland and Estonia).
Austria’s benchmark is The Netherlands, however it has a higher percentage of population living in rural areas,
with a slightly lower level of education and lower access to the internet from home. This could affect the use of
non-governmental online services, such as eCommerce and eBanking, which are less diffused, compared to The
Netherlands. On the other hand, Public Administrations in Austria seem to be more effective in coordinating
their efforts than countries that have achieved even better performances. To let Austria get closer to its
benchmark, it could rely on this asset and on an appropriate communication strategy to promote the usage of
the existing services.
The poor levels of penetration in the Czech Republic compared to Portugal do not seem to derive from a low-
interest or ability of the population to use eGovernment services, but rather by a lack of services and by the poor
ability of the public administration to provide adequate online services. In fact, in Czech Republic the level of
usage of eCommerce and eBanking services is much higher than in Portugal. The difficulty of the public sector in
digitising their processes and then in providing adequate eGovernment services seems to be conditioned by a
fragmentation of public service delivery by different institutional levels and accompanied by a low capacity in
coordinating their actions. Finally the Czech Republic face a higher perceived corruption that hampers innovation
and eGovernment.
Bulgaria, compared to its benchmark country (Portugal), is characterised by factors that make implementation of
eGovernment strategy difficult. This Member State is conditioned by a high level of corruption and by a high
fragmentation of public service delivery, and does not compensate this with an adequate coordination capability.
On the other hand, a high level of education and the fact that many people live in urban centers could facilitate
closing the performance gap, if the public sector manages to provide adequate services to the population.
In comparison with their benchmarking country (Spain), Germany faces a higher fragmentation of the
institutional levels which is challenging to counterbalance: the fact that Germany is characterised by a federal
system might affect the delivery of services to users. In fact, for Germany, other factors like broadband
penetration and digital skills would lead us to expect higher levels of Digitisation. However, in federal countries
like Germany (or Austria), eGovernment policies have to be implemented largely through coordination
mechanisms between national, regional and local public authorities rather than simply being forced top-down by
Page 97 of 111
national authorities. A stronger coordination capacity between public bodies would then positively affect the
delivery of services to users. Referring to penetration, in Germany citizens seems to be ready to use internet for
complex interactions, as the percentage of people who have already approach eCommerce and eBanking is high.
Hence in order to foster the use of eGovernment services the right strategy could be to implement an adequate
awareness communication, also aimed to improve Public Administration reputation, together with a
multichannel strategy for the people who prefer other channels to interact with public administration.
In Italy the lower level of Digitisation could be affected by:
� A lower level of digital skills existing in public administrations compared to what, for example, happens in
Spain;
� An inadequate capacity of institutions in coordinating innovation efforts;
� A high perceived level of corruption that becomes a resistance to change initiatives aimed at digitising
processes and thus their transparency.
eGoverment usage in Italy seem to be influenced by people’s socio-demographic characteristics that turn to be
older than the benchmarks (i.e. UK and France) and live more in rural areas and as well as own relatively lower
levels of education and particularly of digital skills. These factors seem to be worsen both by a lack of trust in
internet use for complex interactions, by a high level of corruption compared to the benchmark countries and by
the lack of awareness of the services that are actually available and high-quality-made (more than in the UK and
France). Therefore, it could be appropriate to implement an adequate communication strategy to promote the
use of digital services. The communication initiatives should overcome the fragmented nature of the institutional
levels, and together with multi-channel strategies, should make services available to that portion of population
who are still not ready to interact online.
Compared to the benchmark, in Poland context factors that limit Digitisation may be the availability of digital
skills and the difficulty to coordinate the efforts of the public bodies, although these factors are not likely to
jeopardize the effectiveness of an appropriate eGovernment strategy. Similar considerations can be extended to
Italy, although Poland may count on higher digital skills level.
Looking at the High Potential Cluster, Luxembourg, France and UK have to increase their degree of Digitisation in
comparison with their benchmark countries (Cyprus, Estonia and Spain). A likely element to influence the lower
Digitisation is the weak coordination between institutions in these countries. It could be that the strategy so far
has focused on putting services online and making them available for citizens, but might have been less attentive
to gain efficiency of its internal processes. Investing on solving these issues can lead not only to savings in the
management of the public administration, but also to an increase in the quality of services for citizens. The latter
is demonstrated by results achieved by other countries that have followed similar steps. Further Digitisation of
internal processes, for instance by sharing data cross-agency, could lead to further simplification and even
automation of services.
In Greece and in Hungary the problem is also the low level of Digitisation but besides that, Digitisation initiatives
must also take into account the existence of a higher level of perceived corruption that could be a factor of
resistance amongst users to any actions in this regard. In addition, Greece in comparison with Hungary and other
countries faces a lower level of digital skills of its population, comparable to, for instance, Ireland. Hence, both
these two countries will also have to envisage actions of digital literacy in order to tackle this issue. At the
moment Ireland is demonstrating important initiatives in this regard30.
Finally, in the Neophytes Cluster, both the degree of penetration and Digitisation are low. For these countries,
Portugal is a benchmark since they share similar characteristics, although neophytes must face a slightly higher
perceived level of corruption, and therefore a greater resistance to the distribution of eGovernment. On the
other hand, these countries can count on a higher reach of mobile broadband than Portugal and could leverage
on this advantage to faster improve their level of penetration.
30
Such as Fast Track to IT - http://eskills4jobs.ec.europa.eu/ireland
Page 98 of 111
7.5 Improving the framework: considerations for future applications
The two-step framework represents a new approach, proposing an innovative point of view, which can be useful
in order to understand the meaning of a country gap of performance and to suggest a possible way to overcome
this gap. Nonetheless, the analysis has been applied with indicators, which on the one hand have some missing
data, and on the other hand not always are the best proxy for the proposed framework.
Future analyses can evolve to increase the validity and the relevance of the implications, and to improve the
type, the quality and the quantity of data collected for the analysis.
In the analysis presented, Authentic Sources and Automated Service Variables, as proxies of public
administration’s efficiency and effectiveness in internal procedure and services supply, compose the Digitisation
index. Actually, to understand how a public administration is managing the digitisation of its processes, it would
be more appropriate to collect specific data, and would be useful to build efficiency and effectiveness indicators,
through a survey to public entities.
Furthermore, the relative variables used in the second step of the analysis can be extended as well, including
historical data, in order to strengthen and to increase the accuracy of construction of the groups. This could be
possible in the next years, when historical series will be available.
In the actual framework, eGovernment maturity refers to the maturity of the online services. Nonetheless, as
showed in the analysis, eGovernment maturity could be affected by different factors and then have different
meanings depending on the specific referring context. Hence, nowadays there are some countries where online
availability can actually be difficult to achieve, because its people are not ready yet to go online. It is interesting
to notice that in some Groups there are no countries which have reached the Mature Stage. Forcing ‘digital by
default’ when citizens are not ready to use online services or they do not have the possibility to use them, can be
the wrong eGovernment strategy. In these countries, different strategies can be applied in order to improve
efficiency and effectiveness of public administration, while maximising benefits for its users: for example by
digitising the back office first and offering a multi-channel front office.
So, also the other indicators used to qualify the eGovernment maturity of a country could be revised in order to
take into consideration more aspects: for example, the indicator “Penetration”, which now represents the
number of internet users that use eGovernment services could also take into consideration the people that
interact with public administration trough other innovative channels such as totem, retails, and banks if this fits
within an eGovernment multi-channel strategy. Furthermore, the proposed framework, and the identification of
homogeneous groups of countries, suggests that a deeper analysis could be done to compare the eGovernment
strategies and policies of countries belonging to the same Group and hence possibly identifying the best
eGovernment pattern for each homogenous group. This implies also that it is not possible to identify an absolute
eGovernment benchmark but more relative ones to be find within each homogenous group.
In the future, studies will also take account of the extent to which eGovernment provision is affected by welfare
state features (which rely on the capacity of the welfare state to secure social rights). Hence, further analysis will
want to acknowledge how entitlements are distributed to citizens, the degree of state’s generosity in providing
welfare, the distribution of welfare provision among state, family and market (private/ public mix).
Finally, present and future analysis shall also consider the actual capacity of governments to respond to social
change, as eGovernment belongs to this process. The circumstances that permitted the welfare state expansion
in the post war (growth, full employment, national autonomy) progressively reversed in a challenging scenario.
Historical evidence hardly suggests that the response of welfare states to these challenges is shrinking
entitlements. But it is to be reckoned that this condition of permanent austerity influences the extent to which
governments are likely to expand and reinforce services delivered to citizens, and contributes to orient
governments’ responses to specific social needs.

Page 99 of 111
Annex I: Country Reports
Released separately on European Commission website.
Page 100 of 111
Annex II: Explanation of indicators in common language
User Centricity
The top-level benchmark User Centricity indicates to what extent (information about) a service is provided
online and how this is perceived.
It consists in 4 indicators. Two indicators look into what is provided for online by governments:
1. Online Availability: indicates if a service is online. Ranging from offline (0%), only information online
(50%), fully online (100%).
Measures the extent to which citizens and businesses can finalise a process step/ obtain a service within a
life event online. A 100% score for Online Availability means the service can be obtained online from start to
finish and can be accessed through the website of the responsible authority and through a central
government portal. If not through portal, the service scores 75%. A 50% score on Online availability means
that although information can be found online on both the website of the responsible authority and through
a central government portal (if not through portal: 25%), the citizen or business still needs to use paper or
physically visit the authority to actually obtain the service.
2. Usability: indicates if support, help and (interactive) feedback functionalities are online.
Measures the extent to which the central government portals facilitate the citizen or business in obtaining
the service. By facilitation, we mean the citizen or business is able to identify and contact the responsible
authority, to receive support (e.g. through FAQs, demos, chat functionality, social media) and to provide
feedback online. The indicator consists of 7 parameters, the score indicates how many of these are online.
Two indicators assess how these functionalities are perceived:
3. Ease of Use: quality assessment researchers indicating how intuitive and smooth the process steps can be
completed.
It assesses the extent to which the citizen or business is able to find his way through the process steps in a
life event smoothly. The mystery shoppers therefore evaluate the complete life event (beginning to end) on
a scale of 1-10, addressing the extent to which he has reached his goal, he was able to understand what he
was supposed to do to obtain the service, he found the succession of process steps logical and he was
actively engaged to improve the service.
4. Speed of Use: quality assessment researchers indicating if the process steps could be completed within
reasonable amount of time.
Assesses the extent to which the citizen or business is able to complete the required process steps in a life
event within a reasonable amount of time. The mystery shopper therefore evaluate the complete life event
(beginning to end) on a scale of 1-10, addressing the extent to which he could quickly submit his information
to the authority (or information was pre-filled), the time he needed to obtain the service and the extent to
which the services were structured efficiently.
Indicators 2, 3 and 4 are aggregated into one synthetic indicator called Online Usability. Together with the
indicator for Online Availability, the User Centricity benchmark is composed.
Page 101 of 111
Transparency
The top-level benchmark Transparency indicates to what extent governments are transparent as regards a)
their own responsibilities and performance, b) the process of service delivery and c) personal data involved.
The Transparency benchmark is composed of three indicators:
1. Transparency of Public Organisations: indicates to what extent governments are transparent as regards
their own responsibilities and performance.
Measures the transparency of government organisations which are end responsible for the policies,
regulations and services in a life event, but are not necessarily the service provider. Mystery shoppers assess
the extent to which the organisations provide information on their responsibilities, the organisational
structure, regulation and policy making processes and monitoring methods and results.
2. Transparency of Service Delivery: indicates to what extent governments are transparent as regards the
process of service delivery.
Measures the transparency of the life event’s service providers with regards to the service delivery process,
i.e. the length of the process, the progress made, the delivery timelines and the service performance.
3. Transparency of Personal data: indicates to what extent governments are transparent as regards personal
data involved.
Measures the transparency of the central government portals with regards to how governments store
Personal data, and the level of access of citizens and business to their personal data and possibilities to
modify data and notify or complain to the government on the quality or the use of their personal data.
7.5.1.1 Single market mobility
The top-level benchmark Single Market mobility indicates to what extent EU citizens can use online services in
another country. It measures the availability and usability of cross-border eGovernment services, i.e. if services
in country A can be used by someone from country B. For this benchmark, the same indicators as for User
Centricity are used:
1. Online availability: indicates if a service is online. Ranging from offline (0%), only information online
(50%), fully online (100%).
Measures the extent to which citizens and businesses can finalise a process step/ obtain a service within a
life event online from abroad. A 100% score on Online availability means the service can be obtained online
from start to finish and can be accessed through the website of the responsible authority. A 50% score on
Online availability means that although information can be found online, the citizen or business still needs to
use paper or physically visit the authority to actually obtain the service.
2. Usability: indicates if support, help and (interactive) feedback functionalities are online.
Measures the extent to which the central government portals facilitate the foreign citizen or business in
obtaining the service. By facilitation, we mean the citizen or business is able to identify and contact the
responsible authority, to receive support (e.g. through FAQs, demos, chat functionality, social media) and to
provide feedback online.
3. Ease of Use: quality assessment researchers indicating how intuitive and smooth the process steps can be
completed.
Assesses the extent to which the foreign citizen or business is able to walk through the process steps in a life
event smoothly. The mystery shopper therefore scores all services within one life event on a scale of 1-10,
addressing the extent to which he has reached his goal, he was able to understand what he was supposed to
do to obtain the service, he found the succession of process steps logical and he was actively engaged to
improve the service.
4. Speed of Use: quality assessment researchers indicating if the process steps could be completed within
reasonable amount of time.
Page 102 of 111
Assesses the extent to which the foreign citizen or business is able to complete the required process steps in
a life event within a reasonable amount of time. The mystery shopper therefore scores all services within
one life event on a scale of 1-10, addressing the extent to which he could quickly submit his information to
the authority (or information was pre-filled), the time he needed to obtain the service and the extent to
which the services were structured efficiently
Indicator 2, 3 and 4 are aggregated into one synthetic indicator called cross border index for Online Usability.
Together with the cross border index for Online Availability, the benchmark of Single Market Mobility is
composed.
7.5.1.2 Key Enablers
The top-level benchmark Key enablers indicates the extent to which 5 technical pre-conditions are available
online. It measures the extent to which governments have the technical pre-conditions in place to realise
efficient and effective online services. The Mystery shoppers assess the availability of five Key enablers in each of
the life events:
1. Electronic Identification (eID): the Mystery shoppers indicate for each life event service whether there is a
need for authentication and if yes, if the citizen or business is able to authenticate online through a national
eID (usable for multiple services provided by multiple government authorities) or through a specific
identifier (usable for only one service or only one government authority).
2. Electronic documents (eDocuments): the Mystery shoppers indicate for each life event service whether
there is a need for sending or receiving a document and whether this can be done directly online (not
through e-mail) in a secure way (i.e. the digital documents are authenticated).
3. Authentic Sources: the Mystery shoppers indicate for each life event service whether he should provide
personal information (e.g. through a form) and whether this information is automatically pre-filled by the
service provider (based on data from Authentic Sources such as National register, Tax registers, Company
registers etc.)
4. Electronic Safe (eSafe): the Mystery shoppers indicate per central government portal if an eSafe solution is
available for secure storage and retrieval of eDocuments.
5. Single Sign On (SSO): the Mystery shoppers indicate per central government portal if by logging in once he
can gain access to other participating systems (i.e. multiple eGovernment services/websites) without being
prompted to log in again.
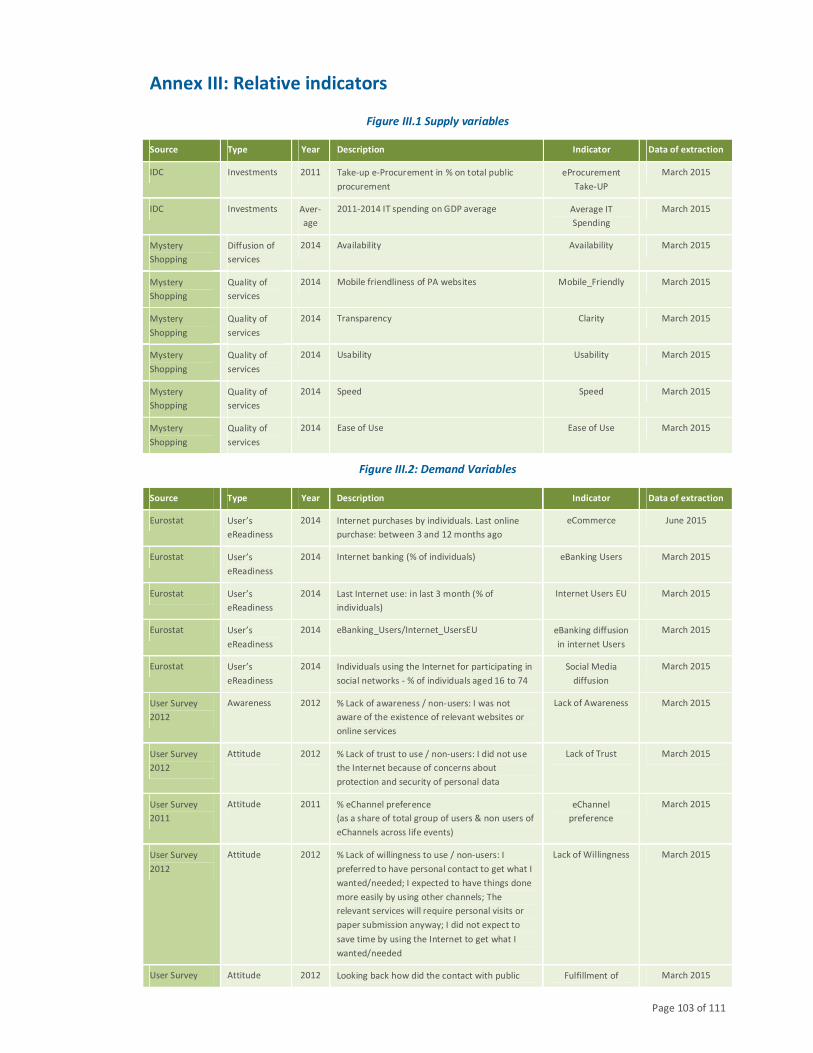
Page 103 of 111
Annex III: Relative indicators
Figure III.1 Supply variables
Source Type Year Description Indicator Data of extraction
IDC Investments 2011 Take-up e-Procurement in % on total public
procurement
eProcurement
Take-UP
March 2015
IDC Investments Aver-
age
2011-2014 IT spending on GDP average Average IT
Spending
March 2015
Mystery
Shopping
Diffusion of
services
2014 Availability Availability March 2015
Mystery
Shopping
Quality of
services
2014 Mobile friendliness of PA websites Mobile_Friendly March 2015
Mystery
Shopping
Quality of
services
2014 Transparency Clarity March 2015
Mystery
Shopping
Quality of
services
2014 Usability Usability March 2015
Mystery
Shopping
Quality of
services
2014 Speed Speed March 2015
Mystery
Shopping
Quality of
services
2014 Ease of Use Ease of Use March 2015
Figure III.2: Demand Variables
Source Type Year Description Indicator Data of extraction
Eurostat User’s
eReadiness
2014 Internet purchases by individuals. Last online
purchase: between 3 and 12 months ago
eCommerce June 2015
Eurostat User’s
eReadiness
2014 Internet banking (% of individuals) eBanking Users March 2015
Eurostat User’s
eReadiness
2014 Last Internet use: in last 3 month (% of
individuals)
Internet Users EU March 2015
Eurostat User’s
eReadiness
2014 eBanking_Users/Internet_UsersEU eBanking diffusion
in internet Users
March 2015
Eurostat User’s
eReadiness
2014 Individuals using the Internet for participating in
social networks - % of individuals aged 16 to 74
Social Media
diffusion
March 2015
User Survey
2012
Awareness 2012 % Lack of awareness / non-users: I was not
aware of the existence of relevant websites or
online services
Lack of Awareness March 2015
User Survey
2012
Attitude 2012 % Lack of trust to use / non-users: I did not use
the Internet because of concerns about
protection and security of personal data
Lack of Trust March 2015
User Survey
2011
Attitude 2011 % eChannel preference
(as a share of total group of users & non users of
eChannels across life events)
eChannel
preference
March 2015
User Survey
2012
Attitude 2012 % Lack of willingness to use / non-users: I
preferred to have personal contact to get what I
wanted/needed; I expected to have things done
more easily by using other channels; The
relevant services will require personal visits or
paper submission anyway; I did not expect to
save time by using the Internet to get what I
wanted/needed
Lack of Willingness March 2015
User Survey Attitude 2012 Looking back how did the contact with public Fulfillment of March 2015
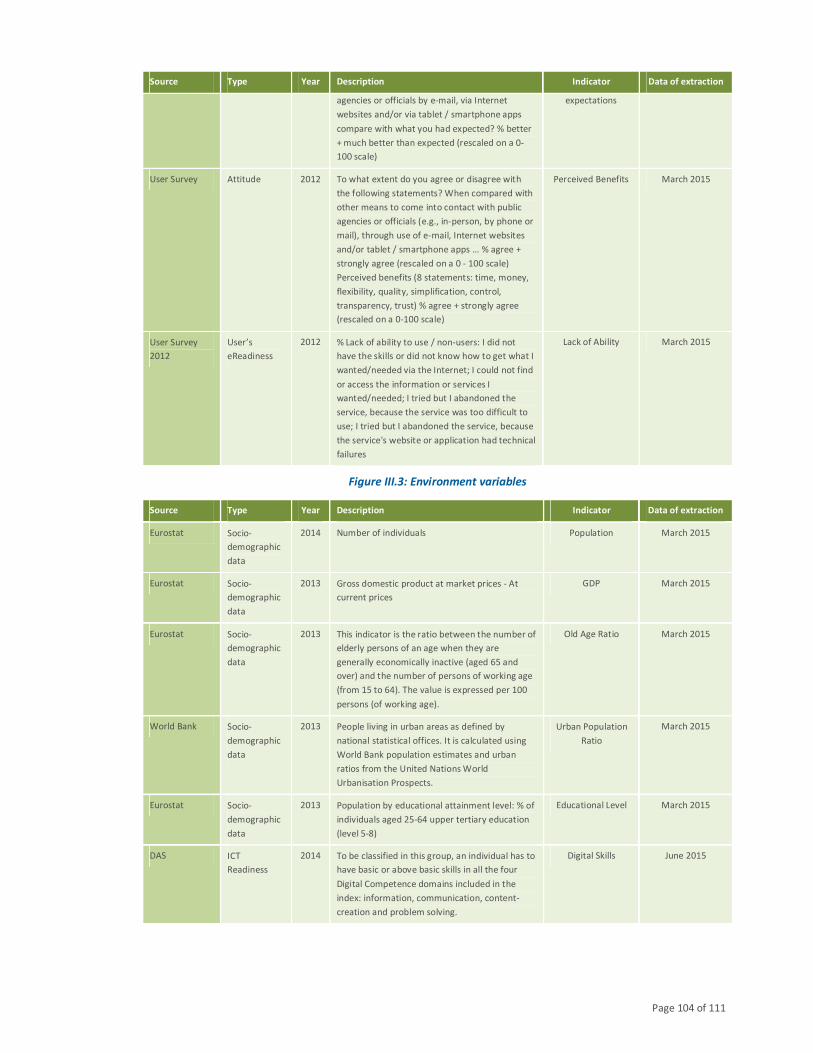
Page 104 of 111
Source Type Year Description Indicator Data of extraction
agencies or officials by e-mail, via Internet
websites and/or via tablet / smartphone apps
compare with what you had expected? % better
+ much better than expected (rescaled on a 0-
100 scale)
expectations
User Survey Attitude 2012 To what extent do you agree or disagree with
the following statements? When compared with
other means to come into contact with public
agencies or officials (e.g., in-person, by phone or
mail), through use of e-mail, Internet websites
and/or tablet / smartphone apps … % agree +
strongly agree (rescaled on a 0 - 100 scale)
Perceived benefits (8 statements: time, money,
flexibility, quality, simplification, control,
transparency, trust) % agree + strongly agree
(rescaled on a 0-100 scale)
Perceived Benefits March 2015
User Survey
2012
User’s
eReadiness
2012 % Lack of ability to use / non-users: I did not
have the skills or did not know how to get what I
wanted/needed via the Internet; I could not find
or access the information or services I
wanted/needed; I tried but I abandoned the
service, because the service was too difficult to
use; I tried but I abandoned the service, because
the service's website or application had technical
failures
Lack of Ability March 2015
Figure III.3: Environment variables
Source Type Year Description Indicator Data of extraction
Eurostat Socio-
demographic
data
2014 Number of individuals Population March 2015
Eurostat Socio-
demographic
data
2013 Gross domestic product at market prices - At
current prices
GDP March 2015
Eurostat Socio-
demographic
data
2013 This indicator is the ratio between the number of
elderly persons of an age when they are
generally economically inactive (aged 65 and
over) and the number of persons of working age
(from 15 to 64). The value is expressed per 100
persons (of working age).
Old Age Ratio March 2015
World Bank Socio-
demographic
data
2013 People living in urban areas as defined by
national statistical offices. It is calculated using
World Bank population estimates and urban
ratios from the United Nations World
Urbanisation Prospects.
Urban Population
Ratio
March 2015
Eurostat Socio-
demographic
data
2013 Population by educational attainment level: % of
individuals aged 25-64 upper tertiary education
(level 5-8)
Educational Level March 2015
DAS ICT
Readiness
2014 To be classified in this group, an individual has to
have basic or above basic skills in all the four
Digital Competence domains included in the
index: information, communication, content-
creation and problem solving.
Digital Skills June 2015
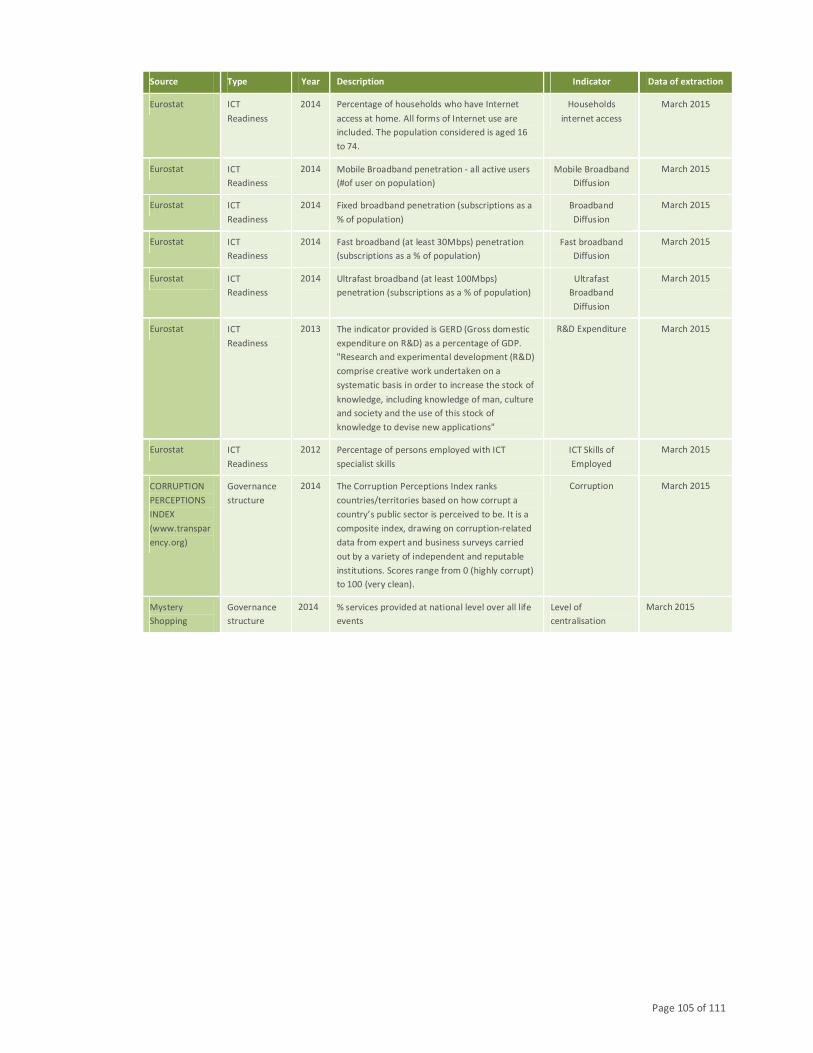
Page 105 of 111
Source Type Year Description Indicator Data of extraction
Eurostat ICT
Readiness
2014 Percentage of households who have Internet
access at home. All forms of Internet use are
included. The population considered is aged 16
to 74.
Households
internet access
March 2015
Eurostat ICT
Readiness
2014 Mobile Broadband penetration - all active users
(#of user on population)
Mobile Broadband
Diffusion
March 2015
Eurostat ICT
Readiness
2014 Fixed broadband penetration (subscriptions as a
% of population)
Broadband
Diffusion
March 2015
Eurostat ICT
Readiness
2014 Fast broadband (at least 30Mbps) penetration
(subscriptions as a % of population)
Fast broadband
Diffusion
March 2015
Eurostat ICT
Readiness
2014 Ultrafast broadband (at least 100Mbps)
penetration (subscriptions as a % of population)
Ultrafast
Broadband
Diffusion
March 2015
Eurostat ICT
Readiness
2013 The indicator provided is GERD (Gross domestic
expenditure on R&D) as a percentage of GDP.
"Research and experimental development (R&D)
comprise creative work undertaken on a
systematic basis in order to increase the stock of
knowledge, including knowledge of man, culture
and society and the use of this stock of
knowledge to devise new applications"
R&D Expenditure March 2015
Eurostat ICT
Readiness
2012 Percentage of persons employed with ICT
specialist skills
ICT Skills of
Employed
March 2015
CORRUPTION
PERCEPTIONS
INDEX
(www.transpar
ency.org)
Governance
structure
2014 The Corruption Perceptions Index ranks
countries/territories based on how corrupt a
country’s public sector is perceived to be. It is a
composite index, drawing on corruption-related
data from expert and business surveys carried
out by a variety of independent and reputable
institutions. Scores range from 0 (highly corrupt)
to 100 (very clean).
Corruption March 2015
Mystery
Shopping
Governance
structure
2014 % services provided at national level over all life
events
Level of
centralisation
March 2015
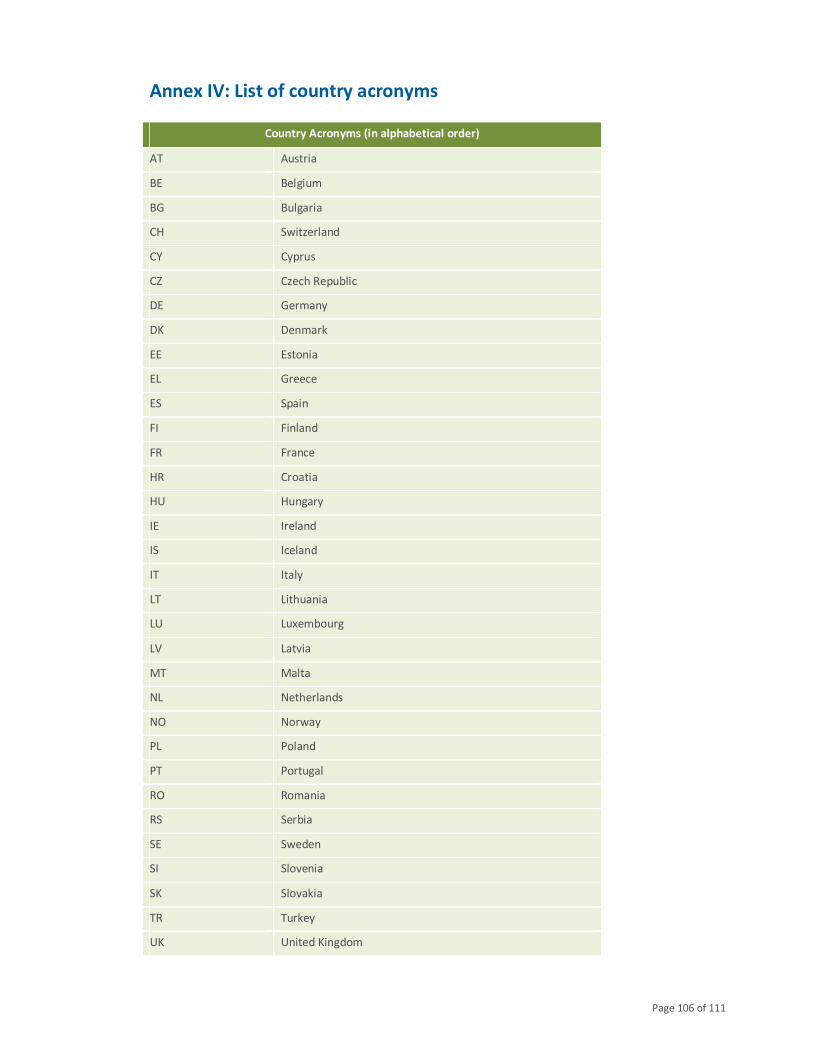
Page 106 of 111
Annex IV: List of country acronyms
Country Acronyms (in alphabetical order)
AT Austria
BE Belgium
BG Bulgaria
CH Switzerland
CY Cyprus
CZ Czech Republic
DE Germany
DK Denmark
EE Estonia
EL Greece
ES Spain
FI Finland
FR France
HR Croatia
HU Hungary
IE Ireland
IS Iceland
IT Italy
LT Lithuania
LU Luxembourg
LV Latvia
MT Malta
NL Netherlands
NO Norway
PL Poland
PT Portugal
RO Romania
RS Serbia
SE Sweden
SI Slovenia
SK Slovakia
TR Turkey
UK United Kingdom
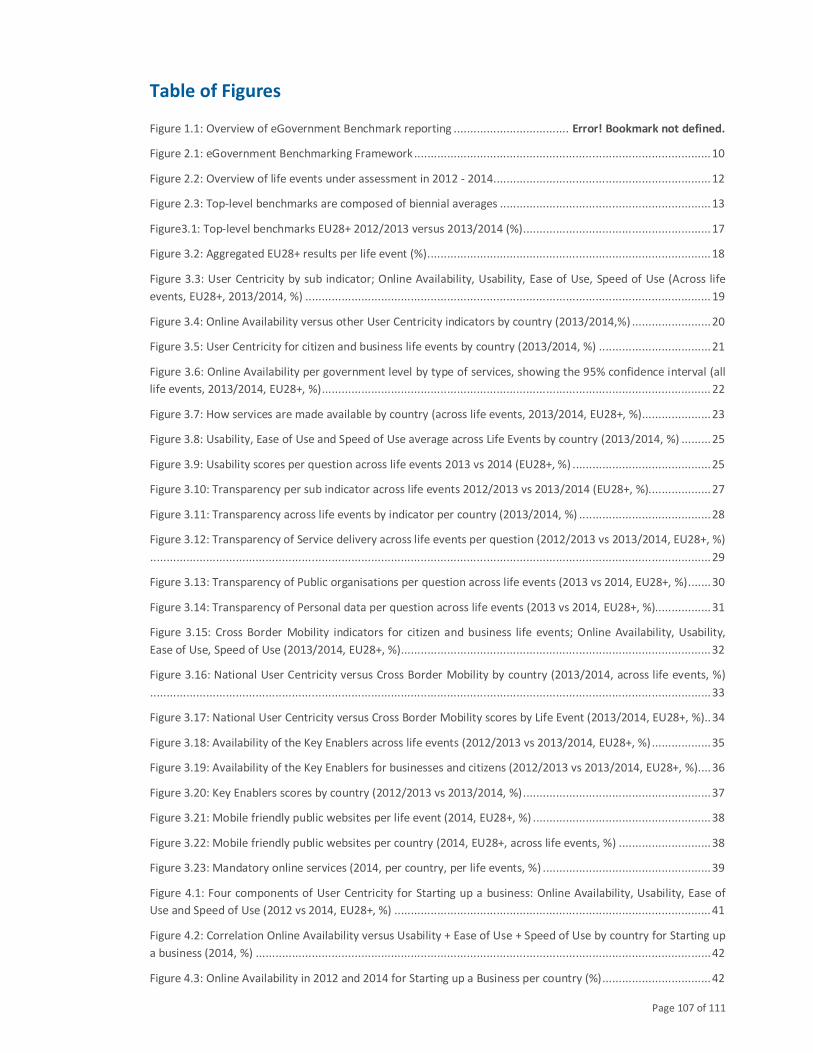
Page 107 of 111
Table of Figures
Figure 1.1: Overview of eGovernment Benchmark reporting ................................... Error! Bookmark not defined.
Figure 2.1: eGovernment Benchmarking Framework .......................................................................................... 10
Figure 2.2: Overview of life events under assessment in 2012 - 2014 .................................................................. 12
Figure 2.3: Top-level benchmarks are composed of biennial averages ................................................................ 13
Figure3.1: Top-level benchmarks EU28+ 2012/2013 versus 2013/2014 (%) ......................................................... 17
Figure 3.2: Aggregated EU28+ results per life event (%) ...................................................................................... 18
Figure 3.3: User Centricity by sub indicator; Online Availability, Usability, Ease of Use, Speed of Use (Across life
events, EU28+, 2013/2014, %) ........................................................................................................................... 19
Figure 3.4: Online Availability versus other User Centricity indicators by country (2013/2014,%) ........................ 20
Figure 3.5: User Centricity for citizen and business life events by country (2013/2014, %) .................................. 21
Figure 3.6: Online Availability per government level by type of services, showing the 95% confidence interval (all
life events, 2013/2014, EU28+, %) ...................................................................................................................... 22
Figure 3.7: How services are made available by country (across life events, 2013/2014, EU28+, %) ..................... 23
Figure 3.8: Usability, Ease of Use and Speed of Use average across Life Events by country (2013/2014, %) ......... 25
Figure 3.9: Usability scores per question across life events 2013 vs 2014 (EU28+, %) .......................................... 25
Figure 3.10: Transparency per sub indicator across life events 2012/2013 vs 2013/2014 (EU28+, %)................... 27
Figure 3.11: Transparency across life events by indicator per country (2013/2014, %) ........................................ 28
Figure 3.12: Transparency of Service delivery across life events per question (2012/2013 vs 2013/2014, EU28+, %)
.......................................................................................................................................................................... 29
Figure 3.13: Transparency of Public organisations per question across life events (2013 vs 2014, EU28+, %) ....... 30
Figure 3.14: Transparency of Personal data per question across life events (2013 vs 2014, EU28+, %)................. 31
Figure 3.15: Cross Border Mobility indicators for citizen and business life events; Online Availability, Usability,
Ease of Use, Speed of Use (2013/2014, EU28+, %) .............................................................................................. 32
Figure 3.16: National User Centricity versus Cross Border Mobility by country (2013/2014, across life events, %)
.......................................................................................................................................................................... 33
Figure 3.17: National User Centricity versus Cross Border Mobility scores by Life Event (2013/2014, EU28+, %).. 34
Figure 3.18: Availability of the Key Enablers across life events (2012/2013 vs 2013/2014, EU28+, %) .................. 35
Figure 3.19: Availability of the Key Enablers for businesses and citizens (2012/2013 vs 2013/2014, EU28+, %) .... 36
Figure 3.20: Key Enablers scores by country (2012/2013 vs 2013/2014, %) ......................................................... 37
Figure 3.21: Mobile friendly public websites per life event (2014, EU28+, %) ...................................................... 38
Figure 3.22: Mobile friendly public websites per country (2014, EU28+, across life events, %) ............................ 38
Figure 3.23: Mandatory online services (2014, per country, per life events, %) ................................................... 39
Figure 4.1: Four components of User Centricity for Starting up a business: Online Availability, Usability, Ease of
Use and Speed of Use (2012 vs 2014, EU28+, %) ................................................................................................ 41
Figure 4.2: Correlation Online Availability versus Usability + Ease of Use + Speed of Use by country for Starting up
a business (2014, %) .......................................................................................................................................... 42
Figure 4.3: Online Availability in 2012 and 2014 for Starting up a Business per country (%) ................................. 42
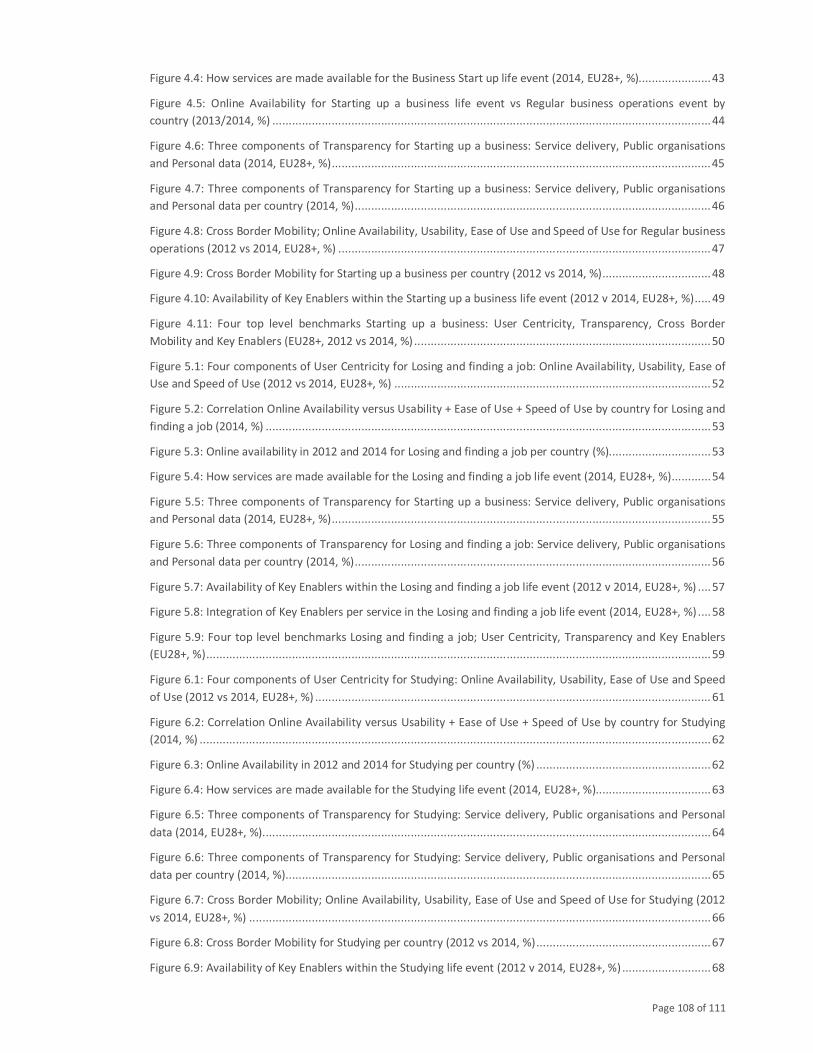
Page 108 of 111
Figure 4.4: How services are made available for the Business Start up life event (2014, EU28+, %)...................... 43
Figure 4.5: Online Availability for Starting up a business life event vs Regular business operations event by
country (2013/2014, %) ..................................................................................................................................... 44
Figure 4.6: Three components of Transparency for Starting up a business: Service delivery, Public organisations
and Personal data (2014, EU28+, %) ................................................................................................................... 45
Figure 4.7: Three components of Transparency for Starting up a business: Service delivery, Public organisations
and Personal data per country (2014, %) ............................................................................................................ 46
Figure 4.8: Cross Border Mobility; Online Availability, Usability, Ease of Use and Speed of Use for Regular business
operations (2012 vs 2014, EU28+, %) ................................................................................................................. 47
Figure 4.9: Cross Border Mobility for Starting up a business per country (2012 vs 2014, %) ................................. 48
Figure 4.10: Availability of Key Enablers within the Starting up a business life event (2012 v 2014, EU28+, %) ..... 49
Figure 4.11: Four top level benchmarks Starting up a business: User Centricity, Transparency, Cross Border
Mobility and Key Enablers (EU28+, 2012 vs 2014, %) .......................................................................................... 50
Figure 5.1: Four components of User Centricity for Losing and finding a job: Online Availability, Usability, Ease of
Use and Speed of Use (2012 vs 2014, EU28+, %) ................................................................................................ 52
Figure 5.2: Correlation Online Availability versus Usability + Ease of Use + Speed of Use by country for Losing and
finding a job (2014, %) ....................................................................................................................................... 53
Figure 5.3: Online availability in 2012 and 2014 for Losing and finding a job per country (%)............................... 53
Figure 5.4: How services are made available for the Losing and finding a job life event (2014, EU28+, %) ............ 54
Figure 5.5: Three components of Transparency for Starting up a business: Service delivery, Public organisations
and Personal data (2014, EU28+, %) ................................................................................................................... 55
Figure 5.6: Three components of Transparency for Losing and finding a job: Service delivery, Public organisations
and Personal data per country (2014, %) ............................................................................................................ 56
Figure 5.7: Availability of Key Enablers within the Losing and finding a job life event (2012 v 2014, EU28+, %) .... 57
Figure 5.8: Integration of Key Enablers per service in the Losing and finding a job life event (2014, EU28+, %) .... 58
Figure 5.9: Four top level benchmarks Losing and finding a job; User Centricity, Transparency and Key Enablers
(EU28+, %) ......................................................................................................................................................... 59
Figure 6.1: Four components of User Centricity for Studying: Online Availability, Usability, Ease of Use and Speed
of Use (2012 vs 2014, EU28+, %) ........................................................................................................................ 61
Figure 6.2: Correlation Online Availability versus Usability + Ease of Use + Speed of Use by country for Studying
(2014, %) ........................................................................................................................................................... 62
Figure 6.3: Online Availability in 2012 and 2014 for Studying per country (%) ..................................................... 62
Figure 6.4: How services are made available for the Studying life event (2014, EU28+, %)................................... 63
Figure 6.5: Three components of Transparency for Studying: Service delivery, Public organisations and Personal
data (2014, EU28+, %) ........................................................................................................................................ 64
Figure 6.6: Three components of Transparency for Studying: Service delivery, Public organisations and Personal
data per country (2014, %) ................................................................................................................................. 65
Figure 6.7: Cross Border Mobility; Online Availability, Usability, Ease of Use and Speed of Use for Studying (2012
vs 2014, EU28+, %) ............................................................................................................................................ 66
Figure 6.8: Cross Border Mobility for Studying per country (2012 vs 2014, %) ..................................................... 67
Figure 6.9: Availability of Key Enablers within the Studying life event (2012 v 2014, EU28+, %) ........................... 68
Page 109 of 111
Figure 6.10: Integration of Key Enablers per service in the Studying life event (2014, EU28+, %) ......................... 68
Figure 6.11: Four top level benchmarks Studying: User Centricity, Transparency, Cross Border Mobility and Key
Enablers (EU28+, %) ........................................................................................................................................... 69
Figure 7.1: Relationship between eGovernment policy priorities and absolute indicators ................................... 71
Figure 7.2: Action to improve eGovernment maturity......................................................................................... 72
Figure 7.3: Penetration – Satisfaction Scenarios ................................................................................................. 73
Figure 7.4: Penetration - Digitisation Scenarios .................................................................................................. 73
Figure 7.5: Satisfaction - Digitisation Scenarios ................................................................................................... 74
Figure 7.6: eGovernment maturity framework ................................................................................................... 75
Figure 7.7: Indicators valorisation ...................................................................................................................... 77
Figure 7.8: eGovernment performance scores (on absolute indicators) for individual countries .......................... 78
Figure 7.9: Clusters of countries with similar eGovernment Maturity .................................................................. 79
Figure 7.10: eGovernment performance scores (on absolute indicators) for clusters .......................................... 80
Figure 7.11: Group of countries with homogeneous context............................................................................... 80
Figure 7.12: Impact of context variables on Penetration and Digitisation ............................................................ 82
Figure 7.13: Comparing Penetration with Old Age Ratio ..................................................................................... 83
Figure 7.14: Comparing Penetration with Urban Population Ratio ...................................................................... 84
Figure 7.15: Comparing Penetration with Educational Level ............................................................................... 84
Figure 7.16: Comparing Penetration with GDP per Capita ................................................................................... 85
Figure 7.17: Comparing Penetration and Digitisation with Digital Skills ............................................................... 85
Figure 7.18: Comparing Penetration with Households Internet Access................................................................ 86
Figure 7.19: Comparing Penetration and Digitisation with Mobile Broadband diffusion ...................................... 86
Figure 7.20: Comparing Penetration and Digitisation with Broadband diffusion .................................................. 87
Figure 7.21: Comparing Penetration and Digitisation with Corruption Index ....................................................... 87
Figure 7.22: Comparing Penetration and Digitisation with Level of Centralisation ............................................... 88
Figure 7.23: Comparing Penetration and Digitisation with Availability ................................................................ 88
Figure 7.24: Comparing Penetration and Digitisation with Usability and Ease of Use ........................................... 89
Figure 7.25: Comparing Penetration with Mobile Friendliness ............................................................................ 90
Figure 7.26: Comparing Penetration and Digitisation with lack of ability, eCommerce Diffusion and eBanking users
.......................................................................................................................................................................... 91
Figure 7.27: Comparing Penetration and Digitisation with lack of awareness ...................................................... 92
Figure 7.28: Comparing Penetration and Digitisation with lack of trust, eChannel Preference, lack of willingness,
fulfilment of expectation, Perceived Benefits ..................................................................................................... 93
Figure 7.29: Drivers for Penetration and Digitisation .......................................................................................... 94
Figure 7.30: Clustering countries by contextual group and performance cluster ................................................. 95
Page 110 of 111
European Commission
Future-proofing eGovernment for a Digital Single Market
‘An assessment of digital public service delivery in Europe’
eGovernment Benchmark
Insight report
Luxembourg, Publications Office of the European Union
2015 – 110 pages
ISBN: 978-92-79-48427-8
DOI: 10.2759/687905

-
KK
-03
-13
-10
7-E
N-N