Embed Size (px)
Citation preview

Kje
ldahl G
uid
e
KjeldahlGuide

KjeldahlGuide

Impressum
Author Dr. Huldrych Egli
Publisher BÜCHI Labortechnik AG, CH-9230 Flawil, Switzerland
Layout dfmedia, CH-9230 Flawil, Switzerland
CTP and Printing by dfmedia, CH-9230 Flawil, Switzerland
Bound by Brülisauer Buchbinderei AG, CH-9201 Gossau
Copyright © 2008 by BÜCHI Labortechnik AG, CH-9230 Flawil
All rights reserved. No part of this book may be reprinted, or reproduced, or utilized in any form or by any electronic or mechanical means, now known or hereafter invented, including photocopying and recording, or in any information storage and retrieval system, without permission in writing from the publisher.
Second editionPrinted in Switzerland
ISBN 978-3-033-03100-5
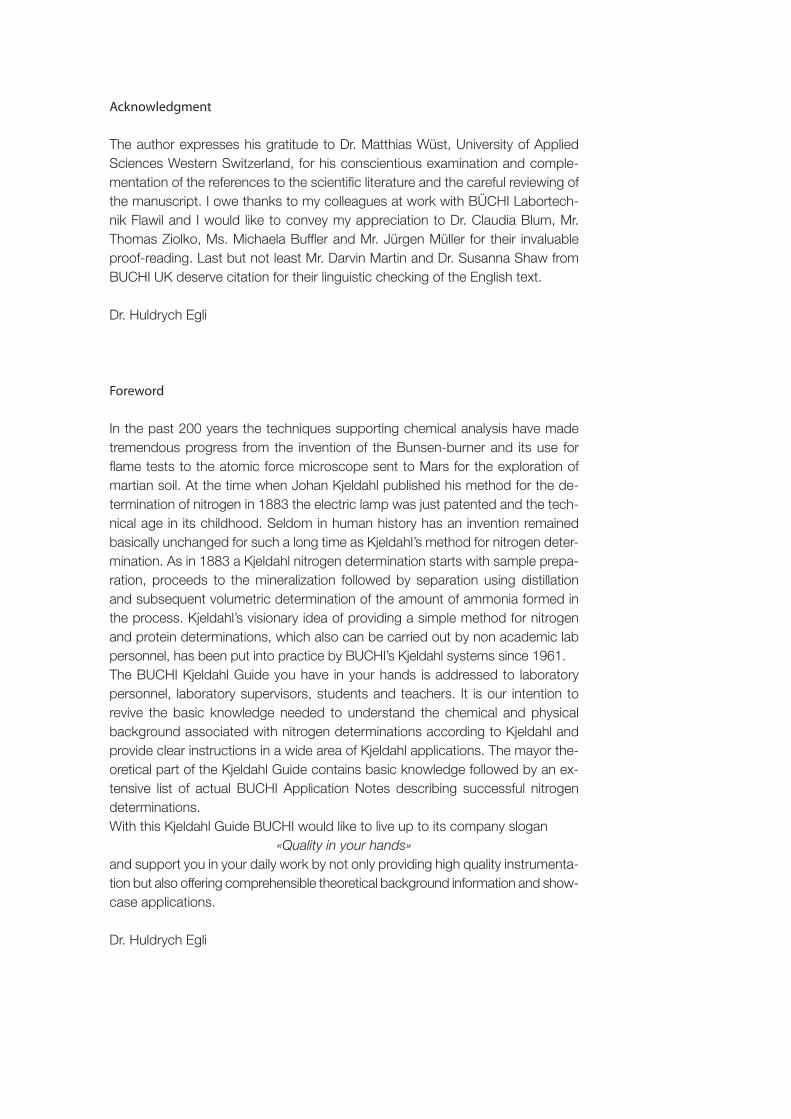
Acknowledgment
The author expresses his gratitude to Dr. Matthias Wüst, University of Applied Sciences Western Switzerland, for his conscientious examination and comple-mentation of the references to the scientific literature and the careful reviewing of the manuscript. I owe thanks to my colleagues at work with BÜCHI Labortech-nik Flawil and I would like to convey my appreciation to Dr. Claudia Blum, Mr. Thomas Ziolko, Ms. Michaela Buffler and Mr. Jürgen Müller for their invaluable proof-reading. Last but not least Mr. Darvin Martin and Dr. Susanna Shaw from BUCHI UK deserve citation for their linguistic checking of the English text.
Dr. Huldrych Egli
Foreword
In the past 200 years the techniques supporting chemical analysis have made tremendous progress from the invention of the Bunsen-burner and its use for flame tests to the atomic force microscope sent to Mars for the exploration of martian soil. At the time when Johan Kjeldahl published his method for the de-termination of nitrogen in 1883 the electric lamp was just patented and the tech-nical age in its childhood. Seldom in human history has an invention remained basically unchanged for such a long time as Kjeldahl’s method for nitrogen deter-mination. As in 1883 a Kjeldahl nitrogen determination starts with sample prepa-ration, proceeds to the mineralization followed by separation using distillation and subsequent volumetric determination of the amount of ammonia formed in the process. Kjeldahl’s visionary idea of providing a simple method for nitrogen and protein determinations, which also can be carried out by non academic lab personnel, has been put into practice by BUCHI’s Kjeldahl systems since 1961.The BUCHI Kjeldahl Guide you have in your hands is addressed to laboratory personnel, laboratory supervisors, students and teachers. It is our intention to revive the basic knowledge needed to understand the chemical and physical background associated with nitrogen determinations according to Kjeldahl and provide clear instructions in a wide area of Kjeldahl applications. The mayor the-oretical part of the Kjeldahl Guide contains basic knowledge followed by an ex-tensive list of actual BUCHI Application Notes describing successful nitrogen determinations.With this Kjeldahl Guide BUCHI would like to live up to its company slogan
«Quality in your hands»and support you in your daily work by not only providing high quality instrumenta-tion but also offering comprehensible theoretical background information and show- case applications.
Dr. Huldrych Egli
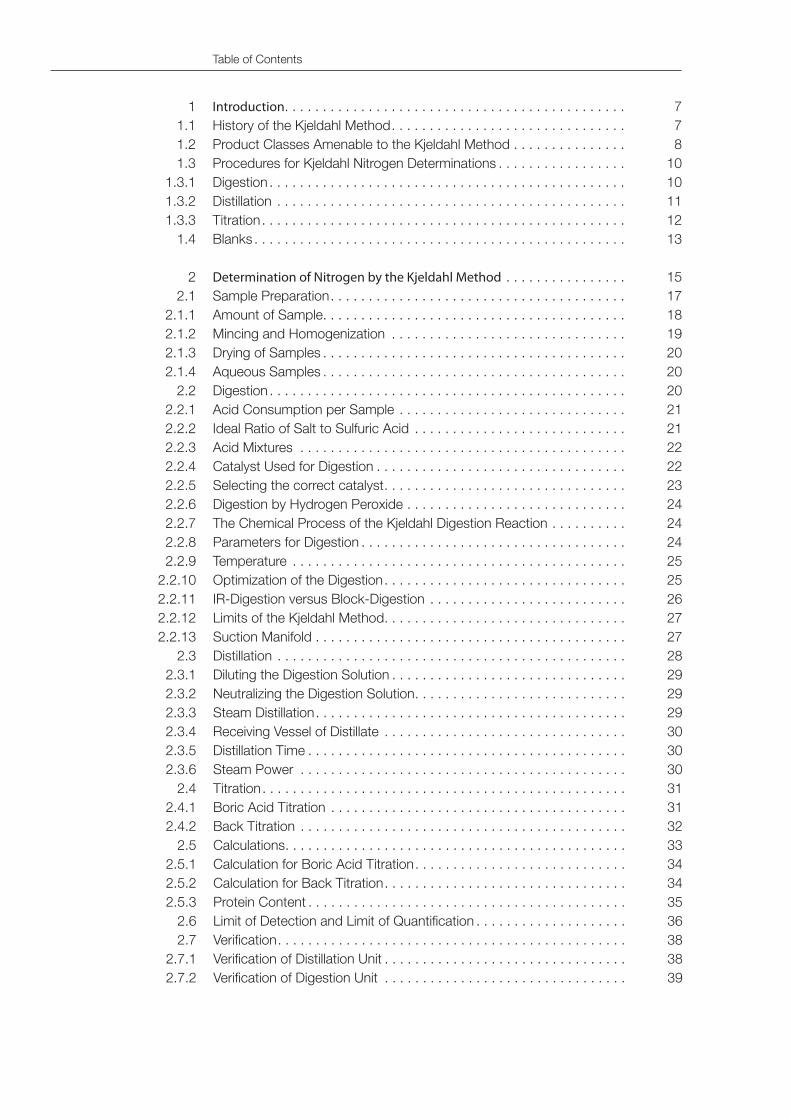
Table of Contents
1 Introduction. . . . . . . . . . . . . . . . . . . . . . . . . . . . . . . . . . . . . . . . . . . . . 7 1.1 History of the Kjeldahl Method . . . . . . . . . . . . . . . . . . . . . . . . . . . . . . . 7 1.2 Product Classes Amenable to the Kjeldahl Method . . . . . . . . . . . . . . . 8 1.3 Procedures for Kjeldahl Nitrogen Determinations . . . . . . . . . . . . . . . . . 10 1.3.1 Digestion . . . . . . . . . . . . . . . . . . . . . . . . . . . . . . . . . . . . . . . . . . . . . . . 10 1.3.2 Distillation . . . . . . . . . . . . . . . . . . . . . . . . . . . . . . . . . . . . . . . . . . . . . . 11 1.3.3 Titration . . . . . . . . . . . . . . . . . . . . . . . . . . . . . . . . . . . . . . . . . . . . . . . . 12 1.4 Blanks . . . . . . . . . . . . . . . . . . . . . . . . . . . . . . . . . . . . . . . . . . . . . . . . . 13
2 Determination of Nitrogen by the Kjeldahl Method . . . . . . . . . . . . . . . . 15 2.1 Sample Preparation . . . . . . . . . . . . . . . . . . . . . . . . . . . . . . . . . . . . . . . 17 2.1.1 Amount of Sample . . . . . . . . . . . . . . . . . . . . . . . . . . . . . . . . . . . . . . . . 18 2.1.2 Mincing and Homogenization . . . . . . . . . . . . . . . . . . . . . . . . . . . . . . . 19 2.1.3 Drying of Samples . . . . . . . . . . . . . . . . . . . . . . . . . . . . . . . . . . . . . . . . 20 2.1.4 Aqueous Samples . . . . . . . . . . . . . . . . . . . . . . . . . . . . . . . . . . . . . . . . 20 2.2 Digestion . . . . . . . . . . . . . . . . . . . . . . . . . . . . . . . . . . . . . . . . . . . . . . . 20 2.2.1 Acid Consumption per Sample . . . . . . . . . . . . . . . . . . . . . . . . . . . . . . 21 2.2.2 Ideal Ratio of Salt to Sulfuric Acid . . . . . . . . . . . . . . . . . . . . . . . . . . . . 21 2.2.3 Acid Mixtures . . . . . . . . . . . . . . . . . . . . . . . . . . . . . . . . . . . . . . . . . . . 22 2.2.4 Catalyst Used for Digestion . . . . . . . . . . . . . . . . . . . . . . . . . . . . . . . . . 22 2.2.5 Selecting the correct catalyst . . . . . . . . . . . . . . . . . . . . . . . . . . . . . . . . 23 2.2.6 Digestion by Hydrogen Peroxide . . . . . . . . . . . . . . . . . . . . . . . . . . . . . 24 2.2.7 The Chemical Process of the Kjeldahl Digestion Reaction . . . . . . . . . . 24 2.2.8 Parameters for Digestion . . . . . . . . . . . . . . . . . . . . . . . . . . . . . . . . . . . 24 2.2.9 Temperature . . . . . . . . . . . . . . . . . . . . . . . . . . . . . . . . . . . . . . . . . . . . 25 2.2.10 Optimization of the Digestion . . . . . . . . . . . . . . . . . . . . . . . . . . . . . . . . 25 2.2.11 IR-Digestion versus Block-Digestion . . . . . . . . . . . . . . . . . . . . . . . . . . 26 2.2.12 Limits of the Kjeldahl Method . . . . . . . . . . . . . . . . . . . . . . . . . . . . . . . . 27 2.2.13 Suction Manifold . . . . . . . . . . . . . . . . . . . . . . . . . . . . . . . . . . . . . . . . . 27 2.3 Distillation . . . . . . . . . . . . . . . . . . . . . . . . . . . . . . . . . . . . . . . . . . . . . . 28 2.3.1 Diluting the Digestion Solution . . . . . . . . . . . . . . . . . . . . . . . . . . . . . . . 29 2.3.2 Neutralizing the Digestion Solution . . . . . . . . . . . . . . . . . . . . . . . . . . . . 29 2.3.3 Steam Distillation . . . . . . . . . . . . . . . . . . . . . . . . . . . . . . . . . . . . . . . . . 29 2.3.4 Receiving Vessel of Distillate . . . . . . . . . . . . . . . . . . . . . . . . . . . . . . . . 30 2.3.5 Distillation Time . . . . . . . . . . . . . . . . . . . . . . . . . . . . . . . . . . . . . . . . . . 30 2.3.6 Steam Power . . . . . . . . . . . . . . . . . . . . . . . . . . . . . . . . . . . . . . . . . . . 30 2.4 Titration . . . . . . . . . . . . . . . . . . . . . . . . . . . . . . . . . . . . . . . . . . . . . . . . 31 2.4.1 Boric Acid Titration . . . . . . . . . . . . . . . . . . . . . . . . . . . . . . . . . . . . . . . 31 2.4.2 Back Titration . . . . . . . . . . . . . . . . . . . . . . . . . . . . . . . . . . . . . . . . . . . 32 2.5 Calculations . . . . . . . . . . . . . . . . . . . . . . . . . . . . . . . . . . . . . . . . . . . . . 33 2.5.1 Calculation for Boric Acid Titration . . . . . . . . . . . . . . . . . . . . . . . . . . . . 34 2.5.2 Calculation for Back Titration . . . . . . . . . . . . . . . . . . . . . . . . . . . . . . . . 34 2.5.3 Protein Content . . . . . . . . . . . . . . . . . . . . . . . . . . . . . . . . . . . . . . . . . . 35 2.6 Limit of Detection and Limit of Quantification . . . . . . . . . . . . . . . . . . . . 36 2.7 Verification . . . . . . . . . . . . . . . . . . . . . . . . . . . . . . . . . . . . . . . . . . . . . . 38 2.7.1 Verification of Distillation Unit . . . . . . . . . . . . . . . . . . . . . . . . . . . . . . . . 38 2.7.2 Verification of Digestion Unit . . . . . . . . . . . . . . . . . . . . . . . . . . . . . . . . 39
3 Troubleshooting . . . . . . . . . . . . . . . . . . . . . . . . . . . . . . . . . . . . . . . . . . 41
4 Official Norms and Regulations . . . . . . . . . . . . . . . . . . . . . . . . . . . . . . . 42
5 Attachments . . . . . . . . . . . . . . . . . . . . . . . . . . . . . . . . . . . . . . . . . . . . 44 5.1 Two-Stage Mixed Indicator According to Sher for Boric Acid Titration . 44 5.2 Mixing Indicator according to Mortimer for Back-Titration Method and Colorimetric Titration . . . . . . . . . . . . . . . . . . . . . . . . . . . . . . . . . . 44 5.3 Recommended Monographs on Kjeldahl . . . . . . . . . . . . . . . . . . . . . . . 44
6 References . . . . . . . . . . . . . . . . . . . . . . . . . . . . . . . . . . . . . . . . . . . . . . 45
7 Application Notes . . . . . . . . . . . . . . . . . . . . . . . . . . . . . . . . . . . . . . . . . 47 7.1 List of available Application Notes . . . . . . . . . . . . . . . . . . . . . . . . . . . . 47
8 Index . . . . . . . . . . . . . . . . . . . . . . . . . . . . . . . . . . . . . . . . . . . . . . . . . . 52
9 List of Figures and Tables . . . . . . . . . . . . . . . . . . . . . . . . . . . . . . . . . . . 55

Introduction 7
Introduction
This introduction gives an overview of the history of the Kjeldahl Method and of its evolution to the current state of the art.
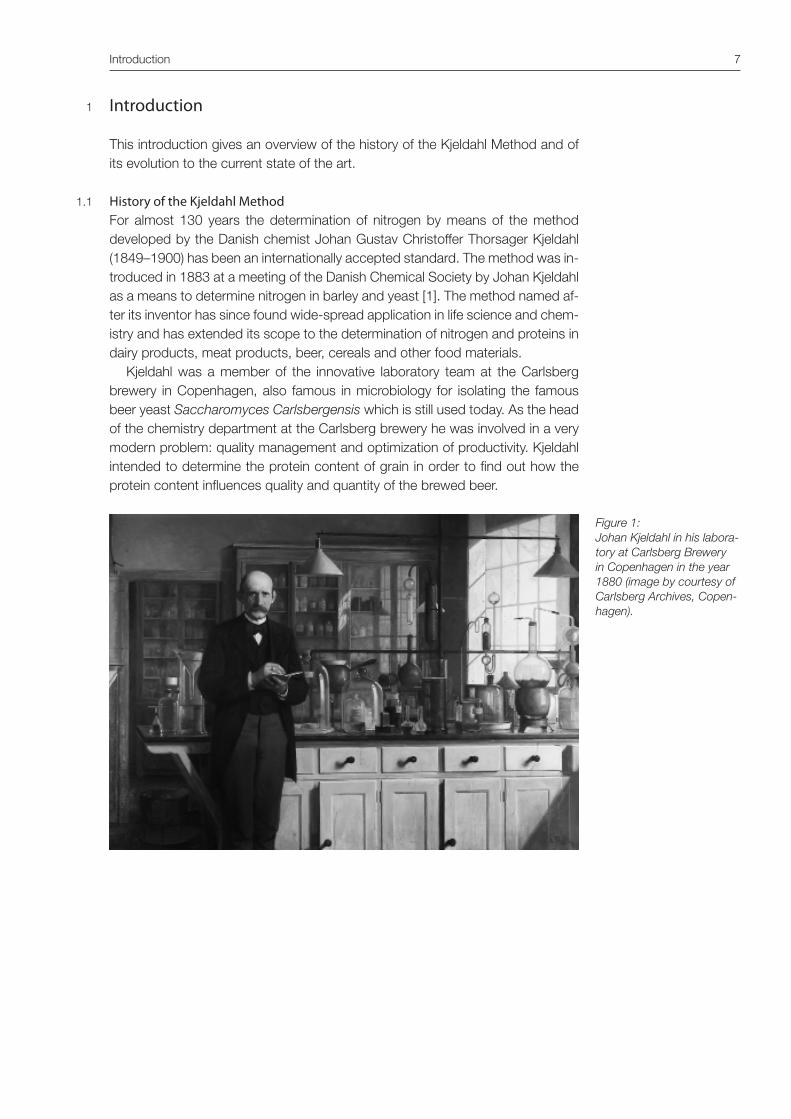
History of the Kjeldahl MethodFor almost 130 years the determination of nitrogen by means of the method developed by the Danish chemist Johan Gustav Christoffer Thorsager Kjeldahl (1849–1900) has been an internationally accepted standard. The method was in-troduced in 1883 at a meeting of the Danish Chemical Society by Johan Kjeldahl as a means to determine nitrogen in barley and yeast [1]. The method named af-ter its inventor has since found wide-spread application in life science and chem-istry and has extended its scope to the determination of nitrogen and proteins in dairy products, meat products, beer, cereals and other food materials.
Kjeldahl was a member of the innovative laboratory team at the Carlsberg brewery in Copenhagen, also famous in microbiology for isolating the famous beer yeast Saccharomyces Carlsbergensis which is still used today. As the head of the chemistry department at the Carlsberg brewery he was involved in a very modern problem: quality management and optimization of productivity. Kjeldahl intended to determine the protein content of grain in order to find out how the protein content influences quality and quantity of the brewed beer.
1
1.1
Figure 1: Johan Kjeldahl in his labora-tory at Carlsberg Brewery in Copenhagen in the year 1880 (image by courtesy of Carlsberg Archives, Copen-hagen).
8 Introduction
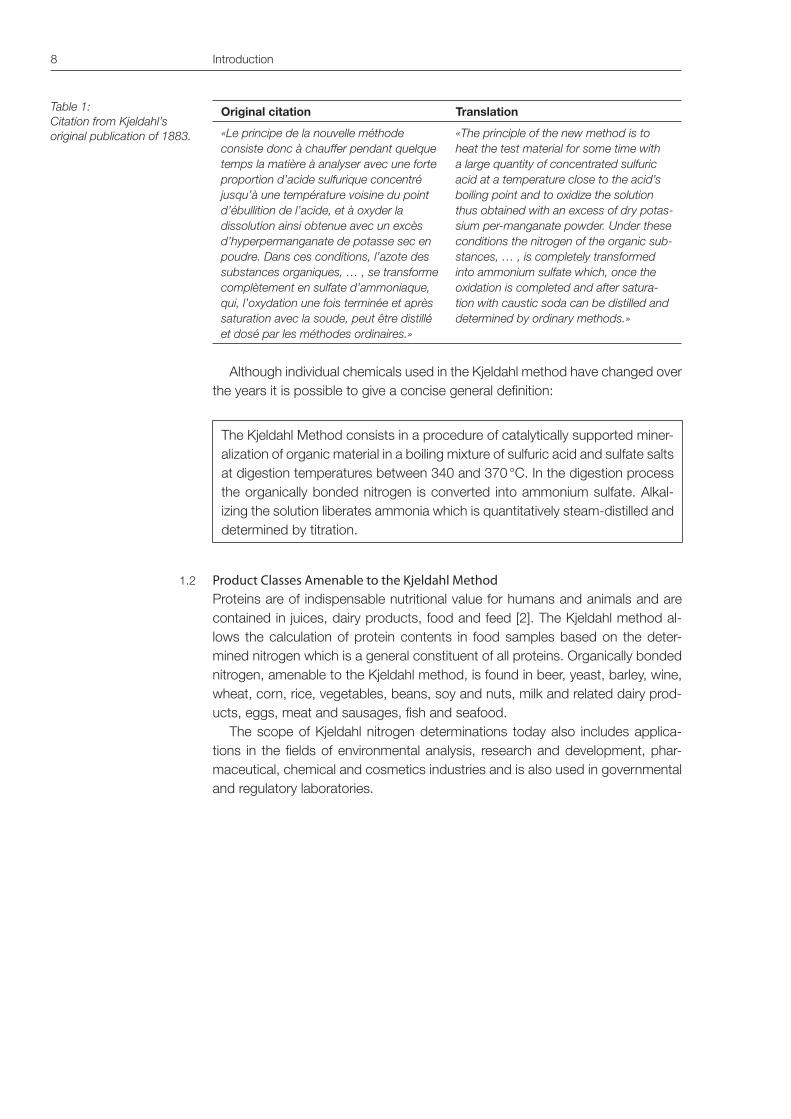
Original citation Translation
«Le principe de la nouvelle méthode consiste donc à chauffer pendant quelque temps la matière à analyser avec une forte proportion d’acide sulfurique concentré jusqu’à une température voisine du point d’ébullition de l’acide, et à oxyder la dissolution ainsi obtenue avec un excès d’hyperpermanganate de potasse sec en poudre. Dans ces conditions, l’azote des substances organiques, … , se transforme complètement en sulfate d’ammoniaque, qui, l’oxydation une fois terminée et après saturation avec la soude, peut être distillé et dosé par les méthodes ordinaires.»
«The principle of the new method is to heat the test material for some time with a large quantity of concentrated sulfuric acid at a temperature close to the acid’s boiling point and to oxidize the solution thus obtained with an excess of dry potas-sium per-manganate powder. Under these conditions the nitrogen of the organic sub-stances, … , is completely transformed into ammonium sulfate which, once the oxidation is completed and after satura-tion with caustic soda can be distilled and determined by ordinary methods.»
Although individual chemicals used in the Kjeldahl method have changed over
the years it is possible to give a concise general definition:
The Kjeldahl Method consists in a procedure of catalytically supported miner-alization of organic material in a boiling mixture of sulfuric acid and sulfate salts at digestion temperatures between 340 and 370 °C. In the digestion process the organically bonded nitrogen is converted into ammonium sulfate. Alkal-izing the solution liberates ammonia which is quantitatively steam-distilled and determined by titration.
Product Classes Amenable to the Kjeldahl MethodProteins are of indispensable nutritional value for humans and animals and are contained in juices, dairy products, food and feed [2]. The Kjeldahl method al-lows the calculation of protein contents in food samples based on the deter-mined nitrogen which is a general constituent of all proteins. Organically bonded nitrogen, amenable to the Kjeldahl method, is found in beer, yeast, barley, wine, wheat, corn, rice, vegetables, beans, soy and nuts, milk and related dairy prod-ucts, eggs, meat and sausages, fish and seafood.
The scope of Kjeldahl nitrogen determinations today also includes applica-tions in the fields of environmental analysis, research and development, phar-maceutical, chemical and cosmetics industries and is also used in governmental and regulatory laboratories.
Table 1:Citation from Kjeldahl’s original publication of 1883.
1.2
Introduction 9
Food Protein [%]
Apple 0.3
Peach 0.8
Carrot 1.0
Raspberry 1.3
Potatoes 2.0
Elderberry 2.5
Spinach 2.7
Horse-radish 2.8
Rose hip 3.6
Milk 3.2
Pea sprouts 5.1
Corn 9.2
Flour 11.0
Oats 12.6
Chicken 19.9
Halibut 20.1
Red beans 21.2
Beef 22.0
Lentils (dry) 22.9
Cheese (eg. Cheddar) 24.7
Peanuts 24.7
Sunflower seed 26.5
Ostrich 35.3
Soybeans 37.6
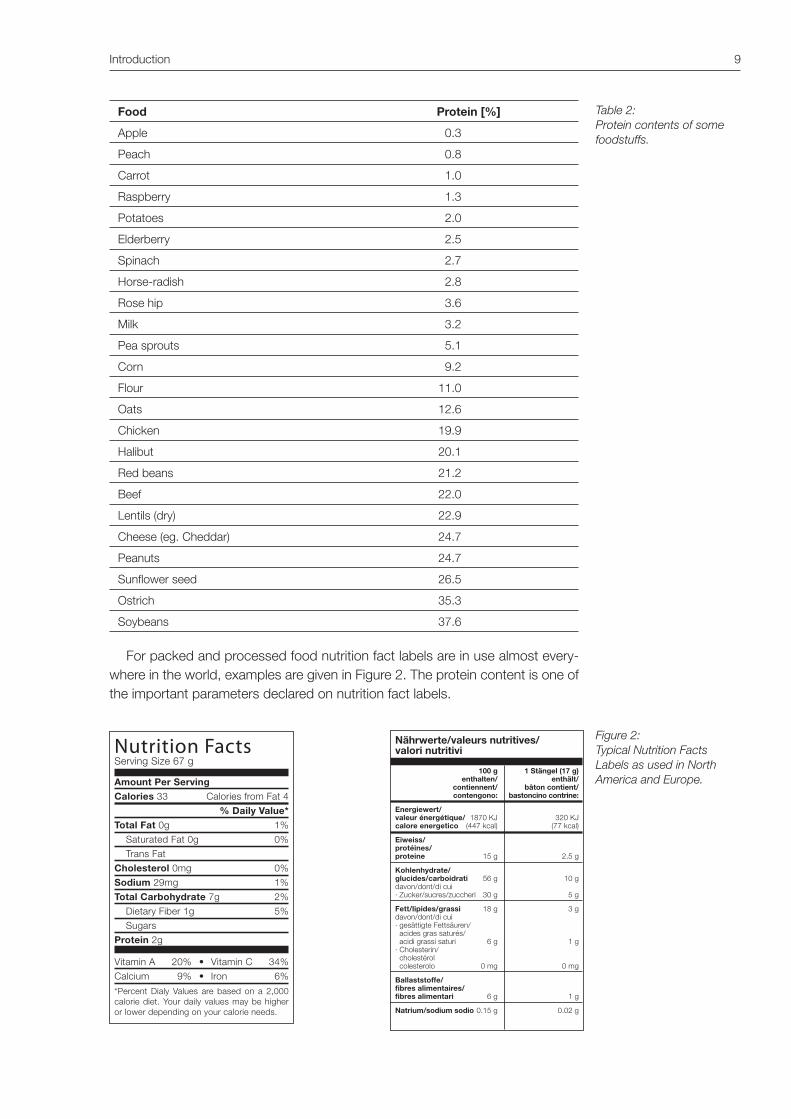
For packed and processed food nutrition fact labels are in use almost every-where in the world, examples are given in Figure 2. The protein content is one of the important parameters declared on nutrition fact labels.
Table 2:Protein contents of some foodstuffs.
Figure 2:Typical Nutrition Facts Labels as used in North America and Europe.
Nutrition FactsServing Size 67 g
Amount Per ServingCalories 33 Calories from Fat 4
% Daily Value*Total Fat 0g 1%
Saturated Fat 0g 0%
Trans Fat
Cholesterol 0mg 0%
Sodium 29mg 1%
Total Carbohydrate 7g 2%
Dietary Fiber 1g 5%
Sugars
Protein 2g
*Percent Dialy Values are based on a 2,000 calorie diet. Your daily values may be higher or lower depending on your calorie needs.
Nährwerte/valeurs nutritives/ valori nutritivi
100 g 1 Stängel (17 g) enthalten/ enthält/ contiennent/ bâton contient/ contengono: bastoncino contrine:
Energiewert/ valeur énergétique/ 1870 KJ 320 KJ calore energetico (447 kcal) (77 kcal)
Eiweiss/ protéines/ proteine 15 g 2.5 g
Kohlenhydrate/ glucides/carboidrati 56 g 10 g davon/dont/di cui · Zucker/sucres/zuccheri 30 g 5 g
Fett/lipides/grassi 18 g 3 g davon/dont/di cui · gesättigte Fettsäuren/ acides gras saturés/ acidi grassi saturi 6 g 1 g · Cholesterin/ cholestérol colesterolo 0 mg 0 mg
Ballaststoffe/ fibres alimentaires/ fibres alimentari 6 g 1 g
Natrium/sodium sodio 0.15 g 0.02 g

10 Introduction
Procedures for Kjeldahl Nitrogen DeterminationsThe Kjeldahl procedure involves three major steps
DigestionIn the digestion step the organically bonded nitrogen is converted into ammo-nium ions. Organic carbon and hydrogen form carbon dioxide and water, very much reminiscent to an incineration process. In this process the organic mate-rial carbonizes which can be visualized by the transformation of the sample into black foam. During the digestion the foam decomposes and finally a clear liquid indicates the completion of the chemical reaction. The generalized non-stoichio-metric chemical equation (1) shows how a general nitrogen containing starting material (CHNO) is mineralized to dissolved ammonium ions.
(CHNO) + H2SO4 � CO2 + SO2 + H2O + NH4+ (1)
In the original procedure published by Kjeldahl the mineralization was carried out in boiling sulfuric acid. The oxidation was supported by the addition of the strong oxidizing agent potassium permanganate. After its introduction by Kjeldahl, the digestion reaction was further improved and optimized. Examples were the addition of salts and the use of catalysts which allowed for shorter digestion time. The most common salt used historically was potassium sulfate and the catalysts were selenium and metal salts, particularly of mercury, copper or titanium.
Two types of heating units are used to heat up the sample together with the reagents to boiling temperatures of 340 to 370 °C. One type are IR-digesters and the other are block digesters (see «2.2.11 IR-Digestion versus Block-Digestion», p. 26).
Figure 4: SpeedDigester K-425/439 (left), Block-Digestion Unit K-437 (right).
1.3
1.3.1
Figure 3: The three major steps in Kjeldahl nitrogen determina-tions.
Introduction 11
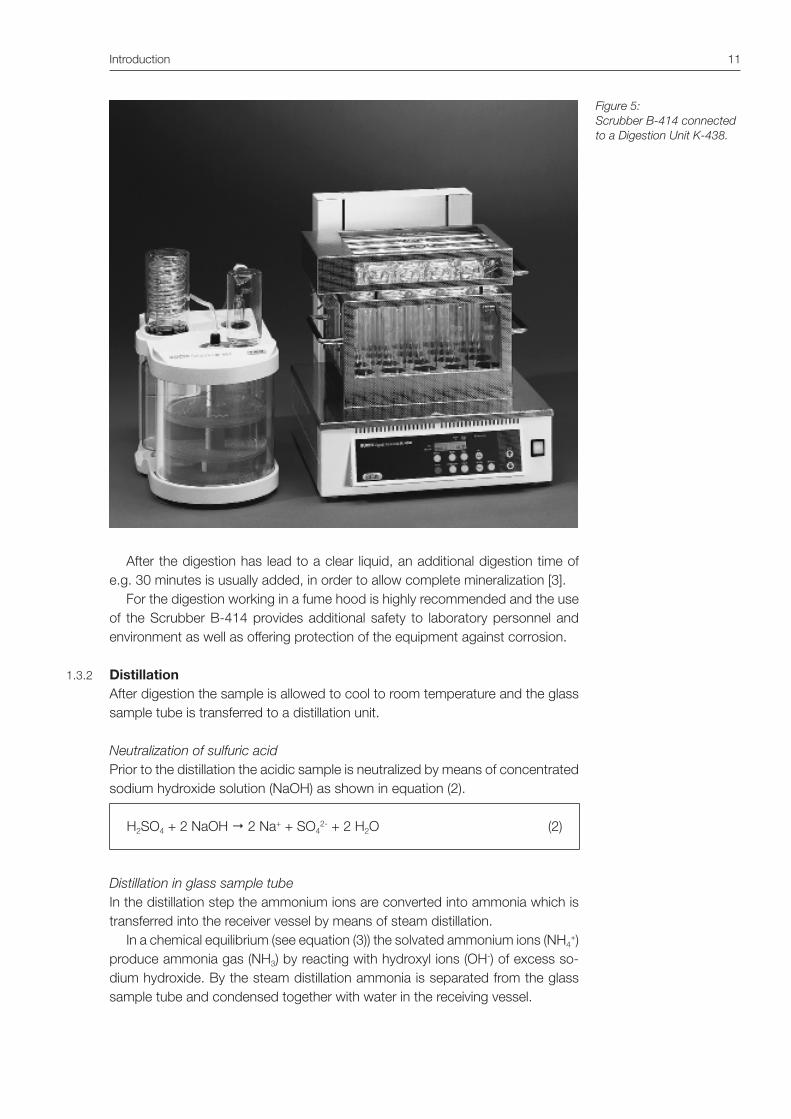
After the digestion has lead to a clear liquid, an additional digestion time of e.g. 30 minutes is usually added, in order to allow complete mineralization [3].
For the digestion working in a fume hood is highly recommended and the use of the Scrubber B-414 provides additional safety to laboratory personnel and environment as well as offering protection of the equipment against corrosion.
DistillationAfter digestion the sample is allowed to cool to room temperature and the glass sample tube is transferred to a distillation unit.
Neutralization of sulfuric acidPrior to the distillation the acidic sample is neutralized by means of concentrated sodium hydroxide solution (NaOH) as shown in equation (2).
H2SO4 + 2 NaOH � 2 Na+ + SO42- + 2 H2O (2)
Distillation in glass sample tubeIn the distillation step the ammonium ions are converted into ammonia which is transferred into the receiver vessel by means of steam distillation.
In a chemical equilibrium (see equation (3)) the solvated ammonium ions (NH4+)
produce ammonia gas (NH3) by reacting with hydroxyl ions (OH-) of excess so-dium hydroxide. By the steam distillation ammonia is separated from the glass sample tube and condensed together with water in the receiving vessel.
Figure 5: Scrubber B-414 connected to a Digestion Unit K-438.
1.3.2
12 Introduction
NH4+ + OH- � NH3(gas) + H2O (3)
Condensate collection in receiving vesselA common procedure to collect the ammonia in the receiver involves the pres-ence of boric acid B(OH)3 dissolved in water which forms ions with ammonia according to equation (4). The ammonia is quantitatively captured by the boric acid solution forming solvated ammonium ions. See also «1.4 Blanks», p. 13.
B(OH)3 + NH3 + H2O � NH4+ + B(OH)4
- (4)
TitrationThe concentration of the captured ammonium ions in the boric acid are deter-mined by means of an acid base titration commonly using standard solutions of sulfuric or hydrochloric acid. Depending on the amount of ammonium ions present, concentrations in the range of 0.01 N to 0.5 N are used. Titrations may be carried out by means of a burette using an appropriate pH-indicator such as Sher mixed indicator [4] (BUCHI 003512) to indicate the end point of pH = 4.65 (see «2.4.1 Boric Acid Titration», p.31). For the preparation see «5.1 Two-Stage Mixed Indicator according to Sher for Boric Acid Titration» (p. 44). A second option is to attach a titration stand to the distillation unit and read the volume of consumed acid from the display of the titrator. The most sophisticated pro-cedure is the use of a Kjeldahl distillation unit with a built-in titrator and have the calculation done by the software of the instrument. Whatever the choice of the determination method, the chemical reaction is described by equation (5) show-ing the reaction of the tetrahydroxyborate anion B(OH)4- with a generalized strong acid HX (X = Cl- etc.).
B(OH)4- + HX � X- + B(OH)3 + H2O (5)
1.3.3
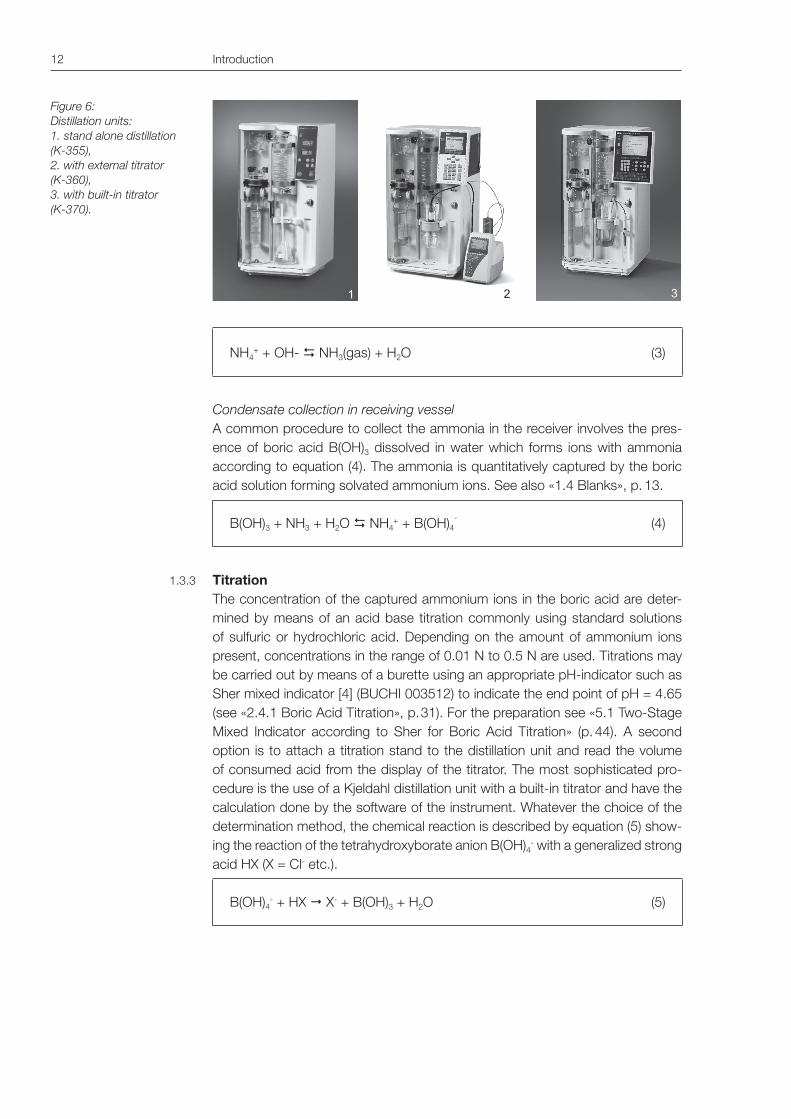
Figure 6:Distillation units:1. stand alone distillation (K-355),2. with external titrator (K-360),3. with built-in titrator (K-370).
o
Introduction 13
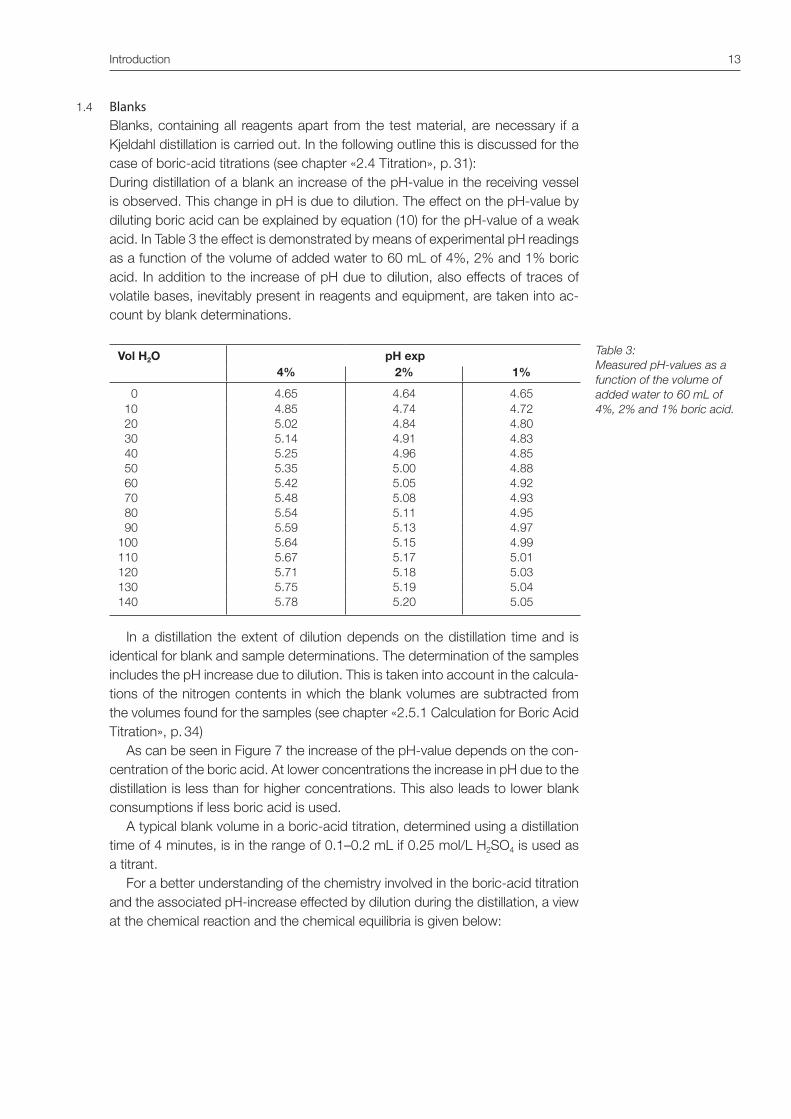
BlanksBlanks, containing all reagents apart from the test material, are necessary if a Kjeldahl distillation is carried out. In the following outline this is discussed for the case of boric-acid titrations (see chapter «2.4 Titration», p. 31): During distillation of a blank an increase of the pH-value in the receiving vessel is observed. This change in pH is due to dilution. The effect on the pH-value by diluting boric acid can be explained by equation (10) for the pH-value of a weak acid. In Table 3 the effect is demonstrated by means of experimental pH readings as a function of the volume of added water to 60 mL of 4%, 2% and 1% boric acid. In addition to the increase of pH due to dilution, also effects of traces of volatile bases, inevitably present in reagents and equipment, are taken into ac-count by blank determinations.
Vol H2O pH exp4% 2% 1%
0 4.65 4.64 4.65 10 4.85 4.74 4.72 20 5.02 4.84 4.80 30 5.14 4.91 4.83 40 5.25 4.96 4.85 50 5.35 5.00 4.88 60 5.42 5.05 4.92 70 5.48 5.08 4.93 80 5.54 5.11 4.95 90 5.59 5.13 4.97100 5.64 5.15 4.99110 5.67 5.17 5.01120 5.71 5.18 5.03130 5.75 5.19 5.04140 5.78 5.20 5.05
In a distillation the extent of dilution depends on the distillation time and is identical for blank and sample determinations. The determination of the samples includes the pH increase due to dilution. This is taken into account in the calcula-tions of the nitrogen contents in which the blank volumes are subtracted from the volumes found for the samples (see chapter «2.5.1 Calculation for Boric Acid Titration», p. 34)
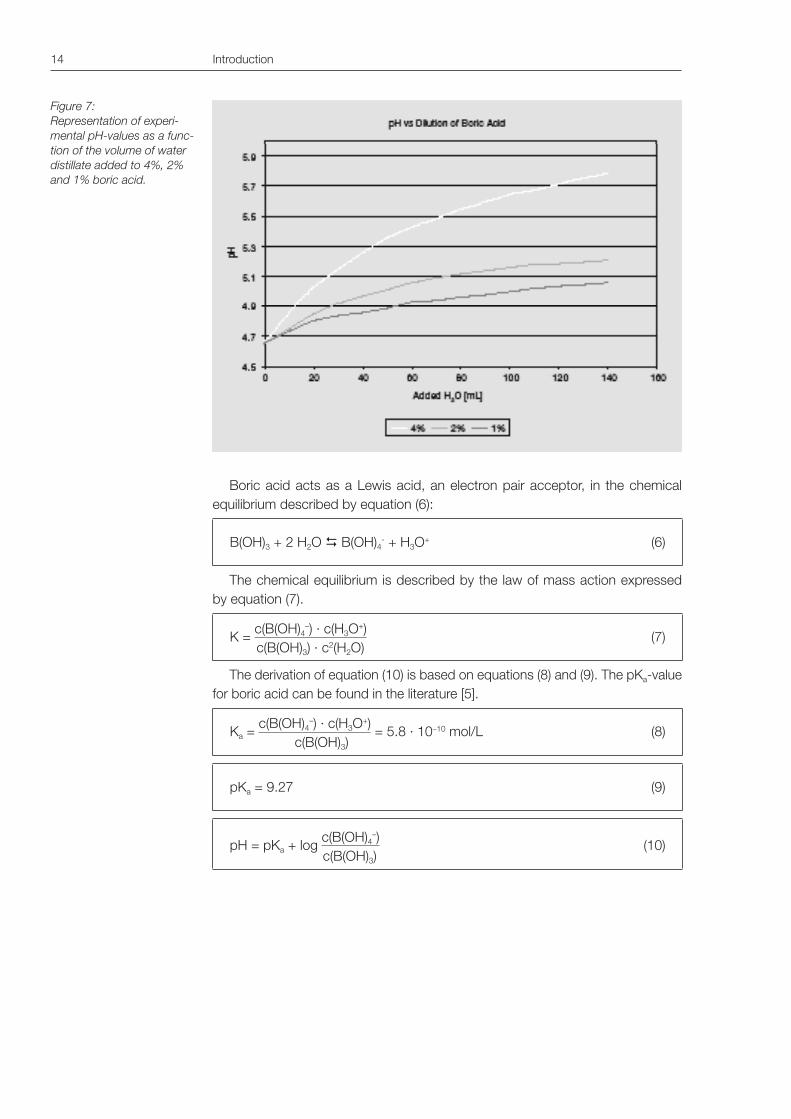
As can be seen in Figure 7 the increase of the pH-value depends on the con-centration of the boric acid. At lower concentrations the increase in pH due to the distillation is less than for higher concentrations. This also leads to lower blank consumptions if less boric acid is used.
A typical blank volume in a boric-acid titration, determined using a distillation time of 4 minutes, is in the range of 0.1–0.2 mL if 0.25 mol/L H2SO4 is used as a titrant.
For a better understanding of the chemistry involved in the boric-acid titration and the associated pH-increase effected by dilution during the distillation, a view at the chemical reaction and the chemical equilibria is given below:
1.4
Table 3:Measured pH-values as a function of the volume of added water to 60 mL of 4%, 2% and 1% boric acid.
14 Introduction
Boric acid acts as a Lewis acid, an electron pair acceptor, in the chemical equilibrium described by equation (6):
B(OH)3 + 2 H2O � B(OH)4- + H3O+ (6)
The chemical equilibrium is described by the law of mass action expressed by equation (7).
K = c(B(OH)4–) · c(H3O+)
(7) c(B(OH)3) · c2(H2O)
The derivation of equation (10) is based on equations (8) and (9). The pKa-value for boric acid can be found in the literature [5].
Ka = c(B(OH)4–) · c(H3O+)
= 5.8 · 10–10 mol/L (8) c(B(OH)3)
pKa = 9.27 (9)
pH = pKa + log c(B(OH)4–)
(10) c(B(OH)3)
Figure 7:Representation of experi-mental pH-values as a func-tion of the volume of water distillate added to 4%, 2% and 1% boric acid.
Determination of Nitrogen by the Kjeldahl Method 15
Determination of Nitrogen by the Kjeldahl Method
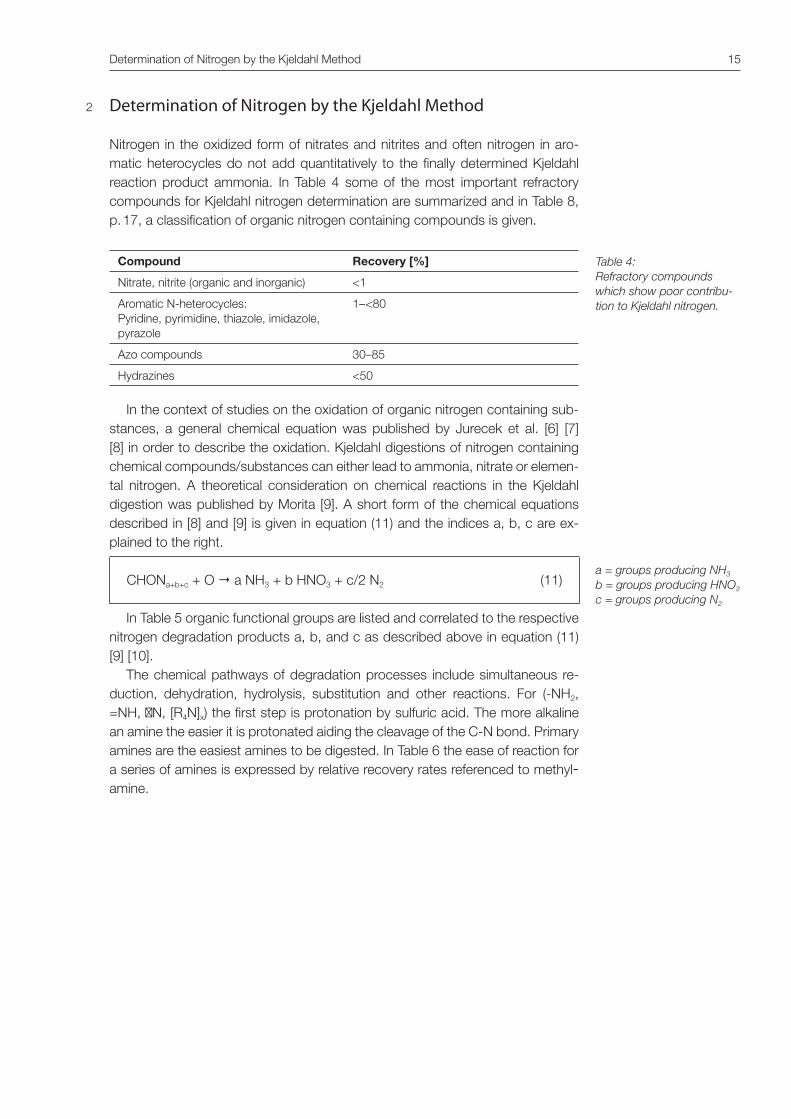
Nitrogen in the oxidized form of nitrates and nitrites and often nitrogen in aro-matic heterocycles do not add quantitatively to the finally determined Kjeldahl reaction product ammonia. In Table 4 some of the most important refractory compounds for Kjeldahl nitrogen determination are summarized and in Table 8, p.17, a classification of organic nitrogen containing compounds is given.
Compound Recovery [%]
Nitrate, nitrite (organic and inorganic) <1
Aromatic N-heterocycles:Pyridine, pyrimidine, thiazole, imidazole, pyrazole
1–<80
Azo compounds 30–85
Hydrazines <50
In the context of studies on the oxidation of organic nitrogen containing sub-stances, a general chemical equation was published by Jurecek et al. [6] [7] [8] in order to describe the oxidation. Kjeldahl digestions of nitrogen containing chemical compounds/substances can either lead to ammonia, nitrate or elemen-tal nitrogen. A theoretical consideration on chemical reactions in the Kjeldahl digestion was published by Morita [9]. A short form of the chemical equations described in [8] and [9] is given in equation (11) and the indices a, b, c are ex-plained to the right.
CHONa+b+c + O � a NH3 + b HNO3 + c/2 N2 (11)
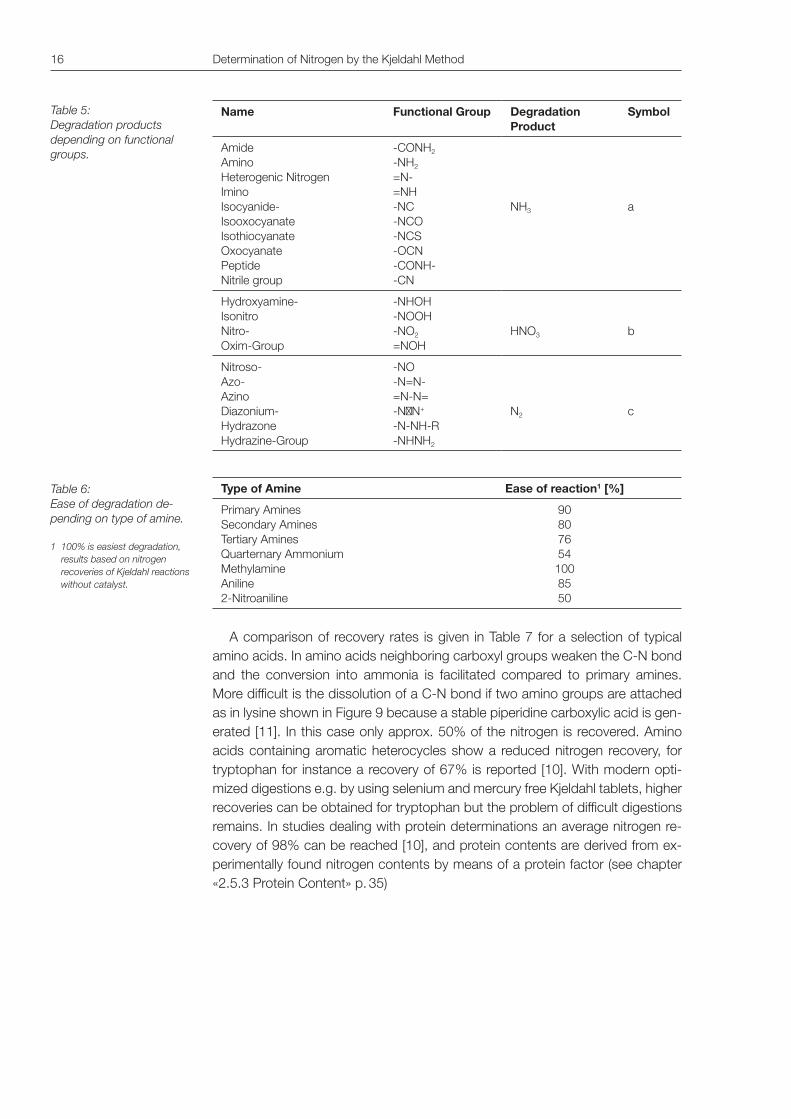
In Table 5 organic functional groups are listed and correlated to the respective nitrogen degradation products a, b, and c as described above in equation (11) [9] [10].
The chemical pathways of degradation processes include simultaneous re-duction, dehydration, hydrolysis, substitution and other reactions. For (-NH2, =NH, �N, [R4N]x) the first step is protonation by sulfuric acid. The more alkaline an amine the easier it is protonated aiding the cleavage of the C-N bond. Primary amines are the easiest amines to be digested. In Table 6 the ease of reaction for a series of amines is expressed by relative recovery rates referenced to methyl-amine.
2
Table 4: Refractory compounds which show poor contribu-tion to Kjeldahl nitrogen.
a = groups producing NH3
b = groups producing HNO3
c = groups producing N2
16 Determination of Nitrogen by the Kjeldahl Method
Name Functional Group Degradation Product
Symbol
Amide Amino Heterogenic Nitrogen Imino Isocyanide- Isooxocyanate Isothiocyanate Oxocyanate Peptide Nitrile group
-CONH2 -NH2 =N- =NH -NC -NCO -NCS -OCN -CONH- -CN
NH3
a
Hydroxyamine- Isonitro Nitro- Oxim-Group
-NHOH -NOOH -NO2 =NOH
HNO3
b
Nitroso- Azo- Azino Diazonium- Hydrazone Hydrazine-Group
-NO -N=N- =N-N= -N�N+ -N-NH-R -NHNH2
N2
c
Type of Amine Ease of reaction1 [%]
Primary Amines Secondary Amines Tertiary Amines Quarternary Ammonium Methylamine Aniline 2-Nitroaniline
90 80 76 54
100 85 50
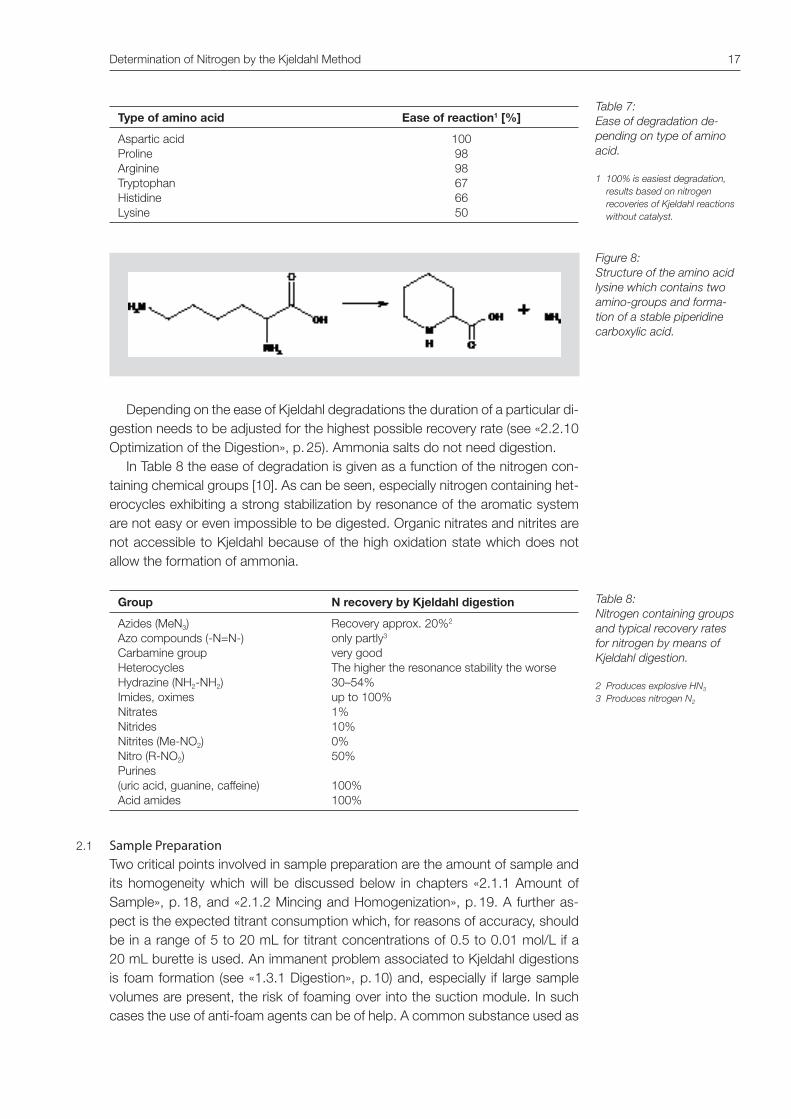
A comparison of recovery rates is given in Table 7 for a selection of typical amino acids. In amino acids neighboring carboxyl groups weaken the C-N bond and the conversion into ammonia is facilitated compared to primary amines. More difficult is the dissolution of a C-N bond if two amino groups are attached as in lysine shown in Figure 9 because a stable piperidine carboxylic acid is gen-erated [11]. In this case only approx. 50% of the nitrogen is recovered. Amino acids containing aromatic heterocycles show a reduced nitrogen recovery, for tryptophan for instance a recovery of 67% is reported [10]. With modern opti-mized digestions e.g. by using selenium and mercury free Kjeldahl tablets, higher recoveries can be obtained for tryptophan but the problem of difficult digestions remains. In studies dealing with protein determinations an average nitrogen re-covery of 98% can be reached [10], and protein contents are derived from ex-perimentally found nitrogen contents by means of a protein factor (see chapter «2.5.3 Protein Content» p. 35)
Table 5:Degradation products depending on functional groups.
Table 6:Ease of degradation de-pending on type of amine.
1 100% is easiest degradation, results based on nitrogen recoveries of Kjeldahl reactions without catalyst.
Determination of Nitrogen by the Kjeldahl Method 17
Type of amino acid Ease of reaction1 [%]
Aspartic acidProlineArginineTryptophanHistidineLysine
100 9898676650
Depending on the ease of Kjeldahl degradations the duration of a particular di-gestion needs to be adjusted for the highest possible recovery rate (see «2.2.10 Optimization of the Digestion», p. 25). Ammonia salts do not need digestion.
In Table 8 the ease of degradation is given as a function of the nitrogen con-taining chemical groups [10]. As can be seen, especially nitrogen containing het-erocycles exhibiting a strong stabilization by resonance of the aromatic system are not easy or even impossible to be digested. Organic nitrates and nitrites are not accessible to Kjeldahl because of the high oxidation state which does not allow the formation of ammonia.
Group N recovery by Kjeldahl digestion
Azides (MeN3)Azo compounds (-N=N-)Carbamine groupHeterocyclesHydrazine (NH2-NH2)Imides, oximesNitratesNitridesNitrites (Me-NO2)Nitro (R-NO2)Purines(uric acid, guanine, caffeine)Acid amides
Recovery approx. 20%2
only partly3
very goodThe higher the resonance stability the worse30–54%up to 100%1%10%0%50%
100%100%
Sample PreparationTwo critical points involved in sample preparation are the amount of sample and its homogeneity which will be discussed below in chapters «2.1.1 Amount of Sample», p. 18, and «2.1.2 Mincing and Homogenization», p. 19. A further as-pect is the expected titrant consumption which, for reasons of accuracy, should be in a range of 5 to 20 mL for titrant concentrations of 0.5 to 0.01 mol/L if a 20 mL burette is used. An immanent problem associated to Kjeldahl digestions is foam formation (see «1.3.1 Digestion», p. 10) and, especially if large sample volumes are present, the risk of foaming over into the suction module. In such cases the use of anti-foam agents can be of help. A common substance used as
Table 7: Ease of degradation de-pending on type of amino acid.
1 100% is easiest degradation, results based on nitrogen recoveries of Kjeldahl reactions without catalyst.
Table 8: Nitrogen containing groups and typical recovery rates for nitrogen by means of Kjeldahl digestion.
2 Produces explosive HN3
3 Produces nitrogen N2
2.1
Figure 8:Structure of the amino acid lysine which contains two amino-groups and forma-tion of a stable piperidine carboxylic acid.
18 Determination of Nitrogen by the Kjeldahl Method
anti-foam agent in Kjeldahl digestions is stearic acid of which a tip of a spatula is added to the sample. Digestions of liquid samples, e.g. in TKN determinations, may be affected by bumping caused by boiling retardation. In older descriptions of such applications boiling stones or similar boiling aids were recommended. With modern distillation units the distillation process may be completed by an aspiration of the sample in which case the presence of boiling aids leads to blockages of the hoses. For this reason digestion rods (BUCHI order number 043087 for a set of 10 pieces) are recommended. The digestion rods remain in the glass sample tube during the distillation. Digestion rods also do not impede the transfer of samples from the Kjeldahl Sampler K-371 to the Auto Kjeldahl Unit K-370.
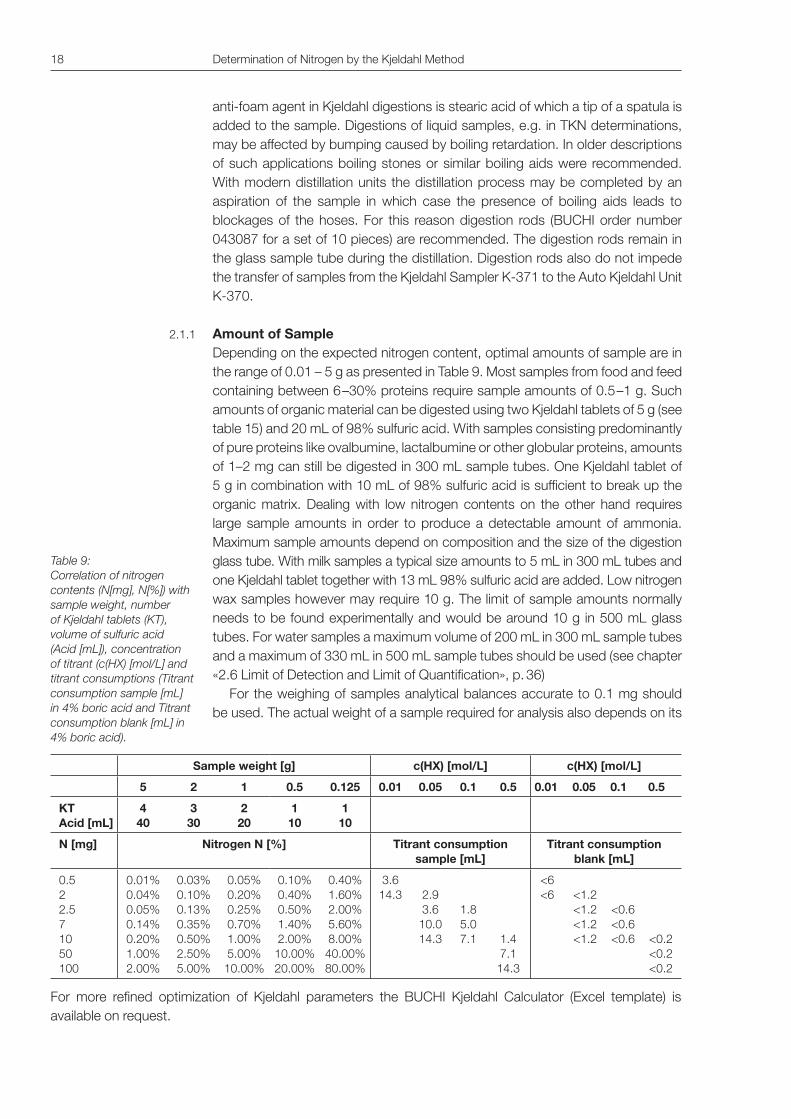
Amount of SampleDepending on the expected nitrogen content, optimal amounts of sample are in the range of 0.01 – 5 g as presented in Table 9. Most samples from food and feed containing between 6–30% proteins require sample amounts of 0.5–1 g. Such amounts of organic material can be digested using two Kjeldahl tablets of 5 g (see table 15) and 20 mL of 98% sulfuric acid. With samples consisting predominantly of pure proteins like ovalbumine, lactalbumine or other globular proteins, amounts of 1–2 mg can still be digested in 300 mL sample tubes. One Kjeldahl tablet of 5 g in combination with 10 mL of 98% sulfuric acid is sufficient to break up the organic matrix. Dealing with low nitrogen contents on the other hand requires large sample amounts in order to produce a detectable amount of ammonia. Maximum sample amounts depend on composition and the size of the digestion glass tube. With milk samples a typical size amounts to 5 mL in 300 mL tubes and one Kjeldahl tablet together with 13 mL 98% sulfuric acid are added. Low nitrogen wax samples however may require 10 g. The limit of sample amounts normally needs to be found experimentally and would be around 10 g in 500 mL glass tubes. For water samples a maximum volume of 200 mL in 300 mL sample tubes and a maximum of 330 mL in 500 mL sample tubes should be used (see chapter «2.6 Limit of Detection and Limit of Quantification», p. 36)
For the weighing of samples analytical balances accurate to 0.1 mg should be used. The actual weight of a sample required for analysis also depends on its
2.1.1
Sample weight [g] c(HX) [mol/L] c(HX) [mol/L]
5 2 1 0.5 0.125 0.01 0.05 0.1 0.5 0.01 0.05 0.1 0.5
KT Acid [mL]
4 40
3 30
2 20
1 10
110
N [mg] Nitrogen N [%] Titrant consumption sample [mL]
Titrant consumption blank [mL]
0.5 2 2.5 7 10 50 100
0.01% 0.04% 0.05% 0.14% 0.20% 1.00% 2.00%
0.03% 0.10% 0.13% 0.35% 0.50% 2.50% 5.00%
0.05% 0.20% 0.25% 0.70% 1.00% 5.00%
10.00%
0.10% 0.40% 0.50% 1.40% 2.00%
10.00% 20.00%
0.40% 1.60% 2.00% 5.60% 8.00%
40.00% 80.00%
3.6 14.3
2.9 3.6
10.0 14.3
1.8 5.0 7.1
1.4 7.1
14.3
<6 <6
<1.2 <1.2 <1.2 <1.2
<0.6 <0.6 <0.6
<0.2 <0.2 <0.2
Table 9:Correlation of nitrogen contents (N[mg], N[%]) with sample weight, number of Kjeldahl tablets (KT), volume of sulfuric acid (Acid [mL]), concentration of titrant (c(HX) [mol/L] and titrant consumptions (Titrant consumption sample [mL] in 4% boric acid and Titrant consumption blank [mL] in 4% boric acid).
For more refined optimization of Kjeldahl parameters the BUCHI Kjeldahl Calculator (Excel template) is available on request.
Determination of Nitrogen by the Kjeldahl Method 19
homogeneity (see «2.1.2 Mincing and Homogenization», p. 19). More sample is needed to achieve reproducible results for less homogeneous material.
As described above optimal sample amounts depend on the expected nitro-gen contents but also affect the choice of titrant concentration. In Table 9 recom-mended sample weights are correlated with the amounts of catalyst, the volume of 98% sulfuric acid and suggested titrant concentrations.
The effect of the Kjeldahl tablets added to 98% sulfuric acid is an increase of the boiling temperature (see chapter 2.2.2, p. 21).
Depending on the nitrogen content per sample the terminology macro, semi-micro- and micro Kjeldahl is used [10] [13]:
Kjeldahl Type Sample Amount Tube Size
Macro Kjeldahl Semimicro Kjeldahl Micro Kjeldahl
10–30 mgN/sample 0.1–3 mgN/sample 1–15 μgN/sample
300, 500 mL 300 mL 100 mL
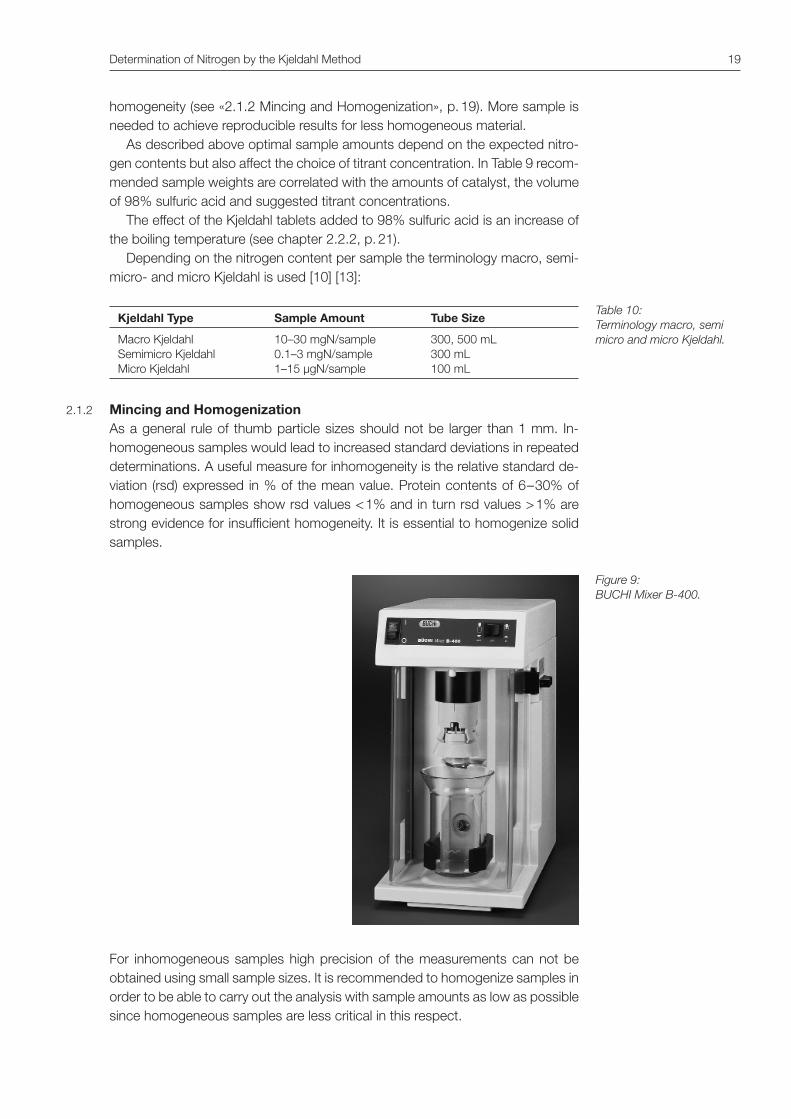
Mincing and HomogenizationAs a general rule of thumb particle sizes should not be larger than 1 mm. In-homogeneous samples would lead to increased standard deviations in repeated determinations. A useful measure for inhomogeneity is the relative standard de-viation (rsd) expressed in % of the mean value. Protein contents of 6–30% of homogeneous samples show rsd values < 1% and in turn rsd values > 1% are strong evidence for insufficient homogeneity. It is essential to homogenize solid samples.
For inhomogeneous samples high precision of the measurements can not be obtained using small sample sizes. It is recommended to homogenize samples in order to be able to carry out the analysis with sample amounts as low as possible since homogeneous samples are less critical in this respect.
Table 10:Terminology macro, semi micro and micro Kjeldahl.
2.1.2
Figure 9: BUCHI Mixer B-400.
20 Determination of Nitrogen by the Kjeldahl Method
Drying of SamplesDrying of samples may be necessary if results referring to dry matter are required. Alternatively the water content of a sample may be determined by classical water analyses like Karl-Fischer titration or by gravimetric methods.
Aqueous SamplesIn waste water applications, involving the determination of nitrogen by means of the Kjeldahl digestion method, liquid samples are used and in a first step the wa-ter is evaporated. Together with organic nitrogen, waste water samples may also contain ammonia and ammonium ions which will add to the result of determined nitrogen. This type of Kjeldahl determination is referred to as a determination of Total Kjeldahl Nitrogen (TKN). Depending on the expected nitrogen contents suitable sample volumes have to be chosen (see Table 11).
Nitrogen concentration [mgN/L] Volume of Sample [mL]
< 20 20–50 50–100
100 50 25
DigestionTwo different types of digestion units are used to heat up samples for Kjeldahl digestions. One is referred to as an IR-digestion unit and the other one is called a block digestion unit. IR digesters are equipped with a heating rod similar to those used in an oven. The sample is directly irradiated in a heating zone of approxi-mately one third of the tube’s height. With block digesters the sample tubes are embedded in a boring of 3.5 cm if 300 mL tubes are used or of 8 cm for 500 mL tubes respectively. The heat is transferred from the aluminum block through the glass wall to the sample. IR- and block digesters are suitable for all applications provided correct parameters are chosen. Important parameters are the speed of heating up samples, the digestion temperature and the duration of the di-gestion. A major technical difference between IR- and block digestion consists in the temperatures generated in the oven and in the block respectively. In IR digestion a temperature of 600 °C is reached in the oven and in block digesters the aluminium block is heated up to 420–450 °C. In both types of digestion units the heat transfer to the sample ensures that in the sample mixture the required temperatures of 350–380 °C are maintained during the Kjeldahl digestion (see also «2.2.11 IR-Digestion versus Block-Digestion», p. 26).IR digesters exhibit a heating zone of 8 cm. By means of an additional aluminium block (BUCHI order number 040088) the heating zone can be increased to 8 cm in a regular block digestor also. A higher heating zone has a positive effect in foaming samples by allowing rising gas bubbles to burst and reducing the level of foam in the digestion tube. An additional aluminium block improves equal evaporation of all positions of water samples e.g. in TKN determinations.A further technical aspect associated with IR- and block digestion is the time needed to heat up the respective digestion unit to the operation temperature. IR digesters need 15 minutes and an aluminium block with 20 sample positions approximately 60 minutes. If an additional heating block is used the heat-up time increases to 80 minutes.
2.2
Table 11: Sample volumes for TKN determinations.
2.1.4
2.1.3

Determination of Nitrogen by the Kjeldahl Method 21
Acid Consumption per SampleThe volume of consumed concentrated sulfuric acid in a Kjeldahl digestion de-pends on the sample [10] [13] [14]. In Table 12 the consumption of 98% sulfuric acid for fats, proteins and carbohydrates is shown.
Sample Component
A [mL H2SO4/g]
B [g H2SO4/g]
Fat Protein Carbohydrate
9.7 4.9 4.0
18–19 8.7–9.7
8.4
Based on column A in Table 12 the consumption of H2SO4 for typical food samples can be calculated by adding the individual acid consumptions per con-stituent. An example is given below for a wheat sample of 1 g:
Constituent Calculation
Fat (assume 3.5%) Protein (assume 12.5%) Carbohydrate (assume 66.5%)
3.5% x 1.0 x 9.7 = 0.34 mL 12.5% x 1.0 x 4.9 = 0.61 mL 66.5% x 1.0 x 4.0 = 2.66 mL
Acid consumption 3.61 mL
Bradstreet published a recommended amount of 6.27 g H2SO4 for corn meal which can be compared to the calculated 3.61 mL shown in Table 13 [15]. An excess of sulfuric acid is needed because it ensures the formation of ammonium ions and nitrogen loss by evaporation of ammonia is avoided.
Ideal Ratio of Salt to Sulfuric AcidPure sulfuric acid boils at approx. 290 °C and upon boiling it releases a surplus of SO3 together with H2O until a 98.3% sulfuric acid is obtained finally boiling at 338 °C [12]. Commercially available sulfuric acid of 98% for this reason shows a boiling temperature of 338 °C. With the addition of Kjeldahl tablets the boiling temperature of the mixture in the sample tube is increased to a desired 350 to 370 °C. With time and duration of the digestion, the concentration of the sulfuric acid in the sample tube decreases, leading to even higher temperatures. The ratio of sulfuric acid to sulfate-salts is crucial for the boiling temperature actually found. A good ratio is 1 g of Kjeldahl catalyst mixture to 2 mL of 98% sulfuric acid. Typically for 1 g sample two Kjeldahl tablets of 5 g are used together with 20 mL of 98% sulfuric acid and digestion times of 90 minutes are applied.
The ideal ratio of sulfuric acid to sulfate salts by the end of a digestion should be such that the sample temperature does not exceed 380 °C. Above 390 °C the formation of elemental nitrogen gas (N2) becomes a possibility, eventually lead-ing to too low nitrogen results. In Table 14 the ideal ratio of acid to salt is given. Samples which exhibit final ratios close to the limits are prone to crystallization after cooling. This is not desirable especially when the Kjeldahl Sampler is used because then the suction tube would not be able to reach the bottom of the glass and sample transfer would be hampered leading to an error message on the distillation unit K-370.
2.2.1
2.2.2
Table 13:Calculation of the consump-tion of concentrated sulfuric acid by 1.0 g of sample.
Table 12:Consumption of volumes (A) and weights (B) of 98% H2SO4 for different compo-nents in samples.
22 Determination of Nitrogen by the Kjeldahl Method
Acid MixturesIn general food and feed applications 98% sulfuric acid is used for digestions. Special applications may however call for modifications in the concentration of sulfuric acid or mixtures of acids could be envisaged. As an example protein determinations of milk and cream are often carried out using a 69% sulfuric acid in order to reduce the risk of foaming (see chapter «2.2.6 Digestion by Hydrogen Peroxide», p. 24). In modified Kjeldahl digestions mixtures of sulfuric and chromic acid [6] [7] are described. Oxidative destruction of organic matrices however is not limited to the nitrogen determination by the Kjeldahl method. Digestions aiming at the analysis of phosphates in waste water are performed in a mixture of sulfuric and nitric acid [31] and for the analysis of heavy metals hydrochloric and nitric acid (acqua regia) are described in the literature [16]. Mixtures of sul-furic and nitric acids bear a potential to nitrify organic materials for instance in electrophilic aromatic substitutions or if hydroxyl-groups are present. This could lead to the production of very hazardous explosives. It is very important to follow the published methods carefully and always assess the explosion potential when nitric acid is involved.
Catalyst Used for DigestionThe composition of Kjeldahl tablets consists of more than 97% of a salt which increases the boiling temperature of the sulfuric acid and of 1–3% of one or more types of catalysts. The ideal digestion temperature for the Kjeldahl reac-tion is 370 °C. Usually potassium or sodium sulfate is used for the purpose of increasing the boiling temperature. Typical catalysts are selenium or metal salts of mercury, copper or titanium.
The ratio of sulfuric acid to salt and catalyst ideally is 20 mL H2SO4 to 10 g of salt and catalyst e.g. in the form of 2 Kjeldahl tablets of 5 g.
H2SO4 [mL]
K2SO4
[g]Boiling
temperature [°C]Remarks
20 20 20 20 20
– – 5
10 15
290 338 350 370 390
pure H2SO4 98% H2SO4
optimal digestion temp.
start of nitrogen loss
In Table 15 some of the commonly commercially available Kjeldahl tablets are given.
Name / Order no.
Composition Use Weight
Titanium# 11057980
3.5 g K2SO4 0.105 g CuSO4 5 H2O
0.105 g TiO2
Optimal compromise between environmental and
performance priorities
3.71 g
Titanium Micro# 11057981
1.5 g K2SO4 0.045 g CuSO4 5 H2O
0.045 g TiO2
Same as Titanium (11057980) but for semi-
micro-Kjeldahl & micro Kjeldahl applications.
1.59 g
Missouri# 11057982
4.98 g K2SO4 0.02 g CuSO4 5 H2O
The digestion with the Missouri catalyst is more environmentally friendly.
5 g
Table 15:Names, composition, use and weight of the new BUCHI Kjeldahl Tablets. See www.buchi.com.
2.2.4
Table 14: Effect of ratio H2SO4 [mL] to K2SO4 [g] on optimal digestion temperature [°C].
2.2.3
Determination of Nitrogen by the Kjeldahl Method 23
ECO# 11057983
3.998 g K2SO4 0.002 g CuSO4
Our most environmentally friendly catalyst, due to the
very low copper content.
4 g
Antifoam# 11057984
0.97 g Na2SO4 0.03 g Silicone Antifoam
Used as a general purpose foam suppressant. This
catalyst has to be combined with Titanium Micro or
Copper Micro.
1 g
Copper Micro# 11057985
1.5 g K2SO4 0.15 g CuSO4 5 H2O
Combo tablets for antifoam or for micro Kjeldahl
applications.
1.65 g
Mercury- and selenium-free catalystMercury-containing catalysts are hardly ever used at all today, due to their toxic-ity. The mixture of titanium dioxide and copper sulfate [17], however, also results in a considerable reduction in the reaction time.
Missouri catalystThe main feature of this catalyst is its environmental compatibility, due to the low content of copper. This does, however, mean that the digestion takes longer.
Selecting the correct catalystThe decisive factors for selecting a particular catalyst are the ecological and toxicity aspects or practical facts like reaction time or foaming and sputtering. While a toxic, selenium-containing catalyst reacts fastest, a copper-containing catalyst is considerably safer for both humans and the environment. An ideal compromise in this regard is the mixed catalyst consisting of copper- and tita-nium sulfate.
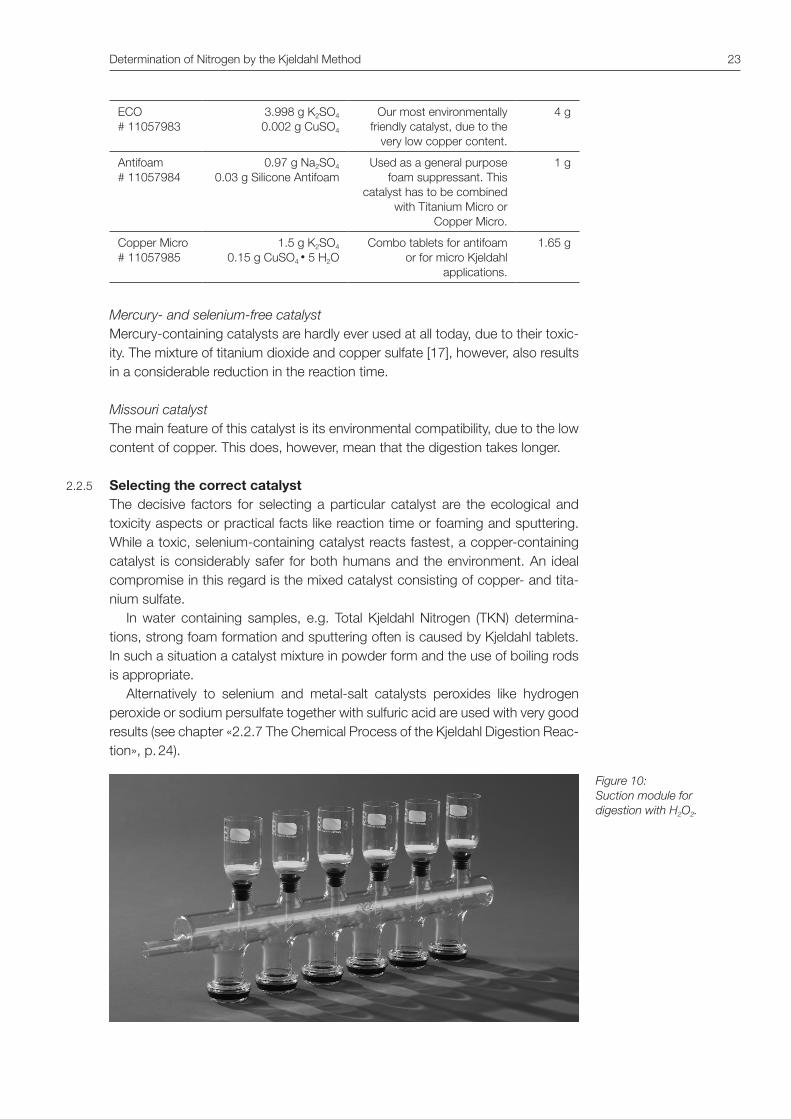
In water containing samples, e.g. Total Kjeldahl Nitrogen (TKN) determina-tions, strong foam formation and sputtering often is caused by Kjeldahl tablets. In such a situation a catalyst mixture in powder form and the use of boiling rods is appropriate.
Alternatively to selenium and metal-salt catalysts peroxides like hydrogen peroxide or sodium persulfate together with sulfuric acid are used with very good results (see chapter «2.2.7 The Chemical Process of the Kjeldahl Digestion Reac-tion», p. 24).
Figure 10: Suction module for digestion with H2O2.
2.2.5
24 Determination of Nitrogen by the Kjeldahl Method
Digestion by Hydrogen PeroxideDigestion supported by the oxidative power of hydrogen peroxide often leads to a substantial reductions in digestion time and foaming. The digestion of milk using Kjeldahl tablets for example needs 120 minutes digestion time compared to 30 minutes if hydrogen peroxide is the oxidant. A typical digestion of milk with H2O2
would use 5 g sample, 20 mL of 98% sulfuric acid and 30 mL of aqueous 30% H2O2. The procedure is described in the BUCHI Application Note ‘AN 054/2010’ and available on request. A comparison between Kjeldahl digestions and diges-tions using H2O2 was presented in [19] for various food samples. Mechanistic studies of the Kjeldahl microwave digestion of amino acids under the influence of H2O2 were reported in [20]. Method descriptions of nitrogen determinations in salami and milk [21] [22] [23] [24] can be found in chapter «7 Application Notes», p. 47 ff.) added to this publication.
The Chemical Process of the Kjeldahl Digestion ReactionThe oxidation process of organic material with sulfuric acid involves a first step of carbonization in which the formation of water can be observed when it con-denses at cool parts of the glass ware. Carbonization starts at room temperature and is enhanced by increased temperatures. At higher temperatures the decom-position of carbonized material to carbon dioxide commences and is reflected by foam formation expanding black sample material up in the Kjeldahl digestion tube. It is important to keep foam formation under control in order to avoid poor reflux of carbonized sample material attached to the glass wall. The choice of the right parameters as described in «2.2.8 Parameters for Digestion», p. 24, is a key for a successful digestion.
Parameters for DigestionThe significant parameters for digestion of a given sample are the amounts of reagents and the temperature setting of the digestion unit. The volume of sulfuric acid used is a function of the expected consumption of sulfuric acid in the redox reaction converting sulfuric acid to sulfur dioxide. The digestion time depends on the chemical structure of the sample, the temperature, the amounts of sulfate salt and the catalyst. A practical recommendation distinguishes a first period of time until the sample becomes translucent and a second period for the comple-tion of the digestion. The second period of time is meant for the completion of the conversion of the nitrogen degradation products to ammonia [3] [14]. As a rule of thumb, after the observation of a clear translucent solution, 30 minutes are sufficient to complete the reaction [3]. By the end of the digestion a surplus of acid has to be present in a sufficient amount in order to keep the non-vola-tile ammonium ions in solution and prevent the loss of volatile ammonia. If the amount of sulfuric acid is too low in the boiling sulfuric acid the organic material may produce carbon smoke leaving the Kjeldahl glass tube. The excess sulfuric acid ideally is at a concentration which is high enough to keep the sulfate salt in solution such that after cooling no crystallization occurs. The added sulfate salt increases the boiling temperature of the sulfuric acid solution. The ratio of sulfate salt to sulfuric acid should be high enough to allow a starting boiling temperature of 350 °C and must never lead to an increase of the sample temperature higher than 380 °C during the entire digestion. If the temperature is below 350 °C the reaction is slowed down and at temperatures above 390 °C nitrogen loss will
2.2.8
2.2.7
2.2.6
Determination of Nitrogen by the Kjeldahl Method 25
be encountered. In this temperature range of 350–380 °C the Kjeldahl reaction takes place and the speed of reaction is further enhanced by the added catalysts (see «2.2.4 Catalyst Used for Digestion», p. 22).
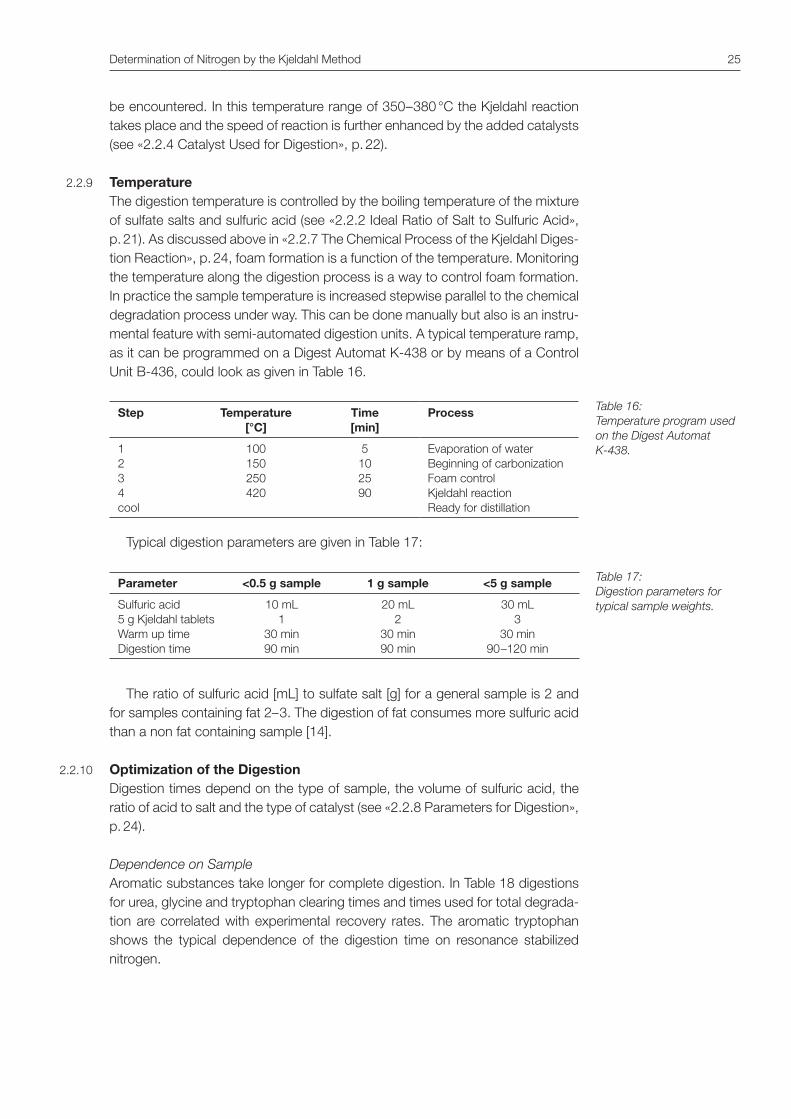
TemperatureThe digestion temperature is controlled by the boiling temperature of the mixture of sulfate salts and sulfuric acid (see «2.2.2 Ideal Ratio of Salt to Sulfuric Acid», p. 21). As discussed above in «2.2.7 The Chemical Process of the Kjeldahl Diges-tion Reaction», p. 24, foam formation is a function of the temperature. Monitoring the temperature along the digestion process is a way to control foam formation. In practice the sample temperature is increased stepwise parallel to the chemical degradation process under way. This can be done manually but also is an instru-mental feature with semi-automated digestion units. A typical temperature ramp, as it can be programmed on a Digest Automat K-438 or by means of a Control Unit B-436, could look as given in Table 16.
Step Temperature [°C]
Time [min]
Process
1 2 3 4 cool
100 150 250 420
5 10 25 90
Evaporation of water Beginning of carbonization Foam control Kjeldahl reaction Ready for distillation
Typical digestion parameters are given in Table 17:
Parameter <0.5 g sample 1 g sample <5 g sample
Sulfuric acid 5 g Kjeldahl tablets Warm up time Digestion time
10 mL 1
30 min 90 min
20 mL 2
30 min 90 min
30 mL 3
30 min 90–120 min
The ratio of sulfuric acid [mL] to sulfate salt [g] for a general sample is 2 and for samples containing fat 2–3. The digestion of fat consumes more sulfuric acid than a non fat containing sample [14].
Optimization of the DigestionDigestion times depend on the type of sample, the volume of sulfuric acid, the ratio of acid to salt and the type of catalyst (see «2.2.8 Parameters for Digestion», p. 24).
Dependence on SampleAromatic substances take longer for complete digestion. In Table 18 digestions for urea, glycine and tryptophan clearing times and times used for total degrada-tion are correlated with experimental recovery rates. The aromatic tryptophan shows the typical dependence of the digestion time on resonance stabilized nitrogen.
2.2.9
Table 16:Temperature program used on the Digest Automat K-438.
2.2.10
Table 17:Digestion parameters for typical sample weights.
26 Determination of Nitrogen by the Kjeldahl Method
Compound Clearing [min]
Digestion time [min]
Recovery [%]
Urea Glycine Tryptophan Tryptophan Tryptophan
11 15 16 16 16
90 90 90
200 300
99–101 99.5 97.8 98.8 99.5
Dependence on Volume of Sulfuric AcidSamples consisting of or containing fat, oil or carbohydrates tend to carbonize un-der strong foam formation. By increasing the amount of sulfuric acid the degrada-tion of the carbonized material is facilitated and the formation of carbon smoke reduced. Samples with low nitrogen contents require increased sample amounts in order to bring determinable amounts of nitrogen into the sample tube. Large samples require more sulfuric acid in order to achieve complete digestion.
Dependence on Ratio of Sulfuric Acid to Sulfate SaltWith samples requiring larger amounts of sulfuric acid the ratio of sulfuric acid to sulfate salts has to be kept constant in order to maintain an optimal boiling temperature.
Dependence on Type of CatalystAs described in «2.2.4 Catalyst Used for Digestion», p. 22, different types of catalysts are commercially available for specific types of samples. Fat, oil and hetero cyclic aromatic compounds are more easily digested if the catalyst con-tains selenium.
Further optimizations of the conditions of digestions can be achieved by the measures shown in Table 19. Large liquid samples for the determination of total Kjeldahl nitrogen (TKN) can be handled more easily if boiling rods are used. Boil-ing chips are not recommended because they can cause problems to the distil-lation units by congesting and blocking hoses and they can lead to damage of membranes in valves and pumps. Antifoam agents generally reduce the surface tension and viscosity of samples which facilitates the release of gases from the foam. A commonly appropriate antifoam agent is stearic acid of which a tip of a spatula usually is sufficient to suppress foaming. The amount of foam formed is proportional to the sample amount and thus foaming can be controlled by minimizing this amount. Consequently also larger glass sample tubes of 500 mL instead of 300 mL are a solution to the problems. Critical samples may also be pretreated or predigested at room temperature with hydrogen peroxide.
Sample Boiling Rods Antifoam Agent Temperature Ramp
TKN: large volume Foaming
yes no
no yes
no yes
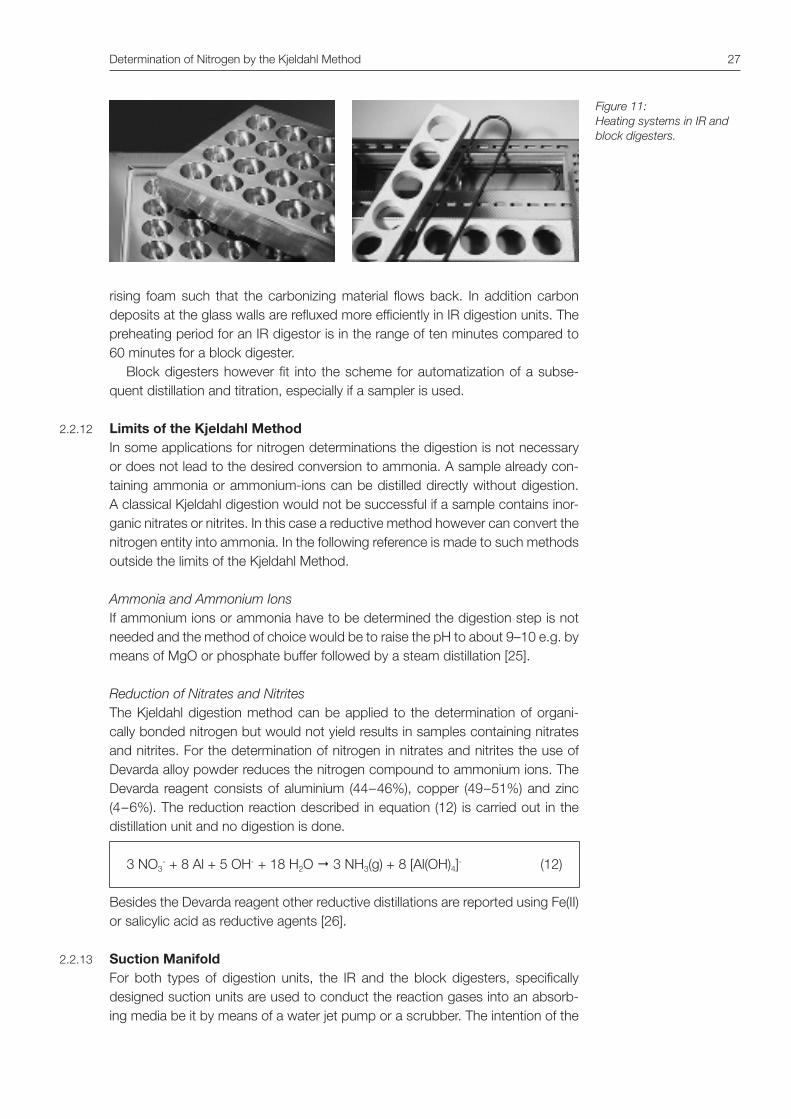
IR-Digestion versus Block-DigestionIR and block digestions are both suitable for all applications but optimal diges-tion parameters usually differ slightly. IR digestors usually show a reduced risk for foaming because the higher heating zone apparently breaks the bubbles of
Table 18:Correlation of times when samples become trans-lucent (clearing) and total digestion time with recovery rates using selenium and mercury free Kjeldahl tablets (see Table 15).
Table 19:Further measures for im-proved conditions in diges-tions, of boiling and foaming samples.
2.2.11
Determination of Nitrogen by the Kjeldahl Method 27
rising foam such that the carbonizing material flows back. In addition carbon deposits at the glass walls are refluxed more efficiently in IR digestion units. The preheating period for an IR digestor is in the range of ten minutes compared to 60 minutes for a block digester.
Block digesters however fit into the scheme for automatization of a subse-quent distillation and titration, especially if a sampler is used.
Limits of the Kjeldahl MethodIn some applications for nitrogen determinations the digestion is not necessary or does not lead to the desired conversion to ammonia. A sample already con-taining ammonia or ammonium-ions can be distilled directly without digestion. A classical Kjeldahl digestion would not be successful if a sample contains inor-ganic nitrates or nitrites. In this case a reductive method however can convert the nitrogen entity into ammonia. In the following reference is made to such methods outside the limits of the Kjeldahl Method.
Ammonia and Ammonium IonsIf ammonium ions or ammonia have to be determined the digestion step is not needed and the method of choice would be to raise the pH to about 9–10 e.g. by means of MgO or phosphate buffer followed by a steam distillation [25].
Reduction of Nitrates and NitritesThe Kjeldahl digestion method can be applied to the determination of organi-cally bonded nitrogen but would not yield results in samples containing nitrates and nitrites. For the determination of nitrogen in nitrates and nitrites the use of Devarda alloy powder reduces the nitrogen compound to ammonium ions. The Devarda reagent consists of aluminium (44–46%), copper (49–51%) and zinc (4–6%). The reduction reaction described in equation (12) is carried out in the distillation unit and no digestion is done.
3 NO3- + 8 Al + 5 OH- + 18 H2O � 3 NH3(g) + 8 [Al(OH)4]- (12)
Besides the Devarda reagent other reductive distillations are reported using Fe(II) or salicylic acid as reductive agents [26].
Suction ManifoldFor both types of digestion units, the IR and the block digesters, specifically designed suction units are used to conduct the reaction gases into an absorb-ing media be it by means of a water jet pump or a scrubber. The intention of the
2.2.13
Figure 11: Heating systems in IR and block digesters.
2.2.12
28 Determination of Nitrogen by the Kjeldahl Method
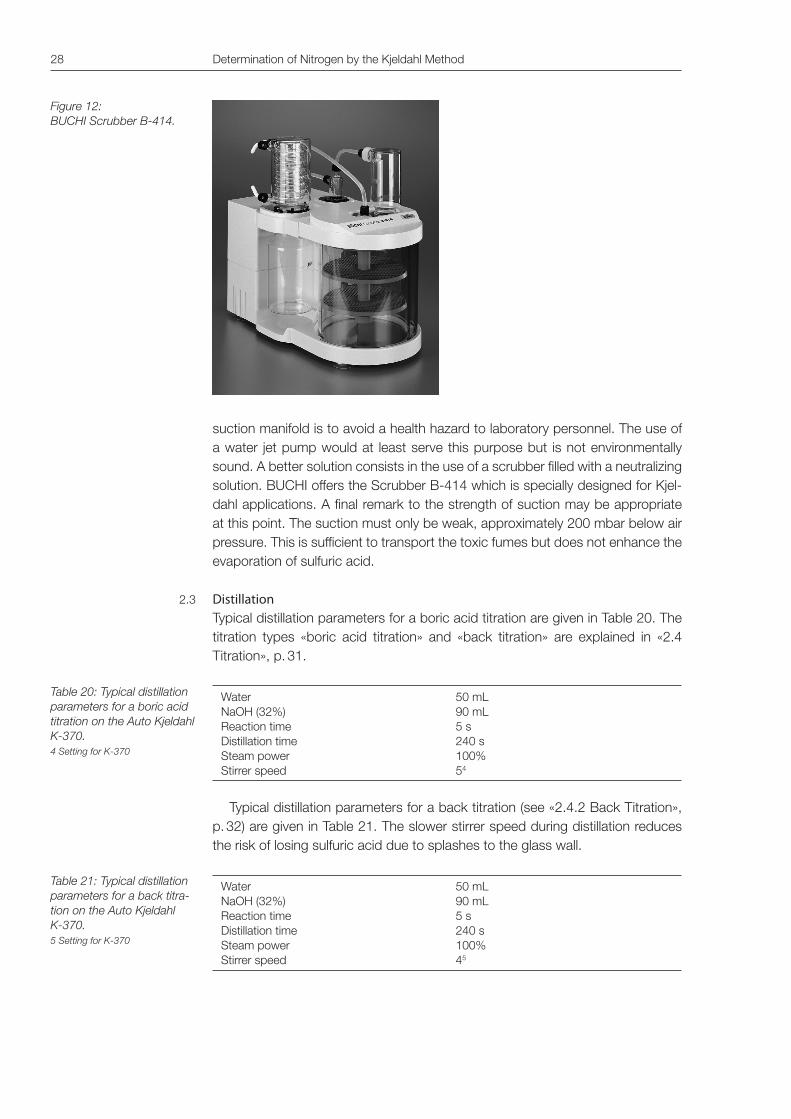
suction manifold is to avoid a health hazard to laboratory personnel. The use of a water jet pump would at least serve this purpose but is not environmentally sound. A better solution consists in the use of a scrubber filled with a neutralizing solution. BUCHI offers the Scrubber B-414 which is specially designed for Kjel-dahl applications. A final remark to the strength of suction may be appropriate at this point. The suction must only be weak, approximately 200 mbar below air pressure. This is sufficient to transport the toxic fumes but does not enhance the evaporation of sulfuric acid.
DistillationTypical distillation parameters for a boric acid titration are given in Table 20. The titration types «boric acid titration» and «back titration» are explained in «2.4 Titration», p. 31.
Water NaOH (32%) Reaction time Distillation time Steam power Stirrer speed
50 mL 90 mL 5 s 240 s 100% 54
Typical distillation parameters for a back titration (see «2.4.2 Back Titration», p. 32) are given in Table 21. The slower stirrer speed during distillation reduces the risk of losing sulfuric acid due to splashes to the glass wall.
Water NaOH (32%) Reaction time Distillation time Steam power Stirrer speed
50 mL 90 mL 5 s 240 s 100% 45
Table 21: Typical distillation parameters for a back titra-tion on the Auto Kjeldahl K-370.5 Setting for K-370
Table 20: Typical distillation parameters for a boric acid titration on the Auto Kjeldahl K-370.4 Setting for K-370
2.3
Figure 12: BUCHI Scrubber B-414.
Determination of Nitrogen by the Kjeldahl Method 29
Diluting the Digestion SolutionBefore the sulfuric acid is neutralized by adding concentrated sodium hydroxide solution the sample is diluted with distilled water. This is done to avoid splashing of the sample due to boiling induced by the heat of reaction dissipated when the concentrated acid and base are mixed.
If digested samples cannot be processed directly after cooling, when stand-ing for some minutes to hours, crystallization of the samples can be observed. In manual distillations this may lead to too low results for nitrogen if the solids are not dissolved. If the Kjeldahl Sampler K-371 is used solid samples would hamper sample transfer resulting in an error message and the determination to be skipped. If samples are diluted with 10–20 mL of water just after cooling, crystallization can be avoided.
Neutralizing the Digestion SolutionThe strong acid keeps the ammonium ions dissolved in the sample tube. Neu-tralizing the acid by means of concentrated sodium hydroxide solution drives the chemical equilibrium between ammonium ions and ammonia towards the production of ammonia. In a basic environment ammonia can be driven out of the sample by means of steam distillation. The chemical reactions for the neutral-ization and the distillation are described by equation (2) p. 11.
Steam DistillationAfter the neutralization of the acid a waiting period of some seconds, called «reaction time» is set by the distillation unit in order to avoid splashes due to overheating when the hot steam enters the mixture already heated by the neu-tralization reaction. A distillation should last long enough such that more than 99.5% of the ammonia is recovered in the receiver vessel. A typical distillation time is 4 minutes at a steam power setting of 100%.
The starting volume for a distillation in 300 mL glass sample tubes should not be larger than 200 mL and in 500 mL tubes a volume of 300 mL should not be exceeded. If the starting volume is too large a risk of carry over of sample solu-tion into the cooler and receiver is possible.
2.3.2
2.3.3
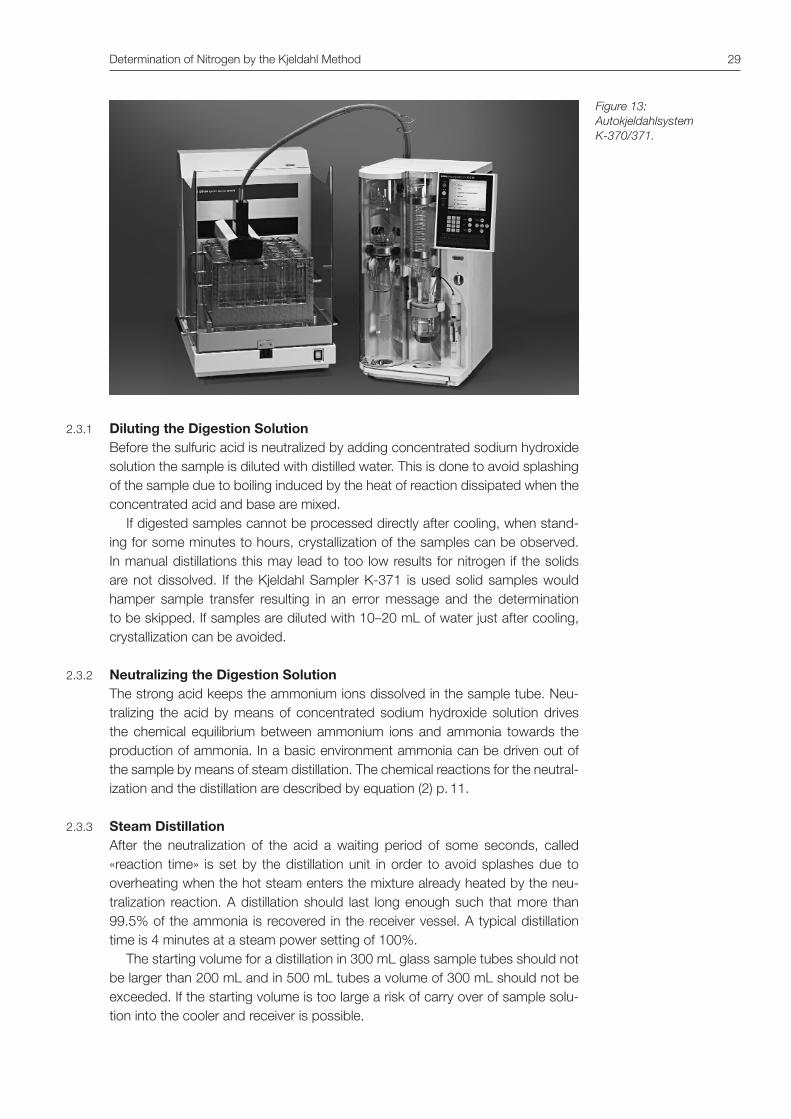
Figure 13: Autokjeldahlsystem K-370/371.
2.3.1
30 Determination of Nitrogen by the Kjeldahl Method
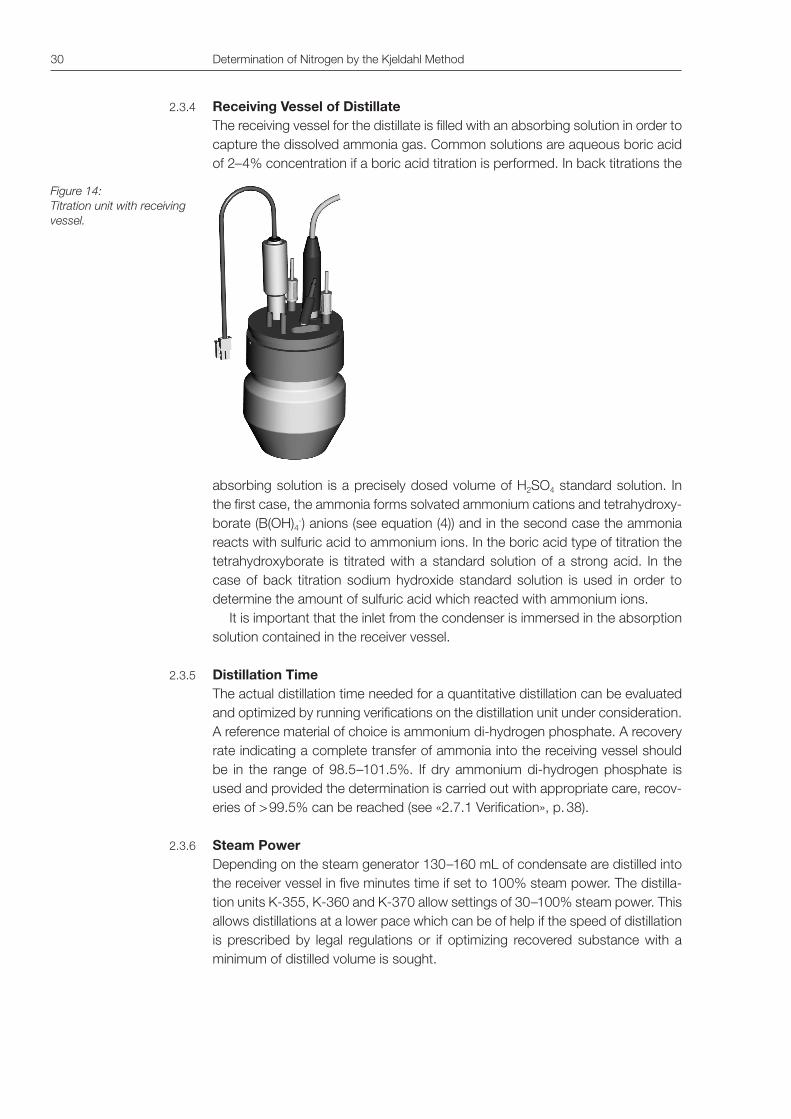
Receiving Vessel of DistillateThe receiving vessel for the distillate is filled with an absorbing solution in order to capture the dissolved ammonia gas. Common solutions are aqueous boric acid of 2–4% concentration if a boric acid titration is performed. In back titrations the
absorbing solution is a precisely dosed volume of H2SO4 standard solution. In the first case, the ammonia forms solvated ammonium cations and tetrahydroxy-borate (B(OH)4-) anions (see equation (4)) and in the second case the ammonia reacts with sulfuric acid to ammonium ions. In the boric acid type of titration the tetrahydroxyborate is titrated with a standard solution of a strong acid. In the case of back titration sodium hydroxide standard solution is used in order to determine the amount of sulfuric acid which reacted with ammonium ions.
It is important that the inlet from the condenser is immersed in the absorption solution contained in the receiver vessel.
Distillation TimeThe actual distillation time needed for a quantitative distillation can be evaluated and optimized by running verifications on the distillation unit under consideration. A reference material of choice is ammonium di-hydrogen phosphate. A recovery rate indicating a complete transfer of ammonia into the receiving vessel should be in the range of 98.5–101.5%. If dry ammonium di-hydrogen phosphate is used and provided the determination is carried out with appropriate care, recov-eries of > 99.5% can be reached (see «2.7.1 Verification», p. 38).
Steam PowerDepending on the steam generator 130–160 mL of condensate are distilled into the receiver vessel in five minutes time if set to 100% steam power. The distilla-tion units K-355, K-360 and K-370 allow settings of 30–100% steam power. This allows distillations at a lower pace which can be of help if the speed of distillation is prescribed by legal regulations or if optimizing recovered substance with a minimum of distilled volume is sought.
2.3.5
2.3.6
Figure 14: Titration unit with receiving vessel.
2.3.4
Determination of Nitrogen by the Kjeldahl Method 31
TitrationAfter the completed steam distillation the determination is concluded by a quan-tification of ammonia. This is most commonly done by means of titration. With the BUCHI distillation units K-350 and K-355 titrations have to be carried out separately either manually using a burette or by means of titrator using either a pH-electrode or a colorimetric electrode. With the BUCHI distillation unit K-360 it is possible to connect a titration unit and initiate titration by a TTL signal. Finally the high end distillation unit K-370 is equipped with a built-in titrator and the software for the respective data evaluation.
Two types of titrations are commonly used, the boric acid titration being the method of choice because it allows automatization without further equipment. The alternative type of titration is called back titration. The two types of titrations are described in the following.
It is necessary to verify that there are no air bubbles in the tubing of the titrant. Air bubbles will cause a false titrant consumption reading, yielding high results. In-correct results may also be caused by wrong titrant, calculation errors or a defec-tive or badly calibrated electrode (see also chapter «3 Troubleshooting» p. 41).
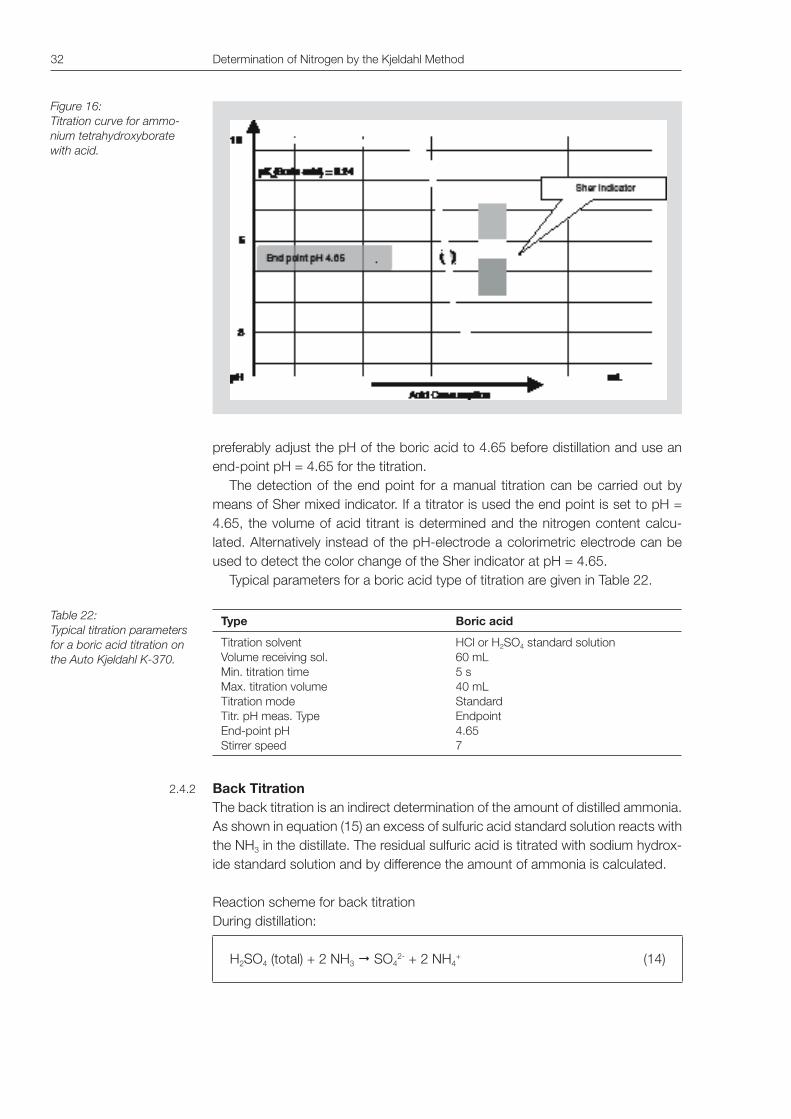
Boric Acid TitrationAs shown in equation (4) ammonia and boric acid form ammonium- and tetrahy-droxyborate ions. According to equation (10) the pH rises upon addition of NH3 during the distillation when the NH3 is captured by the transformation into NH4
+-ions. In the titration with sulphuric acid standard solution the tetrahydroxyborate anions react to ammonium sulfate and boric acid. The reaction scheme is given in equation (13).
2 NH4+B(OH)4- + H2SO4 � (NH4
+)2SO42- + 2 B(OH)3 + 2 H2O (13)
By the addition of acid titrant the ratio of tetrahydryoxborate and boric acid becomes smaller and in agreement with the equation (10) the pH decreases. As can be seen from Figure 16 the point of inflection of the titration curve is at pH = 4.65 (see «5.1 Two-Stage Mixed Indicator, p. 44). This is the reason for
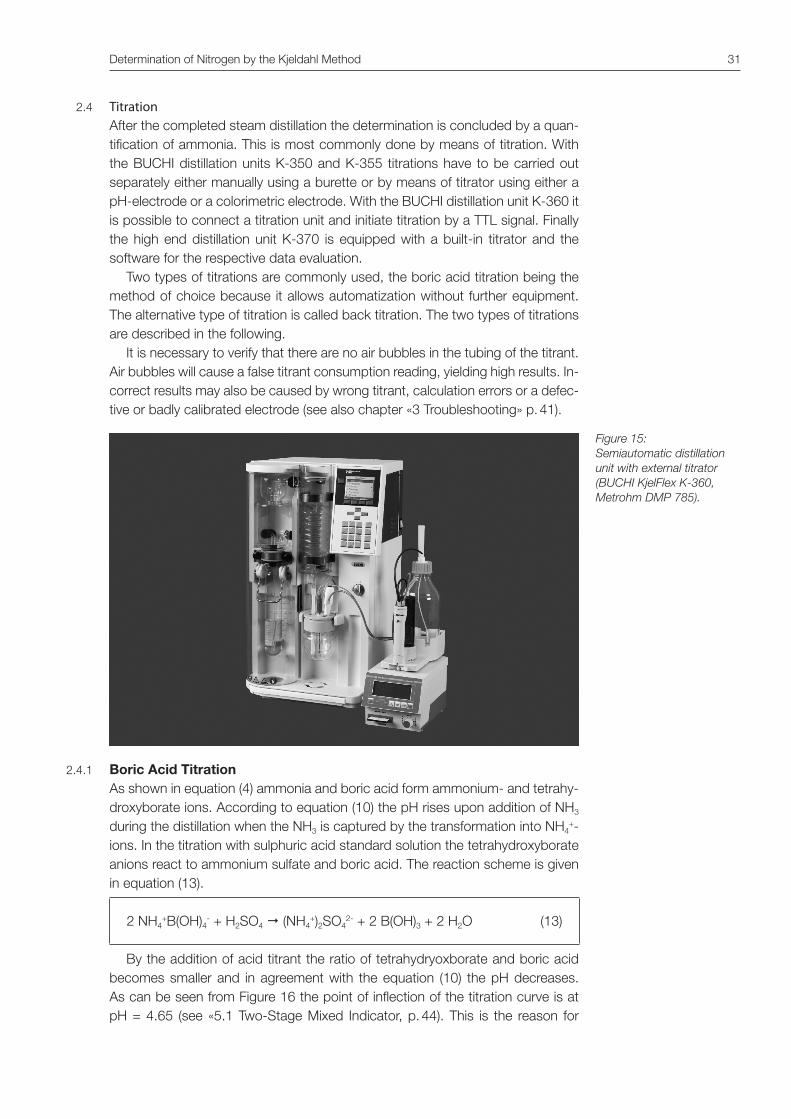
Figure 15: Semiautomatic distillation unit with external titrator (BUCHI KjelFlex K-360, Metrohm DMP 785).
2.4.1
2.4
32 Determination of Nitrogen by the Kjeldahl Method
Table 22:Typical titration parameters for a boric acid titration on the Auto Kjeldahl K-370.
2.4.2
preferably adjust the pH of the boric acid to 4.65 before distillation and use an end-point pH = 4.65 for the titration.
The detection of the end point for a manual titration can be carried out by means of Sher mixed indicator. If a titrator is used the end point is set to pH = 4.65, the volume of acid titrant is determined and the nitrogen content calcu-lated. Alternatively instead of the pH-electrode a colorimetric electrode can be used to detect the color change of the Sher indicator at pH = 4.65.
Typical parameters for a boric acid type of titration are given in Table 22.
Type Boric acid
Titration solventVolume receiving sol.Min. titration timeMax. titration volumeTitration modeTitr. pH meas. TypeEnd-point pHStirrer speed
HCl or H2SO4 standard solution60 mL5 s40 mLStandardEndpoint4.657
Back TitrationThe back titration is an indirect determination of the amount of distilled ammonia. As shown in equation (15) an excess of sulfuric acid standard solution reacts with the NH3 in the distillate. The residual sulfuric acid is titrated with sodium hydrox-ide standard solution and by difference the amount of ammonia is calculated.
Reaction scheme for back titrationDuring distillation:
H2SO4 (total) + 2 NH3 � SO42- + 2 NH4
+ (14)
Figure 16:Titration curve for ammo-nium tetrahydroxyborate with acid.

Determination of Nitrogen by the Kjeldahl Method 33
During titration:
H2SO4 (residual) + 2 OH- � SO42- + 2 H2O (15)
In equation (14) the chemical reaction during the distillation is described and in (15) the chemical reaction during the titration with sodium hydroxide standard solution is given. The difference of the initial amount of sulfuric acid (H2SO4 (total)) and the amount of sulfuric acid present after the distillation (H2SO4 (residual)) cor-responds to the distilled ammonia.
The titration of a strong acid with a strong base requires an indicator exhibiting a pKa close to 7 if a manual titration is performed. If a titration stand is used an end point of pH = 4.5–9.5 is appropriate. The amount of ammonia is calculated according to equations (21) to (25) (see chapter «2.5.1 Calculation for Boric Acid Titration», p. 34). The blank titration is carried out with an empty sample tube and basically corresponds to the initial amount of H2SO4. Small amounts of ammonia however, stemming from contaminations of the system, are accounted for by including blank determinations into the procedure.
Typical parameters for a titration of the type «back titration» are shown in Table 23.
Type Back titration
Titration solvent Receiving solvent Volume receiving sol. Min. titration time Max. titration volume Titration mode Titr. pH meas. Type End-point pH Stirrer speed
NaOH standard solution H2SO4 0.1 M 60 mL 1 s 40 mL Standard Endpoint 4.8 4
CalculationsCalculations can aim at results expressed in absolute amounts of nitrogen mgN per sample or in terms of concentrations either %N, mgN/kg, mgN/L etc.
The parameters needed for the calculations are:Known parameterscacid True concentration of standard acid solution6 0.005 mol/L–0.5 mol/Lz Valency of reaction 1 for HCl, 2 for H2SO4
cNaOH Nominal concentration of standard base solution7 0.005 mol/L–0.5 mol/LM(N) Atomic mass of nitrogen 14.0067 g/mol
Experimentally determined parametersVblank Titrant consumption for blank [mL]msample Sample weight [g]Volsample Sample volume [mL]Vsample Titrant consumption for sample [mL]fNaOH Titer of NaOH titrant dimensionless
Table 23:Typical titration parameters for a back titration on the Auto Kjeldahl K-370.
2.5
6 It is assumed that a commer-cially available standard acid solution is used.
7 Unless a fresh commercially available standard NaOH solu-tion is used, the titer has to be determined.
34 Determination of Nitrogen by the Kjeldahl Method
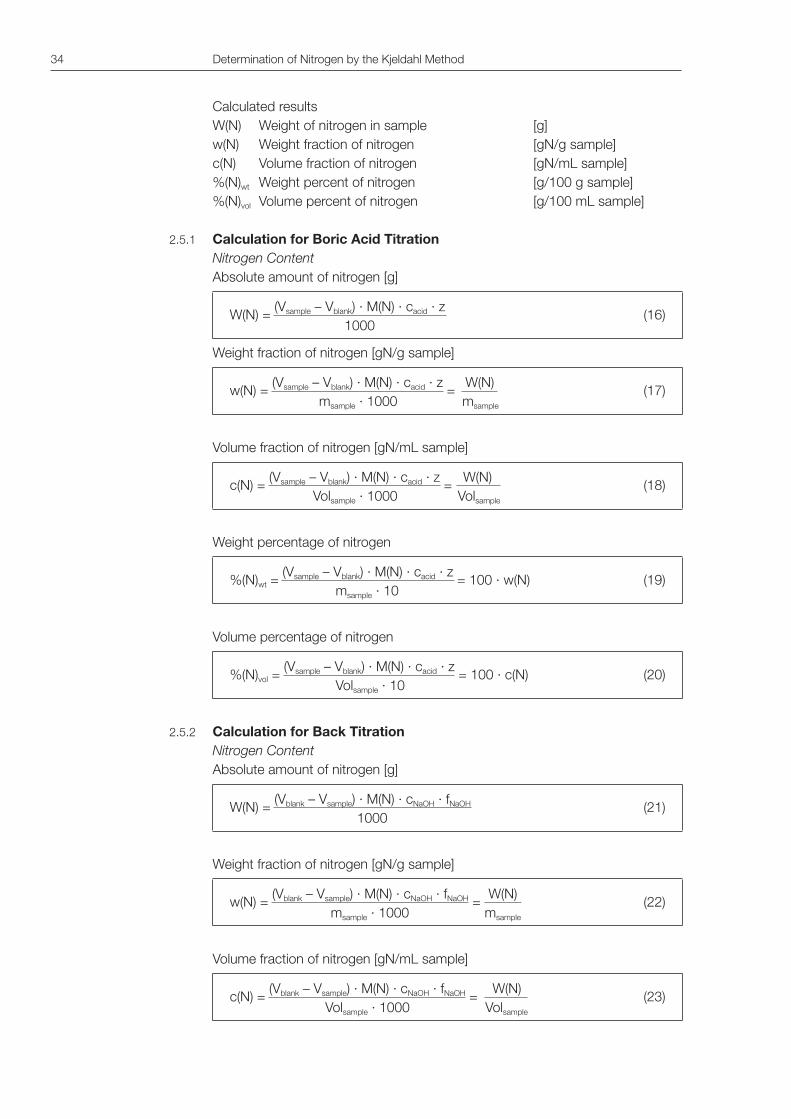
Calculated resultsW(N) Weight of nitrogen in sample [g]w(N) Weight fraction of nitrogen [gN/g sample]c(N) Volume fraction of nitrogen [gN/mL sample]%(N)wt Weight percent of nitrogen [g/100 g sample]%(N)vol Volume percent of nitrogen [g/100 mL sample]
Calculation for Boric Acid TitrationNitrogen ContentAbsolute amount of nitrogen [g]
W(N) = (Vsample – Vblank) · M(N) · cacid · z (16)
1000
Weight fraction of nitrogen [gN/g sample]
w(N) = (Vsample – Vblank) · M(N) · cacid · z
= W(N)
(17) msample · 1000 msample
Volume fraction of nitrogen [gN/mL sample]
c(N) = (Vsample – Vblank) · M(N) · cacid · z
= W(N)
(18) Volsample · 1000 Volsample
Weight percentage of nitrogen
%(N)wt = (Vsample – Vblank) · M(N) · cacid · z
= 100 · w(N) (19) msample · 10
Volume percentage of nitrogen
%(N)vol = (Vsample – Vblank) · M(N) · cacid · z
= 100 · c(N) (20) Volsample · 10
Calculation for Back TitrationNitrogen ContentAbsolute amount of nitrogen [g]
W(N) = (Vblank – Vsample) · M(N) · cNaOH · fNaOH (21)
1000
Weight fraction of nitrogen [gN/g sample]
w(N) = (Vblank – Vsample) · M(N) · cNaOH · fNaOH
= W(N)
(22) msample · 1000 msample
Volume fraction of nitrogen [gN/mL sample]
c(N) = (Vblank – Vsample) · M(N) · cNaOH · fNaOH
= W(N)
(23) Volsample · 1000 Volsample
2.5.2
2.5.1
Determination of Nitrogen by the Kjeldahl Method 35
Weight percentage of nitrogen
%(N)wt = (Vblank – Vsample) · M(N) · cNaOH · fNaOH
= 100 · w(N) (24) msample · 10
Volume percentage of nitrogen
%(N)Vol = (Vblank – Vsample) · M(N) · cNaOH · fNaOH
= 100 · c(N) (25) Volsample · 10
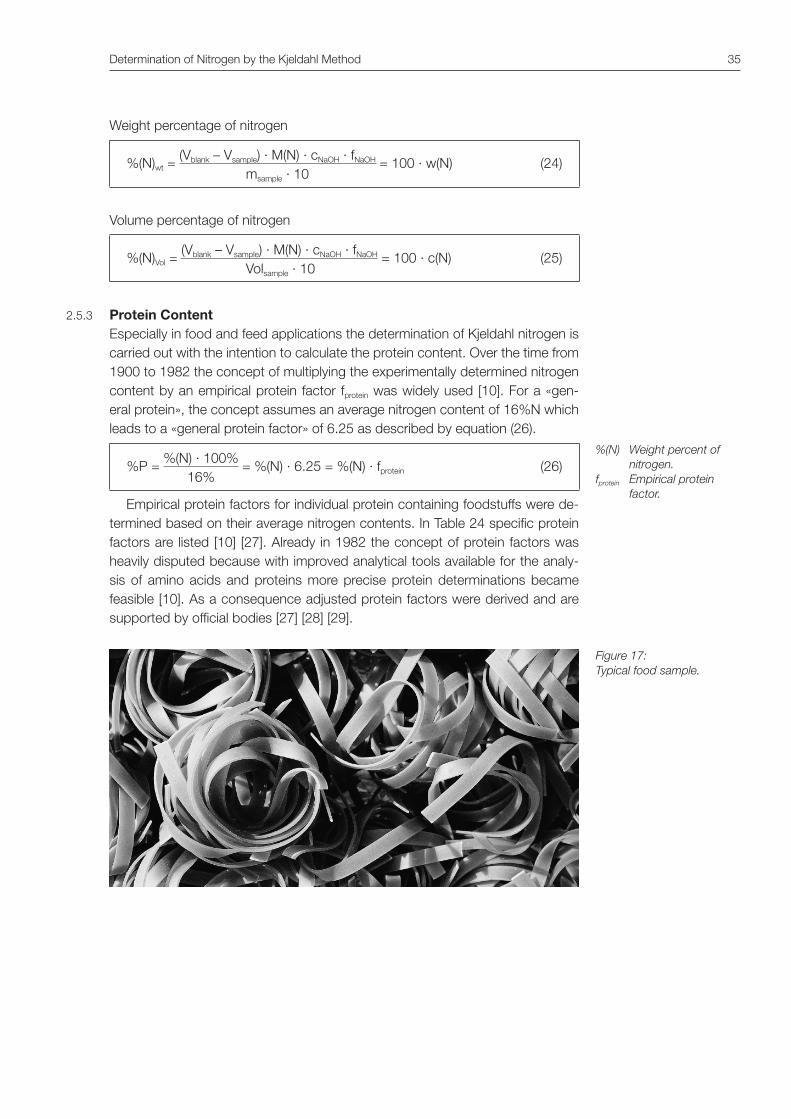
Protein ContentEspecially in food and feed applications the determination of Kjeldahl nitrogen is carried out with the intention to calculate the protein content. Over the time from 1900 to 1982 the concept of multiplying the experimentally determined nitrogen content by an empirical protein factor fprotein was widely used [10]. For a «gen-eral protein», the concept assumes an average nitrogen content of 16%N which leads to a «general protein factor» of 6.25 as described by equation (26).
%P = %(N) · 100%
= %(N) · 6.25 = %(N) · fprotein (26) 16%
Empirical protein factors for individual protein containing foodstuffs were de-termined based on their average nitrogen contents. In Table 24 specific protein factors are listed [10] [27]. Already in 1982 the concept of protein factors was heavily disputed because with improved analytical tools available for the analy-sis of amino acids and proteins more precise protein determinations became feasible [10]. As a consequence adjusted protein factors were derived and are supported by official bodies [27] [28] [29].
Figure 17: Typical food sample.
2.5.3
%(N) Weight percent of nitrogen.
fprotein Empirical protein factor.

36 Determination of Nitrogen by the Kjeldahl Method
Food Factor
General 6.25
Animal origin Eggs and egg products Gelatine Meat and meat products Fish, sea animals Milk, milk products, cheese, whey
6.25 5.55 6.25 6.25 6.38
Grains & cereals Barley, oats, rye Corn Rize Wheat Barley, oats, rye Full grain products Bran
5.83 6.25 5.95 5.70 5.83 5.83 6.31
Fruits Fruits and fruit products
6.25
Legumes Vegetables and products made of veg-etables (except of soy) Beans Soy and soy products
6.25 6.25 5.71
Nuts Nuts (treenut, coconut, chestnut etc. except of peanuts and almonds) Peanuts Almonds
5.30 5.46 5.18
Seeds Oilseed (except of peanuts)
5.30
Limit of Detection and Limit of QuantificationFor the evaluation of the limit of detection and the limit of quantification in Kjeldahl nitrogen determinations established rules are given by the German and Euro-pean Norm DIN EN 32 645 [30]. In a rough approximation the limit of detection (xLOD) can be estimated according to equation (27) and the limit of quantification (xLOQ) is expressed by equation (28).
xLOD = 3 · sB (27)
b
xLOQ = 3 · xLOD (28)
Ten blank determinations and a total of 10 data points of equidistant calibra-tion steps in the range of the xLOD and xLOQ are required as a basis for the evalua-tion according to equations (27) and (28). sB is determined from the 10 blank de-terminations and the calibration curve consists of a plot of the known quantities in standard solutions against the experimental results. After the determination of the limits of the analytical procedure results are reported according to a scheme given in Table 25.
2.6
sB Standard deviation of blank determination.
b Slope of calibration curve.
Table 24:Empirical protein factors for the Kjeldahl method.

Determination of Nitrogen by the Kjeldahl Method 37
Result Expression Additional Information
x > = xLOQ xLOD < x < xLOQ x < xLOD
determined content detected not detected
standard deviation can not be determined, xLOQ not higher than 2*xLOD
By means of volumetric titrations nitrogen amounts per sample of as little as 0.05 mg can be detected however associated with relative standard deviations of >1%. Based on evaluations following DIN EN 32 645 for the BUCHI distillation units values of xLOD between 0.1 mg and 0.2 mgN per sample can be found in BUCHI brochures. Using equation (28), it can be estimated that nitrogen quanti-ties of 0.3–0.6 mgN per sample are accessible for quantification.
A short discussion of the limit of quantification and its practical effect on op-timization of sample amounts seems appropriate in this place: Food and feed samples like milk, meat, cereals, beans contain high amounts of proteins and the determined nitrogen content are significantly higher than XLOQ. Fats and carbo-hydrates are more critical samples in this respect. This class of samples tends to foam and requires a large amount of sulfuric acid due to its chemical structure. In addition such materials are usually low in nitrogen thus requiring large sample sizes in order to perform determinations above xLOD. For low N samples an opti-mum has to be found with regard to the limitation of sample size due to the size of the sample tube, the threat of foaming and the demand on sulfuric acid, salt and catalyst. Generally 2 g of sample is the maximum in 300 mL glass sample tubes and 4 g in 500 mL tubes can be handled by Kjeldahl. Larger amounts can be envisaged but need optimized procedures resorting to the use of anti-foam agents, pre digestion by hydrogen peroxide and temperature ramps.
In total Kjeldahl nitrogen (TKN) determinations aqueous samples are involved of which the major portion is evaporated in the digestion process. In TKN deter-minations xLOD and xLOQ often are referred to in terms of concentrations [mg/L]. In TKN analyses sample volumes used in the BUCHI digestion- and distillation units are at a maximum 200 mL if 300 mL glass sample tubes are used and can reach 330 mL in 500 mL glass tubes. Consequently the LOQ’s of nitrogen expressed in [mg/L], sometimes simply referred to as [ppm], is between 0.5 and 1 ppm if 300 mL glass tubes are used and 0.3 and 0.6 ppm in 500 mL sample tubes.
Figure 18: IQ/OQ documentation.
Table 25:Reporting of analytical results [DIN EN 32645).
38 Determination of Nitrogen by the Kjeldahl Method
VerificationIn laboratories working under GLP or similar regulations it is mandatory to prove the correct function of the instrumentation used to perform an analysis. Instru-ment qualifications (IQ), operation qualification (OQ) and performance qualifica-tion (PQ) also require verification of the equipment.
Distillation units are verified by a determination of a stoichiometric, pure and dry ammonium salt of which the nitrogen content can be calculated. The ratio of the determined to the expected nitrogen content is expressed as recovery in %. Recovery rates in a range of 98.5–101.5% are proof for a well performing distilla-tion unit. A well suited substance is ammonium dihydrogen phosphate.
The digestion unit is verified by running a digestion of a stoichiometric, pure and dry nitrogen containing substance which undergoes an unproblematic Kjel-dahl reaction. A well suited substance is glycine.
Verification of Distillation UnitReagents / Chemicals– Sulfuric acid c = 0.25 mol/L– Sulfuric acid conc. 98%– Boric acid 4% (adj. to pH 4.65)– Sodium hydroxide 32% / 33%– Ammonium dihydrogen phosphate 99.5%– Ammonium dihydrogen phosphate Suprapur (99.99%)
The theoretical total nitrogen content of ammonium dihydrogen phosphate is N% = 12.18%.
ProcedureIf the ammonium dihydrogen phosphate contains moisture drying may be re-quired. This extra step is recommended if the resulting recovery rate of a prelimi-nary trial did not yield results in a range of 98.5–101.5%. If drying of the reference substance is needed, use portions of 5–10 g of ammonium dihydrogenphos-phate salt and dry in the oven at a temperature of 105 °C for 8 hours. Let the salt cool down to room temperature in a desiccator filled with activated silica gel or other desiccant. After cooling transfer dry ammonium dihydrogen phosphate to a tight glass container.
Three empty Kjeldahl glass tubes are used as blank samples and three sam-ples of ammonium dihydrogen phosphate are prepared. For each sample weigh in 0.8 g of dried ammonium dihydrogen phosphate with an accuracy of ± 0.1 mg on nitrogen free paper. Transfer the reference including the paper into a Kjeldahl glass sample tube. If nitrogen free paper is not available perform a weight by difference.
2.7.1
2.7
>
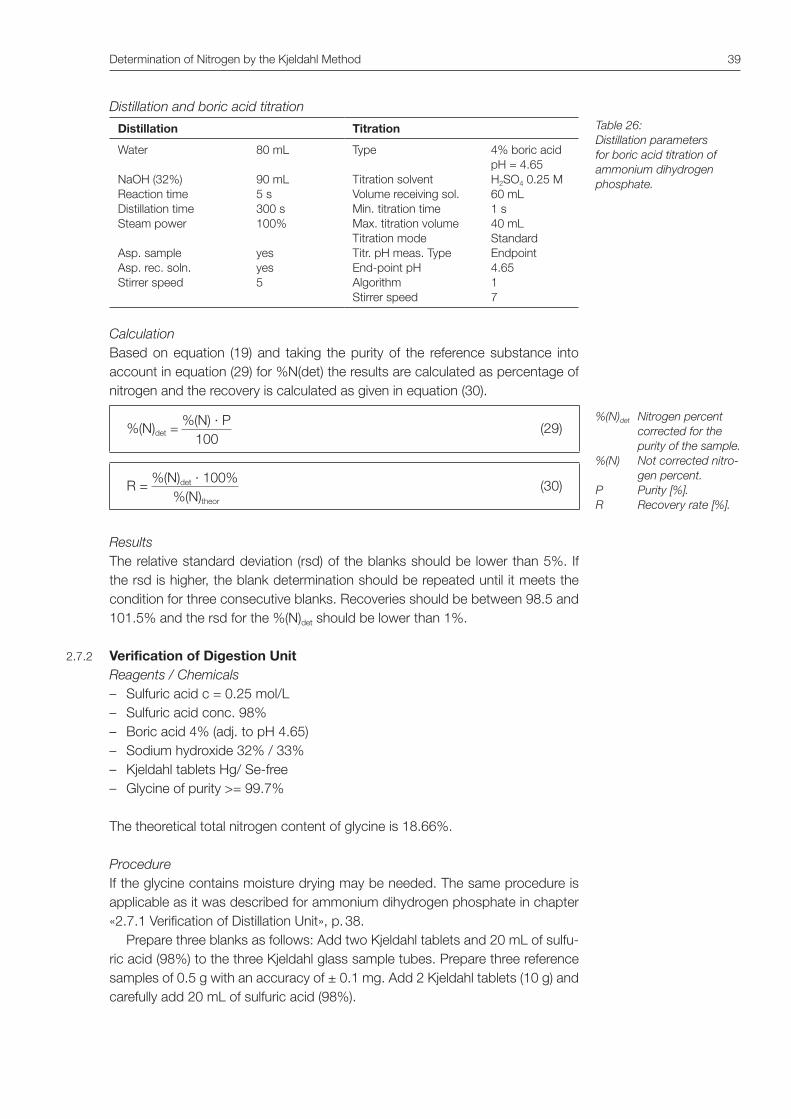
Determination of Nitrogen by the Kjeldahl Method 39
Distillation and boric acid titration
Distillation Titration
Water NaOH (32%) Reaction time Distillation time Steam power Asp. sample Asp. rec. soln. Stirrer speed
80 mL 90 mL 5 s 300 s 100% yes yes 5
Type Titration solvent Volume receiving sol. Min. titration time Max. titration volume Titration mode Titr. pH meas. Type End-point pH Algorithm Stirrer speed
4% boric acid pH = 4.65H2SO4 0.25 M 60 mL 1 s 40 mL Standard Endpoint 4.65 1 7
CalculationBased on equation (19) and taking the purity of the reference substance into account in equation (29) for %N(det) the results are calculated as percentage of nitrogen and the recovery is calculated as given in equation (30).
%(N)det = %(N) · P
(29) 100
R = %(N)det · 100%
(30) %(N)theor
ResultsThe relative standard deviation (rsd) of the blanks should be lower than 5%. If the rsd is higher, the blank determination should be repeated until it meets the condition for three consecutive blanks. Recoveries should be between 98.5 and 101.5% and the rsd for the %(N)det should be lower than 1%.
Verification of Digestion UnitReagents / Chemicals– Sulfuric acid c = 0.25 mol/L– Sulfuric acid conc. 98%– Boric acid 4% (adj. to pH 4.65)– Sodium hydroxide 32% / 33%– Kjeldahl tablets Hg/ Se-free– Glycine of purity >= 99.7%
The theoretical total nitrogen content of glycine is 18.66%.
ProcedureIf the glycine contains moisture drying may be needed. The same procedure is applicable as it was described for ammonium dihydrogen phosphate in chapter «2.7.1 Verification of Distillation Unit», p. 38.
Prepare three blanks as follows: Add two Kjeldahl tablets and 20 mL of sulfu-ric acid (98%) to the three Kjeldahl glass sample tubes. Prepare three reference samples of 0.5 g with an accuracy of ± 0.1 mg. Add 2 Kjeldahl tablets (10 g) and carefully add 20 mL of sulfuric acid (98%).
2.7.2
Table 26: Distillation para meters for boric acid titration of ammonium dihydrogen phosphate.
%(N)det Nitrogen percent corrected for the purity of the sample.
%(N) Not corrected nitro-gen percent.
P Purity [%].R Recovery rate [%].
40 Determination of Nitrogen by the Kjeldahl Method
DigestionPreheat the digestion system to the maximum heat prescribed in the operation manual. Subsequently, digest blanks and reference samples for 90 min at the same temperature. Let the samples cool down to room temperature prior to distillation.
Distillation and boric acid titrationThe digested glycine samples are distilled and titrated using the conditions de-scribed for the distillation and titration of ammonium dihydrogen phosphate.
CalculationThe same equations are used for the calculation as for ammonium dihydrogen phosphate.
ResultsThe same criteria as described for ammonium dihydrogen phosphate apply for glycine.

Troubleshooting 41
Troubleshooting
In Table 27 reasons for failures or incorrect results are given and correlated to corrective measures.
Result Reason Correction
Too high carry over in distillation air bubbles in titration wrong titrant error in calculation
defective pH electrode
use less volume refill burette use right concentration e.g. check molar reaction factor and factor of titrant calibrate, replace
Too low incomplete digestion insufficient H2SO4 incorrect ratio Kjeldahl tablets to sulphuric acid too high nitrogen too low NaOH leaks wrong titrant error in calculation defective pH electrode sampler leak dip tube loose, too short empty reagent containers
repeat corrected repeat corrected repeat corrected use less sample repeat until sample is blue seal check and replace check and correct calibrate, replace repair repair, pull down refill
Poor reproducibility air bubble in system aspiration failure incorrect pH calibration sample homogeneity weighing problems incomplete digestion venting suction module digestion time too short
fix tubings check for leaks and fix repeat with fresh buffer homogenize e.g. use weighing paper improve procedure repeat fix pump, or scrubber check color of samples
Poor accuracy Inhomogeneous sample improper distillation
homogenize sample verification of distillation
Foaming digestion too high sample amount not enough sulfuric acid no anti-foam agent high fat/sugar content
correct correct add stearic acid optimize digestion condi-tions
Run dry digestion bad sealings not enough acid wrong acid/salt ratio too long digestion
replace sealings correct correct use more acid/salt
Crystallization bad end conditions dilute cooled sample
Table 27: Reasons for failures and corrective measures.
3

42 Official Norms and Regulations
Official Norms and Regulations
In Table 28 official methods according to DIN / ISO regulations for the determina-tion of nitrogen in various types of samples are listed. In Table 29 official methods according to AOAC and EPA methods are given.
Nitrogen Content of DIN/ISO Method
Agricultural food products ISO 1871
Ammonium sulfate for industrial use ISO 3332
Milk DIN 8968-1
Non-protein content (NPN) ISO 8968-4
Meat and meat products ISO 937
Starches & derived products ISO 3188
Water quality, Kjeldahl nitrogen ISO 5663 DIN 38409H11
Water quality, ammonium ISO 5664
Water quality, ammonium, potentiometric method ISO 6778
Ammonia-nitrogen in water, waste water and sludge DIN 38406-E5-2
Animal feeding stuffs – Determination of nitrogen content and calculation of crude protein content
ISO 5983-2
Rubbers Rubber, raw natural and rubber latex, natural – Determination of nitrogen content
ISO 1656 (1996 E)
Table 28: Kjeldahl nitrogen determina-tions according to DIN/ISO regulations.
4
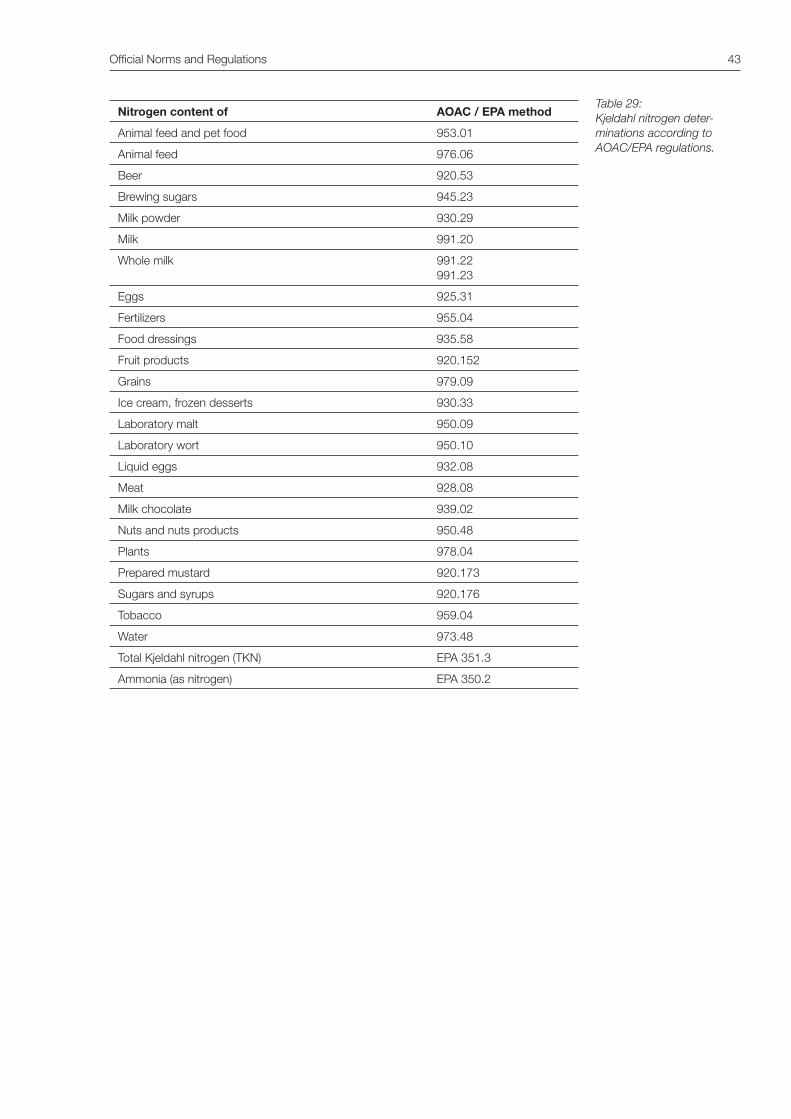
Official Norms and Regulations 43
Nitrogen content of AOAC / EPA method
Animal feed and pet food 953.01
Animal feed 976.06
Beer 920.53
Brewing sugars 945.23
Milk powder 930.29
Milk 991.20
Whole milk 991.22 991.23
Eggs 925.31
Fertilizers 955.04
Food dressings 935.58
Fruit products 920.152
Grains 979.09
Ice cream, frozen desserts 930.33
Laboratory malt 950.09
Laboratory wort 950.10
Liquid eggs 932.08
Meat 928.08
Milk chocolate 939.02
Nuts and nuts products 950.48
Plants 978.04
Prepared mustard 920.173
Sugars and syrups 920.176
Tobacco 959.04
Water 973.48
Total Kjeldahl nitrogen (TKN) EPA 351.3
Ammonia (as nitrogen) EPA 350.2
Table 29:Kjeldahl nitrogen deter-minations according to AOAC/EPA regulations.
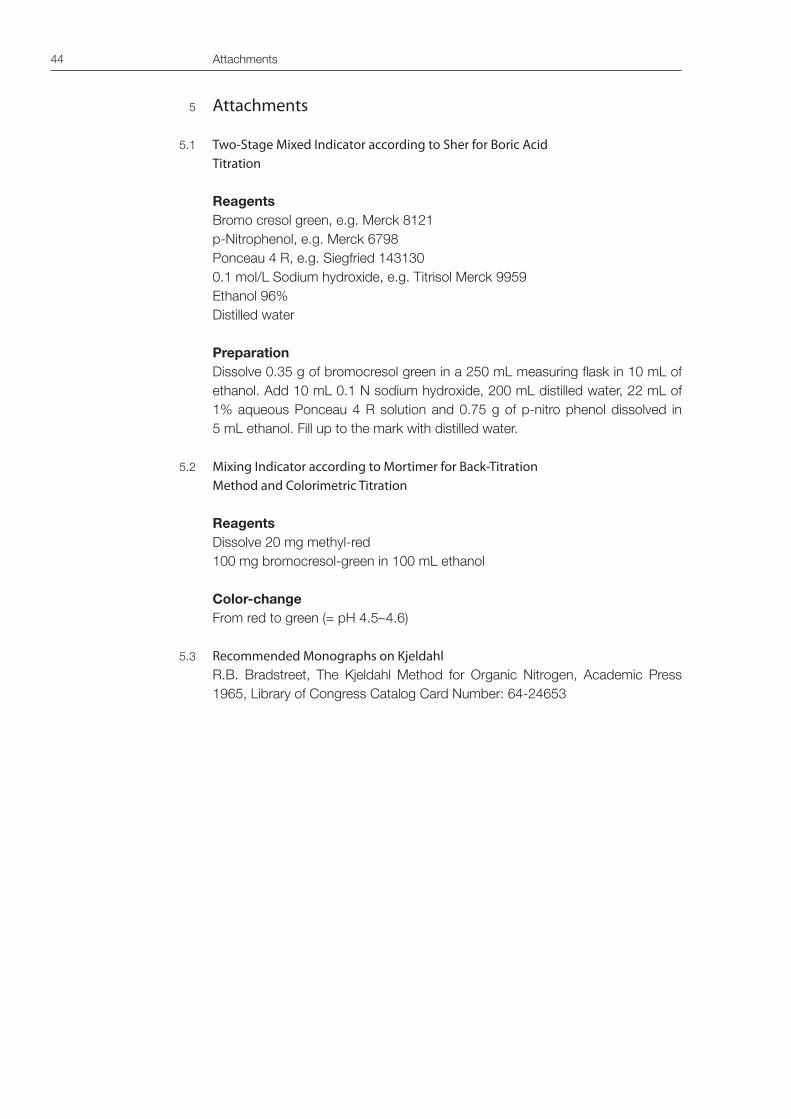
44 Attachments
Attachments
Two-Stage Mixed Indicator according to Sher for Boric Acid Titration
ReagentsBromo cresol green, e.g. Merck 8121p-Nitrophenol, e.g. Merck 6798Ponceau 4 R, e.g. Siegfried 1431300.1 mol/L Sodium hydroxide, e.g. Titrisol Merck 9959Ethanol 96%Distilled water
PreparationDissolve 0.35 g of bromocresol green in a 250 mL measuring flask in 10 mL of ethanol. Add 10 mL 0.1 N sodium hydroxide, 200 mL distilled water, 22 mL of 1% aqueous Ponceau 4 R solution and 0.75 g of p-nitro phenol dissolved in 5 mL ethanol. Fill up to the mark with distilled water.
Mixing Indicator according to Mortimer for Back-Titration Method and Colorimetric Titration
ReagentsDissolve 20 mg methyl-red100 mg bromocresol-green in 100 mL ethanol
Color-changeFrom red to green (= pH 4.5–4.6)
Recommended Monographs on KjeldahlR.B. Bradstreet, The Kjeldahl Method for Organic Nitrogen, Academic Press 1965, Library of Congress Catalog Card Number: 64-24653
5
5.1
5.2
5.3
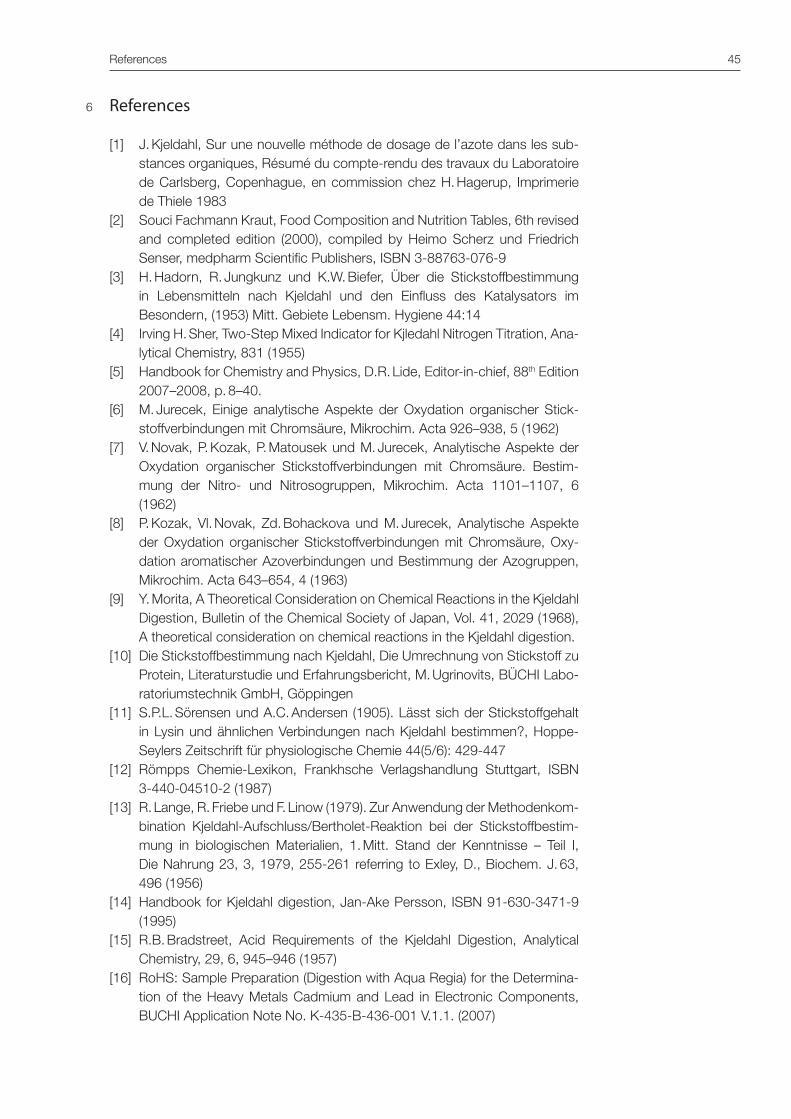
References 45
References
[1] J. Kjeldahl, Sur une nouvelle méthode de dosage de l’azote dans les sub-stances organiques, Résumé du compte-rendu des travaux du Laboratoire de Carlsberg, Copenhague, en commission chez H. Hagerup, Imprimerie de Thiele 1983
[2] Souci Fachmann Kraut, Food Composition and Nutrition Tables, 6th revised and completed edition (2000), compiled by Heimo Scherz und Friedrich Senser, medpharm Scientific Publishers, ISBN 3-88763-076-9
[3] H. Hadorn, R. Jungkunz und K.W. Biefer, Über die Stickstoffbestimmung in Lebensmitteln nach Kjeldahl und den Einfluss des Katalysators im Besondern, (1953) Mitt. Gebiete Lebensm. Hygiene 44:14
[4] Irving H. Sher, Two-Step Mixed Indicator for Kjledahl Nitrogen Titration, Ana-lytical Chemistry, 831 (1955)
[5] Handbook for Chemistry and Physics, D.R. Lide, Editor-in-chief, 88th Edition 2007–2008, p. 8–40.
[6] M. Jurecek, Einige analytische Aspekte der Oxydation organischer Stick-stoffverbindungen mit Chromsäure, Mikrochim. Acta 926–938, 5 (1962)
[7] V. Novak, P. Kozak, P. Matousek und M. Jurecek, Analytische Aspekte der Oxydation organischer Stickstoffverbindungen mit Chromsäure. Bestim-mung der Nitro- und Nitrosogruppen, Mikrochim. Acta 1101–1107, 6 (1962)
[8] P. Kozak, Vl. Novak, Zd. Bohackova und M. Jurecek, Analytische Aspekte der Oxydation organischer Stickstoffverbindungen mit Chromsäure, Oxy-dation aromatischer Azoverbindungen und Bestimmung der Azogruppen, Mikrochim. Acta 643–654, 4 (1963)
[9] Y. Morita, A Theoretical Consideration on Chemical Reactions in the Kjeldahl Digestion, Bulletin of the Chemical Society of Japan, Vol. 41, 2029 (1968), A theoretical consideration on chemical reactions in the Kjeldahl digestion.
[10] Die Stickstoffbestimmung nach Kjeldahl, Die Umrechnung von Stickstoff zu Protein, Literaturstudie und Erfahrungsbericht, M. Ugrinovits, BÜCHI Labo-ratoriumstechnik GmbH, Göppingen
[11] S.P.L. Sörensen und A.C. Andersen (1905). Lässt sich der Stickstoffgehalt in Lysin und ähnlichen Verbindungen nach Kjeldahl bestimmen?, Hoppe-Seylers Zeitschrift für physiologische Chemie 44(5/6): 429-447
[12] Römpps Chemie-Lexikon, Frankhsche Verlagshandlung Stuttgart, ISBN 3-440-04510-2 (1987)
[13] R. Lange, R. Friebe und F. Linow (1979). Zur Anwendung der Methodenkom-bination Kjeldahl-Aufschluss/Bertholet-Reaktion bei der Stickstoffbestim-mung in biologischen Materialien, 1. Mitt. Stand der Kenntnisse – Teil I, Die Nahrung 23, 3, 1979, 255-261 referring to Exley, D., Biochem. J. 63, 496 (1956)
[14] Handbook for Kjeldahl digestion, Jan-Ake Persson, ISBN 91-630-3471-9 (1995)
[15] R.B. Bradstreet, Acid Requirements of the Kjeldahl Digestion, Analytical Chemistry, 29, 6, 945–946 (1957)
[16] RoHS: Sample Preparation (Digestion with Aqua Regia) for the Determina-tion of the Heavy Metals Cadmium and Lead in Electronic Components, BUCHI Application Note No. K-435-B-436-001 V.1.1. (2007)
6
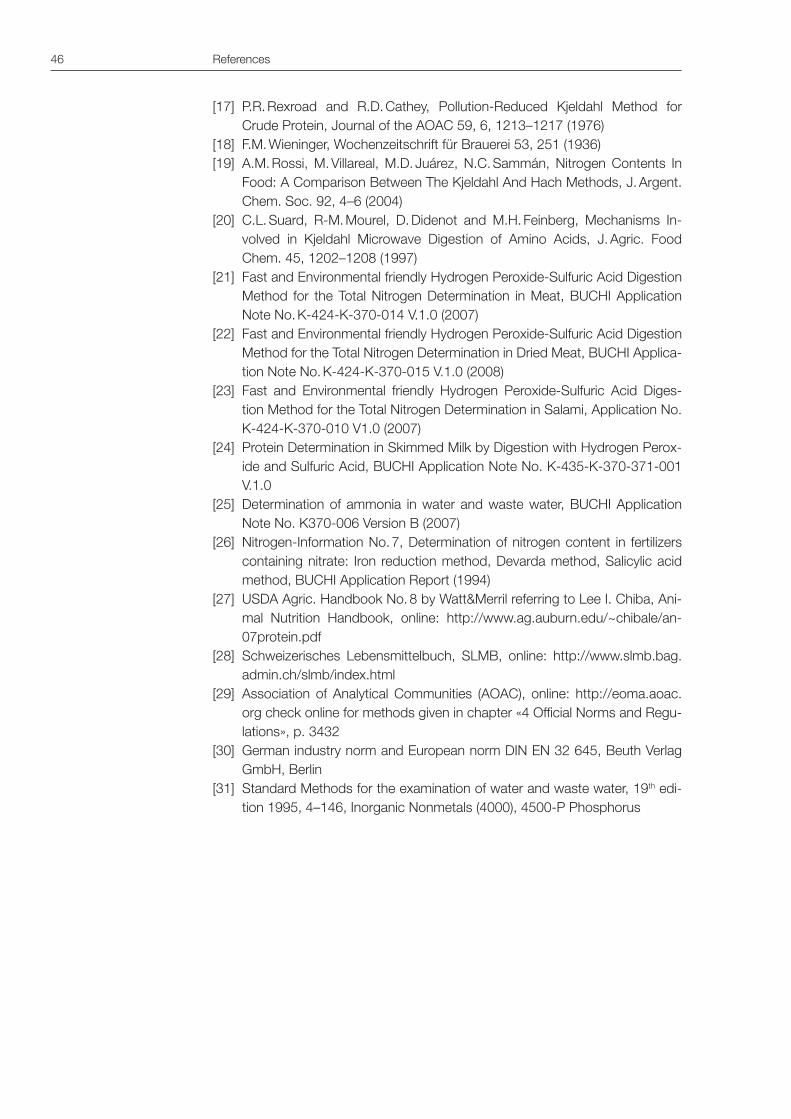
46 References
[17] P.R. Rexroad and R.D. Cathey, Pollution-Reduced Kjeldahl Method for Crude Protein, Journal of the AOAC 59, 6, 1213–1217 (1976)
[18] F.M. Wieninger, Wochenzeitschrift für Brauerei 53, 251 (1936)[19] A.M. Rossi, M. Villareal, M.D. Juárez, N.C. Sammán, Nitrogen Contents In
Food: A Comparison Between The Kjeldahl And Hach Methods, J. Argent. Chem. Soc. 92, 4–6 (2004)
[20] C.L. Suard, R-M. Mourel, D. Didenot and M.H. Feinberg, Mechanisms In-volved in Kjeldahl Microwave Digestion of Amino Acids, J. Agric. Food Chem. 45, 1202–1208 (1997)
[21] Fast and Environmental friendly Hydrogen Peroxide-Sulfuric Acid Digestion Method for the Total Nitrogen Determination in Meat, BUCHI Application Note No. K-424-K-370-014 V.1.0 (2007)
[22] Fast and Environmental friendly Hydrogen Peroxide-Sulfuric Acid Digestion Method for the Total Nitrogen Determination in Dried Meat, BUCHI Applica-tion Note No. K-424-K-370-015 V.1.0 (2008)
[23] Fast and Environmental friendly Hydrogen Peroxide-Sulfuric Acid Diges-tion Method for the Total Nitrogen Determination in Salami, Application No. K-424-K-370-010 V1.0 (2007)
[24] Protein Determination in Skimmed Milk by Digestion with Hydrogen Perox-ide and Sulfuric Acid, BUCHI Application Note No. K-435-K-370-371-001 V.1.0
[25] Determination of ammonia in water and waste water, BUCHI Application Note No. K370-006 Version B (2007)
[26] Nitrogen-Information No. 7, Determination of nitrogen content in fertilizers containing nitrate: Iron reduction method, Devarda method, Salicylic acid method, BUCHI Application Report (1994)
[27] USDA Agric. Handbook No. 8 by Watt&Merril referring to Lee I. Chiba, Ani-mal Nutrition Handbook, online: http://www.ag.auburn.edu/~chibale/an-07protein.pdf
[28] Schweizerisches Lebensmittelbuch, SLMB, online: http://www.slmb.bag.admin.ch/slmb/index.html
[29] Association of Analytical Communities (AOAC), online: http://eoma.aoac.org check online for methods given in chapter «4 Official Norms and Regu-lations», p. 3432
[30] German industry norm and European norm DIN EN 32 645, Beuth Verlag GmbH, Berlin
[31] Standard Methods for the examination of water and waste water, 19th edi-tion 1995, 4–146, Inorganic Nonmetals (4000), 4500-P Phosphorus
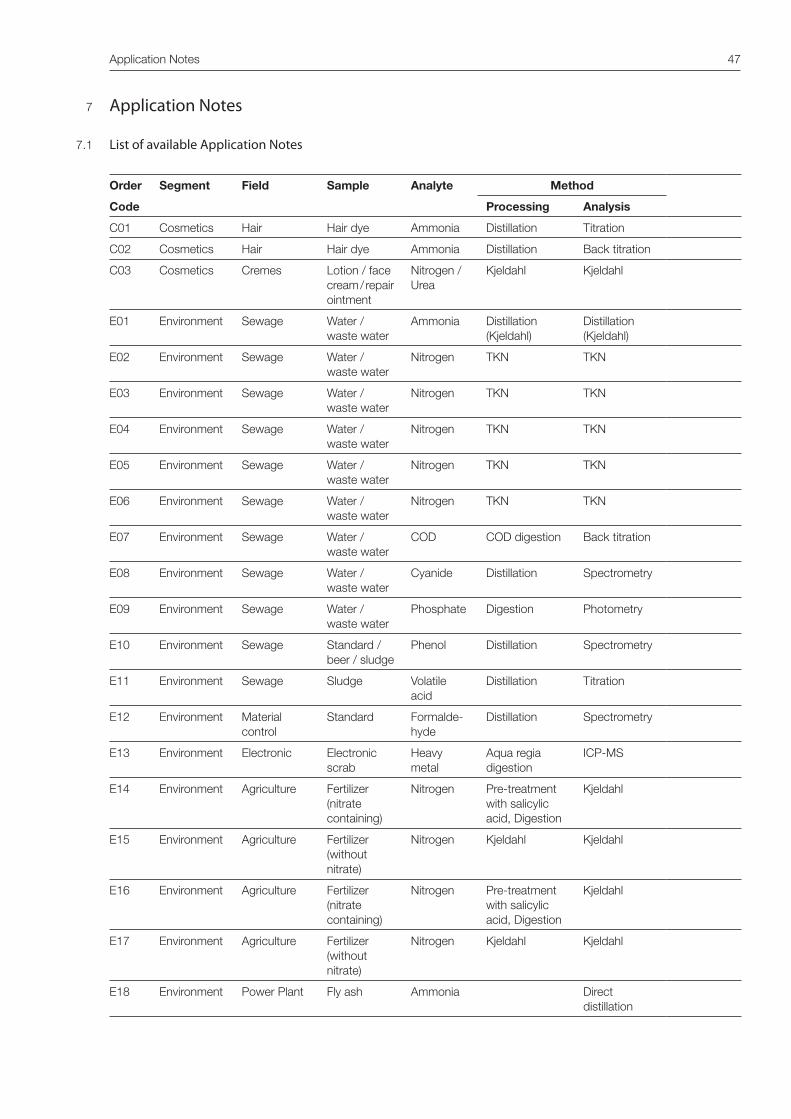
Application Notes 47
7
7.1
Application Notes
List of available Application Notes
Order Segment Field Sample Analyte Method
Code Processing Analysis
C01 Cosmetics Hair Hair dye Ammonia Distillation Titration
C02 Cosmetics Hair Hair dye Ammonia Distillation Back titration
C03 Cosmetics Cremes Lotion / face cream / repair ointment
Nitrogen / Urea
Kjeldahl Kjeldahl
E01 Environment Sewage Water / waste water
Ammonia Distillation (Kjeldahl)
Distillation (Kjeldahl)
E02 Environment Sewage Water / waste water
Nitrogen TKN TKN
E03 Environment Sewage Water / waste water
Nitrogen TKN TKN
E04 Environment Sewage Water / waste water
Nitrogen TKN TKN
E05 Environment Sewage Water / waste water
Nitrogen TKN TKN
E06 Environment Sewage Water / waste water
Nitrogen TKN TKN
E07 Environment Sewage Water / waste water
COD COD digestion Back titration
E08 Environment Sewage Water / waste water
Cyanide Distillation Spectrometry
E09 Environment Sewage Water / waste water
Phosphate Digestion Photometry
E10 Environment Sewage Standard / beer / sludge
Phenol Distillation Spectrometry
E11 Environment Sewage Sludge Volatile acid
Distillation Titration
E12 Environment Material control
Standard Formalde-hyde
Distillation Spectrometry
E13 Environment Electronic Electronic scrab
Heavy metal
Aqua regia digestion
ICP-MS
E14 Environment Agriculture Fertilizer (nitrate containing)
Nitrogen Pre-treatment with salicylic acid, Digestion
Kjeldahl
E15 Environment Agriculture Fertilizer (without nitrate)
Nitrogen Kjeldahl Kjeldahl
E16 Environment Agriculture Fertilizer (nitrate containing)
Nitrogen Pre-treatment with salicylic acid, Digestion
Kjeldahl
E17 Environment Agriculture Fertilizer (without nitrate)
Nitrogen Kjeldahl Kjeldahl
E18 Environment Power Plant Fly ash Ammonia Direct distillation
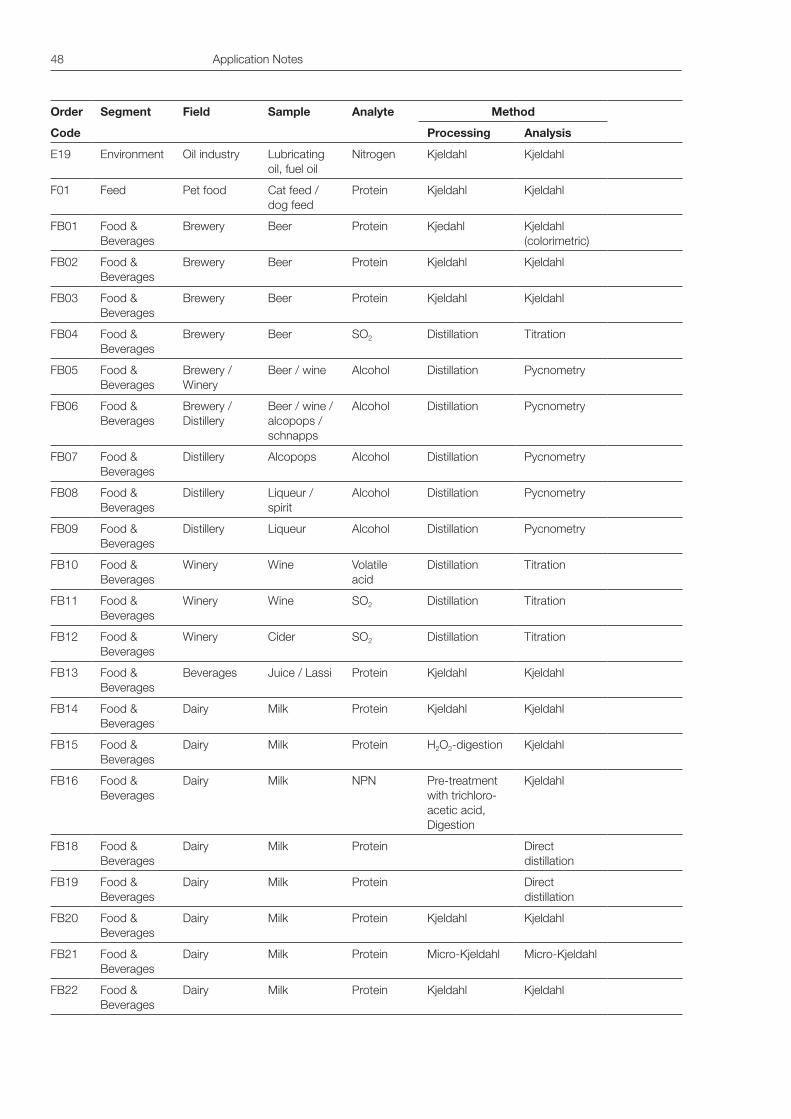
48 Application Notes
Order Segment Field Sample Analyte Method
Code Processing Analysis
E19 Environment Oil industry Lubricating oil, fuel oil
Nitrogen Kjeldahl Kjeldahl
F01 Feed Pet food Cat feed / dog feed
Protein Kjeldahl Kjeldahl
FB01 Food & Beverages
Brewery Beer Protein Kjedahl Kjeldahl (colorimetric)
FB02 Food & Beverages
Brewery Beer Protein Kjeldahl Kjeldahl
FB03 Food & Beverages
Brewery Beer Protein Kjeldahl Kjeldahl
FB04 Food & Beverages
Brewery Beer SO2 Distillation Titration
FB05 Food & Beverages
Brewery / Winery
Beer / wine Alcohol Distillation Pycnometry
FB06 Food & Beverages
Brewery / Distillery
Beer / wine / alcopops / schnapps
Alcohol Distillation Pycnometry
FB07 Food & Beverages
Distillery Alcopops Alcohol Distillation Pycnometry
FB08 Food & Beverages
Distillery Liqueur / spirit
Alcohol Distillation Pycnometry
FB09 Food & Beverages
Distillery Liqueur Alcohol Distillation Pycnometry
FB10 Food & Beverages
Winery Wine Volatile acid
Distillation Titration
FB11 Food & Beverages
Winery Wine SO2 Distillation Titration
FB12 Food & Beverages
Winery Cider SO2 Distillation Titration
FB13 Food & Beverages
Beverages Juice / Lassi Protein Kjeldahl Kjeldahl
FB14 Food & Beverages
Dairy Milk Protein Kjeldahl Kjeldahl
FB15 Food & Beverages
Dairy Milk Protein H2O2-digestion Kjeldahl
FB16 Food & Beverages
Dairy Milk NPN Pre-treatment with trichloro-acetic acid, Digestion
Kjeldahl
FB18 Food & Beverages
Dairy Milk Protein Direct distillation
FB19 Food & Beverages
Dairy Milk Protein Direct distillation
FB20 Food & Beverages
Dairy Milk Protein Kjeldahl Kjeldahl
FB21 Food & Beverages
Dairy Milk Protein Micro-Kjeldahl Micro-Kjeldahl
FB22 Food & Beverages
Dairy Milk Protein Kjeldahl Kjeldahl
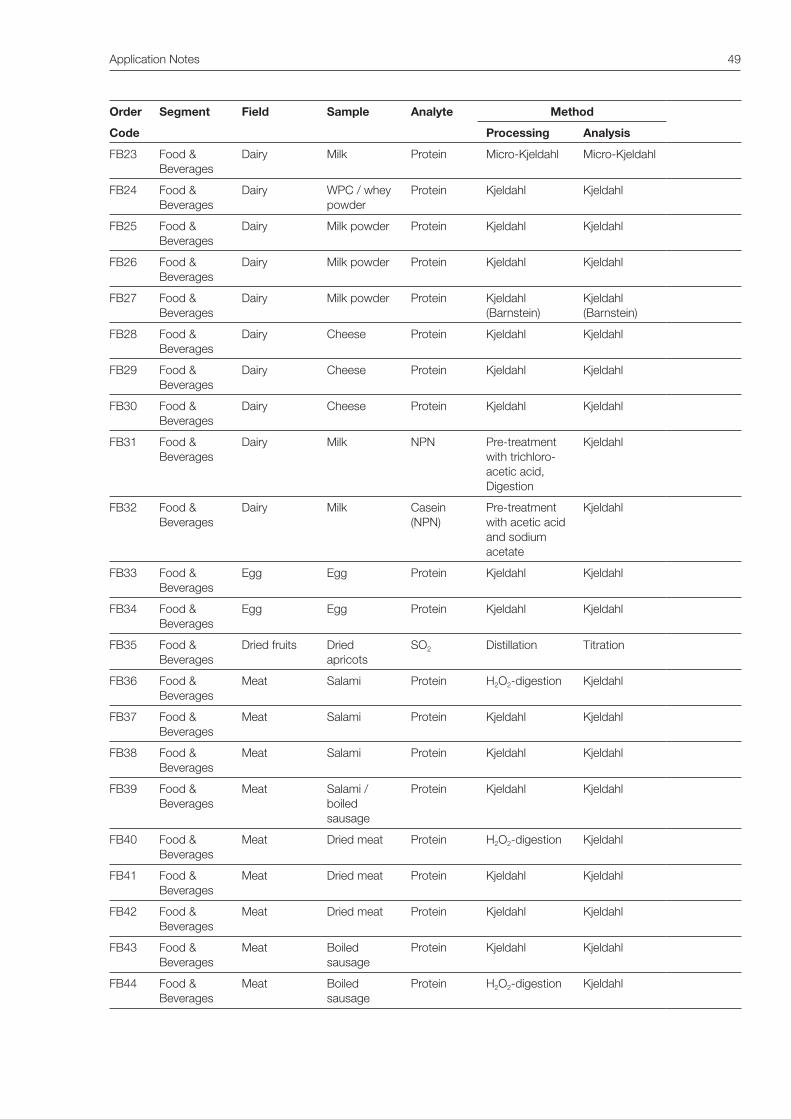
Order Segment Field Sample Analyte Method
Code Processing Analysis
FB23 Food & Beverages
Dairy Milk Protein Micro-Kjeldahl Micro-Kjeldahl
FB24 Food & Beverages
Dairy WPC / whey powder
Protein Kjeldahl Kjeldahl
FB25 Food & Beverages
Dairy Milk powder Protein Kjeldahl Kjeldahl
FB26 Food & Beverages
Dairy Milk powder Protein Kjeldahl Kjeldahl
FB27 Food & Beverages
Dairy Milk powder Protein Kjeldahl (Barnstein)
Kjeldahl (Barnstein)
FB28 Food & Beverages
Dairy Cheese Protein Kjeldahl Kjeldahl
FB29 Food & Beverages
Dairy Cheese Protein Kjeldahl Kjeldahl
FB30 Food & Beverages
Dairy Cheese Protein Kjeldahl Kjeldahl
FB31 Food & Beverages
Dairy Milk NPN Pre-treatment with trichloro-acetic acid, Digestion
Kjeldahl
FB32 Food & Beverages
Dairy Milk Casein (NPN)
Pre-treatment with acetic acid and sodium acetate
Kjeldahl
FB33 Food & Beverages
Egg Egg Protein Kjeldahl Kjeldahl
FB34 Food & Beverages
Egg Egg Protein Kjeldahl Kjeldahl
FB35 Food & Beverages
Dried fruits Dried apricots
SO2 Distillation Titration
FB36 Food & Beverages
Meat Salami Protein H2O2-digestion Kjeldahl
FB37 Food & Beverages
Meat Salami Protein Kjeldahl Kjeldahl
FB38 Food & Beverages
Meat Salami Protein Kjeldahl Kjeldahl
FB39 Food & Beverages
Meat Salami / boiled sausage
Protein Kjeldahl Kjeldahl
FB40 Food & Beverages
Meat Dried meat Protein H2O2-digestion Kjeldahl
FB41 Food & Beverages
Meat Dried meat Protein Kjeldahl Kjeldahl
FB42 Food & Beverages
Meat Dried meat Protein Kjeldahl Kjeldahl
FB43 Food & Beverages
Meat Boiled sausage
Protein Kjeldahl Kjeldahl
FB44 Food & Beverages
Meat Boiled sausage
Protein H2O2-digestion Kjeldahl
Application Notes 49
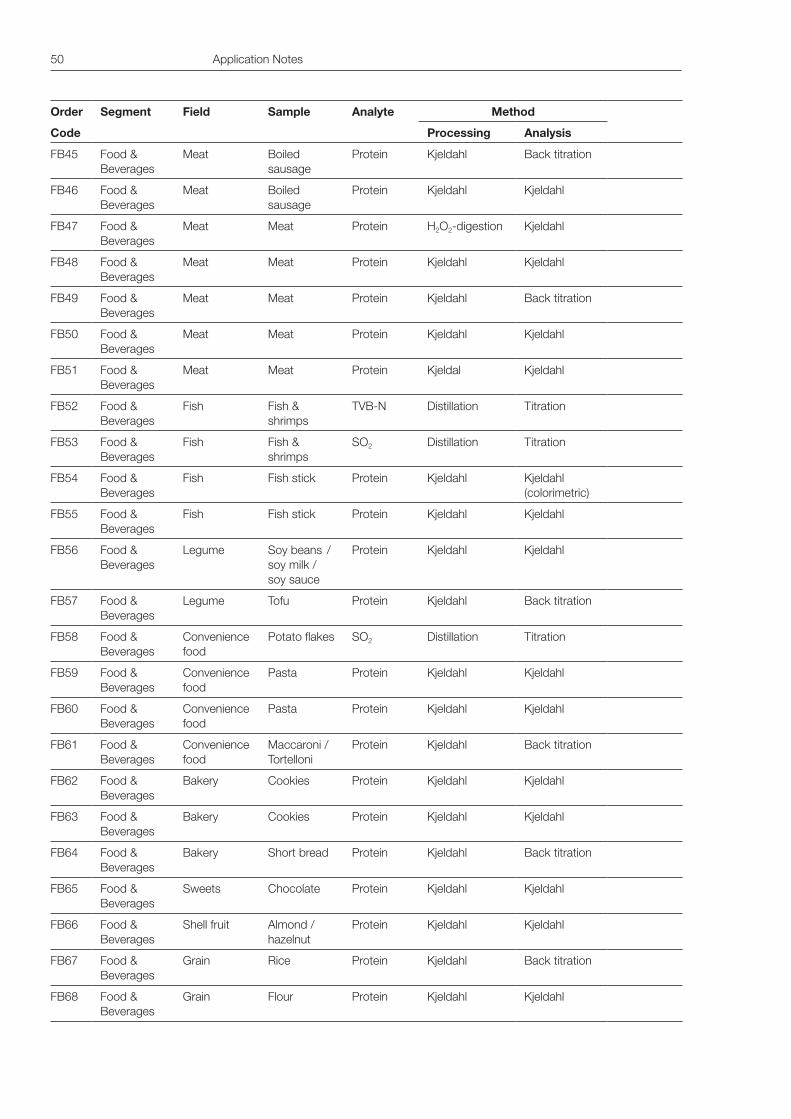
50 Application Notes
Order Segment Field Sample Analyte Method
Code Processing Analysis
FB45 Food & Beverages
Meat Boiled sausage
Protein Kjeldahl Back titration
FB46 Food & Beverages
Meat Boiled sausage
Protein Kjeldahl Kjeldahl
FB47 Food & Beverages
Meat Meat Protein H2O2-digestion Kjeldahl
FB48 Food & Beverages
Meat Meat Protein Kjeldahl Kjeldahl
FB49 Food & Beverages
Meat Meat Protein Kjeldahl Back titration
FB50 Food & Beverages
Meat Meat Protein Kjeldahl Kjeldahl
FB51 Food & Beverages
Meat Meat Protein Kjeldal Kjeldahl
FB52 Food & Beverages
Fish Fish & shrimps
TVB-N Distillation Titration
FB53 Food & Beverages
Fish Fish & shrimps
SO2 Distillation Titration
FB54 Food & Beverages
Fish Fish stick Protein Kjeldahl Kjeldahl (colorimetric)
FB55 Food & Beverages
Fish Fish stick Protein Kjeldahl Kjeldahl
FB56 Food & Beverages
Legume Soy beans / soy milk / soy sauce
Protein Kjeldahl Kjeldahl
FB57 Food & Beverages
Legume Tofu Protein Kjeldahl Back titration
FB58 Food & Beverages
Convenience food
Potato flakes SO2 Distillation Titration
FB59 Food & Beverages
Convenience food
Pasta Protein Kjeldahl Kjeldahl
FB60 Food & Beverages
Convenience food
Pasta Protein Kjeldahl Kjeldahl
FB61 Food & Beverages
Convenience food
Maccaroni / Tortelloni
Protein Kjeldahl Back titration
FB62 Food & Beverages
Bakery Cookies Protein Kjeldahl Kjeldahl
FB63 Food & Beverages
Bakery Cookies Protein Kjeldahl Kjeldahl
FB64 Food & Beverages
Bakery Short bread Protein Kjeldahl Back titration
FB65 Food & Beverages
Sweets Chocolate Protein Kjeldahl Kjeldahl
FB66 Food & Beverages
Shell fruit Almond / hazelnut
Protein Kjeldahl Kjeldahl
FB67 Food & Beverages
Grain Rice Protein Kjeldahl Back titration
FB68 Food & Beverages
Grain Flour Protein Kjeldahl Kjeldahl
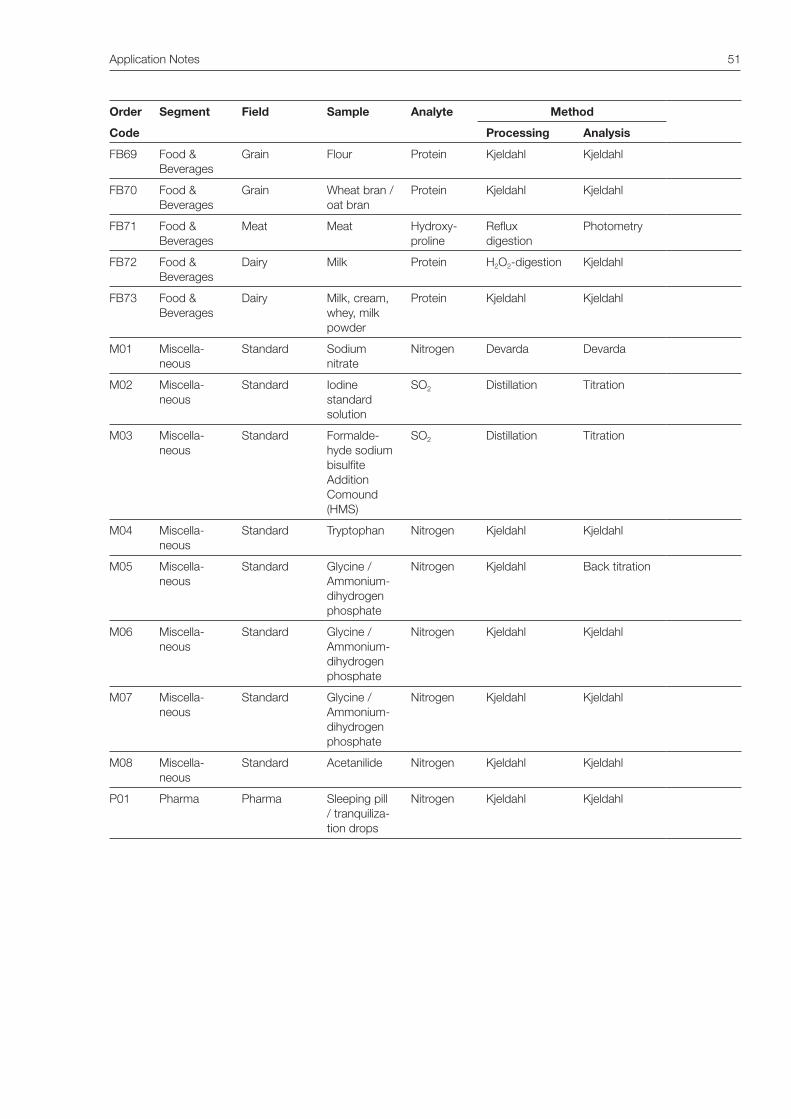
Application Notes 51
Order Segment Field Sample Analyte Method
Code Processing Analysis
FB69 Food & Beverages
Grain Flour Protein Kjeldahl Kjeldahl
FB70 Food & Beverages
Grain Wheat bran / oat bran
Protein Kjeldahl Kjeldahl
FB71 Food & Beverages
Meat Meat Hydroxy-proline
Reflux digestion
Photometry
FB72 Food & Beverages
Dairy Milk Protein H2O2-digestion Kjeldahl
FB73 Food & Beverages
Dairy Milk, cream, whey, milk powder
Protein Kjeldahl Kjeldahl
M01 Miscella-neous
Standard Sodium nitrate
Nitrogen Devarda Devarda
M02 Miscella-neous
Standard Iodine standard solution
SO2 Distillation Titration
M03 Miscella-neous
Standard Formalde-hyde sodium bisulfite Addition Comound (HMS)
SO2 Distillation Titration
M04 Miscella-neous
Standard Tryptophan Nitrogen Kjeldahl Kjeldahl
M05 Miscella-neous
Standard Glycine / Ammonium-dihydrogen phosphate
Nitrogen Kjeldahl Back titration
M06 Miscella-neous
Standard Glycine / Ammonium-dihydrogen phosphate
Nitrogen Kjeldahl Kjeldahl
M07 Miscella-neous
Standard Glycine / Ammonium-dihydrogen phosphate
Nitrogen Kjeldahl Kjeldahl
M08 Miscella-neous
Standard Acetanilide Nitrogen Kjeldahl Kjeldahl
P01 Pharma Pharma Sleeping pill / tranquiliza-tion drops
Nitrogen Kjeldahl Kjeldahl
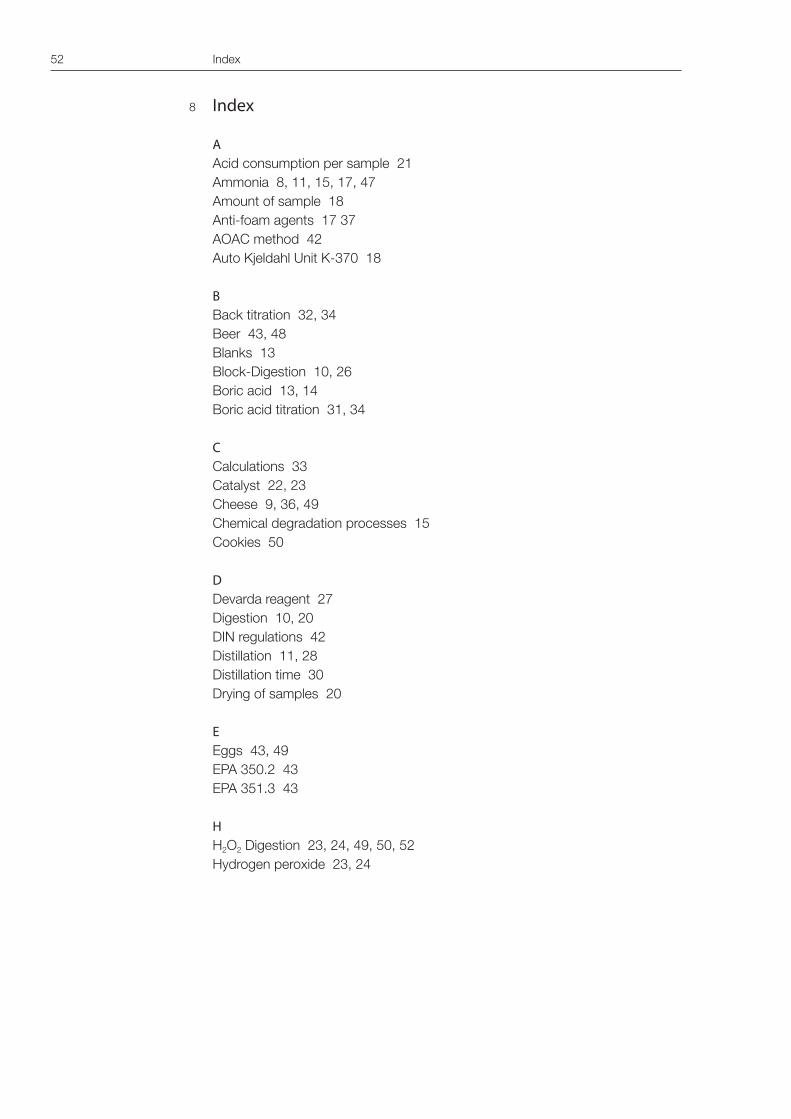
52 Index
8 Index
AAcid consumption per sample 21Ammonia 8, 11, 15, 17, 47Amount of sample 18Anti-foam agents 17 37AOAC method 42Auto Kjeldahl Unit K-370 18
BBack titration 32, 34Beer 43, 48Blanks 13Block-Digestion 10, 26Boric acid 13, 14Boric acid titration 31, 34
CCalculations 33Catalyst 22, 23Cheese 9, 36, 49Chemical degradation processes 15Cookies 50
DDevarda reagent 27Digestion 10, 20DIN regulations 42Distillation 11, 28Distillation time 30Drying of samples 20
EEggs 43, 49EPA 350.2 43EPA 351.3 43
HH2O2 Digestion 23, 24, 49, 50, 52Hydrogen peroxide 23, 24
Index 53
IIdeal ratio of salt to sulfuric acid 21IR-Digestion 10, 26ISO regulations 42
KKjeldahl method 7, 8, 15, 27Kjeldahl Sampler K-371 29
LLimit of detection 36Limit of quantification 36
MMacro Kjeldahl 19Meat 43, 49Micro Kjeldahl 19Milk 9, 42, 43, 48, 49Milk direct distillation 48Milk powder 43, 49Mincing and homogenization 19
NNutrition facts labels 9
OOptimization of the digestion 25
PParameters for digestion 24Pasta 50Protein content 35Protein contents foodstuffs 9Protein factors 35, 36
RReceiving vessel of distillate 30Recovery rates 15, 16
54 Index
SSalami 49Sample preparation 17Scrubber B-414 11, 28Semimicro Kjeldahl 19Sher indicator 32Steam distillation 29Steam power 30Suction manifold 27
TTitration 12, 31TKN 20Total Kjeldahl Nitrogen (TKN) 20
VVerification 38Verification of distillation unit 38Verification of digestion unit 39
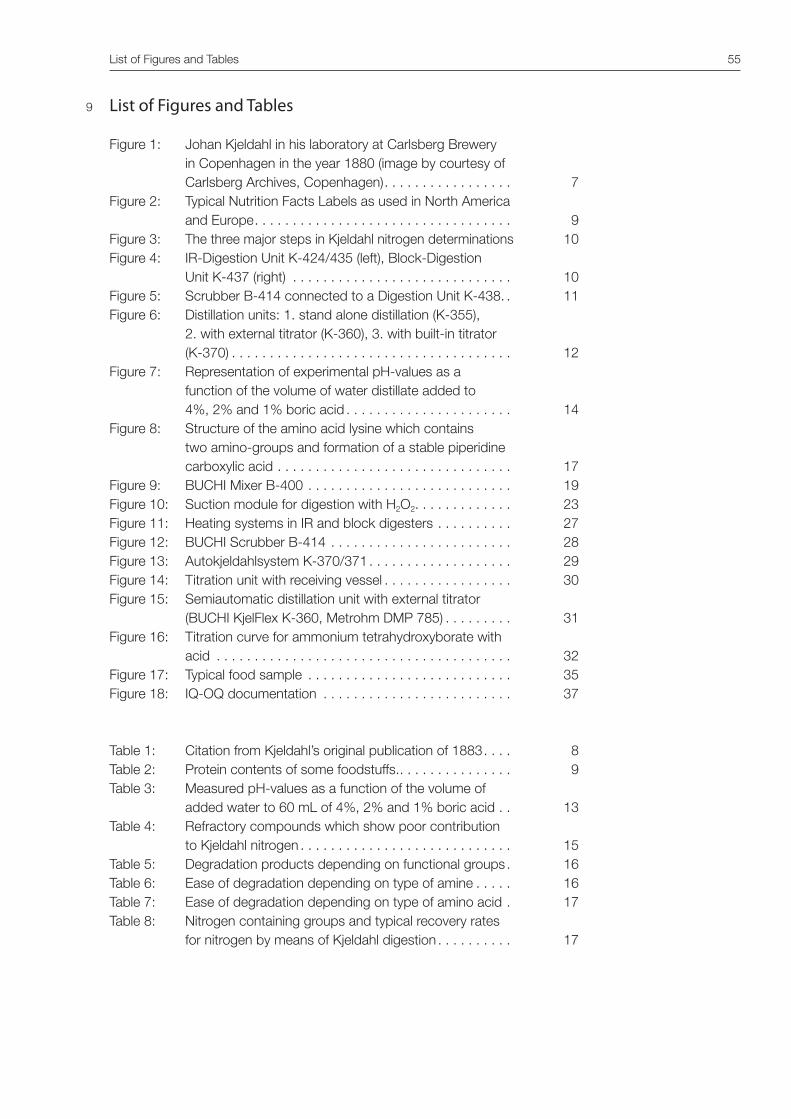
List of Figures and Tables 55
List of Figures and Tables
Figure 1: Johan Kjeldahl in his laboratory at Carlsberg Brewery in Copenhagen in the year 1880 (image by courtesy of Carlsberg Archives, Copenhagen) . . . . . . . . . . . . . . . . . 7
Figure 2: Typical Nutrition Facts Labels as used in North America and Europe . . . . . . . . . . . . . . . . . . . . . . . . . . . . . . . . . . 9
Figure 3: The three major steps in Kjeldahl nitrogen determinations 10Figure 4: IR-Digestion Unit K-424/435 (left), Block-Digestion
Unit K-437 (right) . . . . . . . . . . . . . . . . . . . . . . . . . . . . . 10Figure 5: Scrubber B-414 connected to a Digestion Unit K-438. . 11Figure 6: Distillation units: 1. stand alone distillation (K-355),
2. with external titrator (K-360), 3. with built-in titrator (K-370) . . . . . . . . . . . . . . . . . . . . . . . . . . . . . . . . . . . . . 12
Figure 7: Representation of experimental pH-values as a function of the volume of water distillate added to 4%, 2% and 1% boric acid . . . . . . . . . . . . . . . . . . . . . . 14
Figure 8: Structure of the amino acid lysine which contains two amino-groups and formation of a stable piperidine carboxylic acid . . . . . . . . . . . . . . . . . . . . . . . . . . . . . . . 17
Figure 9: BUCHI Mixer B-400 . . . . . . . . . . . . . . . . . . . . . . . . . . . 19Figure 10: Suction module for digestion with H2O2. . . . . . . . . . . . . 23Figure 11: Heating systems in IR and block digesters . . . . . . . . . . 27Figure 12: BUCHI Scrubber B-414 . . . . . . . . . . . . . . . . . . . . . . . . 28Figure 13: Autokjeldahlsystem K-370/371 . . . . . . . . . . . . . . . . . . . 29Figure 14: Titration unit with receiving vessel . . . . . . . . . . . . . . . . . 30Figure 15: Semiautomatic distillation unit with external titrator
(BUCHI KjelFlex K-360, Metrohm DMP 785) . . . . . . . . . 31Figure 16: Titration curve for ammonium tetrahydroxyborate with
acid . . . . . . . . . . . . . . . . . . . . . . . . . . . . . . . . . . . . . . . 32Figure 17: Typical food sample . . . . . . . . . . . . . . . . . . . . . . . . . . . 35Figure 18: IQ-OQ documentation . . . . . . . . . . . . . . . . . . . . . . . . . 37
Table 1: Citation from Kjeldahl’s original publication of 1883 . . . . 8Table 2: Protein contents of some foodstuffs. . . . . . . . . . . . . . . . 9Table 3: Measured pH-values as a function of the volume of
added water to 60 mL of 4%, 2% and 1% boric acid . . 13Table 4: Refractory compounds which show poor contribution
to Kjeldahl nitrogen . . . . . . . . . . . . . . . . . . . . . . . . . . . . 15Table 5: Degradation products depending on functional groups . 16Table 6: Ease of degradation depending on type of amine . . . . . 16Table 7: Ease of degradation depending on type of amino acid . 17Table 8: Nitrogen containing groups and typical recovery rates
for nitrogen by means of Kjeldahl digestion . . . . . . . . . . 17
9

56 Separation of mixtures using a rotary evaporator and a glass oven
Table 9: Correlation of nitrogen contents (N[mg], N[%]) with sample weight, number of Kjeldahl tablets (KT), volume of sulfuric acid (Acid [mL]), concentration of titrant (c(HX) [mol/L] and titrant consumptions (Titrant con- sumption sample [mL] in 4% boric acid and Titrant con- sumption blank [mL] in 4% boric acid) . . . . . . . . . . . . . 18
Table 10: Terminology macro, semi micro and micro Kjeldahl . . . . 19Table 11: Sample volumes for TKN determinations . . . . . . . . . . . 20Table 12: Consumption of volumes (A) and weights (B) of 98%
H2SO4 for different components in samples. . . . . . . . . . 21Table 13: Calculation of the consumption of concentrated sulfuric
acid by 1.0 g of sample . . . . . . . . . . . . . . . . . . . . . . . . 21Table 14: Effect of ratio H2SO4 [mL] to K2SO4 [g] on optimal
digestion temperature [°C] . . . . . . . . . . . . . . . . . . . . . . 22Table 15: Names, composition, use and weight of the new
BUCHI Kjeldahl Tablets. See www.buchi.com . . . . . . . . 22Table 16: Temperature program used on the Digestion Automat
K-438 . . . . . . . . . . . . . . . . . . . . . . . . . . . . . . . . . . . . . . 25Table 17: Digestion parameters for typical sample weights . . . . . . 25Table 18: Correlation of times when samples become translucent
(clearing) and total digestion time with recovery rates using selenium and mercury free Kjeldahl tablets . . . . . 26
Table 19: Further measures for improved conditions in digestions, of boiling and foaming samples . . . . . . . . . . . . . . . . . . . 26
Table 20: Typical distillation parameters for a boric acid titration on the Auto Kjeldahl K-370 . . . . . . . . . . . . . . . . . . . . . . 28
Table 21: Typical distillation parameters for a back titration on the Auto Kjeldahl K-370 . . . . . . . . . . . . . . . . . . . . . . . . 28
Table 22: Typical titration parameters for a boric acid titration on the Auto Kjeldahl K-370 . . . . . . . . . . . . . . . . . . . . . . . . 32
Table 23: Typical titration parameters for a back titration on the Auto Kjeldahl K-370 . . . . . . . . . . . . . . . . . . . . . . . . . . . 33
Table 24: Empirical protein factors for the Kjeldahl method . . . . . 36Table 25: Reporting of analytical results [DIN EN 32645) . . . . . . . 37Table 26: Distillation parameters for boric acid titration of
ammonium dihydrogen phosphate . . . . . . . . . . . . . . . . 39Table 27: Reasons for failures and corrective measures. . . . . . . . 41Table 28: Kjeldahl nitrogen determinations according to DIN/ISO
regulations. . . . . . . . . . . . . . . . . . . . . . . . . . . . . . . . . . . 42Table 29: Kjeldahl nitrogen determinations according to
AOAC/EPA regulations. . . . . . . . . . . . . . . . . . . . . . . . . . 43

BÜCHI Labortechnik AGPostfach9230 Flawil SwitzerlandTel. +41 71 394 63 63Fax +41 71 394 65 [email protected]
ISBN 978-3-033-03100-5
Quality in your hands