Embed Size (px)
DESCRIPTION
C. R. Fichera, G. Modica, M. PollinoSesta Conferenza Nazionale in Informatica e Pianificazione Urbana e Territoriale INPUT 2010Potenza, 13-15 Settembre 2010
Citation preview

Characterizing land cover change Characterizing land cover change using multi-temporal remote sensed using multi-temporal remote sensed
imagery and landscape metrics imagery and landscape metrics
C. R. Fichera, G. Modica, M. Pollino
Università degli Studi Mediterranea di Reggio Calabria - Dipartimento di Scienze e Tecnologie Agroforestali ed Ambientali (DiSTAfA)[email protected], [email protected]
ENEA - Agenzia Nazionale per le Nuove tecnologie, l’Energia e lo sviluppo economico sostenibile Laboratorio Analisi e Osservazione del sistema Terra (UTMEA-TER)[email protected]
Characterizing land cover change using multi-temporal remote sensed imagery and landscape metrics
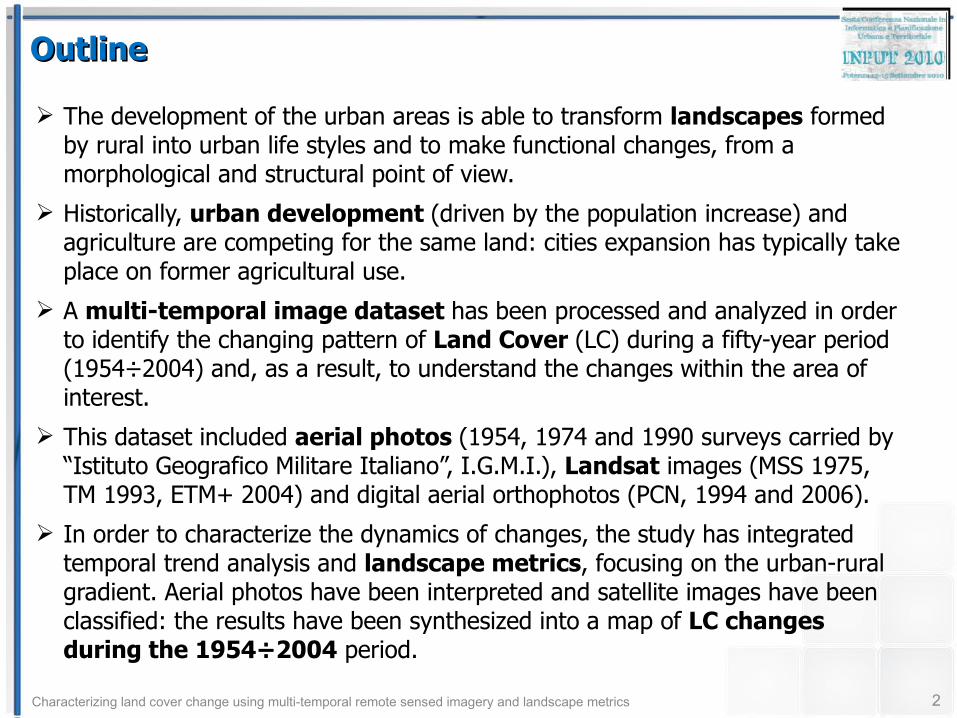
OutlineOutline
The development of the urban areas is able to transform landscapes formed by rural into urban life styles and to make functional changes, from a morphological and structural point of view.
Historically, urban development (driven by the population increase) and agriculture are competing for the same land: cities expansion has typically take place on former agricultural use.
A multi-temporal image dataset has been processed and analyzed in order to identify the changing pattern of Land Cover (LC) during a fifty-year period (1954÷2004) and, as a result, to understand the changes within the area of interest.
This dataset included aerial photos (1954, 1974 and 1990 surveys carried by “Istituto Geografico Militare Italiano”, I.G.M.I.), Landsat images (MSS 1975, TM 1993, ETM+ 2004) and digital aerial orthophotos (PCN, 1994 and 2006).
In order to characterize the dynamics of changes, the study has integrated temporal trend analysis and landscape metrics, focusing on the urban-rural gradient. Aerial photos have been interpreted and satellite images have been classified: the results have been synthesized into a map of LC changes during the 1954÷2004 period.
2
Characterizing land cover change using multi-temporal remote sensed imagery and landscape metrics
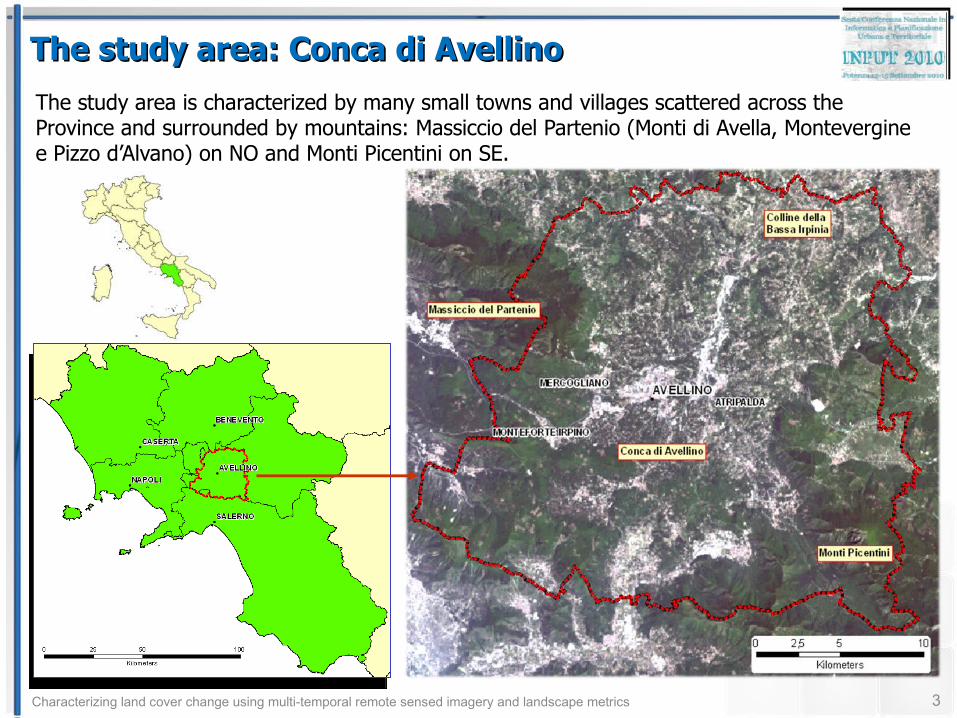
The study area: Conca di AvellinoThe study area: Conca di Avellino
The study area is characterized by many small towns and villages scattered across the Province and surrounded by mountains: Massiccio del Partenio (Monti di Avella, Montevergine e Pizzo d’Alvano) on NO and Monti Picentini on SE.
3
Characterizing land cover change using multi-temporal remote sensed imagery and landscape metrics
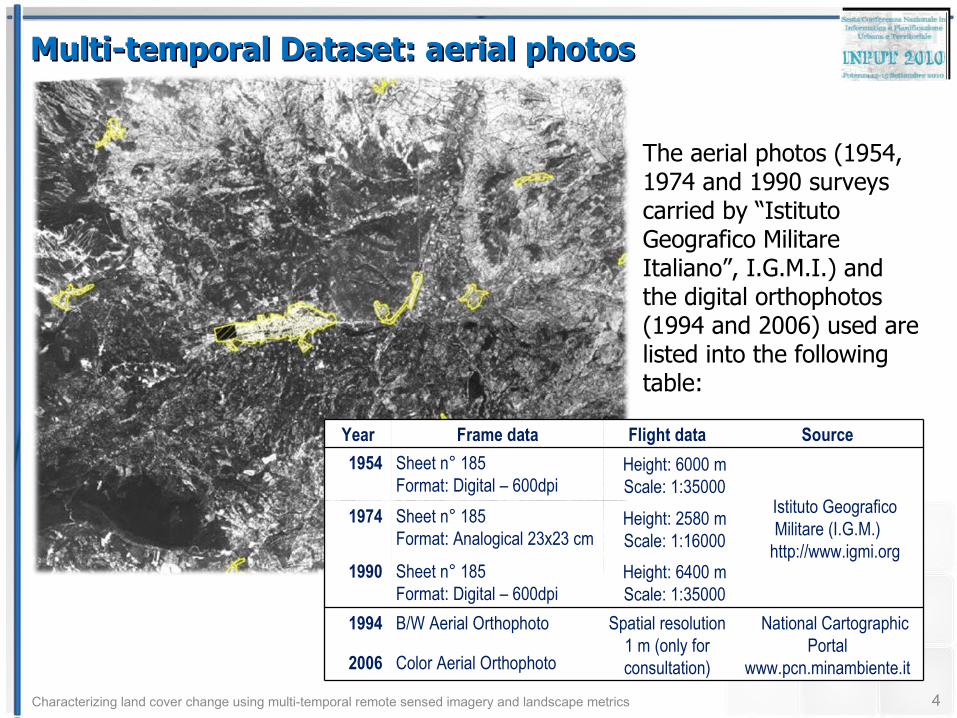
Multi-temporal Dataset: aerial photosMulti-temporal Dataset: aerial photos
Year Frame data Flight data Source
1954 Sheet n° 185 Format: Digital – 600dpi
Height: 6000 mScale: 1:35000
Istituto Geografico Militare (I.G.M.)
http://www.igmi.org
1974 Sheet n° 185 Format: Analogical 23x23 cm
Height: 2580 mScale: 1:16000
1990 Sheet n° 185 Format: Digital – 600dpi
Height: 6400 mScale: 1:35000
1994 B/W Aerial Orthophoto Spatial resolution1 m (only for consultation)
National Cartographic Portal
www.pcn.minambiente.it2006 Color Aerial Orthophoto
4
The aerial photos (1954, 1974 and 1990 surveys carried by “Istituto Geografico Militare Italiano”, I.G.M.I.) and the digital orthophotos (1994 and 2006) used are listed into the following table:
Characterizing land cover change using multi-temporal remote sensed imagery and landscape metrics
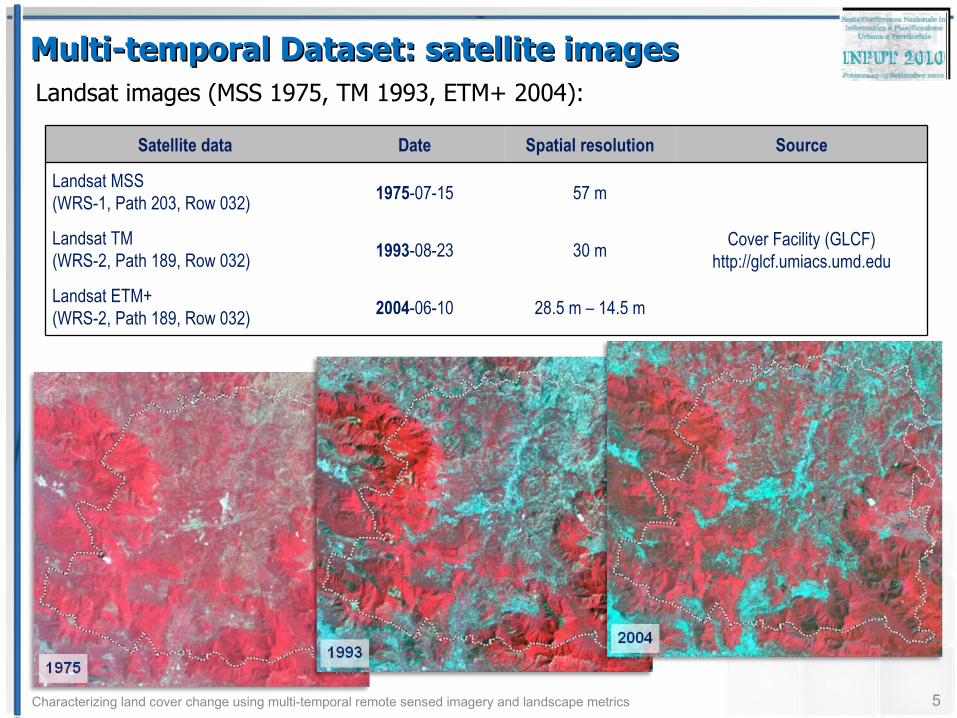
Multi-temporal Dataset: satellite imagesMulti-temporal Dataset: satellite imagesLandsat images (MSS 1975, TM 1993, ETM+ 2004):
5
Satellite data Date Spatial resolution Source
Landsat MSS(WRS-1, Path 203, Row 032) 1975-07-15 57 m
Cover Facility (GLCF) http://glcf.umiacs.umd.edu
Landsat TM(WRS-2, Path 189, Row 032) 1993-08-23 30 m
Landsat ETM+(WRS-2, Path 189, Row 032) 2004-06-10 28.5 m – 14.5 m
Characterizing land cover change using multi-temporal remote sensed imagery and landscape metrics
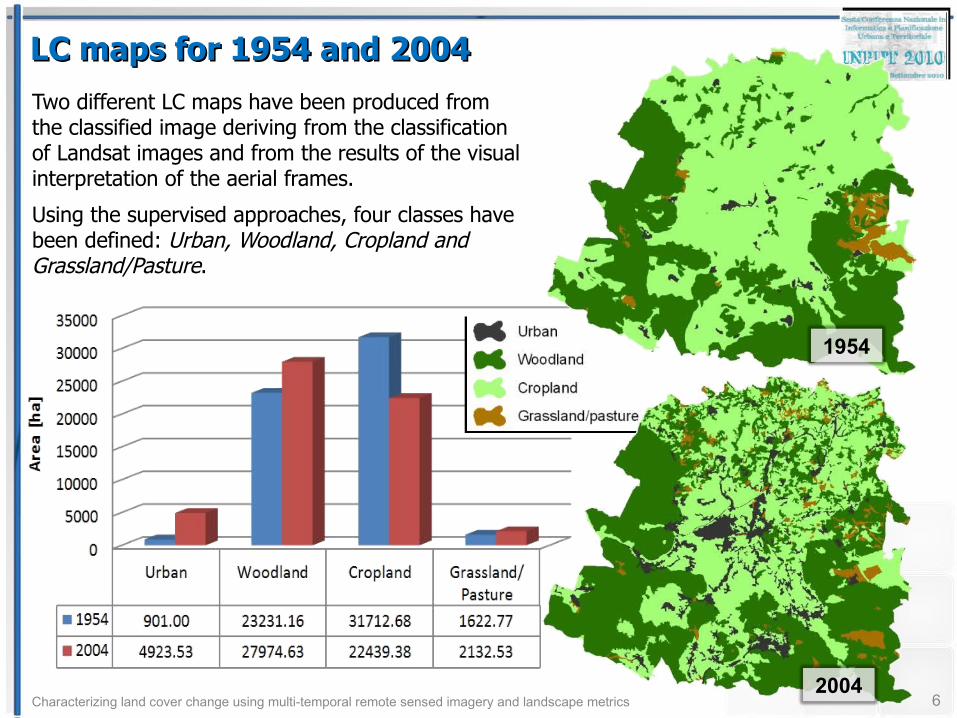
LC maps for 1954 and 2004LC maps for 1954 and 2004
Two different LC maps have been produced from the classified image deriving from the classification of Landsat images and from the results of the visual interpretation of the aerial frames.
Using the supervised approaches, four classes have been defined: Urban, Woodland, Cropland and Grassland/Pasture.
6
1954
2004
Characterizing land cover change using multi-temporal remote sensed imagery and landscape metrics
LC changes (1954÷2004)LC changes (1954÷2004)
7
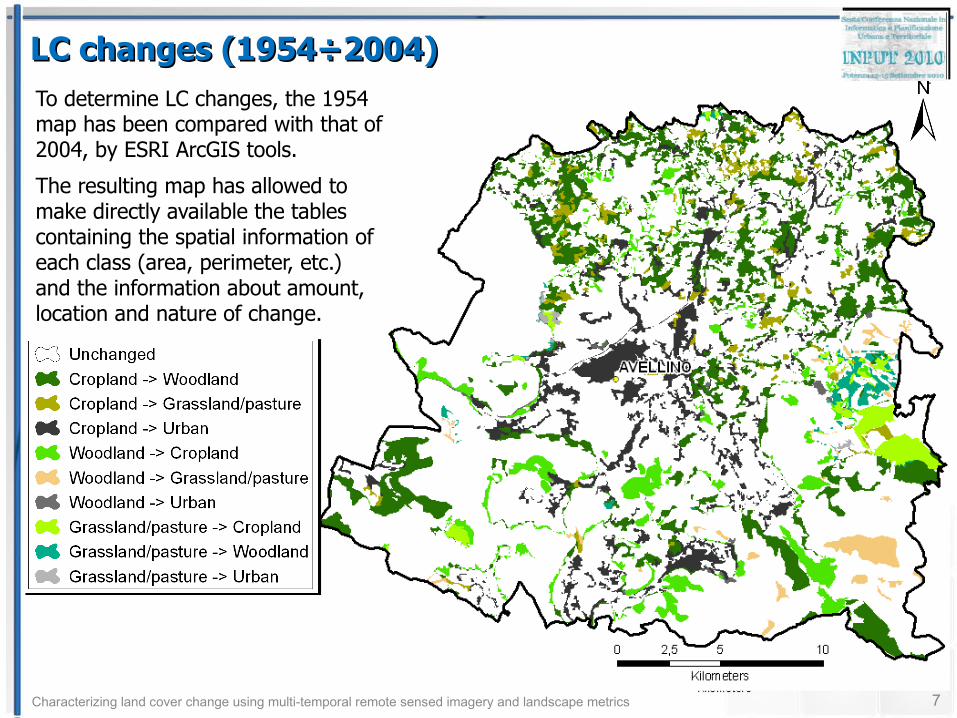
To determine LC changes, the 1954 map has been compared with that of 2004, by ESRI ArcGIS tools.
The resulting map has allowed to make directly available the tables containing the spatial information of each class (area, perimeter, etc.) and the information about amount, location and nature of change.
Characterizing land cover change using multi-temporal remote sensed imagery and landscape metrics
LC changes (1954÷2004)LC changes (1954÷2004)
To From
UrbanGrassland /
pastureCropland Woodland
LC typesSubtotals [1954]
Urban 900,97 - - - 900,97
Grassland/pasture 75,12 354,37 781,98 411,30 1622,77
Cropland 3786,87 1091,66 19409,16 7420,54 31708,23
Woodland 162,11 686,50 2246,49 20136,09 23231,20
LC types subtotals [2004]
4925,07 2132,53 22437,63 27967,93 Total area: 57463,16
8
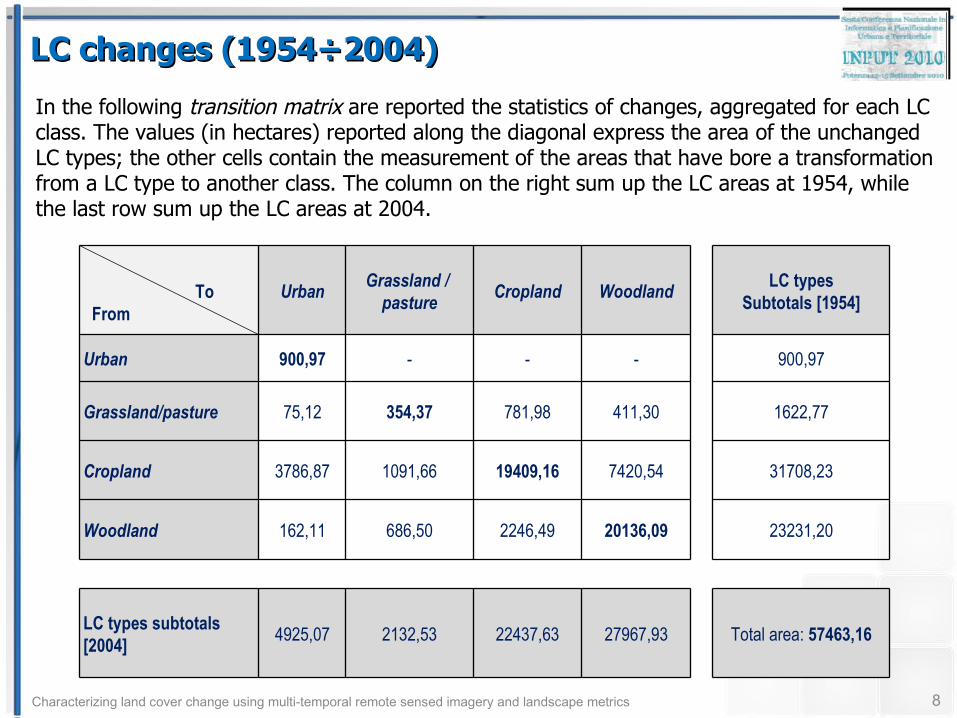
In the following transition matrix are reported the statistics of changes, aggregated for each LC class. The values (in hectares) reported along the diagonal express the area of the unchanged LC types; the other cells contain the measurement of the areas that have bore a transformation from a LC type to another class. The column on the right sum up the LC areas at 1954, while the last row sum up the LC areas at 2004.
Characterizing land cover change using multi-temporal remote sensed imagery and landscape metrics
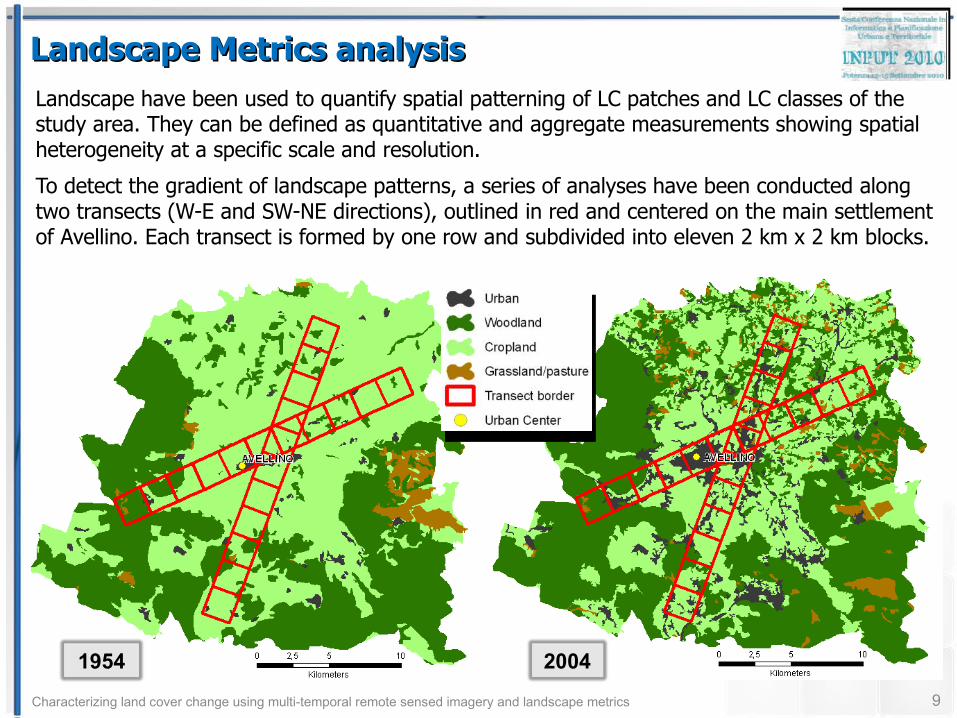
Landscape Metrics analysisLandscape Metrics analysisLandscape have been used to quantify spatial patterning of LC patches and LC classes of the study area. They can be defined as quantitative and aggregate measurements showing spatial heterogeneity at a specific scale and resolution.
To detect the gradient of landscape patterns, a series of analyses have been conducted along two transects (W-E and SW-NE directions), outlined in red and centered on the main settlement of Avellino. Each transect is formed by one row and subdivided into eleven 2 km x 2 km blocks.
9
1954 2004

Characterizing land cover change using multi-temporal remote sensed imagery and landscape metrics
Landscape Metrics analysisLandscape Metrics analysis
Landscape metrics calculated (FRAGSTATS 3.3) for the W-E transect:
Shannon’s Diversity Index (SHDI)
Patch Density index (PD)
LPI (Largest Patch Index)
NP (Number of Patches)
10
Characterizing land cover change using multi-temporal remote sensed imagery and landscape metrics
Landscape Metrics analysisLandscape Metrics analysis
11
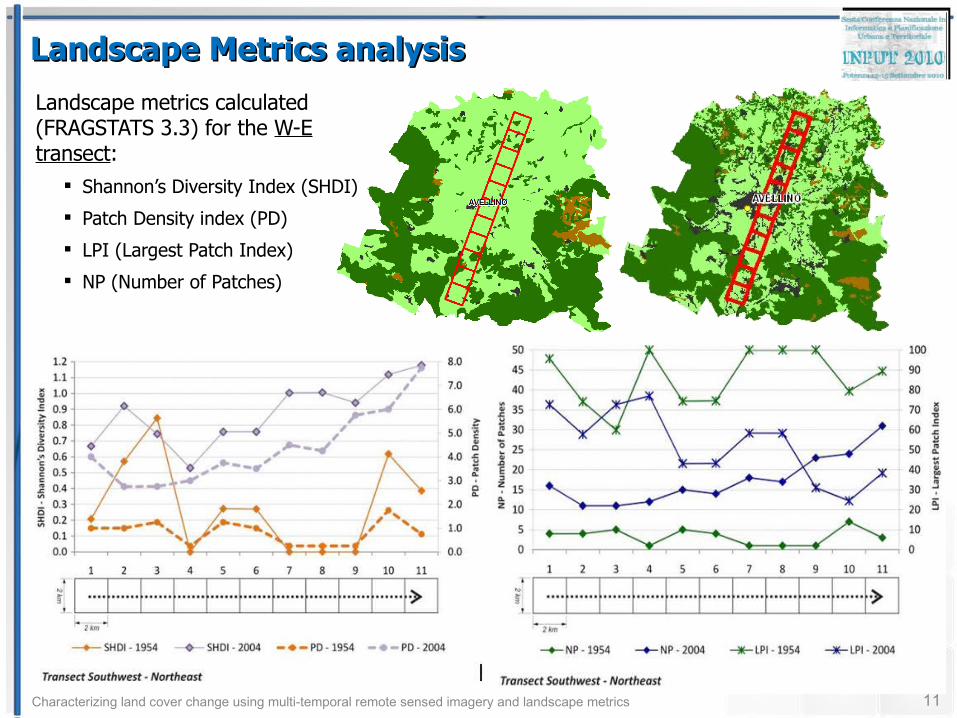
Landscape metrics calculated (FRAGSTATS 3.3) for the W-E transect:
Shannon’s Diversity Index (SHDI)
Patch Density index (PD)
LPI (Largest Patch Index)
NP (Number of Patches)
Characterizing land cover change using multi-temporal remote sensed imagery and landscape metrics
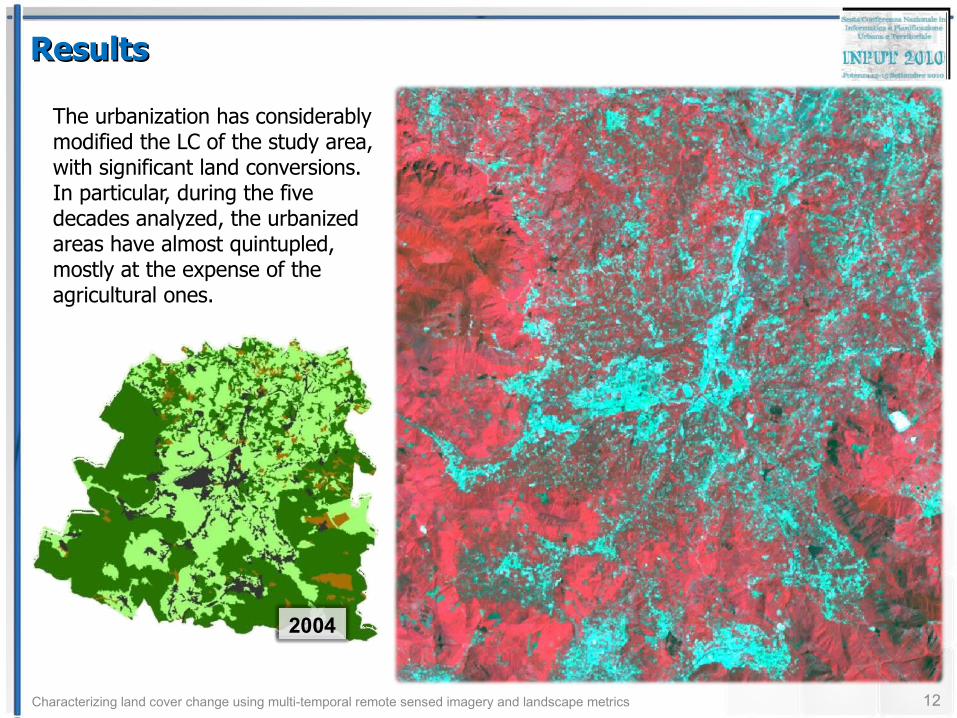
ResultsResults
The urbanization has considerably modified the LC of the study area, with significant land conversions. In particular, during the five decades analyzed, the urbanized areas have almost quintupled, mostly at the expense of the agricultural ones.
12
19542004
Characterizing land cover change using multi-temporal remote sensed imagery and landscape metrics
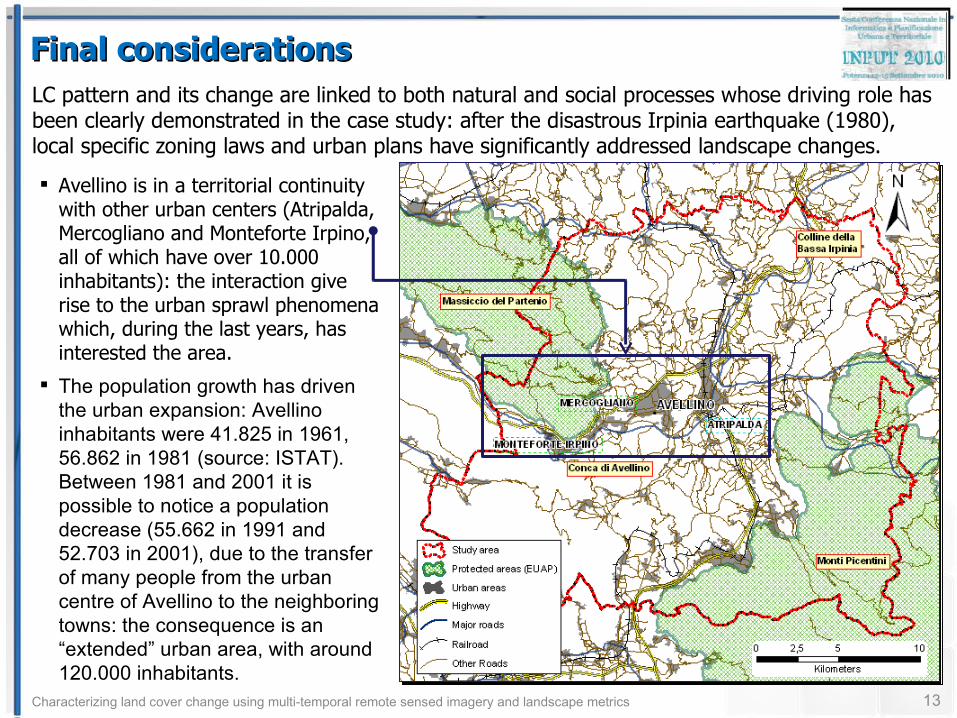
Final considerationsFinal considerationsLC pattern and its change are linked to both natural and social processes whose driving role has been clearly demonstrated in the case study: after the disastrous Irpinia earthquake (1980), local specific zoning laws and urban plans have significantly addressed landscape changes.
13
Avellino is in a territorial continuity with other urban centers (Atripalda, Mercogliano and Monteforte Irpino, all of which have over 10.000 inhabitants): the interaction give rise to the urban sprawl phenomena which, during the last years, has interested the area.
The population growth has driven the urban expansion: Avellino inhabitants were 41.825 in 1961, 56.862 in 1981 (source: ISTAT). Between 1981 and 2001 it is possible to notice a population decrease (55.662 in 1991 and 52.703 in 2001), due to the transfer of many people from the urban centre of Avellino to the neighboring towns: the consequence is an “extended” urban area, with around 120.000 inhabitants.
Characterizing land cover change using multi-temporal remote sensed imagery and landscape metrics
Final considerationsFinal considerations
14
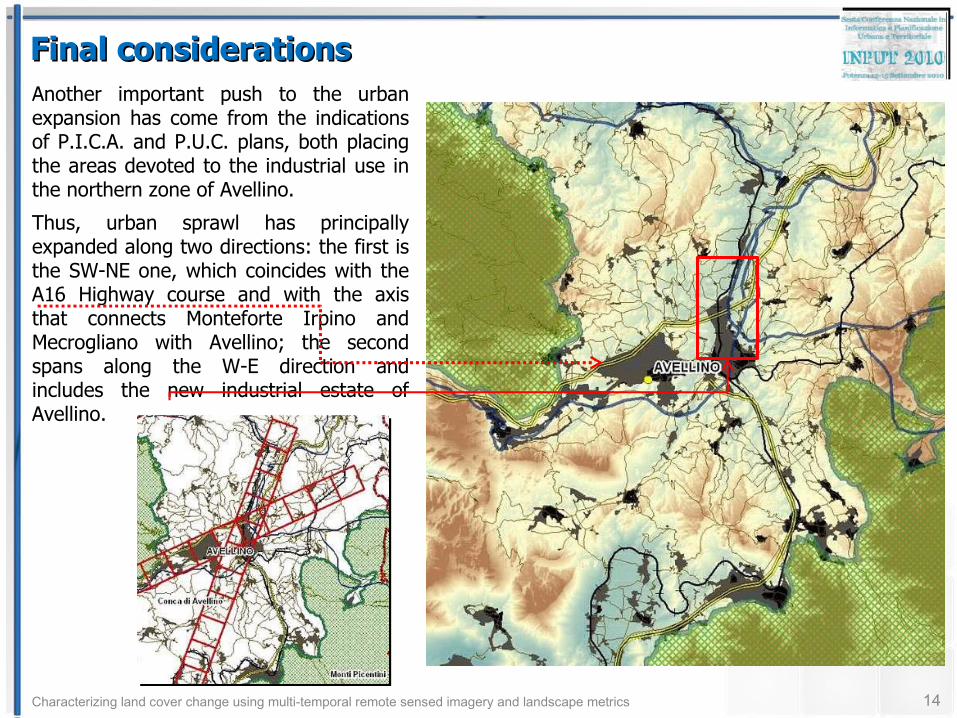
Another important push to the urban expansion has come from the indications of P.I.C.A. and P.U.C. plans, both placing the areas devoted to the industrial use in the northern zone of Avellino.
Thus, urban sprawl has principally expanded along two directions: the first is the SW-NE one, which coincides with the A16 Highway course and with the axis that connects Monteforte Irpino and Mecrogliano with Avellino; the second spans along the W-E direction and includes the new industrial estate of Avellino.
Characterizing land cover change Characterizing land cover change using multi-temporal remote sensed using multi-temporal remote sensed
imagery and landscape metrics imagery and landscape metrics
C. R. Fichera, G. Modica, M. Pollino
Università degli Studi Mediterranea di Reggio Calabria - Dipartimento di Scienze e Tecnologie Agroforestali ed Ambientali (DiSTAfA)[email protected], [email protected]
ENEA - Agenzia Nazionale per le Nuove tecnologie, l’Energia e lo sviluppo economico sostenibile Laboratorio Analisi e Osservazione del sistema Terra (UTMEA-TER)[email protected]