Embed Size (px)
Citation preview
St. Patrick’s Day Eggs:A Factorial Eggspearmint
(experiment)By Cheryl A Kilroy
5/5/2010

Outline• Introduction•Objective •Design Description
Procedure•Data Analysis•Conclusion •Recommendations
Objective
Determine which combination of levels of factors maximizes shade of green when dyeing eggs.

Design Description
•2 ^ 4 factorial design•Response •Factors (Refer to handout)•Experimental Unit•Blocks•Randomization (Refer to
handout)
Design Description
• Egg Organization (refer to handout)• Dyeing Procedures = egg organization + run order (eliminated need for blocks)• Solution organization like an excel
spreadsheet• Controlled Variables
Procedure
•Prepare eggs•Prepare solutions•Dye Eggs following dyeing procedures
•Measure shade of eggs 2 hours after removing from solution
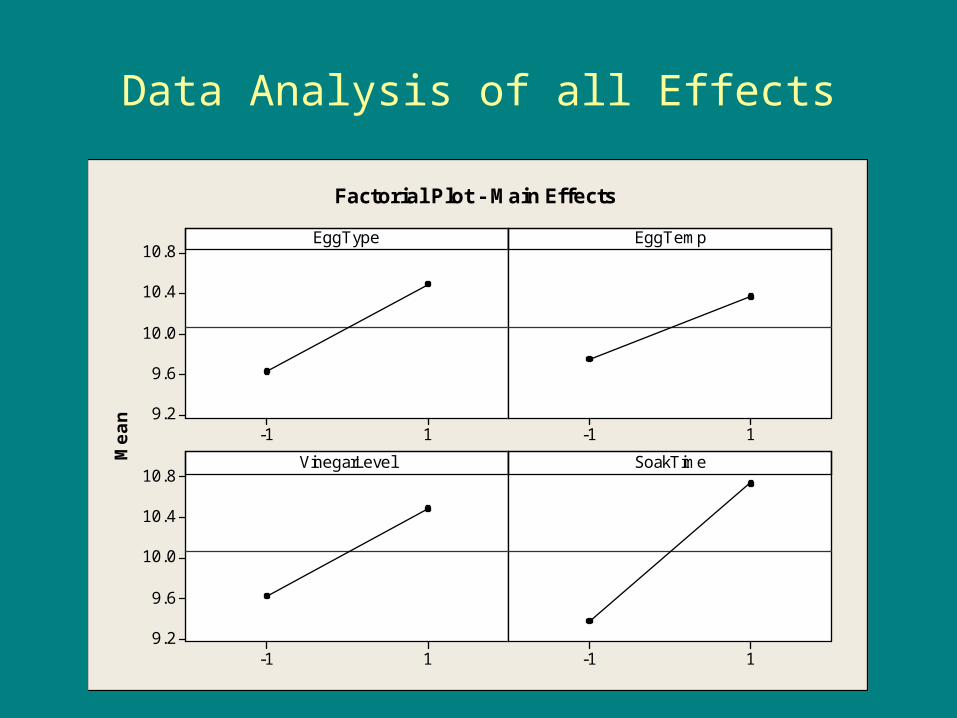
Data Analysis of all Effects
1-1
10.8
10.4
10.0
9.6
9.21-1
1-1
10.8
10.4
10.0
9.6
9.21-1
EggType
Mean
EggTemp
VinegarLevel SoakTime
Factorial Plot - Main Effects
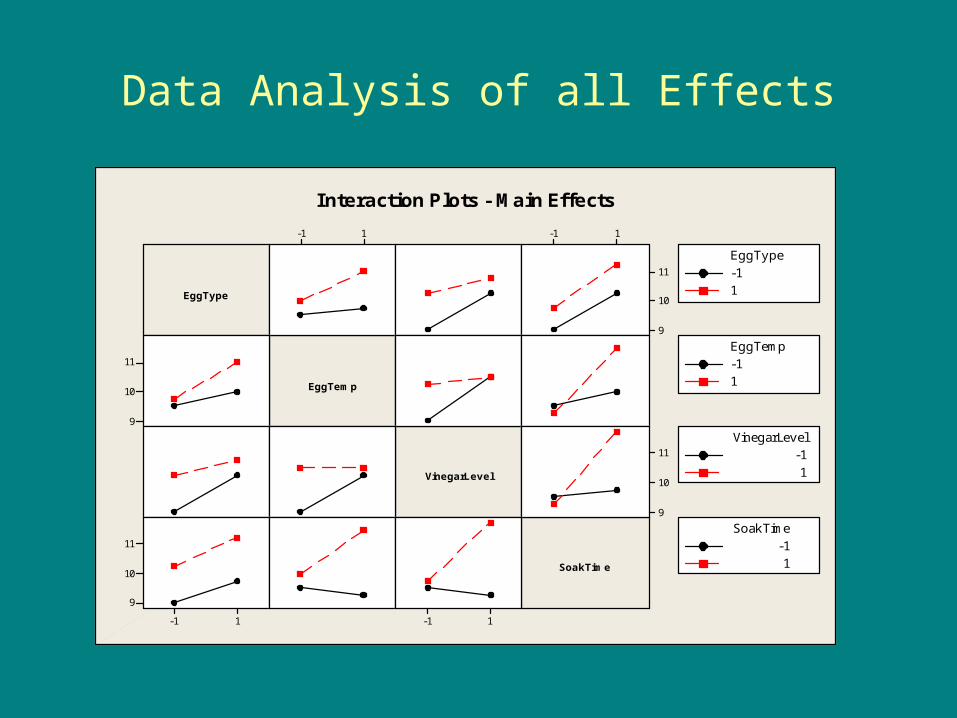
Data Analysis of all Effects
1-1 1-1
11
10
9
11
10
9
11
10
9
1-1
11
10
9
1-1
EggType
EggTemp
VinegarLevel
SoakTime
-11
EggType
-11
EggTemp
-11
VinegarLevel
-11
SoakTime
Interaction Plots - Main Effects
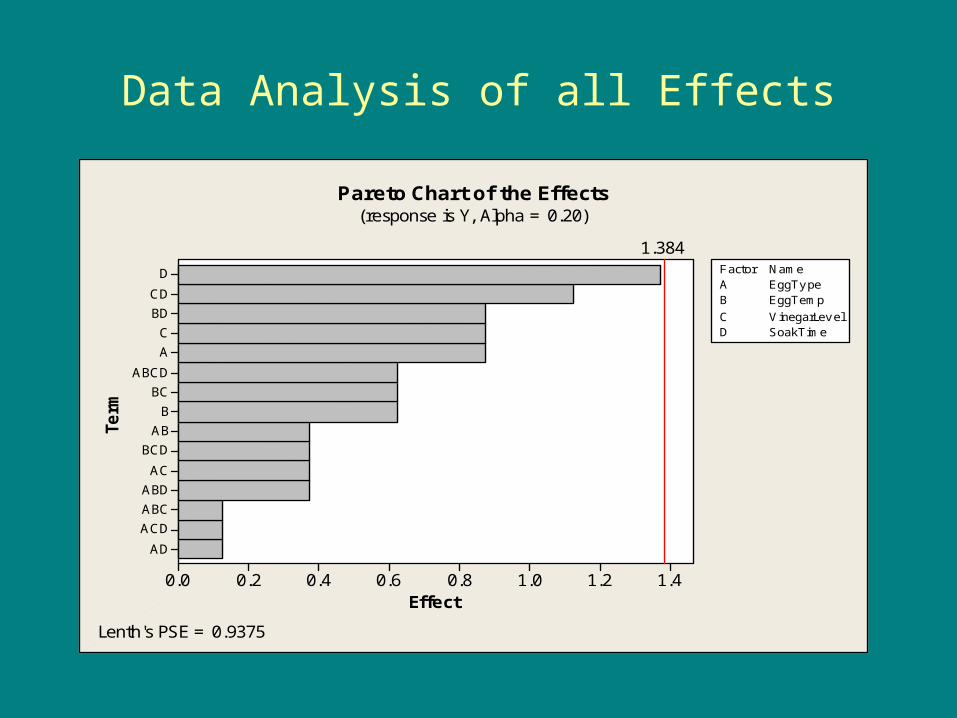
Data Analysis of all Effects
AD
ACD
ABC
ABD
AC
BCD
AB
B
BC
ABCD
A
C
BD
CD
D
1.41.21.00.80.60.40.20.0
Term
Effect
1.384
A EggTypeB EggTempC VinegarLevelD SoakTime
Factor Name
Pareto Chart of the Effects(response is Y, Alpha = 0.20)
Lenth's PSE = 0.9375
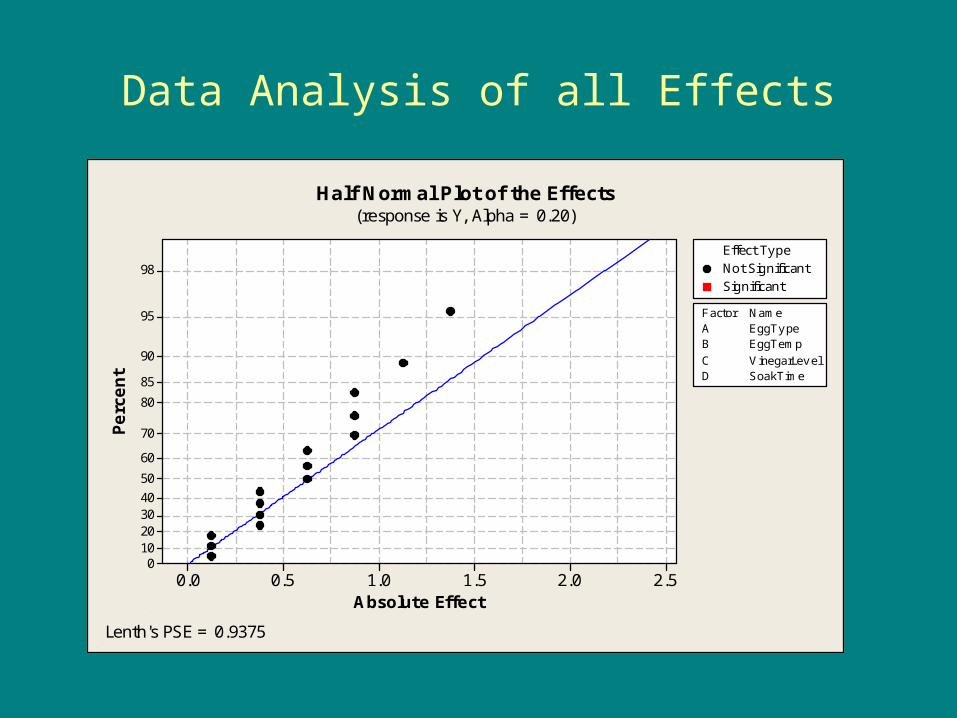
Data Analysis of all Effects
2.52.01.51.00.50.0
98
95
90
85
80
70
60
50
403020100
Absolute Effect
Perc
ent
A EggTypeB EggTempC VinegarLevelD SoakTime
Factor Name
Not SignificantSignificant
Effect Type
Half Normal Plot of the Effects(response is Y, Alpha = 0.20)
Lenth's PSE = 0.9375
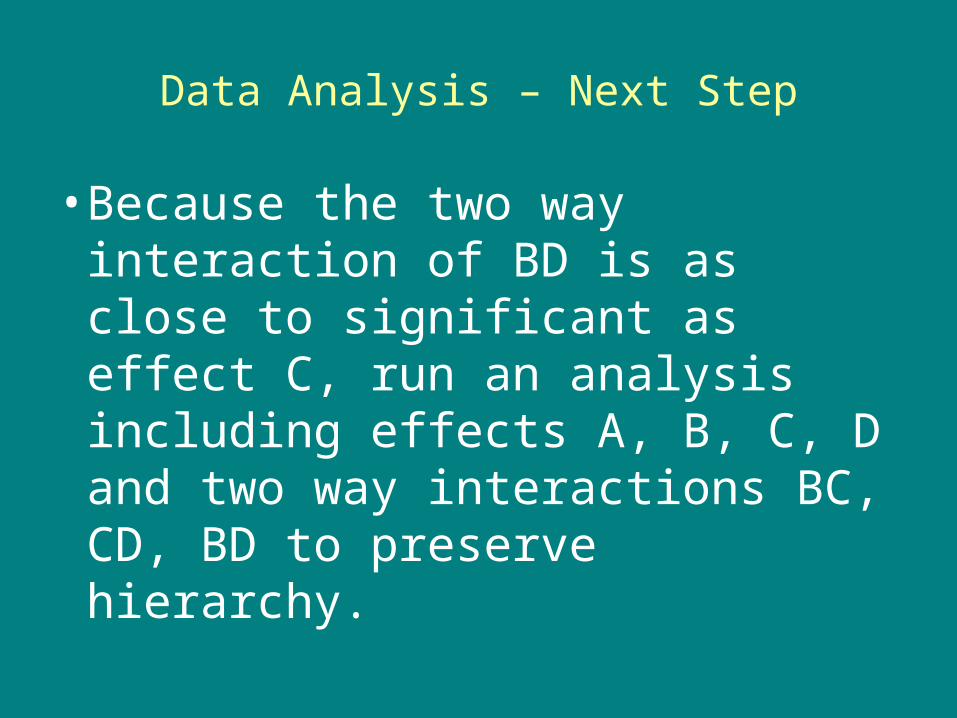
Data Analysis – Next Step
•Because the two way interaction of BD is as close to significant as effect C, run an analysis including effects A, B, C, D and two way interactions BC, CD, BD to preserve hierarchy.
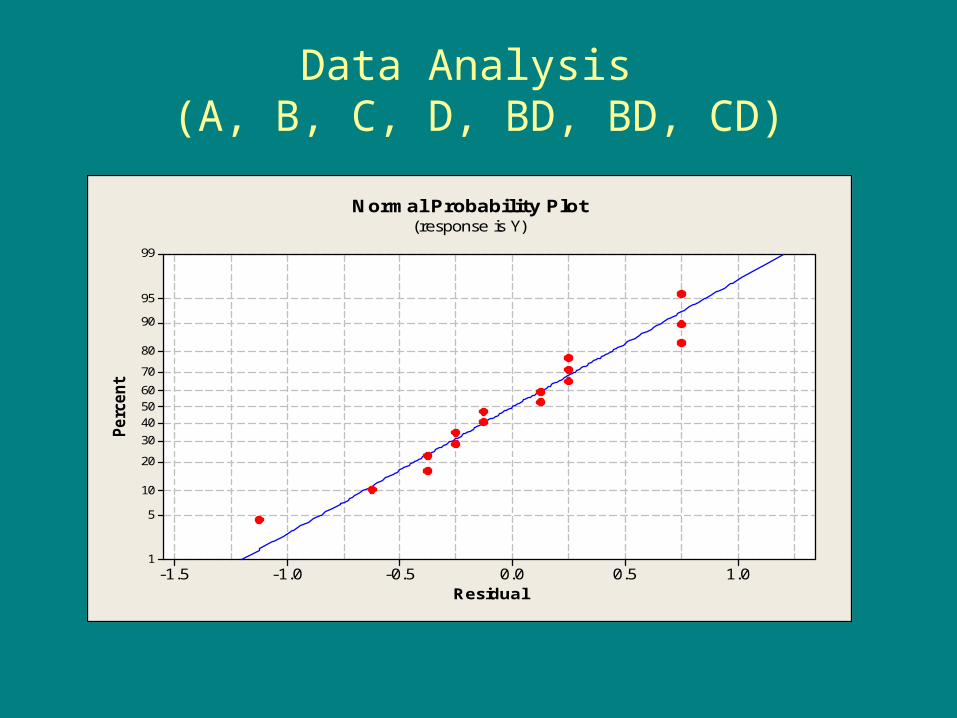
Data Analysis (A, B, C, D, BD, BD, CD)
1.00.50.0-0.5-1.0-1.5
99
95
90
80
70
605040
30
20
10
5
1
Residual
Perc
ent
Normal Probability Plot(response is Y)
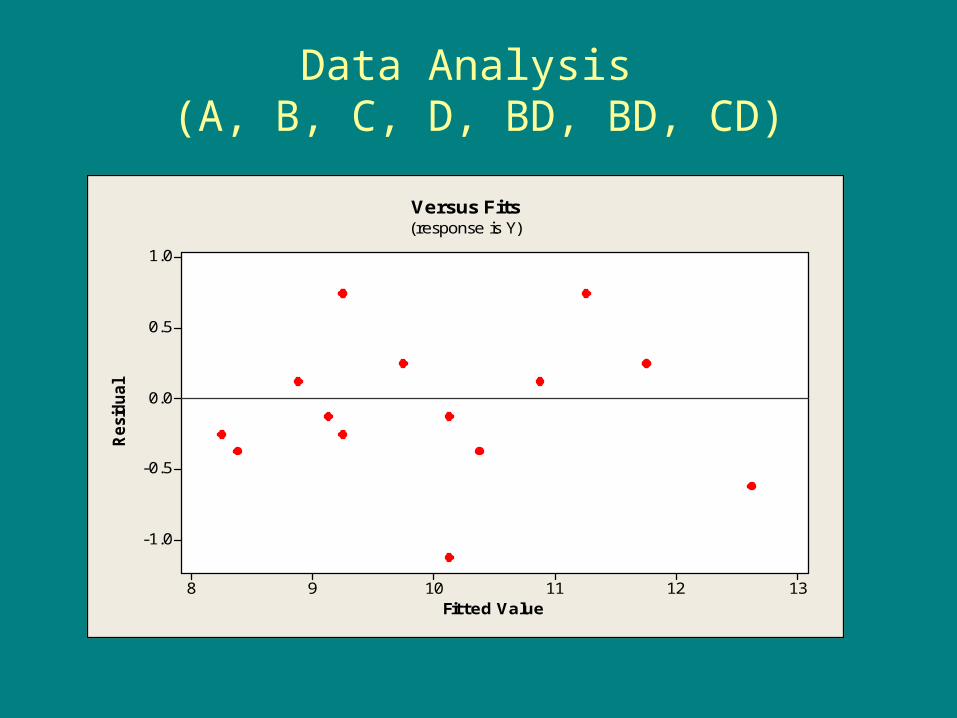
Data Analysis (A, B, C, D, BD, BD, CD)
1312111098
1.0
0.5
0.0
-0.5
-1.0
Fitted Value
Resi
dual
Versus Fits(response is Y)
Data Analysis (A, B, C, D, BD, BD, CD)
1.00.50.0-0.5-1.0
1.0
0.5
0.0
-0.5
-1.0
VinegarLevel
Resi
dual
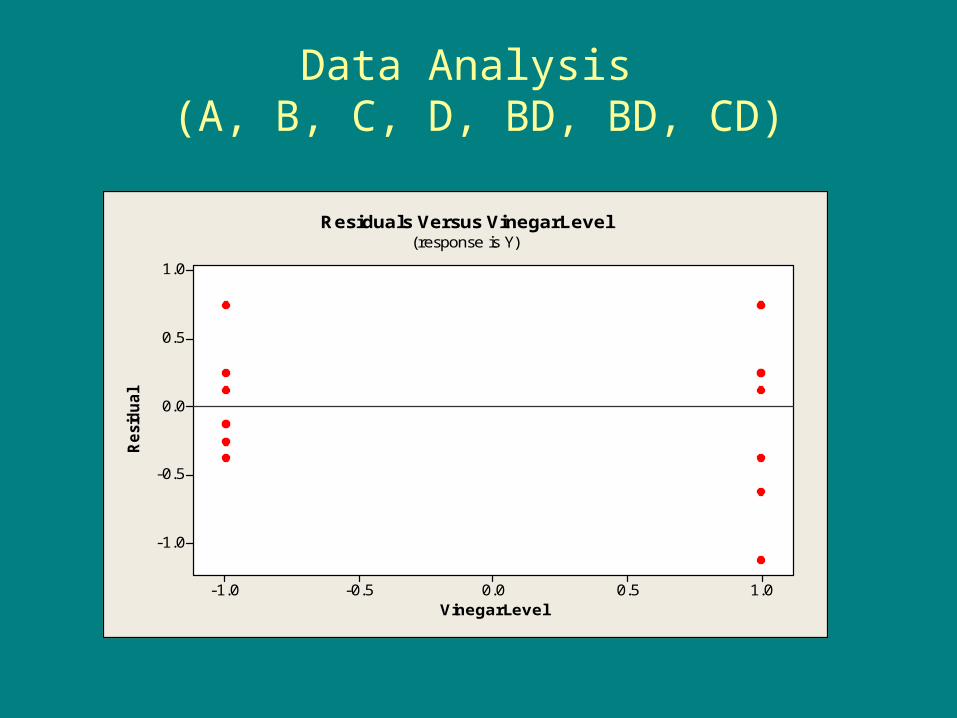
Residuals Versus VinegarLevel(response is Y)
Data Analysis (A, B, C, D, BD, BD, CD)
1.00.50.0-0.5-1.0
1.0
0.5
0.0
-0.5
-1.0
SoakTime
Resi
dual
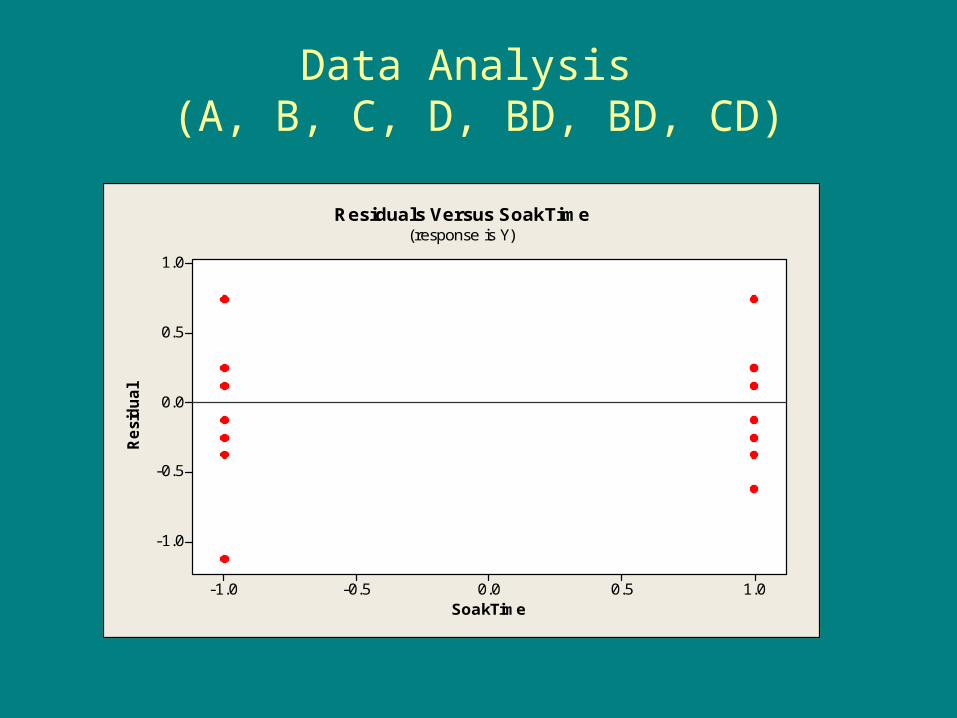
Residuals Versus SoakTime(response is Y)

Data Analysis (A, B, C, D, BD, BD, CD)
Output

Data Analysis (A, C, D, CD)
Normality was not an issue
(graph lost)
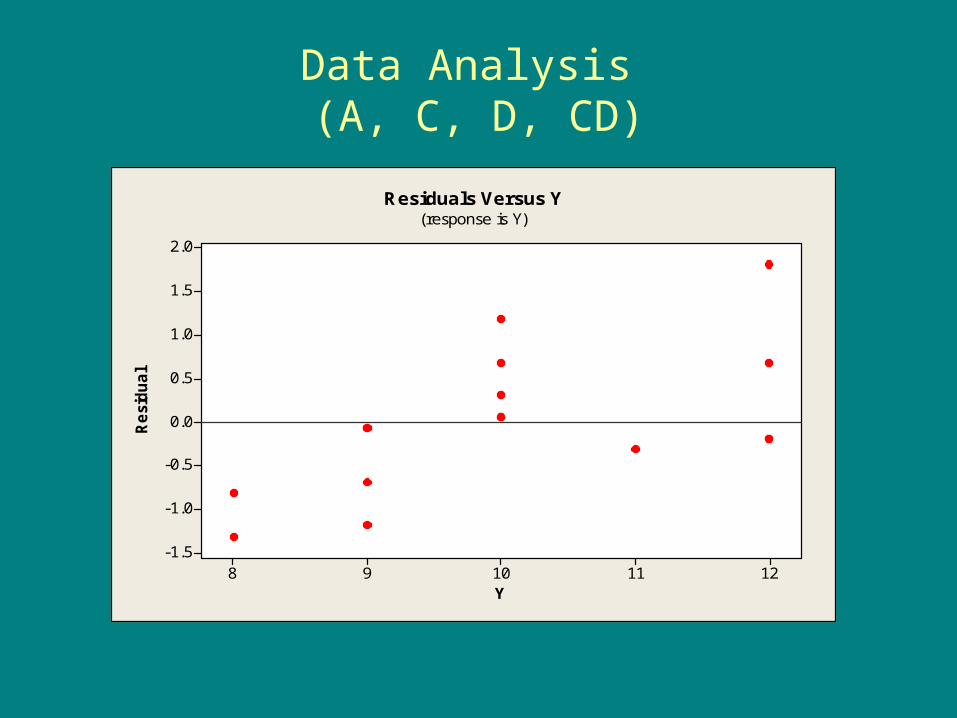
Data Analysis (A, C, D, CD)
12111098
2.0
1.5
1.0
0.5
0.0
-0.5
-1.0
-1.5
Y
Resi
dual
Residuals Versus Y(response is Y)
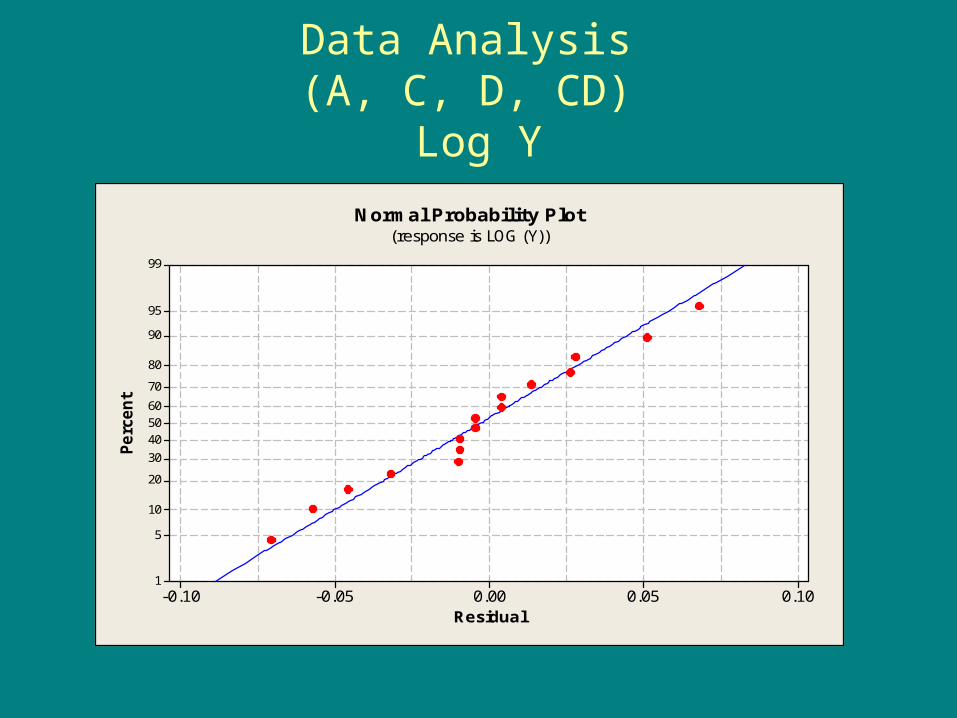
Data Analysis (A, C, D, CD)
Log Y
0.100.050.00-0.05-0.10
99
95
90
80
70
605040
30
20
10
5
1
Residual
Perc
ent
Normal Probability Plot(response is LOG (Y))
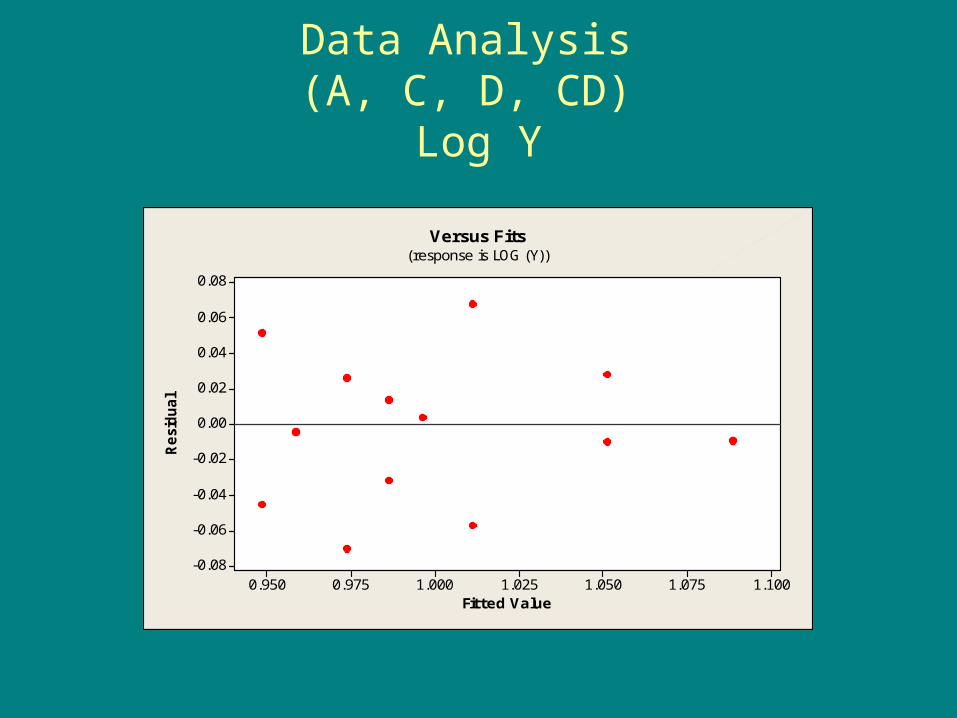
Data Analysis (A, C, D, CD)
Log Y
1.1001.0751.0501.0251.0000.9750.950
0.08
0.06
0.04
0.02
0.00
-0.02
-0.04
-0.06
-0.08
Fitted Value
Resi
dual
Versus Fits(response is LOG (Y))
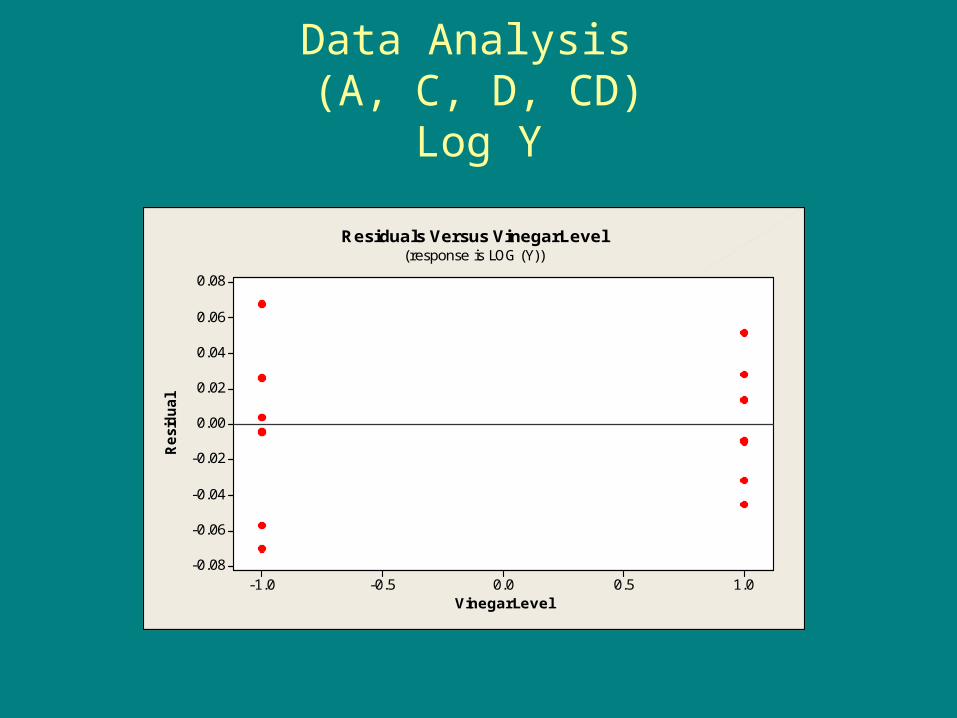
Data Analysis (A, C, D, CD)
Log Y
1.00.50.0-0.5-1.0
0.08
0.06
0.04
0.02
0.00
-0.02
-0.04
-0.06
-0.08
VinegarLevel
Resi
dual
Residuals Versus VinegarLevel(response is LOG (Y))
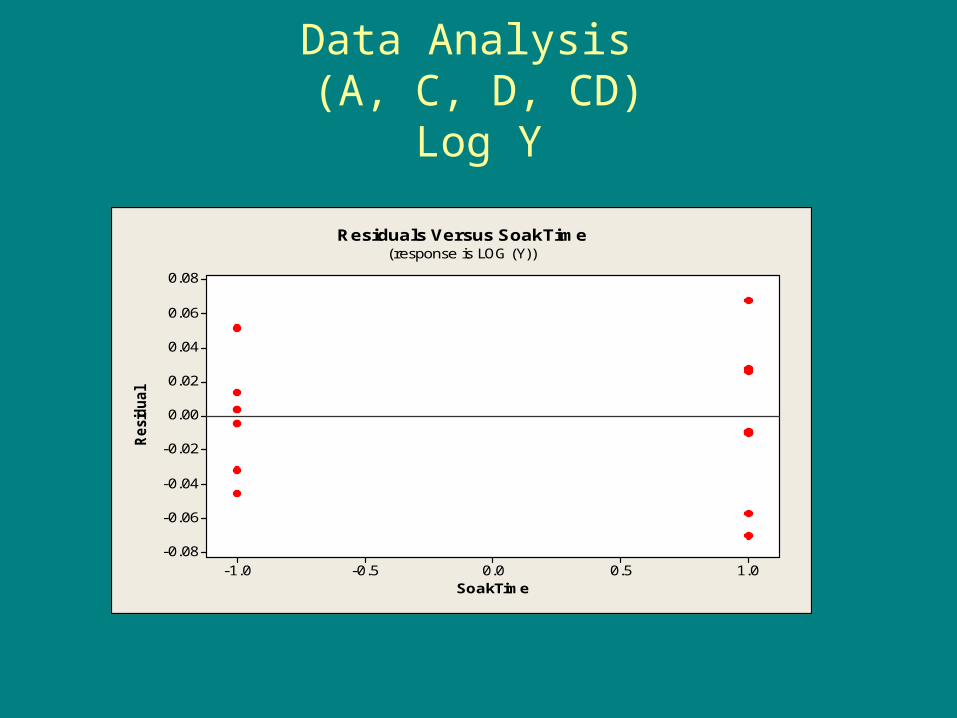
Data Analysis (A, C, D, CD)
Log Y
1.00.50.0-0.5-1.0
0.08
0.06
0.04
0.02
0.00
-0.02
-0.04
-0.06
-0.08
SoakTime
Residual
Residuals Versus SoakTime(response is LOG (Y))

Data Analysis (A, C, D, CD)
Log Y
Output
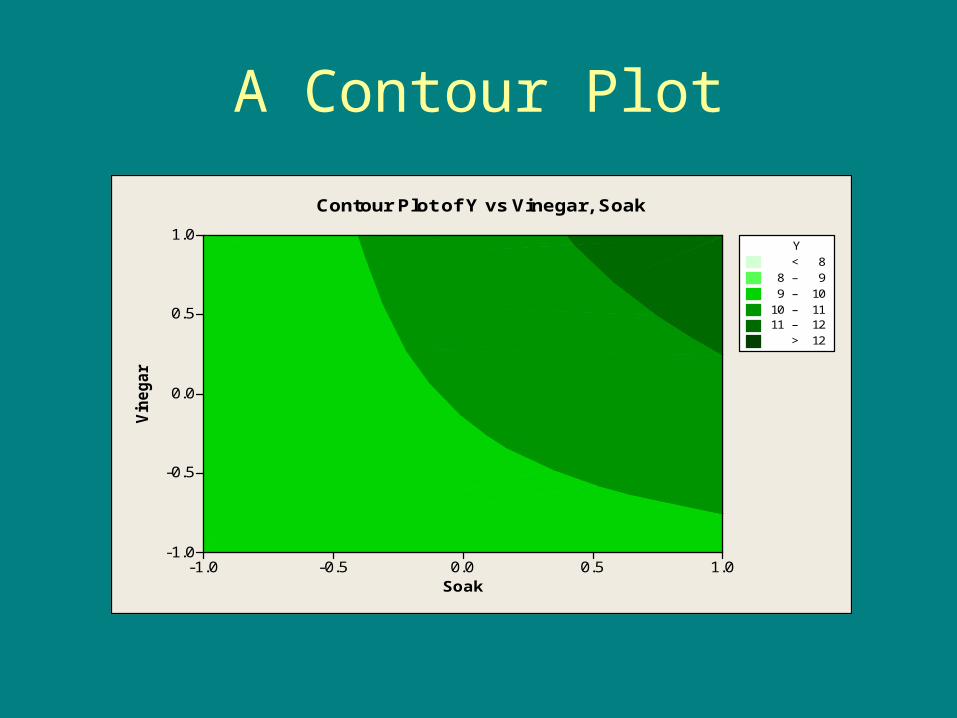
A Contour Plot
Soak
Vin
egar
1.00.50.0-0.5-1.0
1.0
0.5
0.0
-0.5
-1.0
> – – – – < 8
8 99 10
10 1111 12
12
Y
Contour Plot of Y vs Vinegar, Soak
Conclusion
To get a deep dark green eggs:•Soak large white room
temperature raw eggs in a solution of ½ cup room temperature water, ¼ teaspoon food coloring, and 4 teaspoons of vinegar for 7 minutes
Recommendations
• Use 20 drops of food coloring• Use machinery to conduct
experiment and measure shade of green
• Change temperature levels• Add factors• Start dyeing eggs for St. Patrick’s
Day and holidays in general