Embed Size (px)
Citation preview
Long-term Performance Evaluation of a Foot-mounted Pedestrian Navigation Device
1
www.gt-silicon.comwww.inertialelements.com
19 December 2015
• We present results of the testing performed on the foot
mounted pedestrian navigation device Osmium MIMU22BTP
• Testing was performed using multiple devices, with different
types of shoes, path profiles, mounting schemes and wearers
Testing was spanned over 10 months with total distance
Overview
• Testing was spanned over 10 months with total distance
covered of more than 150 Km
• The tracking results are analysed for drift, distance error and
height (z) errors
• Finally results are presented with 95% data range
Setup
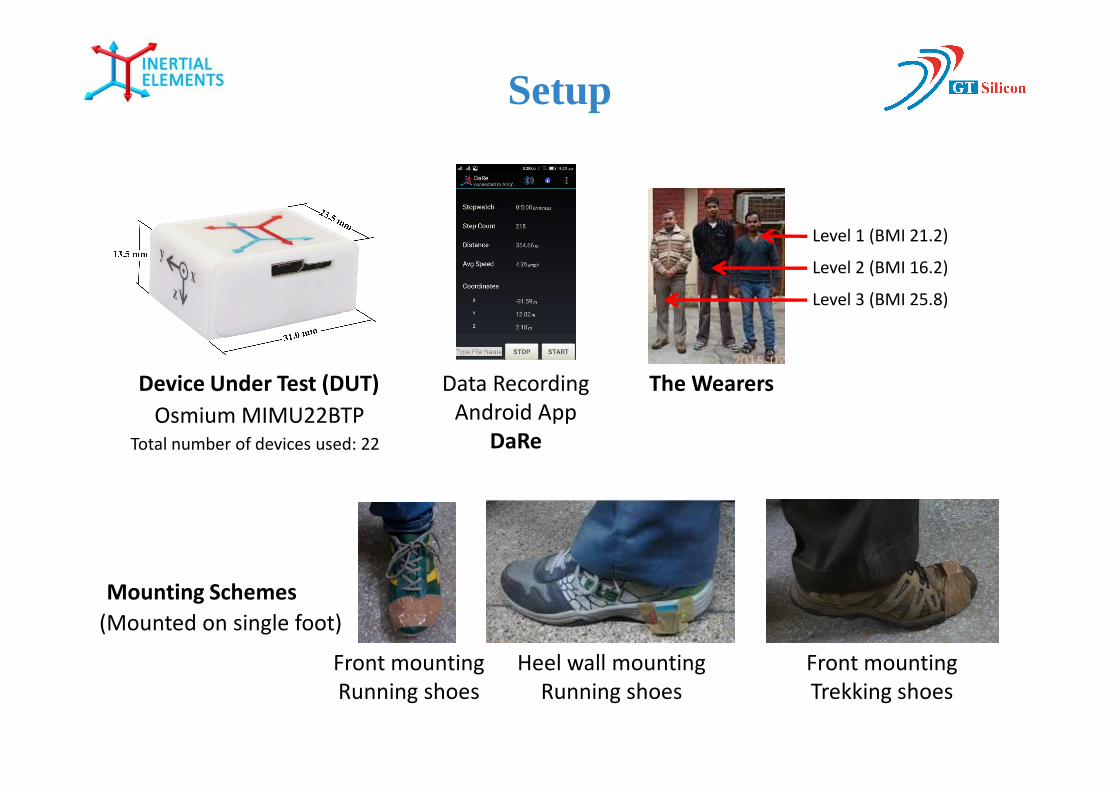
Device Under Test (DUT) Data Recording
Level 1 (BMI 21.2)
Level 2 (BMI 16.2)
Level 3 (BMI 25.8)
The WearersDevice Under Test (DUT)
Mounting Schemes
Osmium MIMU22BTP
Front mounting
Running shoes
Heel wall mounting
Running shoes
Front mounting
Trekking shoes
Data Recording
Android App
DaRe
The Wearers
Total number of devices used: 22
(Mounted on single foot)
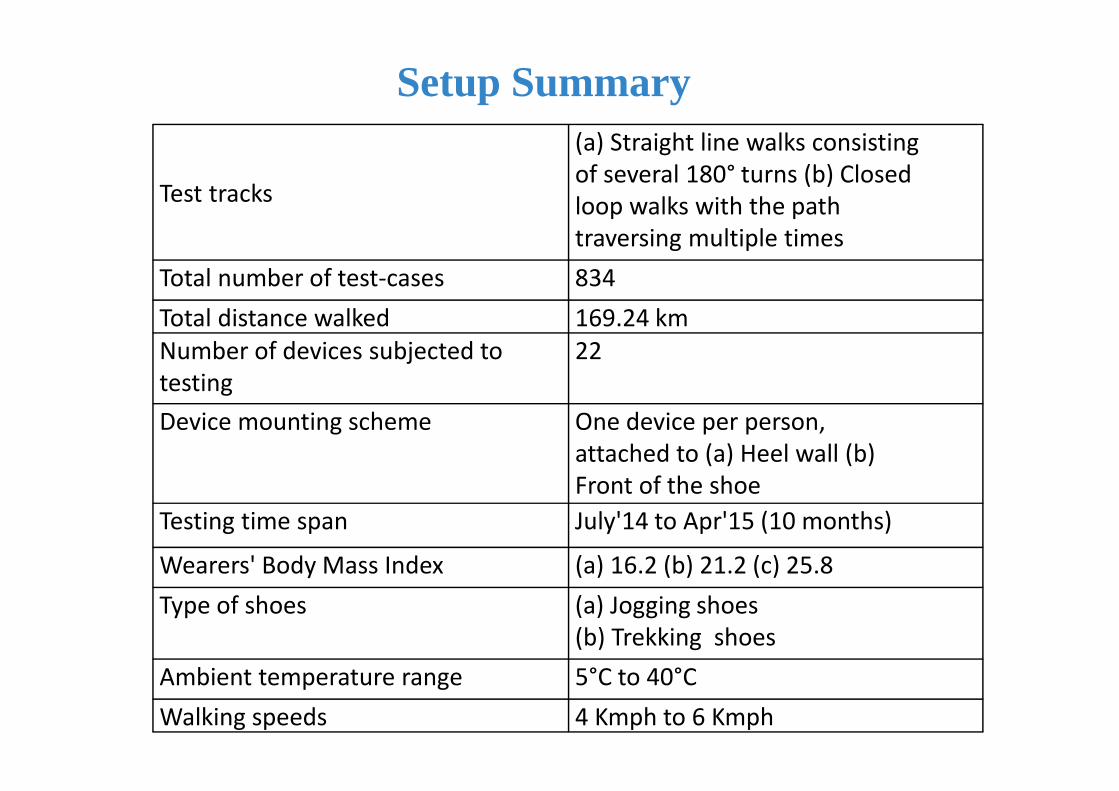
Test tracks
(a) Straight line walks consisting
of several 180° turns (b) Closed
loop walks with the path
traversing multiple times
Total number of test-cases 834
Total distance walked 169.24 km
Number of devices subjected to
testing
22
Setup Summary
testing
Device mounting scheme One device per person,
attached to (a) Heel wall (b)
Front of the shoe
Testing time span July'14 to Apr'15 (10 months)
Wearers' Body Mass Index (a) 16.2 (b) 21.2 (c) 25.8
Type of shoes (a) Jogging shoes
(b) Trekking shoes
Ambient temperature range 5°C to 40°C
Walking speeds 4 Kmph to 6 Kmph
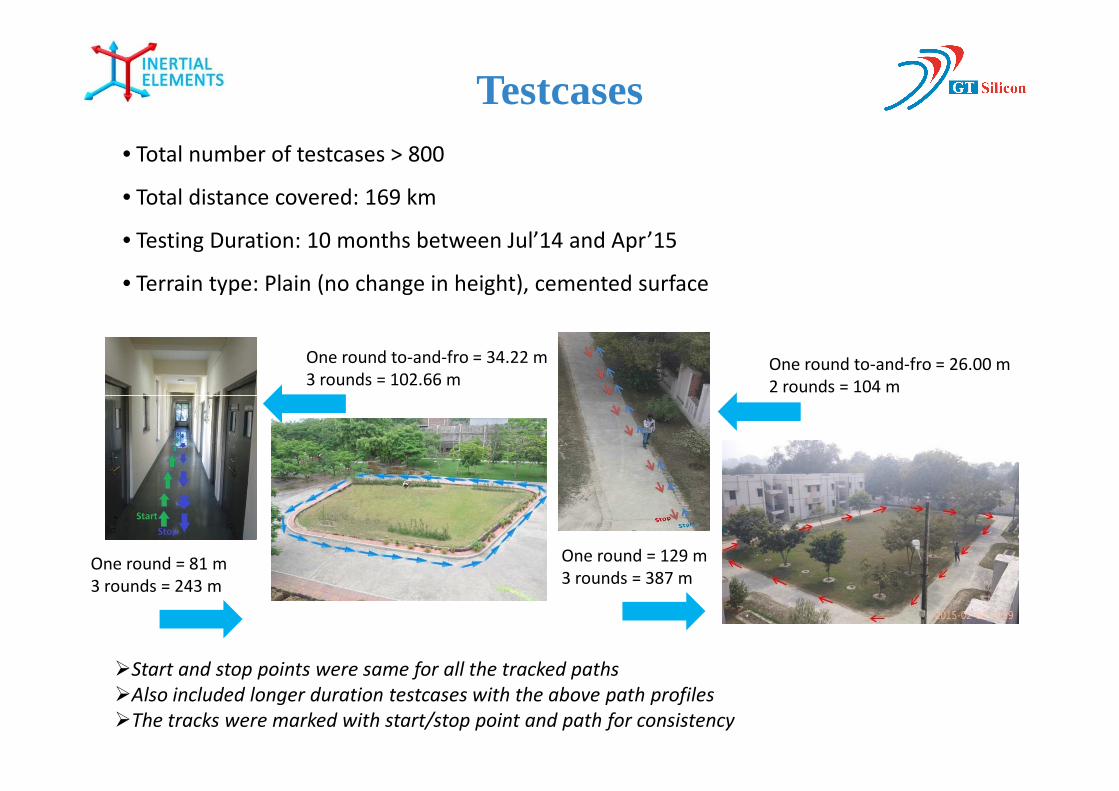
Testcases
One round to-and-fro = 34.22 m
3 rounds = 102.66 mOne round to-and-fro = 26.00 m
2 rounds = 104 m
• Total number of testcases > 800
• Total distance covered: 169 km
• Testing Duration: 10 months between Jul’14 and Apr’15
• Terrain type: Plain (no change in height), cemented surface
2 rounds = 104 m
One round = 81 m
3 rounds = 243 m
One round = 129 m
3 rounds = 387 m
�Start and stop points were same for all the tracked paths
�Also included longer duration testcases with the above path profiles
�The tracks were marked with start/stop point and path for consistency
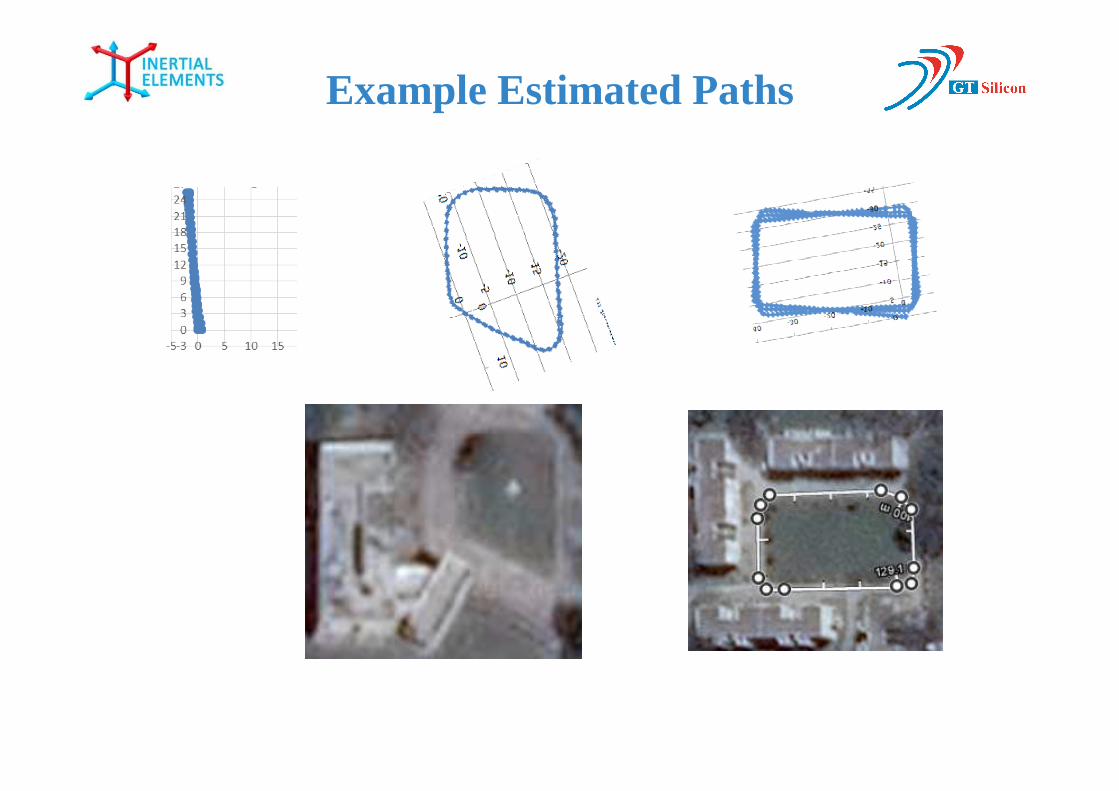
Example Estimated Paths
Performance Metrics
• Drift Error: Distance between estimated and actual Stop points,
per 100 m distance walked
• Distance Error: Difference between actual and estimated
distance, per 100 m distance walkeddistance, per 100 m distance walked
• Height (z) Error: Height (or z-coordinate) of the estimated Stop
point, per 100 m distance walked
0%
1%
2%
3%
4%
5%
6%
7%
8%
0.0
0
0.5
0
1.0
0
1.5
0
2.0
0
2.5
0
3.0
0
3.5
0
4.0
0
4.5
0
5.0
0
5.5
0
6.0
0
6.5
0
0%
1%
2%
3%
4%
5%
6%
7%
8%
-7.2
5
-6.0
0
-4.7
5
-3.5
0
-2.2
5
-1.0
0
0.2
5
1.5
0
2.7
5
4.0
0
5.2
5
6.5
0
0%
2%
4%
6%
8%
10%
12%
-5.1
0
-4.5
0
-3.7
5
-3.0
0
-2.2
5
-1.5
0
-0.7
5
0.0
0
0.7
5
1.5
0
2.2
5
3.0
0
3.7
5
4.5
0
Fra
ctio
n o
f Te
stca
ses
(%)
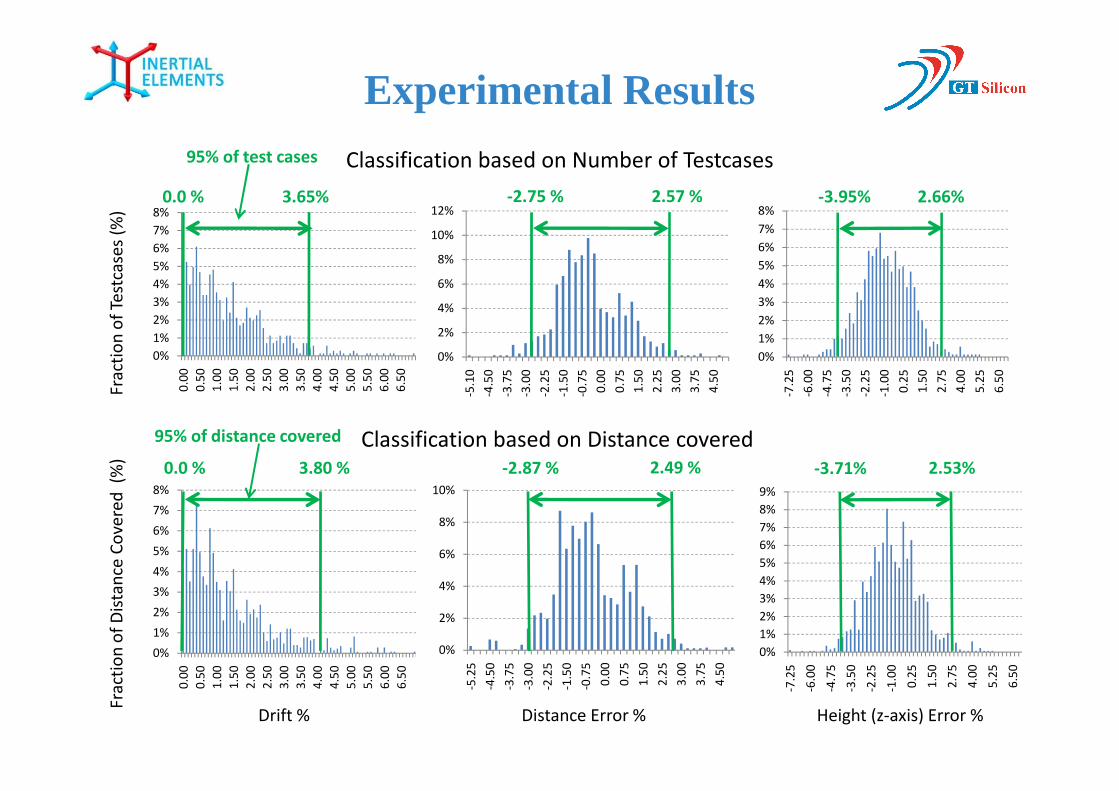
Classification based on Number of Testcases
Experimental Results
3.65%0.0 %
95% of test cases
2.57 %-2.75 % 2.66%-3.95%
- - - - - -
0%
1%
2%
3%
4%
5%
6%
7%
8%
0.0
0
0.5
0
1.0
0
1.5
0
2.0
0
2.5
0
3.0
0
3.5
0
4.0
0
4.5
0
5.0
0
5.5
0
6.0
0
6.5
0
0%
2%
4%
6%
8%
10%
-5.2
5
-4.5
0
-3.7
5
-3.0
0
-2.2
5
-1.5
0
-0.7
5
0.0
0
0.7
5
1.5
0
2.2
5
3.0
0
3.7
5
4.5
0
0%
1%
2%
3%
4%
5%
6%
7%
8%
9%
-7.2
5
-6.0
0
-4.7
5
-3.5
0
-2.2
5
-1.0
0
0.2
5
1.5
0
2.7
5
4.0
0
5.2
5
6.5
0
- - - - - - -
Drift % Distance Error % Height (z-axis) Error %
Fra
ctio
n o
f Te
stca
ses
(%)
Fra
ctio
n o
f D
ista
nce
Co
vere
d
(%)
Classification based on Distance covered
3.80 %0.0 % 2.49 %-2.87 % 2.53%-3.71%
95% of distance covered
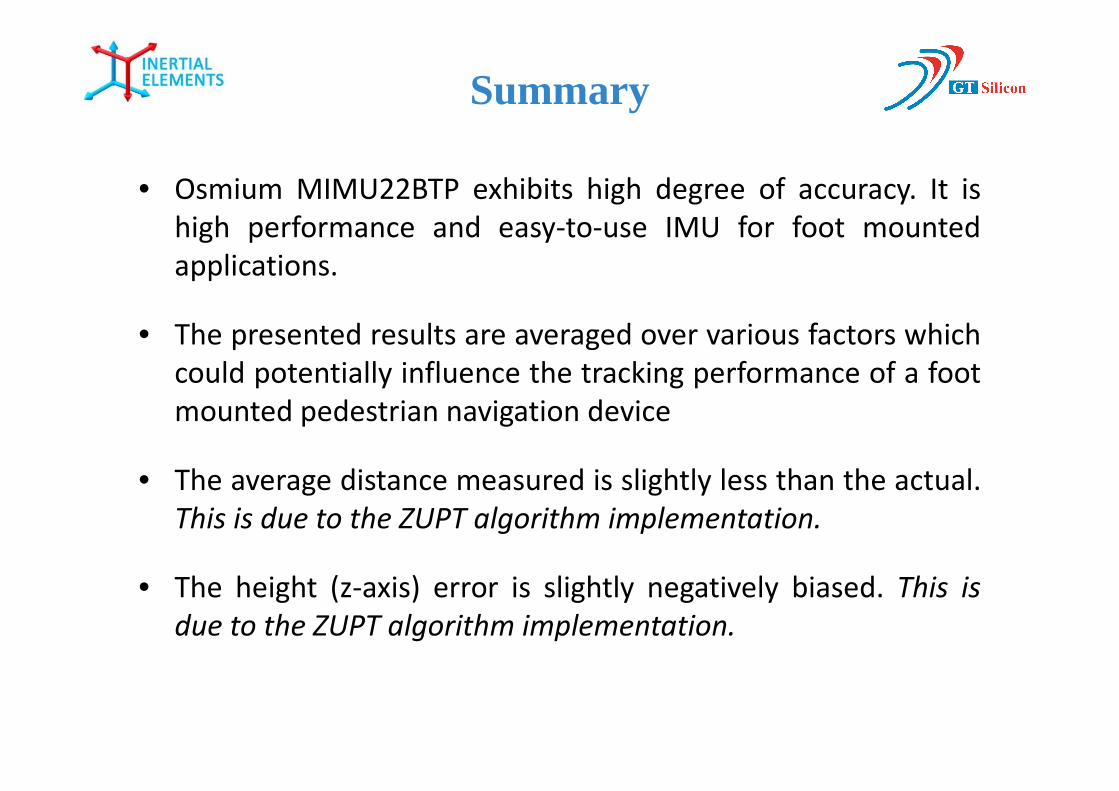
Summary
• Osmium MIMU22BTP exhibits high degree of accuracy. It is
high performance and easy-to-use IMU for foot mounted
applications.
• The presented results are averaged over various factors which
could potentially influence the tracking performance of a foot
mounted pedestrian navigation devicemounted pedestrian navigation device
• The average distance measured is slightly less than the actual.
This is due to the ZUPT algorithm implementation.
• The height (z-axis) error is slightly negatively biased. This is
due to the ZUPT algorithm implementation.
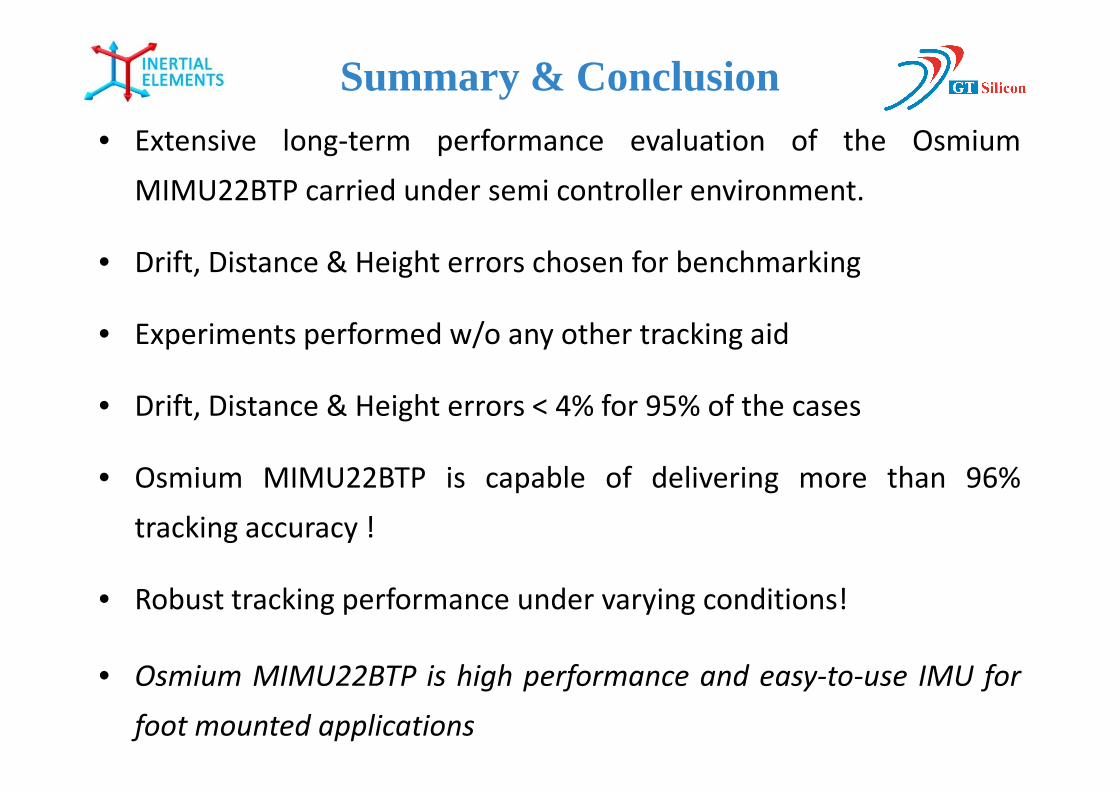
• Extensive long-term performance evaluation of the Osmium
MIMU22BTP carried under semi controller environment.
• Drift, Distance & Height errors chosen for benchmarking
• Experiments performed w/o any other tracking aid
• Drift, Distance & Height errors < 4% for 95% of the cases
Summary & Conclusion
• Drift, Distance & Height errors < 4% for 95% of the cases
• Osmium MIMU22BTP is capable of delivering more than 96%
tracking accuracy !
• Robust tracking performance under varying conditions!
• Osmium MIMU22BTP is high performance and easy-to-use IMU for
foot mounted applications
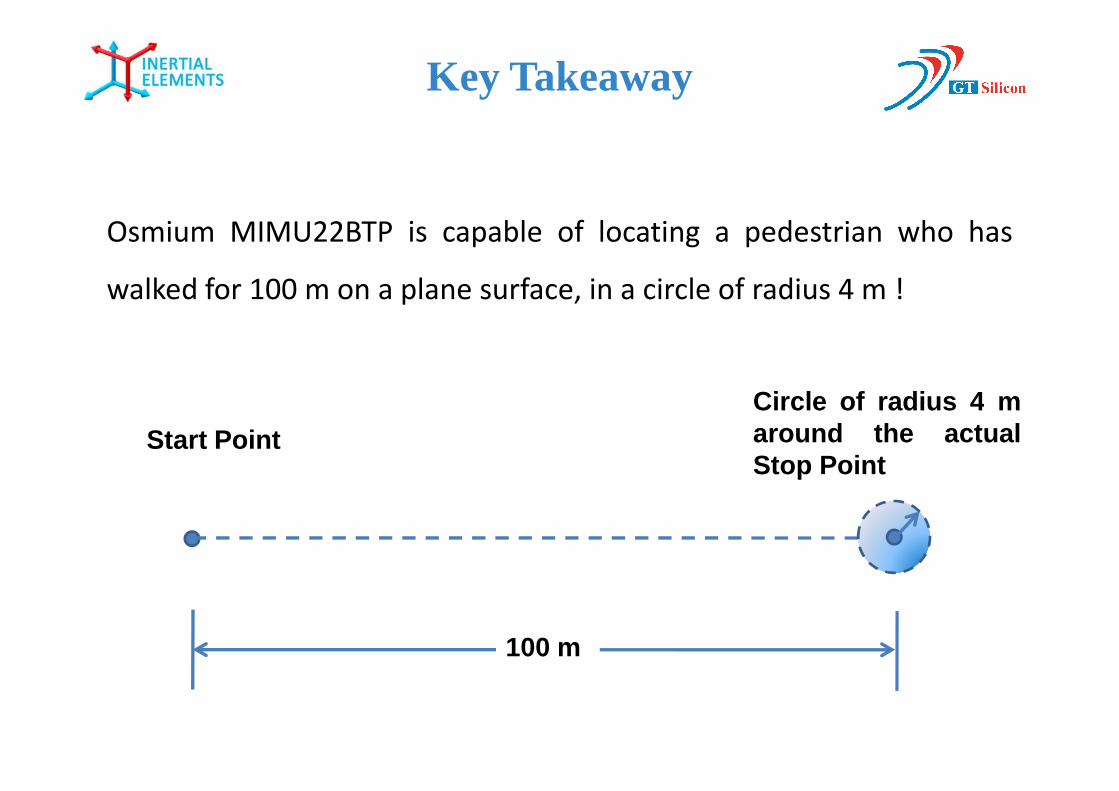
Circle of radius 4 m
Key Takeaway
Osmium MIMU22BTP is capable of locating a pedestrian who has
walked for 100 m on a plane surface, in a circle of radius 4 m !
Start Point
100 m
Circle of radius 4 maround the actualStop Point