Embed Size (px)
Citation preview
This presentation and the information contained herein is confidential. By your acceptance and review of this presentation, each recipient agrees that it will not,
and shall assure that its employees, agents, representatives and advisors will not copy, reproduce or distribute this presentation, in whole or in part, without the
prior written consent of Comniscient Technologies LLC, and that it will keep confidential all information contained herein which is not already in the public
domain. Further, the recipient will use the presentation only to obtain background information on the Company and its activities.
DATA-CON BOSTON 2014
TANYA CASHORALI
@TANYACASH21
Real Time Market Data & Analysis for the Telecom Industry
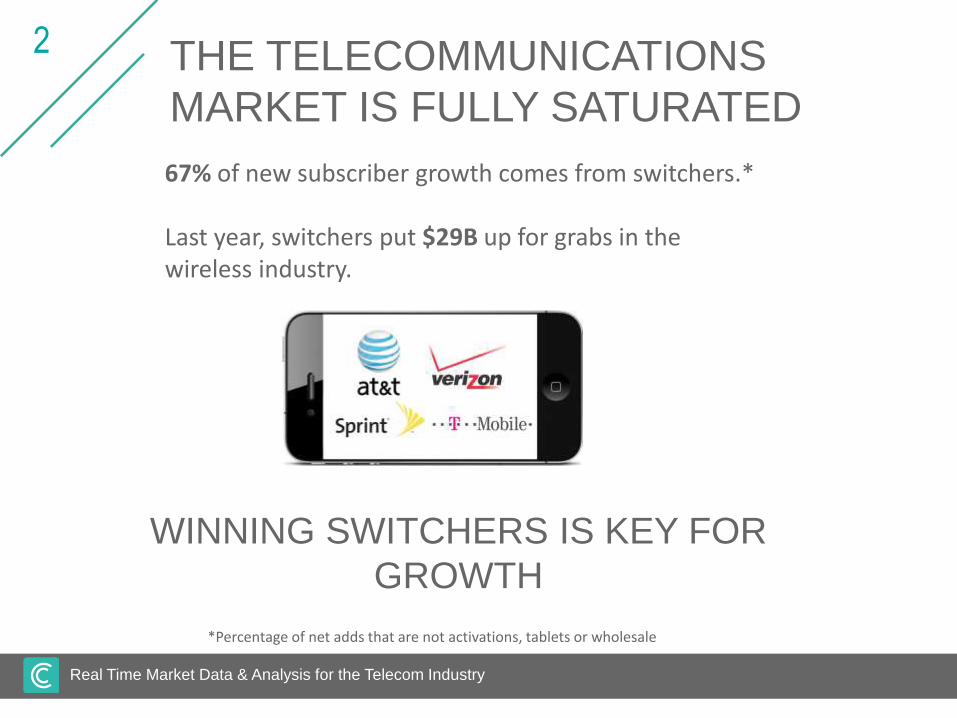
2 THE TELECOMMUNICATIONS
MARKET IS FULLY SATURATED
67% of new subscriber growth comes from switchers.*
Last year, switchers put $29B up for grabs in the wireless industry.
WINNING SWITCHERS IS KEY FOR
GROWTH
*Percentage of net adds that are not activations, tablets or wholesale
Real Time Market Data & Analysis for the Telecom Industry
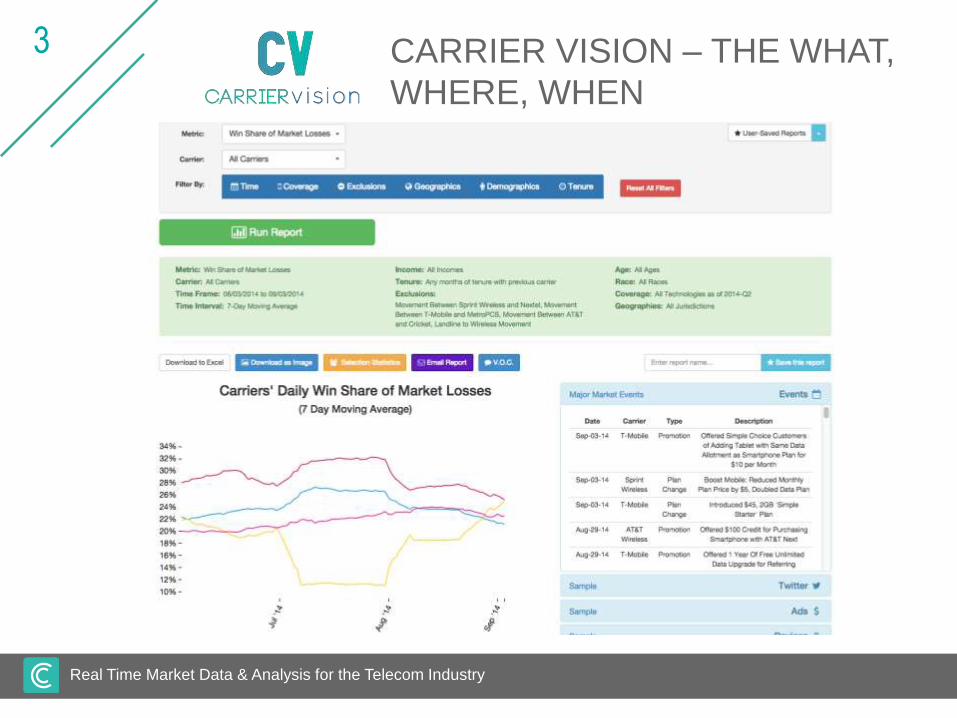
3 CARRIER VISION – THE WHAT,
WHERE, WHEN

Real Time Market Data & Analysis for the Telecom Industry
4 VOICE OF THE CUSTOMER –
THE WHY
Real Time Market Data & Analysis for the Telecom Industry
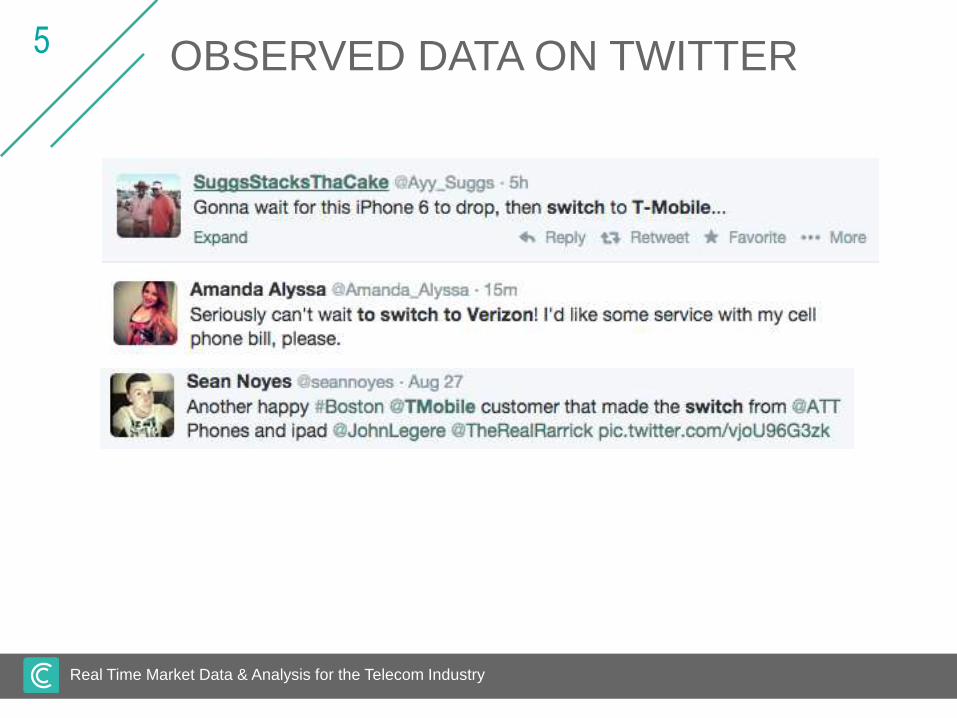
5 OBSERVED DATA ON TWITTER
Real Time Market Data & Analysis for the Telecom Industry
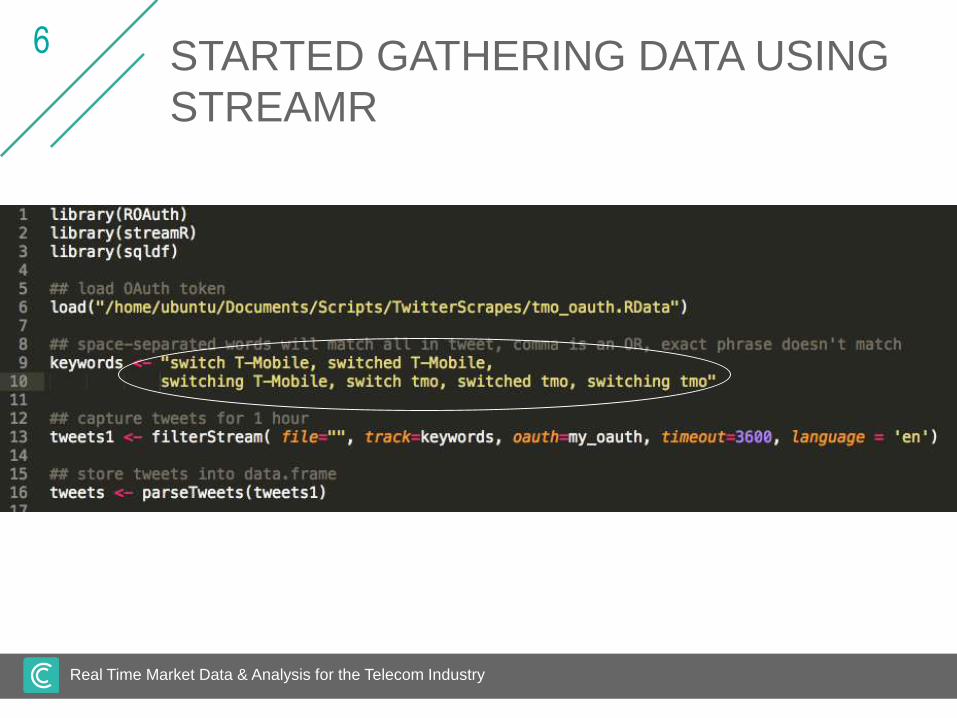
6 STARTED GATHERING DATA USING
STREAMR
Real Time Market Data & Analysis for the Telecom Industry
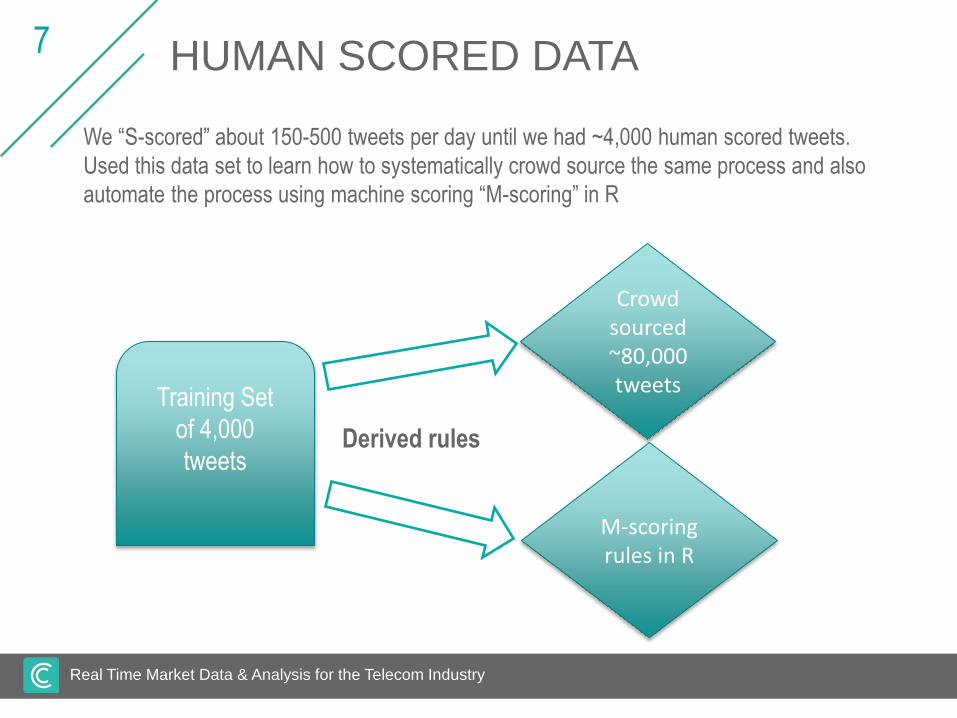
7 HUMAN SCORED DATA
We “S-scored” about 150-500 tweets per day until we had ~4,000 human scored tweets.
Used this data set to learn how to systematically crowd source the same process and also
automate the process using machine scoring “M-scoring” in R
Training Set
of 4,000
tweets
Crowd sourced ~80,000 tweets
Derived rules
M-scoring rules in R
Real Time Market Data & Analysis for the Telecom Industry
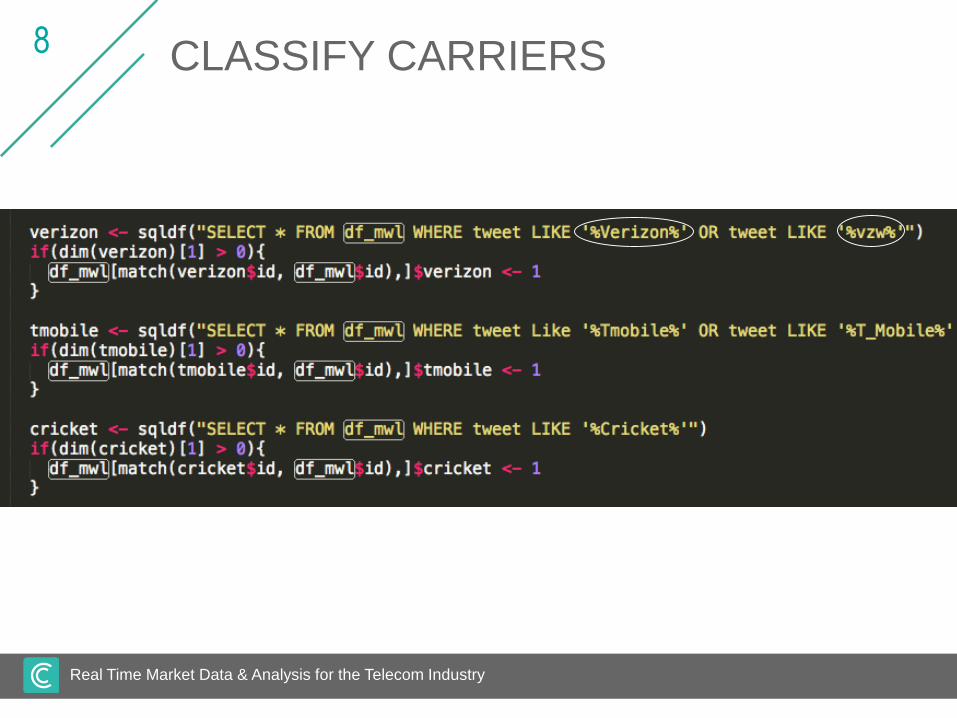
8 CLASSIFY CARRIERS
Real Time Market Data & Analysis for the Telecom Industry
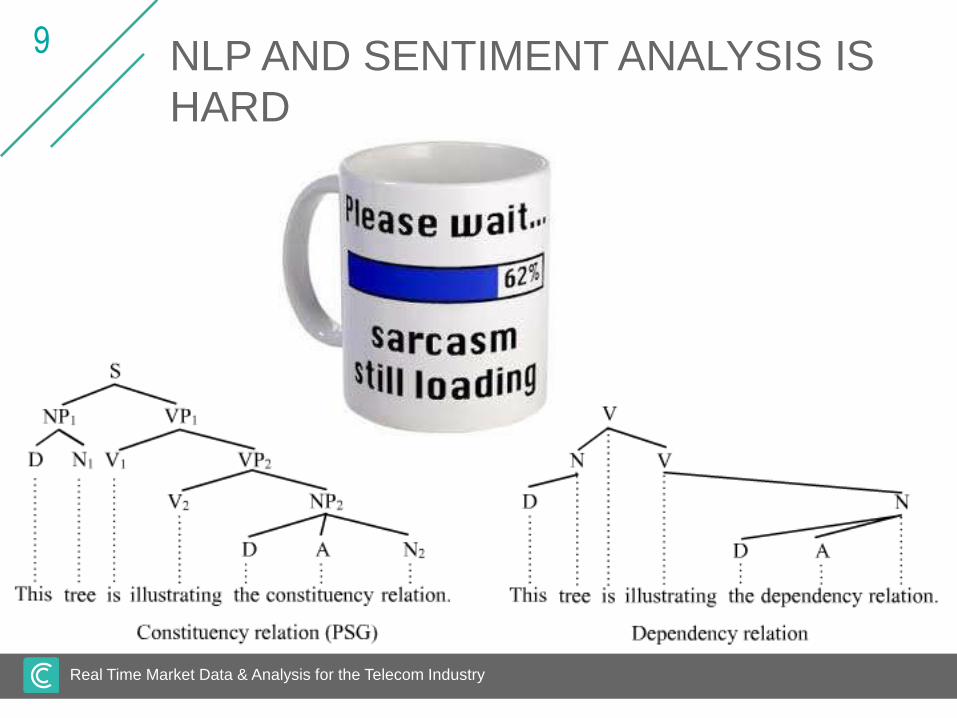
9 NLP AND SENTIMENT ANALYSIS IS
HARD

Real Time Market Data & Analysis for the Telecom Industry
10 BASIC PATTERN MATCHING IS
COMPLICATED ENOUGH
• Phone Price
• Customer Service
• Coverage Quality
• Upgrade Plan
• Coverage Availability
• Family Plan
• Plan Price
• Service Promo
• Outage
• Data Plan
• Phone Availability
• Device Promo
• Switching to / from
iPhone + expensive
Samsung Galaxy + money
Phone + cost
Data, unlimited
Switch from Verizon to ATT
Real Time Market Data & Analysis for the Telecom Industry
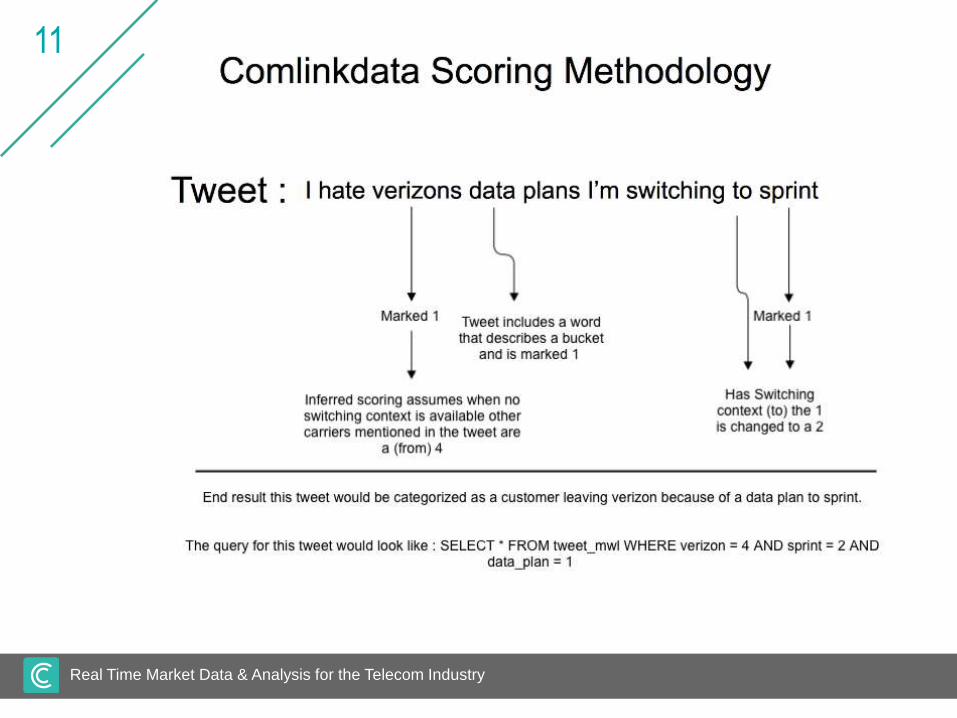
11
Real Time Market Data & Analysis for the Telecom Industry
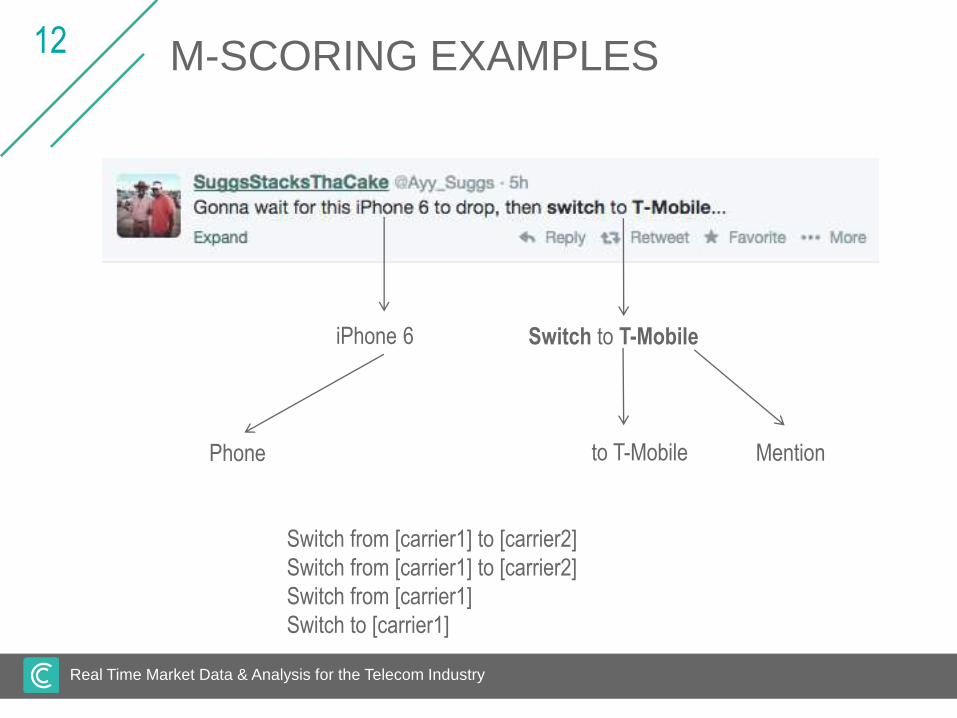
12 M-SCORING EXAMPLES
Phone
iPhone 6 Switch to T-Mobile
Mentionto T-Mobile
Switch from [carrier1] to [carrier2]
Switch from [carrier1] to [carrier2]
Switch from [carrier1]
Switch to [carrier1]
Real Time Market Data & Analysis for the Telecom Industry
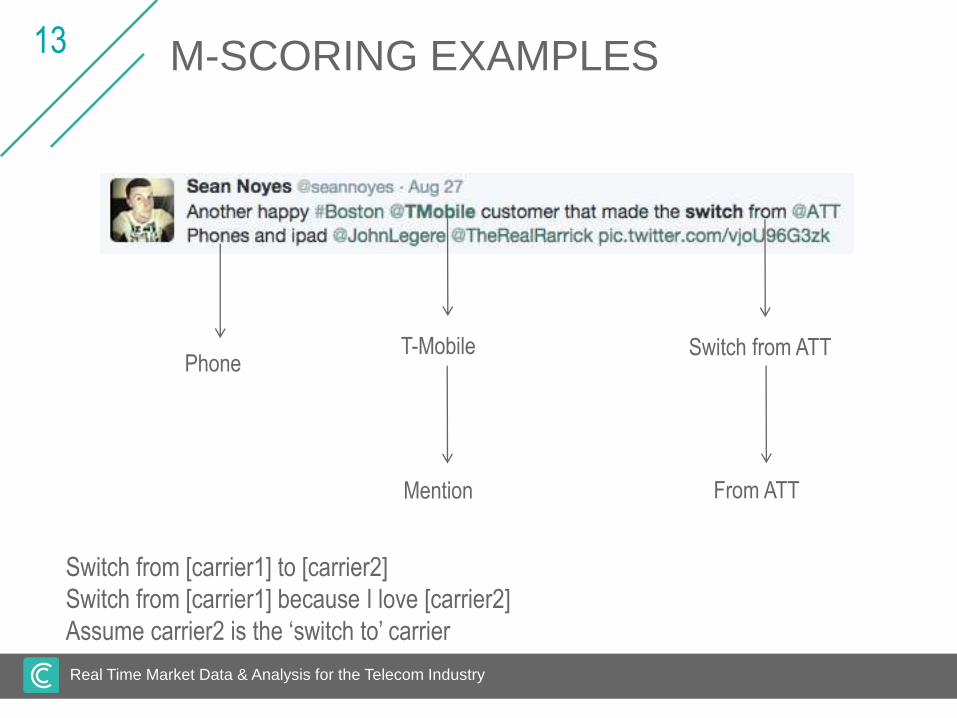
13 M-SCORING EXAMPLES
T-Mobile
Mention
Switch from ATT
From ATT
Switch from [carrier1] to [carrier2]
Switch from [carrier1] because I love [carrier2]
Assume carrier2 is the ‘switch to’ carrier
Phone
Real Time Market Data & Analysis for the Telecom Industry
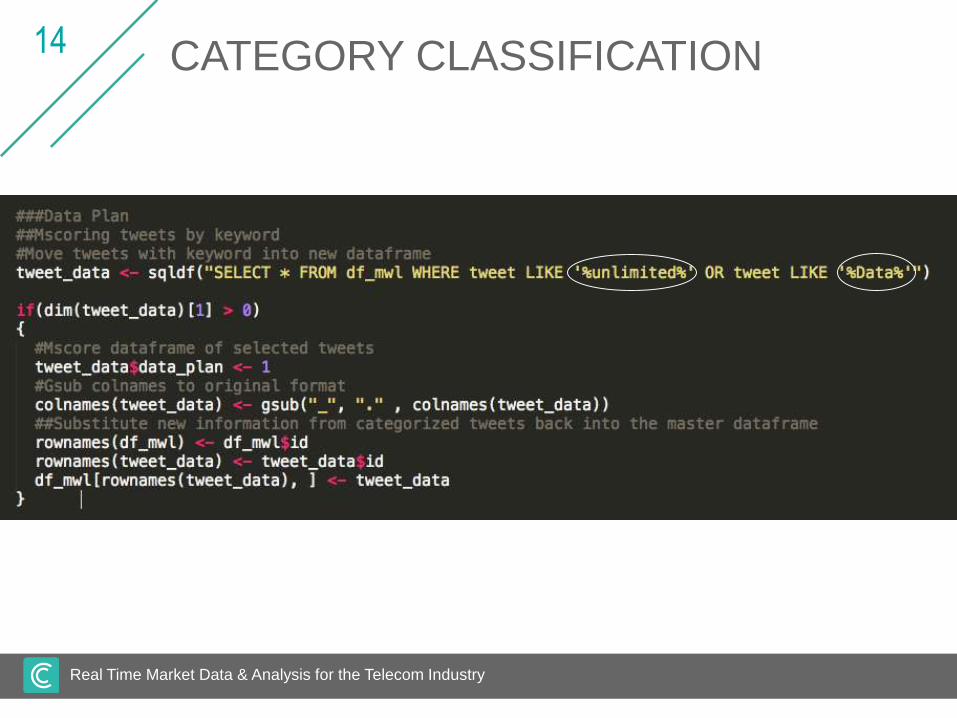
14 CATEGORY CLASSIFICATION
Real Time Market Data & Analysis for the Telecom Industry
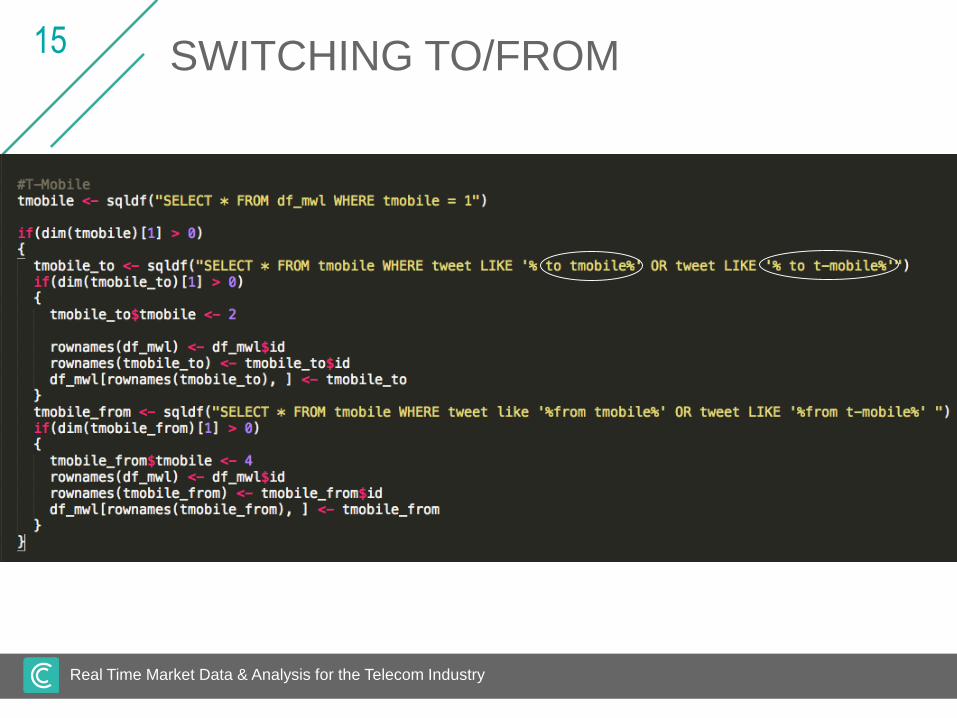
15 SWITCHING TO/FROM
Real Time Market Data & Analysis for the Telecom Industry
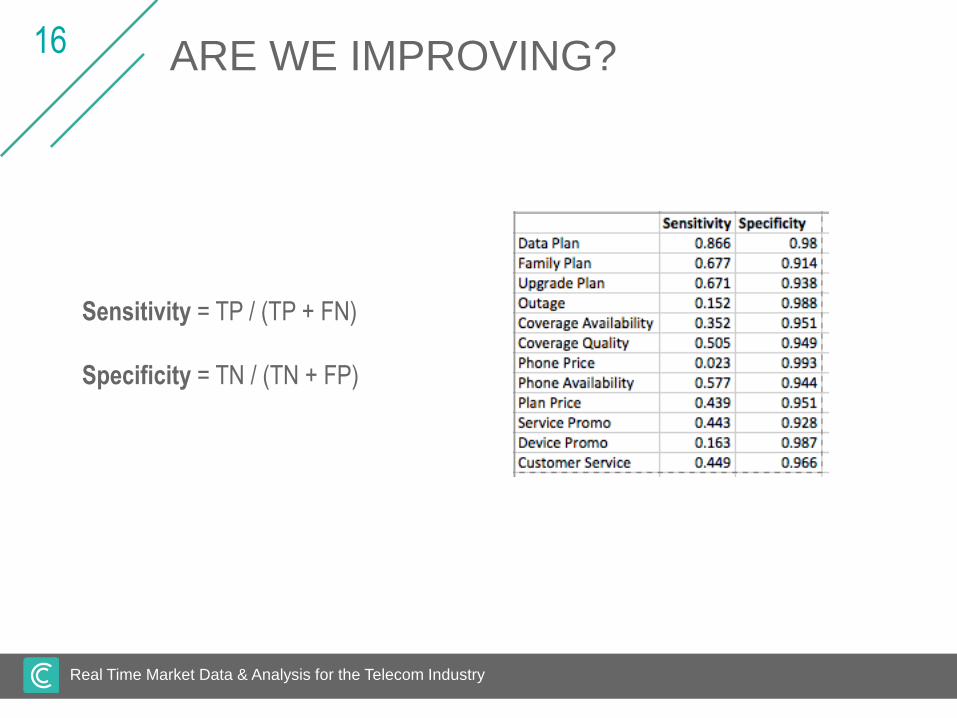
16 ARE WE IMPROVING?
Sensitivity = TP / (TP + FN)
Specificity = TN / (TN + FP)
Real Time Market Data & Analysis for the Telecom Industry
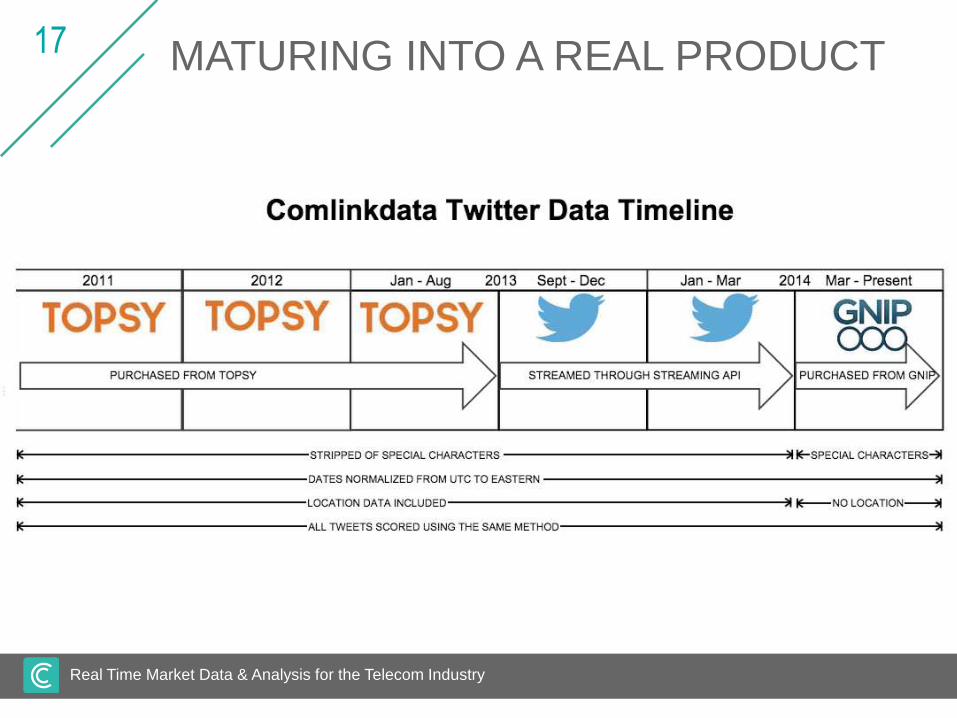
17 MATURING INTO A REAL PRODUCT
Real Time Market Data & Analysis for the Telecom Industry
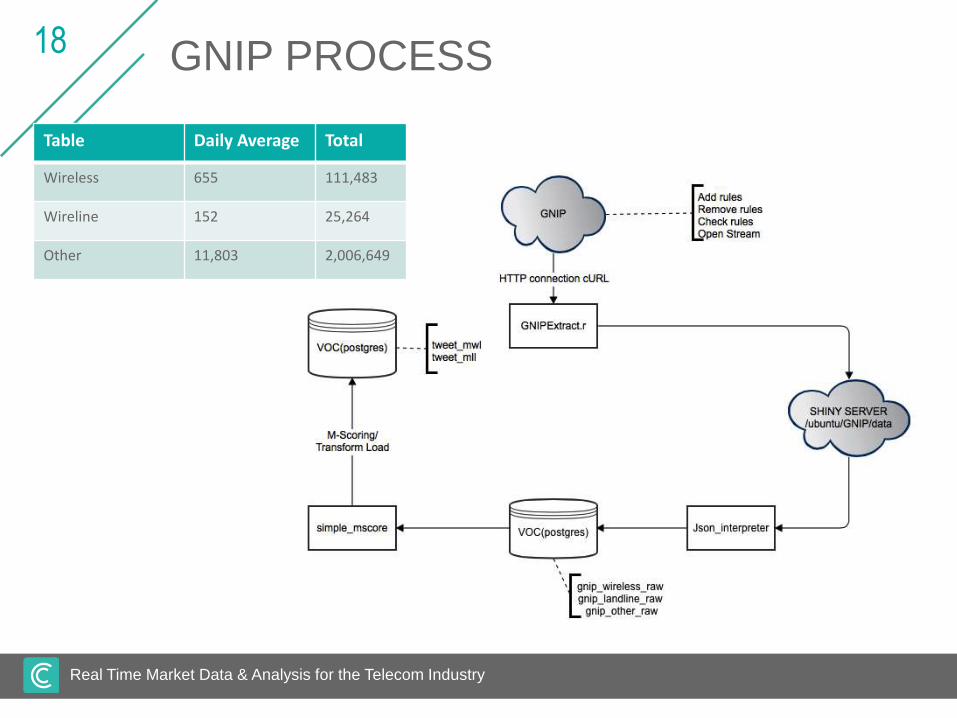
18 GNIP PROCESS
Table Daily Average Total
Wireless 655 111,483
Wireline 152 25,264
Other 11,803 2,006,649
Real Time Market Data & Analysis for the Telecom Industry
19
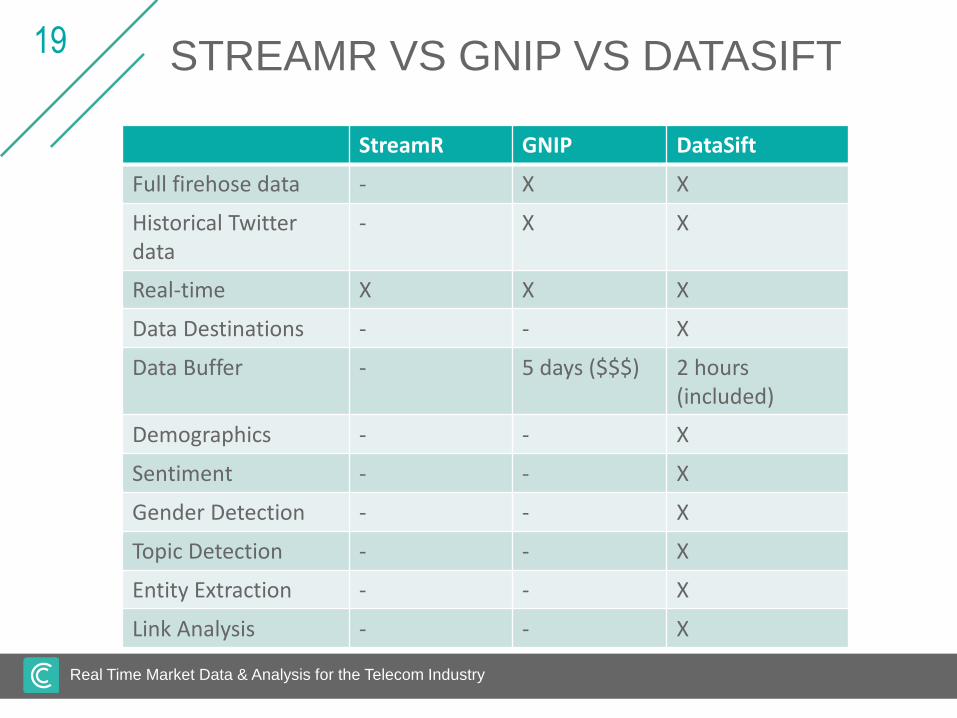
StreamR GNIP DataSift
Full firehose data - X X
Historical Twitterdata
- X X
Real-time X X X
Data Destinations - - X
Data Buffer - 5 days ($$$) 2 hours(included)
Demographics - - X
Sentiment - - X
Gender Detection - - X
Topic Detection - - X
Entity Extraction - - X
Link Analysis - - X
STREAMR VS GNIP VS DATASIFT
Real Time Market Data & Analysis for the Telecom Industry
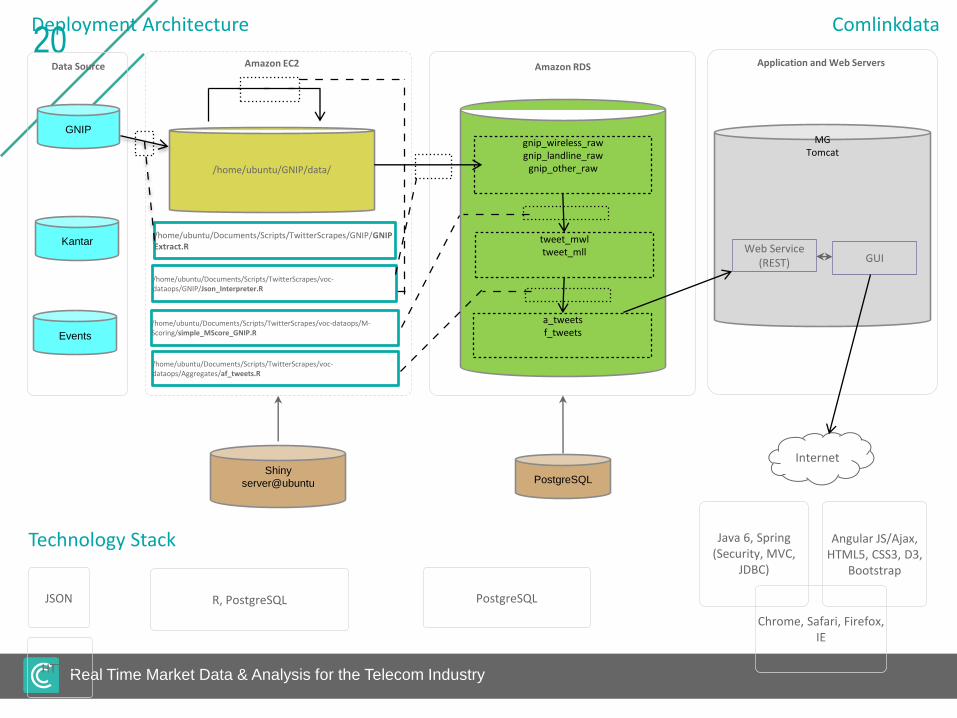
20Deployment Architecture Comlinkdata
Amazon RDSData Source
GNIP
Amazon EC2
Technology Stack
PostgreSQLR, PostgreSQL
Kantar
Events
PostgreSQL
/home/ubuntu/Documents/Scripts/TwitterScrapes/GNIP/GNIPExtract.R
/home/ubuntu/Documents/Scripts/TwitterScrapes/voc-dataops/GNIP/Json_Interpreter.R
/home/ubuntu/Documents/Scripts/TwitterScrapes/voc-dataops/M-Scoring/simple_MScore_GNIP.R
/home/ubuntu/Documents/Scripts/TwitterScrapes/voc-dataops/Aggregates/af_tweets.R
HTTPS
JSON
Chrome, Safari, Firefox, IE
Internet
Application and Web Servers
MGTomcat
Web Service (REST) GUI
Java 6, Spring (Security, MVC,
JDBC)
Angular JS/Ajax, HTML5, CSS3, D3,
Bootstrap
Shiny
server@ubuntu
gnip_wireless_rawgnip_landline_raw
gnip_other_raw
tweet_mwltweet_mll
a_tweetsf_tweets
/home/ubuntu/GNIP/data/
Real Time Market Data & Analysis for the Telecom Industry
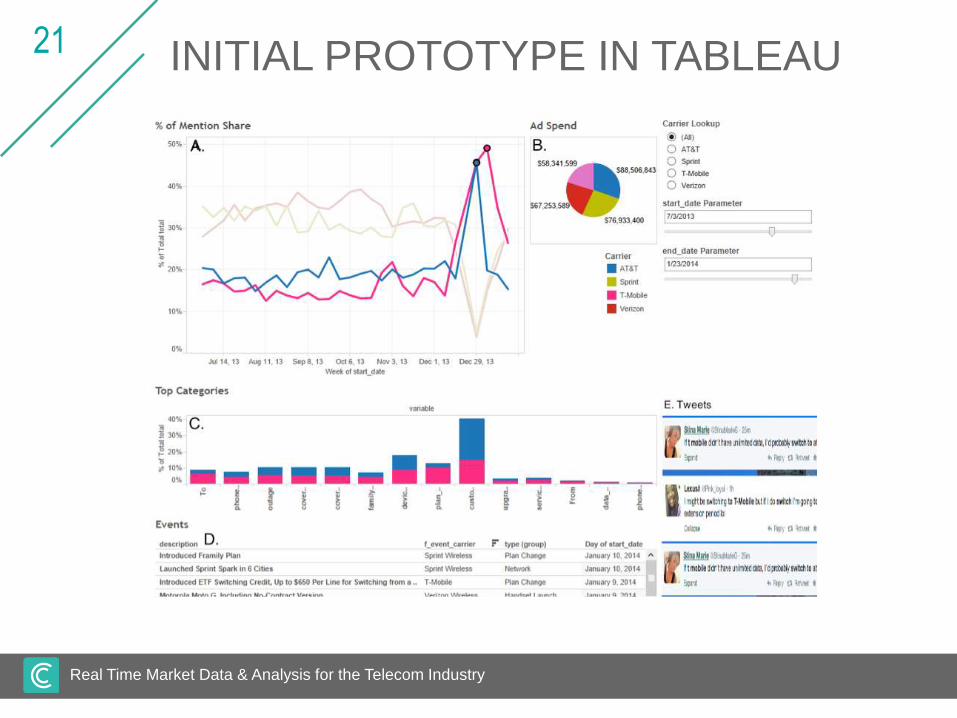
21 INITIAL PROTOTYPE IN TABLEAU
Real Time Market Data & Analysis for the Telecom Industry
22 WHAT WE LEARNED
• Always store raw unprocessed data
somewhere
• Beware of UTF encodings and special
characters
• Ensure time zones are synched across
databases / applications
• Don’t be afraid to cast a larger net of tweets
given the ~1M tweet/month limit provided by
most vendors
• Consider how to deal with blast tweets,
retweets. Source can be used to help
identify blasts (TweetCaster, Scoop.it, etc.)
Real Time Market Data & Analysis for the Telecom Industry
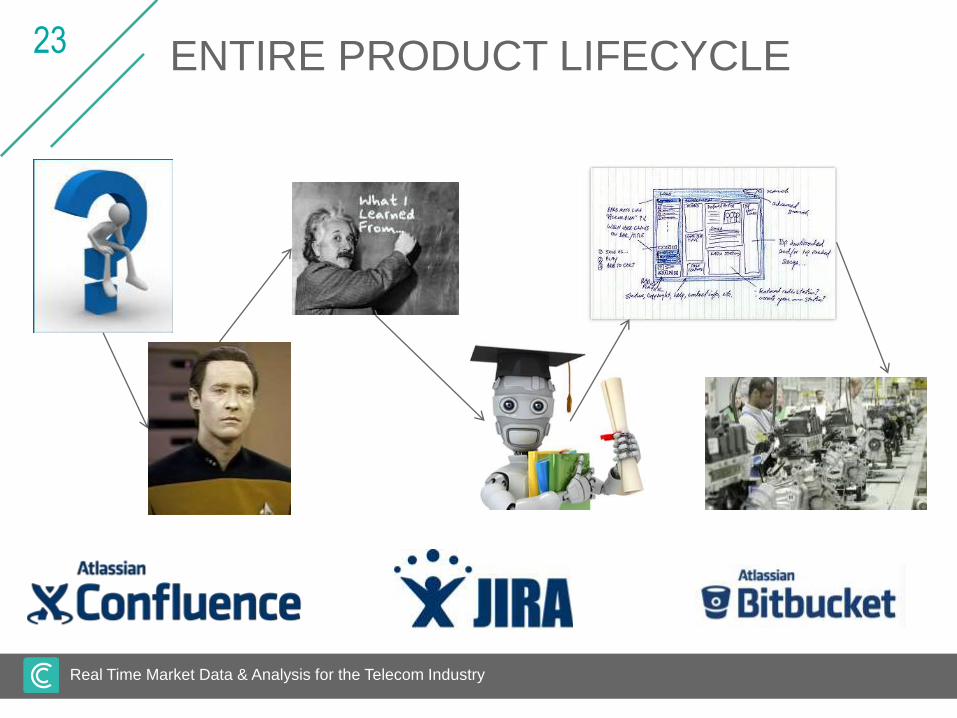
23 ENTIRE PRODUCT LIFECYCLE
Real Time Market Data & Analysis for the Telecom Industry
24 CONSIDERATIONS
Many variations of changing carriers:
• Bye Sprint!
• Getting rid of Verizon
• Peace out T-Mobile
• Going to AT&T
• Twitter data is not necessarily representative of the entire population
• Other languages
• Geo-tagged is only ~5%
• Expanding to Canada
Real Time Market Data & Analysis for the Telecom Industry
25 FUTURE WORK
• Migrate to DataSift from GNIP
• Improve M-scoring using more complex NLP algorithms
• Integrate additional data sources including downdetector.com, ad spend, and other
relevant sources
• Integrate additional Twitter data (mentions to carriers as well as tweets from the
carriers, various language around switching)
• Develop landline version and Canada version
• Trending words / Keyword search
• ???

Real Time Market Data & Analysis for the Telecom Industry
26 ACKNOWLEDGEMENTS
Jacob TobiasSoftware Developer
Sarah BoltMarketing
Manager
Dylan DoyleData Scientist
Mallorie EkstromGraphic Designer
Alan TamWeb Developer
Josh WalkerCOO
Ken YeohData Engineer
For more information, hiring, or
questions, email
Real Time Market Data & Analysis for the Telecom Industry
27 REFERENCES
• streamR - http://cran.r-project.org/web/packages/streamR/index.html
• sqldf - http://cran.r-project.org/web/packages/sqldf/index.html
• GNIP - http://gnip.com/
• DataSift - http://datasift.com/