Embed Size (px)
Citation preview

Ixia contracted Enterprise Management Associates (EMA), a market research firm in the technology space, to conduct professional, non-vendor biased research into the topic of network security practices and concerns. EMA recruited 242 qualified respondents employed as network and/or security professionals to survey during September 2016. The raw questions and responses are summarized here.
Enterprise Management Associates Network Security Findingsa survey conducted for Ixia
January 5, 2017
For an interpretation of these results, as they relate to network security architecture, visit: https://www.ixiacom.com/company/blog/network-security-survey-finds-areas-improvement-2017.
For more information about Ixia security solutions, visit: https://www.ixiacom.com/solutions/network-security.

EMA Network Security Survey Findings
Slide 2 © 2016 Enterprise Management Associates, Inc.
demo1: Which of the following best describes your role in the organization?
0%7%
10%5%
4%1%
10%3%
4%9%
31%16%
0%0%0%0%0%0%0%0%0%
0% 5% 10% 15% 20% 25% 30% 35%
IT-related Administrator/SpecialistIT-related Systems …
IT-related Software Engineer/DeveloperInfrastructure Engineer (network/systems)
IT-related Consultant/IntegratorIT-related Architect
IT/Security Operations StaffIT-related Business Analyst
IT-related Project/Program ManagerIT-related Manager/Supervisor (or equivalent)
IT/Security ManagerIT-related Director (or equivalent)
IT-related Vice President (or equivalent)CIO/CTO (IT Executive Management)
CISO/CSO/Chief Risk or Compliance OfficerCEO/COO/CFO (Business Executive …
Corporate/Line of Business Vice President …Corporate/Line of Business Director (or …
Corporate/Line of Business …Corporate/Line of Business Staff
Other
Column %
Sample Size = 242

EMA Network Security Survey Findings
Slide 3 © 2016 Enterprise Management Associates, Inc.
demo2: Which of the following best describes the department or functional area in which you work?
100%
0%
0% 20% 40% 60% 80% 100% 120%
IT/IS/Network
Other
Column %
Sample Size = 242

EMA Network Security Survey Findings
Slide 4 © 2016 Enterprise Management Associates, Inc.
demo3: You have indicated that your role and/or department is best described by IT/IS/Network. Within this area, which group do you belong to?
0%27%
0%0%0%0%
7%7%
41%2%2%
5%0%
7%0%
0% 5% 10% 15% 20% 25% 30% 35% 40% 45%
Applications DevelopmentIT Operations Planning/Design
IT Financial ManagementIT Architecture
Business AnalysisProject/Program Management
Operations - Network Operations Center …Operations - Data Center
SecurityService Desk, Service Support, Help Desk
Cross-Domain Service Delivery OrganizationCross-Domain Support Organization for IT
Executive IT ManagementNetwork Engineering/Planning
Other
Column %
Sample Size = 242
EMA Network Security Survey Findings
Slide 5 © 2016 Enterprise Management Associates, Inc.
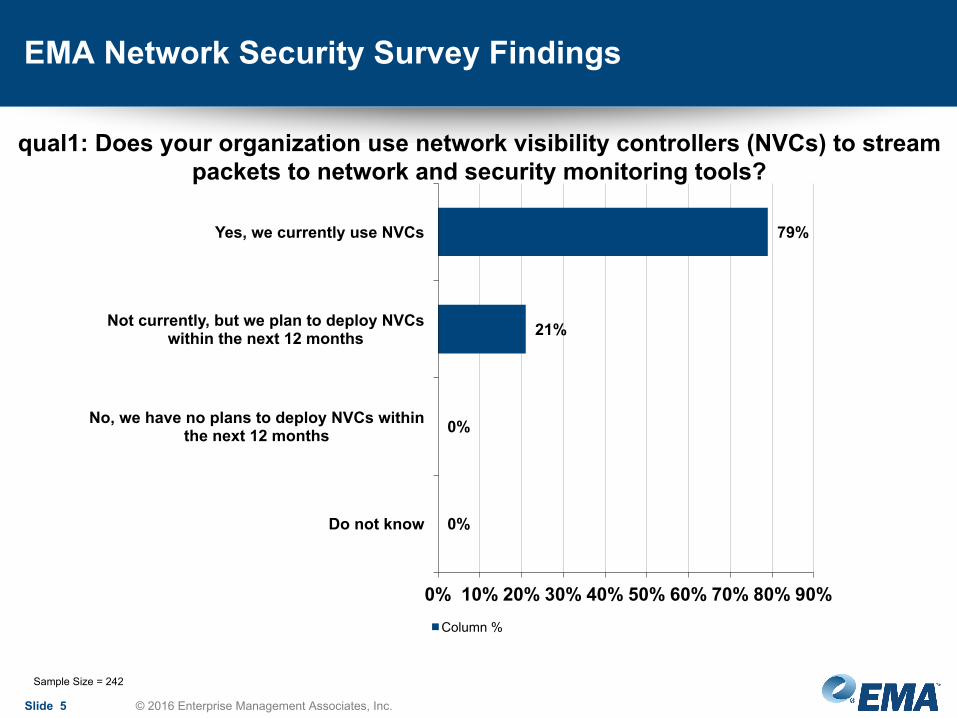
qual1: Does your organization use network visibility controllers (NVCs) to stream packets to network and security monitoring tools?
79%
21%
0%
0%
0% 10% 20% 30% 40% 50% 60% 70% 80% 90%
Yes, we currently use NVCs
Not currently, but we plan to deploy NVCs within the next 12 months
No, we have no plans to deploy NVCs within the next 12 months
Do not know
Column %
Sample Size = 242

EMA Network Security Survey Findings
Slide 6 © 2016 Enterprise Management Associates, Inc.
qual2mr: At which stages are you involved with your organization's use of network visibility controllers (NVCs)?
59%
43%
55%
57%
64%
0%
0% 10% 20% 30% 40% 50% 60% 70%
Research and evaluate NVCs
Procure NVCs
Plan/deploy NVCs and/or the packet-based tools connected to them
Manage and maintain NVCs
Use network and security monitoring tools connected to NVCs
None of the above
% Valid Cases (Mentions / Valid Cases)
Sample Size = 242, Valid Cases = 242, Total Mentions = 672

EMA Network Security Survey Findings
Slide 7 © 2016 Enterprise Management Associates, Inc.
demo4: How many employees are in your company worldwide?
0%
13%
23%
20%
12%
16%
6%
10%
0% 5% 10% 15% 20% 25%
Fewer than 250
250 - 499
500 - 999
1,000 - 2,499
2,500 - 4,999
5,000 - 9,999
10,000 - 19,999
20,000 or more
Column %
Sample Size = 242

EMA Network Security Survey Findings
Slide 8 © 2016 Enterprise Management Associates, Inc.
demo5: Which of the following best describes your company's primary industry?
2%3%
2%7%
9%2%
8%15%
0%14%
1%1%
2%7%
0%0%0%0%
7%2%
9%2%
1%2%2%
0% 2% 4% 6% 8% 10% 12% 14% 16%
Aerospace/DefenseConsulting - Computer or Networking Related
Consulting - All Other (Not Computer or …Education
Finance/Banking/InsuranceGovernment
Healthcare/Medical/PharmaceuticalHigh Technology - Software
High Technology - Reseller/VAR/Systems …High Technology -…
Hospitality/Entertainment/Recreation/TravelLegal
Manufacturing - Computer Hardware or …Manufacturing - All Other (Not Computer …
Marketing/Advertising/PR Agency/Market …Media/Publishing/Broadcasting
Non-Profit/Not for ProfitOil/Gas/Chemicals
Professional Services - Computer or …Professional Services - All Other (Not …
Retail/Wholesale/DistributionTelecommunications
Transportation/Airlines/Trucking/RailUtilities/Energy
Other
Column %
Sample Size = 242

EMA Network Security Survey Findings
Slide 9 © 2016 Enterprise Management Associates, Inc.
demo6: In which region is your corporate headquarters located?
100%
0%
0%
0%
0%
0% 20% 40% 60% 80% 100% 120%
North America
Central and South America (Latin America)
Europe-Middle East-Africa (EMEA)
Asia-Pacific (APAC)
Rest of World
Column %
Sample Size = 242

EMA Network Security Survey Findings
Slide 10 © 2016 Enterprise Management Associates, Inc.
demo7: In which region are you located?
96%
2%
1%
0%
0%
0% 20% 40% 60% 80% 100% 120%
North America
Central and South America (Latin America)
Europe-Middle East-Africa (EMEA)
Asia-Pacific (APAC)
Rest of World
Column %
Sample Size = 242
EMA Network Security Survey Findings
Slide 11 © 2016 Enterprise Management Associates, Inc.
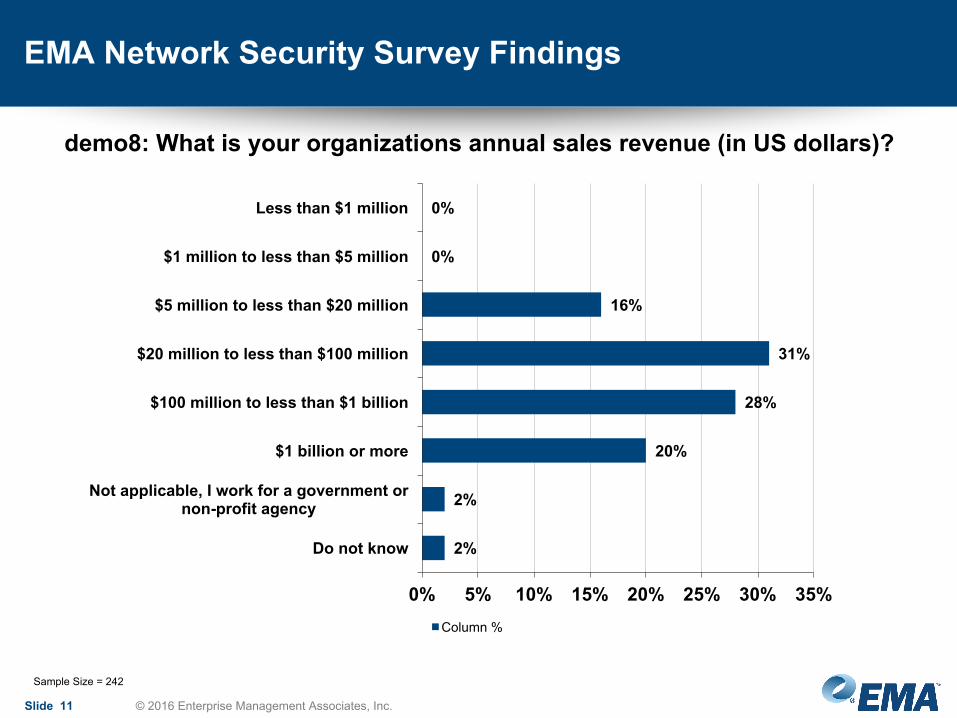
demo8: What is your organizations annual sales revenue (in US dollars)?
0%
0%
16%
31%
28%
20%
2%
2%
0% 5% 10% 15% 20% 25% 30% 35%
Less than $1 million
$1 million to less than $5 million
$5 million to less than $20 million
$20 million to less than $100 million
$100 million to less than $1 billion
$1 billion or more
Not applicable, I work for a government or non-profit agency
Do not know
Column %
Sample Size = 242

EMA Network Security Survey Findings
Slide 12 © 2016 Enterprise Management Associates, Inc.
demo9: What is your organizations annual IT budget (in US dollars)?
1%
11%
17%
25%
14%
15%
7%
7%
2%
0% 5% 10% 15% 20% 25% 30%
Less than $350,000
$350,000 to less than $1 million
$1 million to less than $5 million
$5 million to less than $10 million
$10 million to less than $25 million
$25 million to less than $50 million
$50 million to less than $100 million
$100 million or more
Do not know
Column %
Sample Size = 242

EMA Network Security Survey Findings
Slide 13 © 2016 Enterprise Management Associates, Inc.
demo10: What was the percent increase or decrease of your organization's annual IT budget from last year to this year?
2%
6%
14%
36%
24%
14%
1%
1%
0%
0%
0%
1%
0% 5% 10% 15% 20% 25% 30% 35% 40%
Increased more than 75%
Increased between 50% and 75%
Increased between 25% and 50%
Increased between 10% and 25%
Increased less than 10%
Stayed the same
Decreased less than 10%
Decreased between 10% and 25%
Decreased between 25% and 50%
Decreased between 50% and 75%
Decreased more than 75%
Do not know
Column %
Sample Size = 242

EMA Network Security Survey Findings
Slide 14 © 2016 Enterprise Management Associates, Inc.
inline1: Inline Monitoring Questions Which of the following best describes your current deployment of real-time inspection of live network traffic?
33%
40%
16%
8%
3%
0%
0% 5% 10% 15% 20% 25% 30% 35% 40% 45%
We deploy tools inline behind an external bypass switch
We deploy tools inline using the tool's internal bypass function
We deploy tools inline without a bypass
We are unsure or undecided about deploying tools inline
We have no plans to deploy tools inline
Do not know
Column %
Sample Size = 242

EMA Network Security Survey Findings
Slide 15 © 2016 Enterprise Management Associates, Inc.
inline2mr: You indicated that you have not yet deployed inline security monitoring tools. What has prevented you from deploying inline security monitoring tools?
15%
23%
23%
19%
12%
23%
23%
4%
27%
0%
0% 5% 10% 15% 20% 25% 30%
Inline tool failure could result in network outage
Overloaded tools could drop packets
Tools introduce latency
Too many false positives
Too expensive
Challenges of moving tools out of band
No cost-effective way to deploy tool with N+1 redundancy
Can't afford scheduled downtime for installation
Introduces too much network complexity
Other
% Valid Cases (Mentions / Valid Cases)
Sample Size = 26, Valid Cases = 26, Total Mentions = 44
EMA Network Security Survey Findings
Slide 16 © 2016 Enterprise Management Associates, Inc.
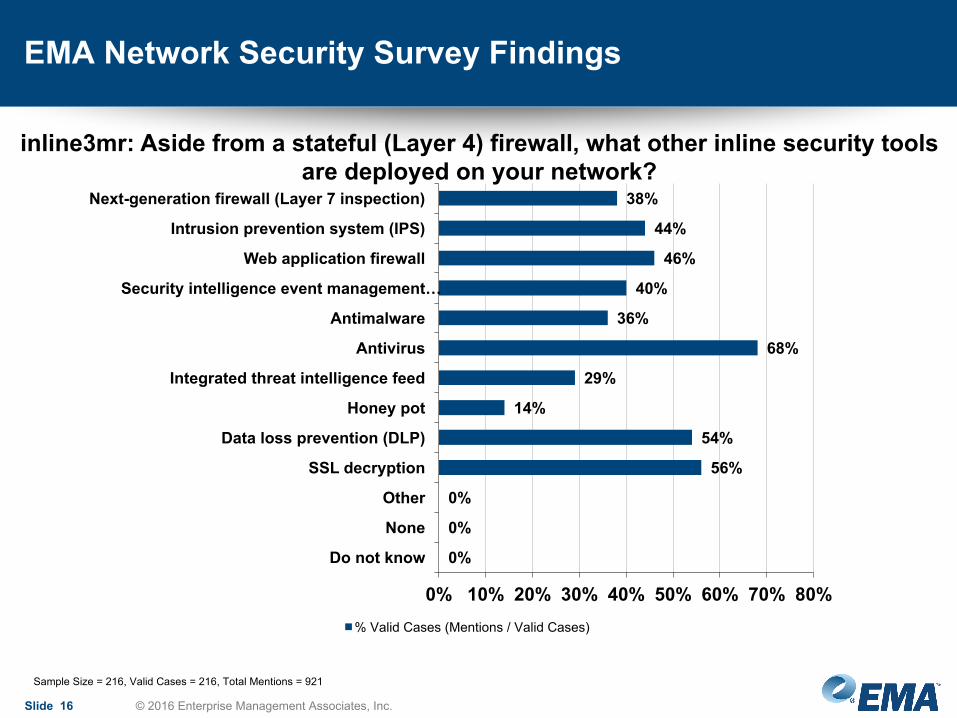
inline3mr: Aside from a stateful (Layer 4) firewall, what other inline security tools are deployed on your network?
38%
44%
46%
40%
36%
68%
29%
14%
54%
56%
0%
0%
0%
0% 10% 20% 30% 40% 50% 60% 70% 80%
Next-generation firewall (Layer 7 inspection)
Intrusion prevention system (IPS)
Web application firewall
Security intelligence event management …
Antimalware
Antivirus
Integrated threat intelligence feed
Honey pot
Data loss prevention (DLP)
SSL decryption
Other
None
Do not know
% Valid Cases (Mentions / Valid Cases)
Sample Size = 216, Valid Cases = 216, Total Mentions = 921

EMA Network Security Survey Findings
Slide 17 © 2016 Enterprise Management Associates, Inc.
inline4: Approximately how many of your inline security monitoring tools are connected to a network visibility controller (NVC)?
3%
5%
12%
15%
9%
16%
11%
8%
10%
3%
4%
3%
0% 2% 4% 6% 8% 10% 12% 14% 16% 18%
Less than 10%
10% to 19%
20% to 29%
30% to 39%
40% to 49%
50% to 59%
60% to 69%
70% to 79%
80% to 89%
90% to 99%
1
Do not know
Column %
Sample Size = 242

EMA Network Security Survey Findings
Slide 18 © 2016 Enterprise Management Associates, Inc.
outband1mr: Out-of-Band Monitoring Questions Which kinds of out-of-band tools (i.e., connected to TAPs, SPANs, and NVCs) are most important to you?
31%
47%
55%
20%
50%
29%
20%
14%
0%
0%
0% 10% 20% 30% 40% 50% 60%
Troubleshooting/packet analyzers (e.g., packet "sniffers" or other analyzers)
Intrusion detection/prevention
Data loss prevention
Application performance monitor
Network performance monitor
Data/packet recorder
Compliance monitor
VoIP/unified communications/video analyzers
Other
Do not know
% Valid Cases (Mentions / Valid Cases)
Sample Size = 242, Valid Cases = 242, Total Mentions = 646
EMA Network Security Survey Findings
Slide 19 © 2016 Enterprise Management Associates, Inc.
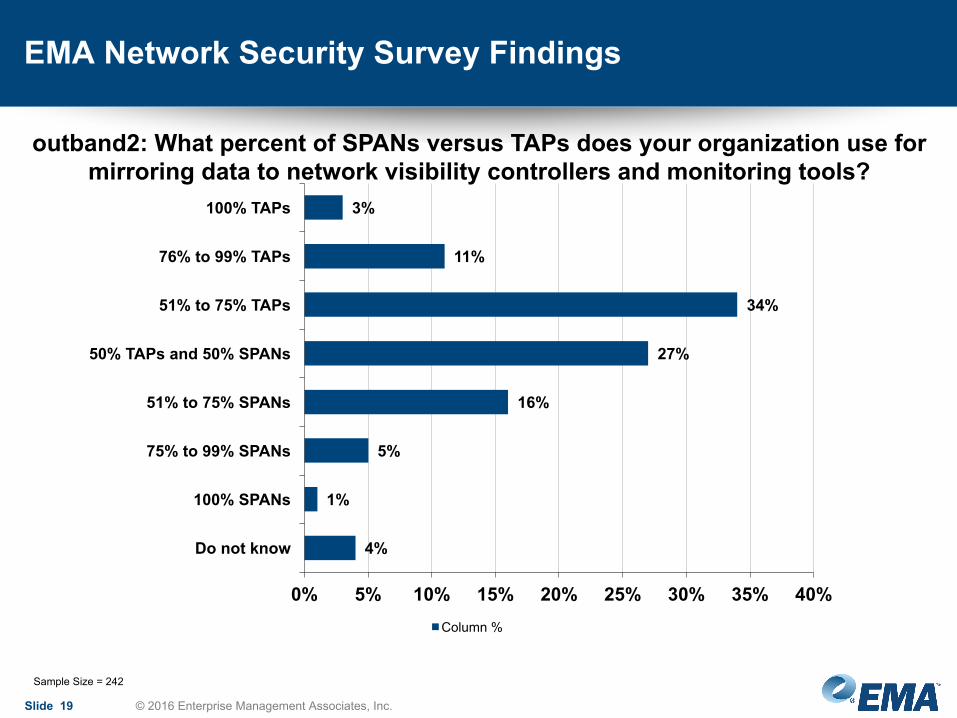
outband2: What percent of SPANs versus TAPs does your organization use for mirroring data to network visibility controllers and monitoring tools?
3%
11%
34%
27%
16%
5%
1%
4%
0% 5% 10% 15% 20% 25% 30% 35% 40%
100% TAPs
76% to 99% TAPs
51% to 75% TAPs
50% TAPs and 50% SPANs
51% to 75% SPANs
75% to 99% SPANs
100% SPANs
Do not know
Column %
Sample Size = 242

EMA Network Security Survey Findings
Slide 20 © 2016 Enterprise Management Associates, Inc.
outband3: What percentage of segments on your network are currently monitored by network and security monitoring tools?2%
12%
31%
23%
19%
10%
2%
0% 5% 10% 15% 20% 25% 30% 35%
1% to 20%
21% to 40%
41% to 60%
61% to 80%
81% to 99%
1
Do not know
Column %
Sample Size = 242

EMA Network Security Survey Findings
Slide 21 © 2016 Enterprise Management Associates, Inc.
outband3mr: Why doesn't your organization monitor 100% of its network segments?
35%
26%
13%
23%
24%
40%
2%
0% 5% 10% 15% 20% 25% 30% 35% 40% 45%
Shortage of SPANs and TAPs
Not enough monitoring tools
Can't afford additional tools
Staff can't keep up
Tools don't provide the right capabilities
Current coverage is sufficient
Other
% Valid Cases (Mentions / Valid Cases)
Sample Size = 211, Valid Cases = 211, Total Mentions = 345

EMA Network Security Survey Findings
Slide 22 © 2016 Enterprise Management Associates, Inc.
outband4: How would you characterize the success of your organization's use of command-line interface (CLI) for configuring and administering traffic filters in
your network visibility controllers?23%
50%
23%
3%
0%
0%
0% 10% 20% 30% 40% 50% 60%
No problems. We've got it under control.
Not bad. We get by pretty well with the occasional hiccup.
Somewhat difficult. We have a couple of experts on staff but it's a struggle.
Much too difficult. Our staff can't do it.
We don't use CLI.
Other
Column %
Sample Size = 242

EMA Network Security Survey Findings
Slide 23 © 2016 Enterprise Management Associates, Inc.
outband5: Which of the following best describes the CPU utilization for all of your organization's packet-based security and monitoring tools (when considered as a
whole)?6%
26%
38%
21%
6%
0%
2%
0% 5% 10% 15% 20% 25% 30% 35% 40%
Less than 25% of capacity used
25% to 50% of capacity used
51% to 75% of capacity used
76% to 99% of capacity used
100% of capacity used
Capacity is overloaded
Do not know
Column %
Sample Size = 242

EMA Network Security Survey Findings
Slide 24 © 2016 Enterprise Management Associates, Inc.
outband7: Which of the following best describes your organization's approach to monitoring 40 Gbps links?
31%
26%
28%
10%
5%
1%
0% 5% 10% 15% 20% 25% 30% 35%
Our tools fully support 40 Gbps line rate monitoring.
We monitor 40 Gbps traffic directly with 10 Gbps tools despite the risk of overload.
We load balance or filter 40 Gbps traffic flows so that we can monitor them sufficiently with
10 Gbps tools.
We do not monitor 40 Gbps links because we lack 40 Gbps tools.
Not applicable - we don't have 40 Gbps links on our network.
Do not know
Column %
Sample Size = 242

EMA Network Security Survey Findings
Slide 25 © 2016 Enterprise Management Associates, Inc.
outband8: How many times per month do you change the location from which you mirror network traffic to your packet-based monitoring tools?
14%
8%
24%
19%
21%
6%
3%
4%
0% 5% 10% 15% 20% 25% 30%
Never
1
2
3
4 - 5
6 - 10
More than 10
Do not know
Column %
Sample Size = 242

EMA Network Security Survey Findings
Slide 26 © 2016 Enterprise Management Associates, Inc.
outband11: How important is it that your packet-based monitoring tools receive all the packets they need?
78%
22%
0%
0% 10% 20% 30% 40% 50% 60% 70% 80% 90%
Very important
Somewhat important
Not important
Column %
Sample Size = 242

EMA Network Security Survey Findings
Slide 27 © 2016 Enterprise Management Associates, Inc.
outband12: How confident are you that your out-of-band packet-based monitoring tools receive all the data they need for adequate visibility into your network?
22%
48%
26%
2%
1%
0%
0%
0% 10% 20% 30% 40% 50% 60%
Extremely confident
Confident
Somewhat confident
Neither confident nor unconfident
Somewhat unconfident
Unconfident
Extremely unconfident
Column %
Sample Size = 242

EMA Network Security Survey Findings
Slide 28 © 2016 Enterprise Management Associates, Inc.
outband13mr: What are the most important benefits that your organization has experienced through its use of network visibility controllers?
17%
16%
21%
15%
47%
27%
22%
40%
13%
22%
19%
0%
0% 10% 20% 30% 40% 50%
Mean time to problem diagnosis reduced
Mean time to problem resolution reduced
Useful life of tools extended
New service delivery accelerated
IT productivity improved
High availability achieved
Collaboration within IT improved
Security incidents and breaches reduced
Service level agreement (SLA) performance …
Customer satisfaction improved
Network upgrades/expansions …
Other
% Valid Cases (Mentions / Valid Cases)
Sample Size = 242, Valid Cases = 242, Total Mentions = 629

EMA Network Security Survey Findings
Slide 29 © 2016 Enterprise Management Associates, Inc.
outband14c1: In the average work week, what percent of your time is spent on the following tasks? / Researching and responding to security incidents
4%
12%
22%
36%
23%
3%
0% 5% 10% 15% 20% 25% 30% 35% 40%
1
75% to 99%
50% to 74%
25% to 49%
1% to 24%
0% (not my role)
Column %
Sample Size = 242

EMA Network Security Survey Findings
Slide 30 © 2016 Enterprise Management Associates, Inc.
outband14c2: In the average work week, what percent of your time is spent on the following tasks? / Responding to network/application performance problems
3%
12%
26%
32%
25%
2%
0% 5% 10% 15% 20% 25% 30% 35%
1
75% to 99%
50% to 74%
25% to 49%
1% to 24%
0% (not my role)
Column %
Sample Size = 242

EMA Network Security Survey Findings
Slide 31 © 2016 Enterprise Management Associates, Inc.
outband14c3: In the average work week, what percent of your time is spent on the following tasks? / Configuring monitoring tools
6%
13%
20%
28%
27%
6%
0% 5% 10% 15% 20% 25% 30%
1
75% to 99%
50% to 74%
25% to 49%
1% to 24%
0% (not my role)
Column %
Sample Size = 242

EMA Network Security Survey Findings
Slide 32 © 2016 Enterprise Management Associates, Inc.
outband15mr: Which packet manipulation features on a network visibility controller are the most important to your organization?
19%21%
29%33%
22%11%
17%11%11%
7%16%
17%25%
17%11%
0% 5% 10% 15% 20% 25% 30% 35%
Load balancing across multiple toolsMedia conversion (e.g., 40 Gbps to 10 Gbps)
Data filteringSSL decryption
Data maskingDeduplication
Time stampingTunneling
Port taggingHeader stripping (de-encapsulation)
Packet slicingUltra-low latency
High availability through full synchronizationDeep packet inspection
User-defined filtering
% Valid Cases (Mentions / Valid Cases)
Sample Size = 242, Valid Cases = 242, Total Mentions = 644