Embed Size (px)
DESCRIPTION
VMware vCAC, VCOPS, vRealize
Citation preview
Gain Insights, Make Decisions and Take Action Across a Streamlined and Automated Infrastructure
David BrillArraya Solutions
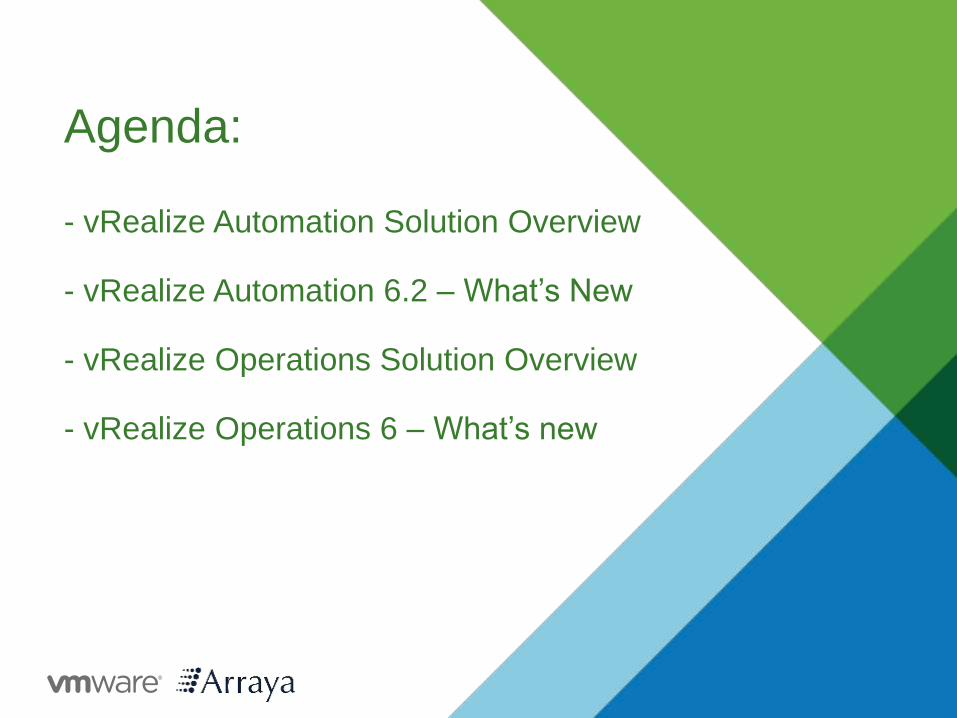
Agenda:
- vRealize Automation Solution Overview
- vRealize Automation 6.2 – What’s New
- vRealize Operations Solution Overview
- vRealize Operations 6 – What’s new
© 2014 VMware Inc. All rights reserved.
vRealize AutomationSolution Overview
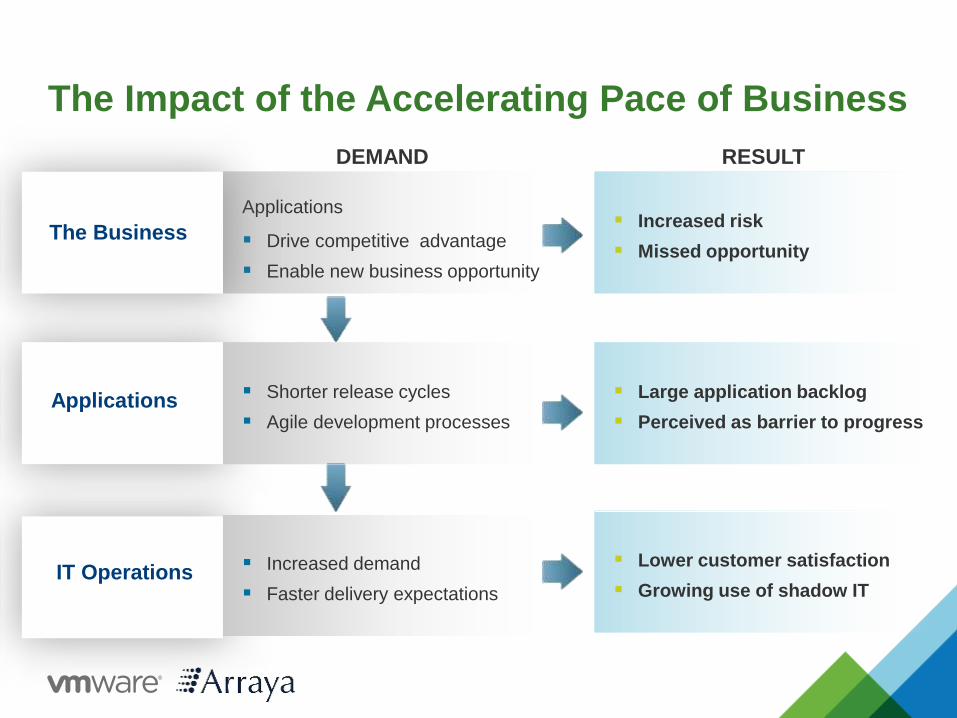
The Impact of the Accelerating Pace of Business
Applications
Drive competitive advantage
Enable new business opportunity
Applications
IT Operations
Shorter release cycles
Agile development processes
DEMAND
Increased demand
Faster delivery expectations
The Business
RESULT
Lower customer satisfaction
Growing use of shadow IT
Large application backlog
Perceived as barrier to progress
Increased risk
Missed opportunity
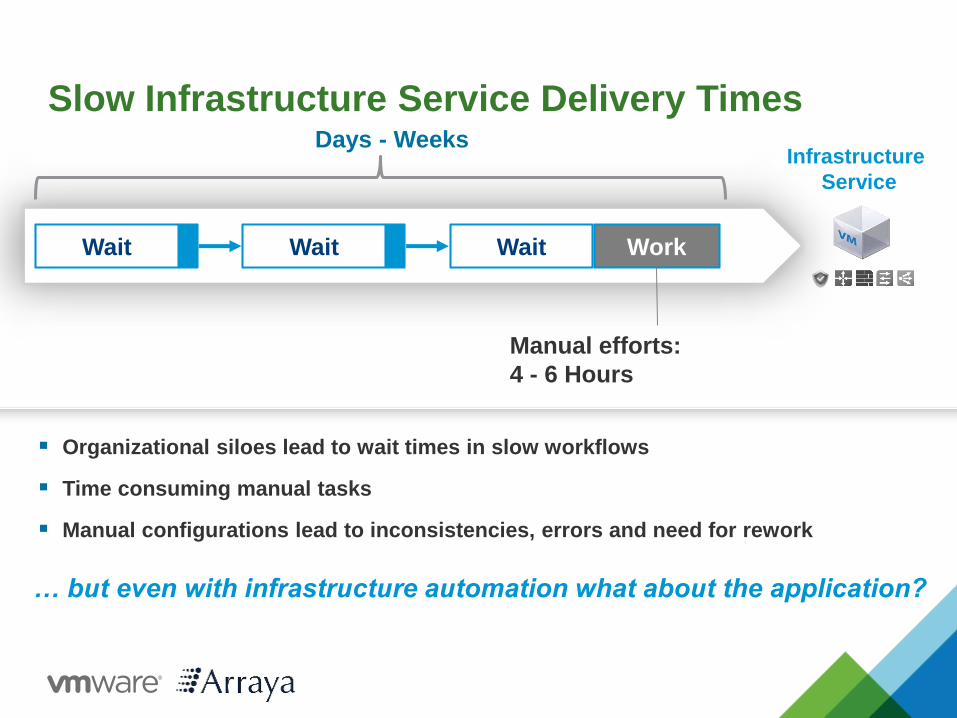
Slow Infrastructure Service Delivery Times
… but even with infrastructure automation what about the application?
Days - Weeks
Wait WorkWaitWait
Manual efforts:
4 - 6 Hours
Infrastructure
Service
Organizational siloes lead to wait times in slow workflows
Time consuming manual tasks
Manual configurations lead to inconsistencies, errors and need for rework
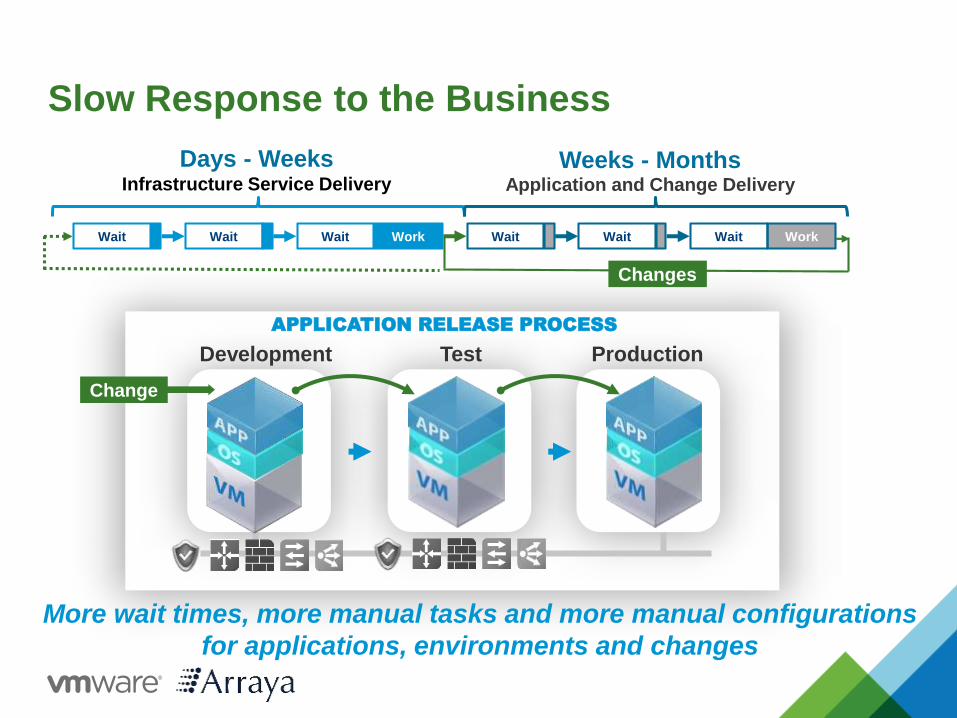
Test Production
Slow Response to the Business
Infrastructure Service Delivery
Days - Weeks
Wait WorkWaitWait
Change
Application and Change Delivery
Weeks - Months
Wait WorkWaitWait
Development
APPLICATION RELEASE PROCESS
More wait times, more manual tasks and more manual configurations
for applications, environments and changes
Changes
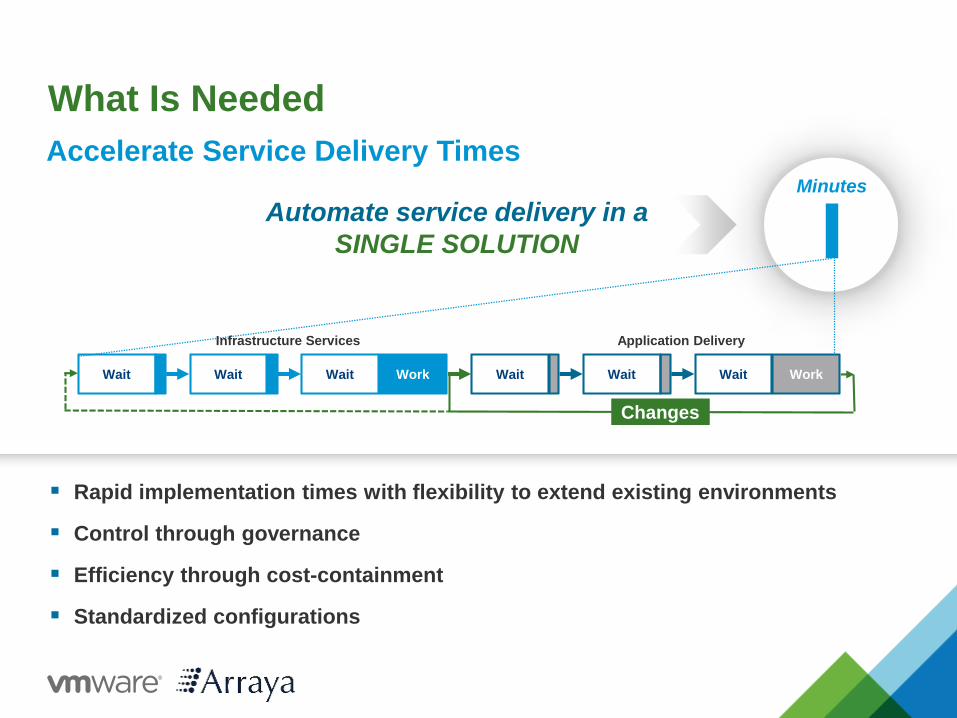
Automate service delivery in a
SINGLE SOLUTION
Rapid implementation times with flexibility to extend existing environments
Control through governance
Efficiency through cost-containment
Standardized configurations
Wait WorkWaitWaitWait WorkWaitWait
Minutes
Infrastructure Services Application Delivery
Accelerate Service Delivery Times
Changes
What Is Needed
VMware IT: vRealizeAutomation Case Study
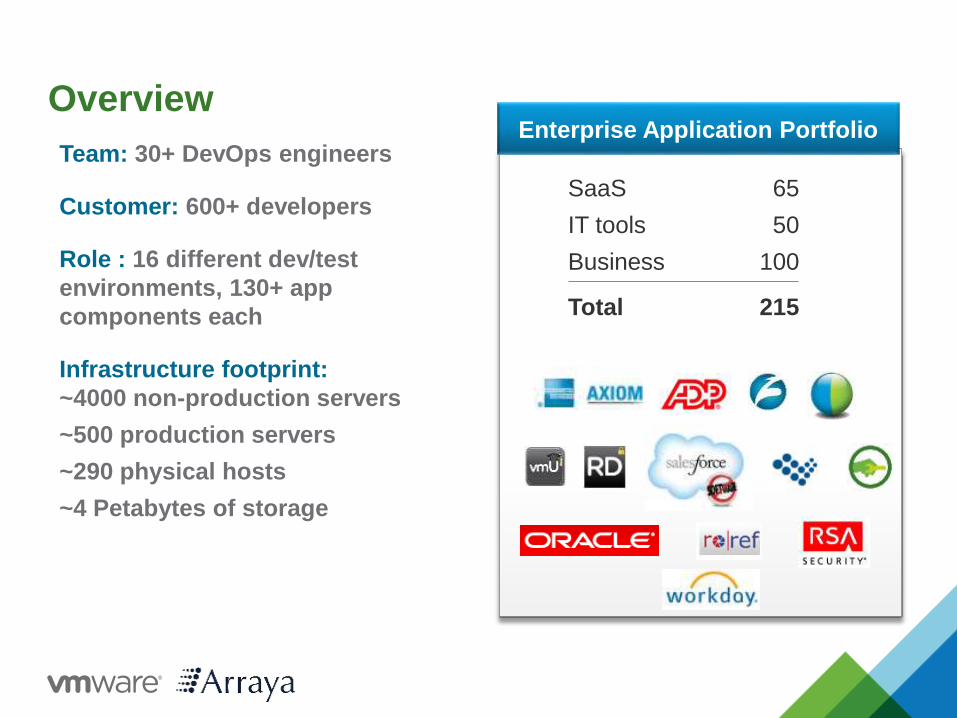
Overview
Team: 30+ DevOps engineers
Customer: 600+ developers
Role : 16 different dev/test
environments, 130+ app
components each
Infrastructure footprint:
~4000 non-production servers
~500 production servers
~290 physical hosts
~4 Petabytes of storage
Enterprise Application Portfolio
SaaS 65
IT tools 50
Business 100
Total 215
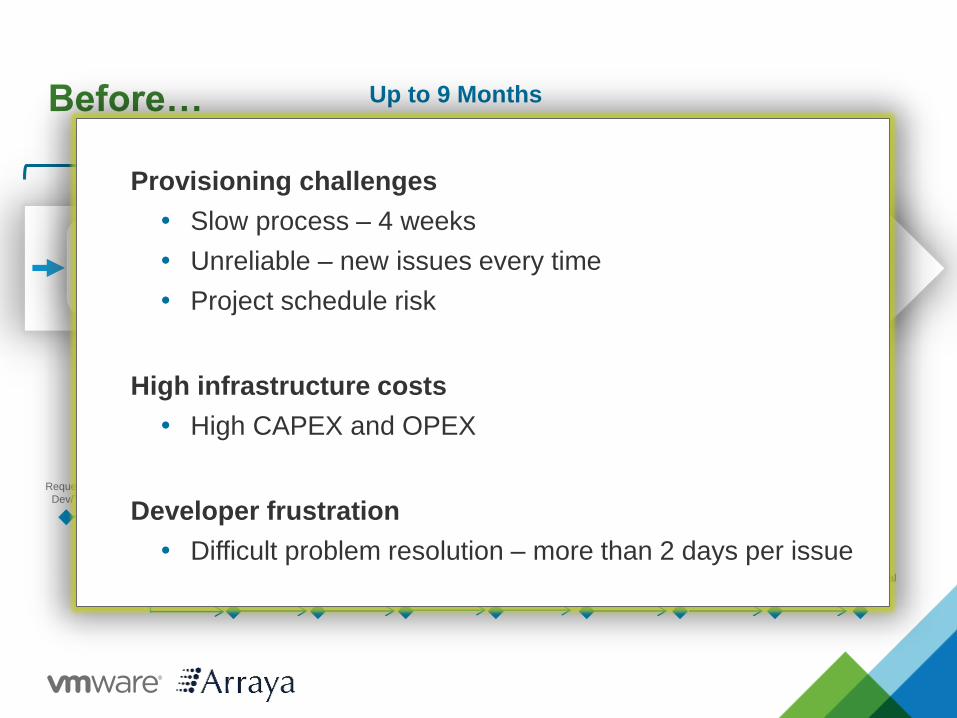
Before…
20 Steps of 3 - 5 Weeks for Each Environment
Request for
Dev/Test
Infrastructure
Verification
Hardware
Setup
Build VMs –
new or clone
DNS
Entries
Install,
Setup,
Configure
Workload
Database
Refresh
Latest Code
Deployment
Load
Balancer
Entries
Web Server
Configuration
Firewall
Changes
External
Interface &
Integration
PPM
Tasks
Workload
Monitoring
Setup
Security – VM
access control
Functional
Testing
Environmental
Testing
Enterprise Application Development Project
Up to 9 Months
UAT Stage Load Test ProductionDev Test
Provisioning challenges
• Slow process – 4 weeks
• Unreliable – new issues every time
• Project schedule risk
High infrastructure costs
• High CAPEX and OPEX
Developer frustration
• Difficult problem resolution – more than 2 days per issue
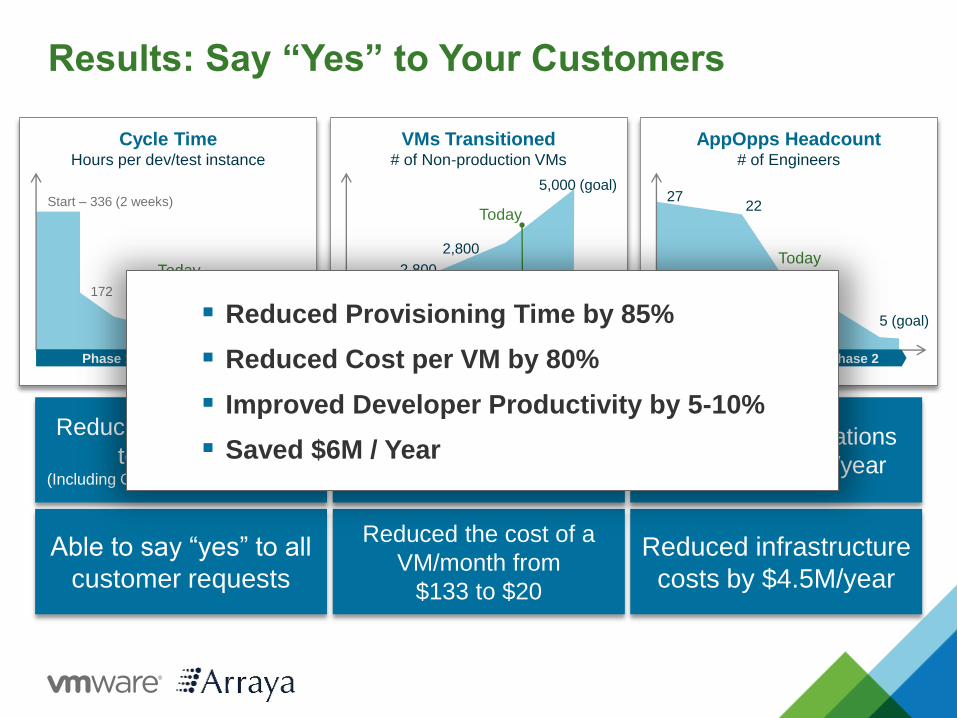
Results: Say “Yes” to Your Customers
Phase 1 Phase 2
Cycle TimeHours per dev/test instance
Start – 336 (2 weeks)
172
36
24 (goal)
Today
Phase 1 Phase 2
VMs Transitioned# of Non-production VMs
Today
Phase 1 Phase 2
AppOpps Headcount# of Engineers
Today
5,000 (goal)
2,800
2,800
5 (goal)
2722
Reduced provision time
to 17 hours.(Including QA Testing etc. is 36 hours)
Improved productivity of
600 developers by 5-10%
Reduced IT operations
costs by $1.5M /year
Able to say “yes” to all
customer requests
Reduced the cost of a
VM/month from
$133 to $20
Reduced infrastructure
costs by $4.5M/year
Reduced Provisioning Time by 85%
Reduced Cost per VM by 80%
Improved Developer Productivity by 5-10%
Saved $6M / Year
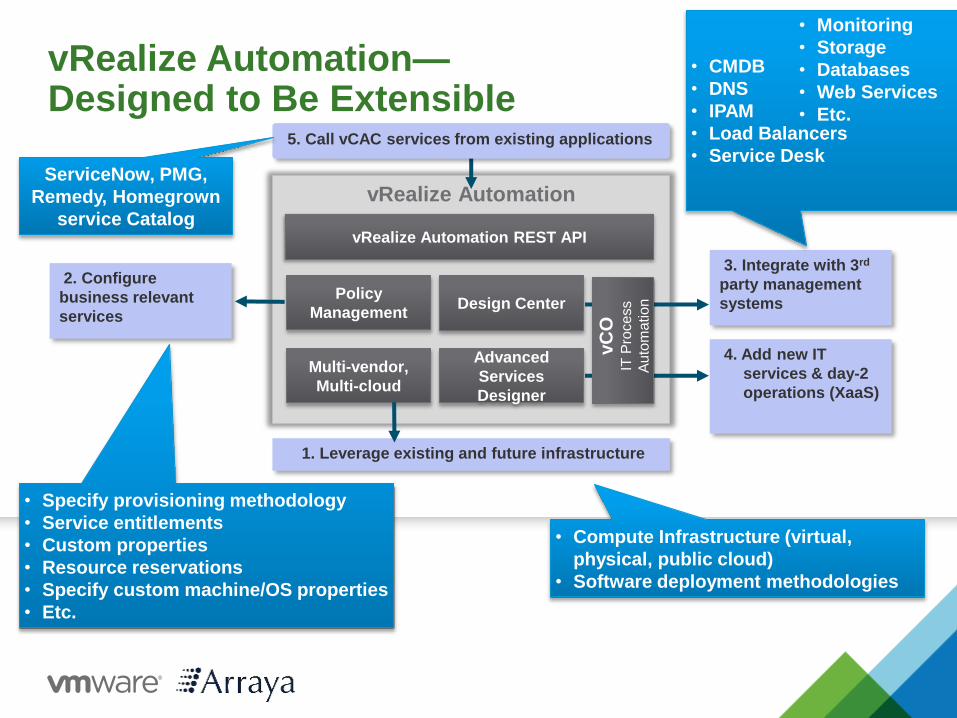
vRealize Automation
4. Add new IT
services & day-2
operations (XaaS)
Advanced
Services
Designer
vRealize Automation REST API
5. Call vCAC services from existing applications
3. Integrate with 3rd
party management
systemsDesign Center
vC
OIT
Pro
cess
Au
tom
ation
1. Leverage existing and future infrastructure
Multi-vendor,
Multi-cloud
Policy
Management
2. Configure
business relevant
services
vRealize Automation—Designed to Be Extensible
ServiceNow, PMG,
Remedy, Homegrown
service Catalog
• Specify provisioning methodology
• Service entitlements
• Custom properties
• Resource reservations
• Specify custom machine/OS properties
• Etc.
• Compute Infrastructure (virtual,
physical, public cloud)
• Software deployment methodologies
• CMDB
• DNS
• IPAM
• Load Balancers
• Service Desk
• Monitoring
• Storage
• Databases
• Web Services
• Etc.
What’s New in vRealize Automation 6.2
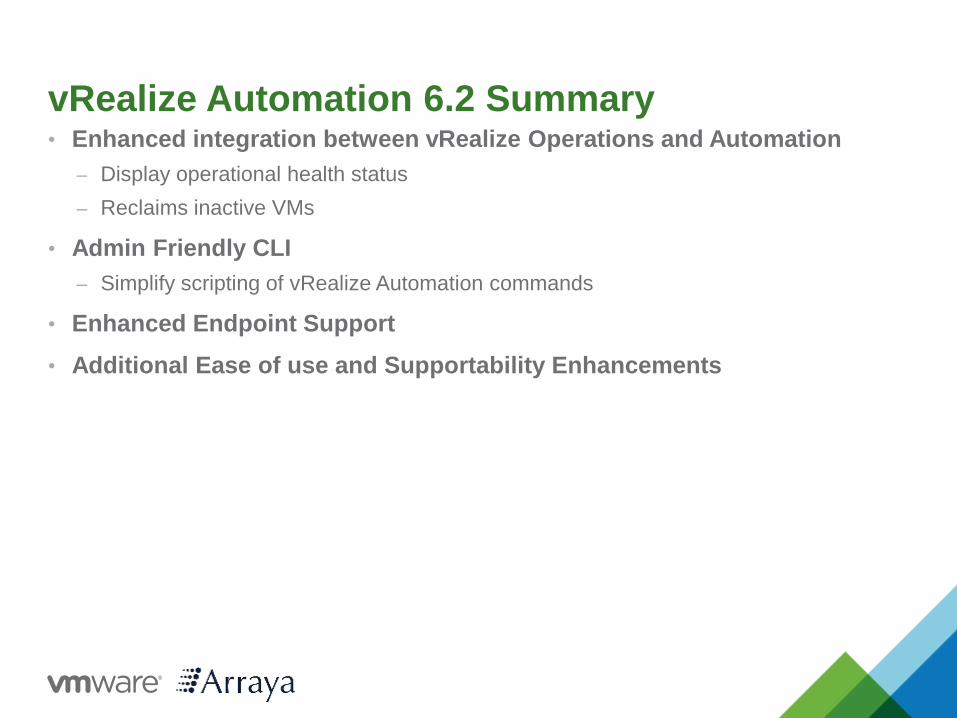
vRealize Automation 6.2 Summary• Enhanced integration between vRealize Operations and Automation
– Display operational health status
– Reclaims inactive VMs
• Admin Friendly CLI
– Simplify scripting of vRealize Automation commands
• Enhanced Endpoint Support
• Additional Ease of use and Supportability Enhancements
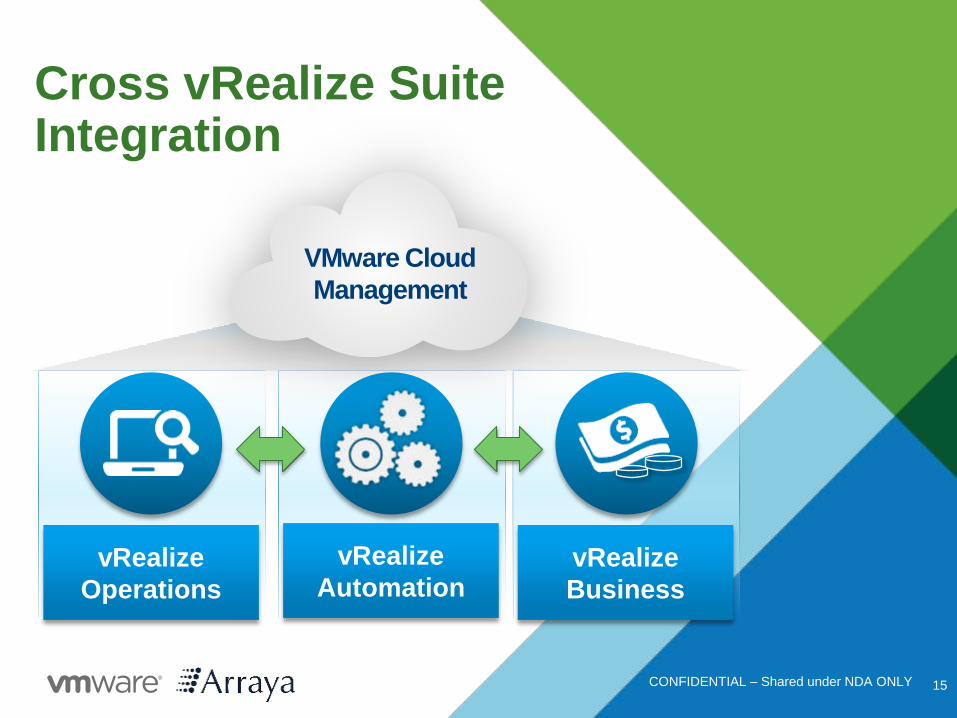
Cross vRealize Suite Integration
CONFIDENTIAL – Shared under NDA ONLY 15
vRealize
AutomationvRealize
Business
vRealize
Operations
VMware Cloud
Management
CONFIDENTIAL – Shared under NDA ONLY 16
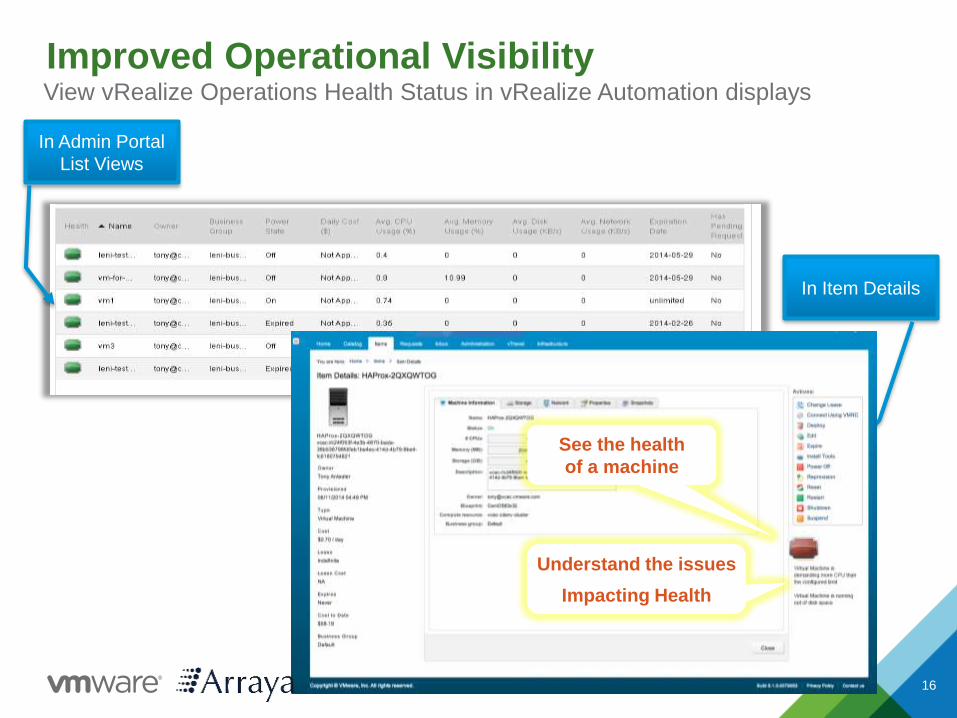
Improved Operational VisibilityView vRealize Operations Health Status in vRealize Automation displays
In Admin Portal
List Views
In Item Details
Understand the issues
Impacting Health
See the health
of a machine
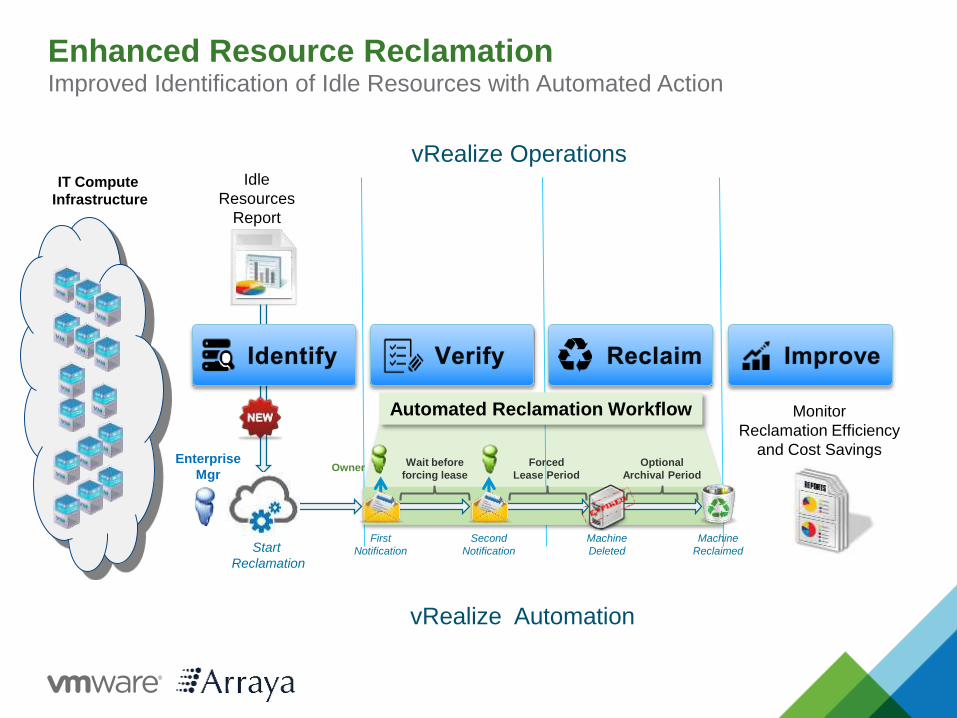
Enhanced Resource ReclamationImproved Identification of Idle Resources with Automated Action
IT Compute
Infrastructure
vRealize Operations
vRealize Automation
Idle
Resources
Report
Automated Reclamation Workflow Monitor
Reclamation Efficiency
and Cost SavingsEnterprise
MgrOwner
Wait before
forcing lease
Forced
Lease Period
Optional
Archival Period
First
Notification
Second
Notification
Machine
Deleted
Machine
ReclaimedStart
Reclamation
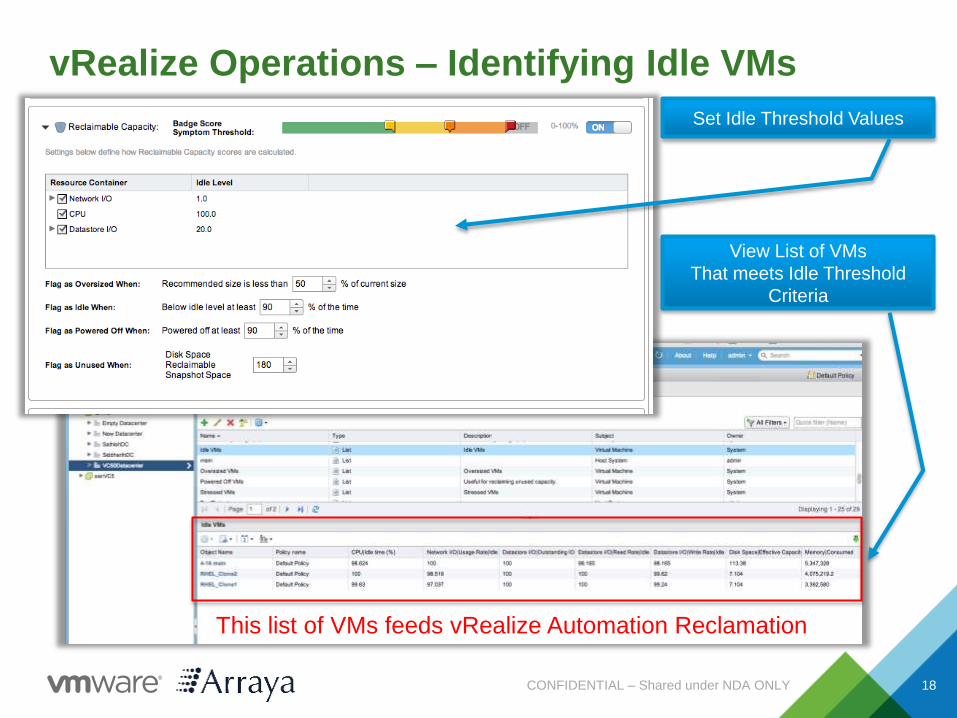
vRealize Operations – Identifying Idle VMs
CONFIDENTIAL – Shared under NDA ONLY 18
Set Idle Threshold Values
View List of VMs
That meets Idle Threshold
Criteria
This list of VMs feeds vRealize Automation Reclamation
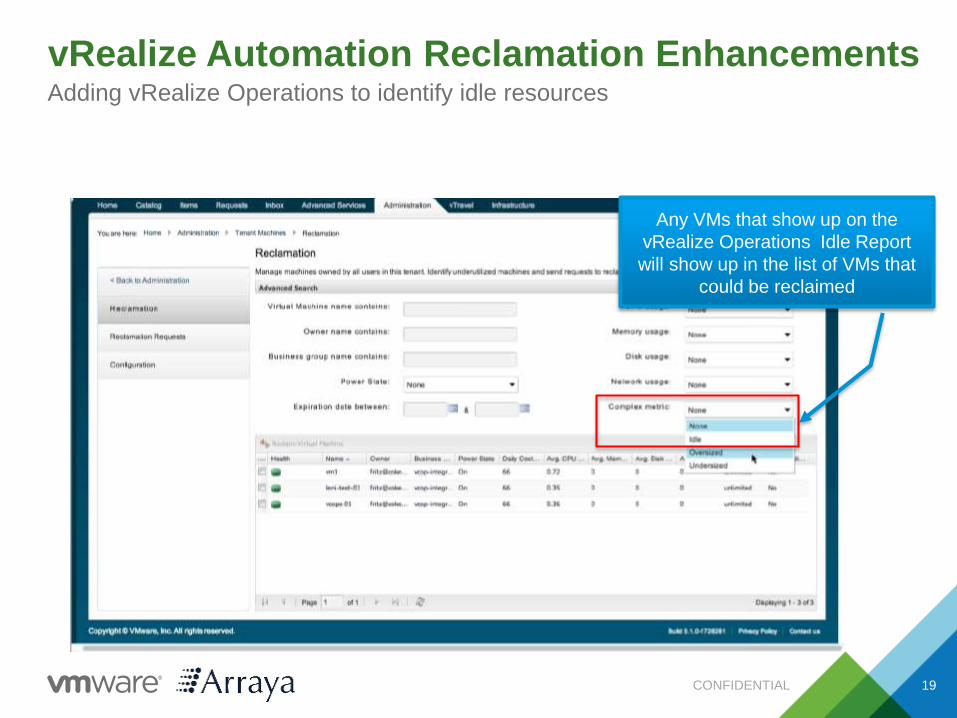
vRealize Automation Reclamation Enhancements
CONFIDENTIAL 19
Adding vRealize Operations to identify idle resources
Any VMs that show up on the
vRealize Operations Idle Report
will show up in the list of VMs that
could be reclaimed
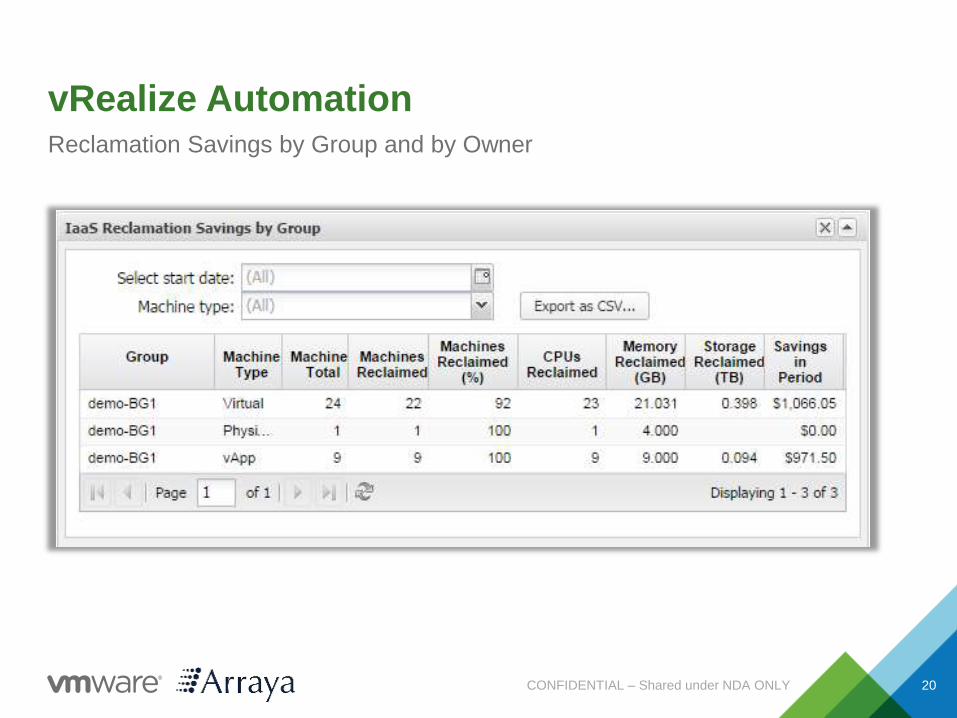
vRealize Automation
CONFIDENTIAL – Shared under NDA ONLY 20
Reclamation Savings by Group and by Owner
CloudClient Overview
• Command-line utility that provides verb-based access with a unified interface across the vRealize Automation APIs (including: Common Services, IaaS, Applications, vRealize Orchestrator)
• Focused on providing an easy-to-use command-line interface for the IT administrator where scripting and CLI use is more feasible than direct API calls
• Stable interface while underlying APIs may change over time
• Provides common security; exception handling; JSON, CSV and tabular formatting; file export; auto login for scripting (password and keyfiles); and auto-generated documentation.
• Available as a separate download in early Q4 (supports 6.1)
CONFIDENTIAL 21
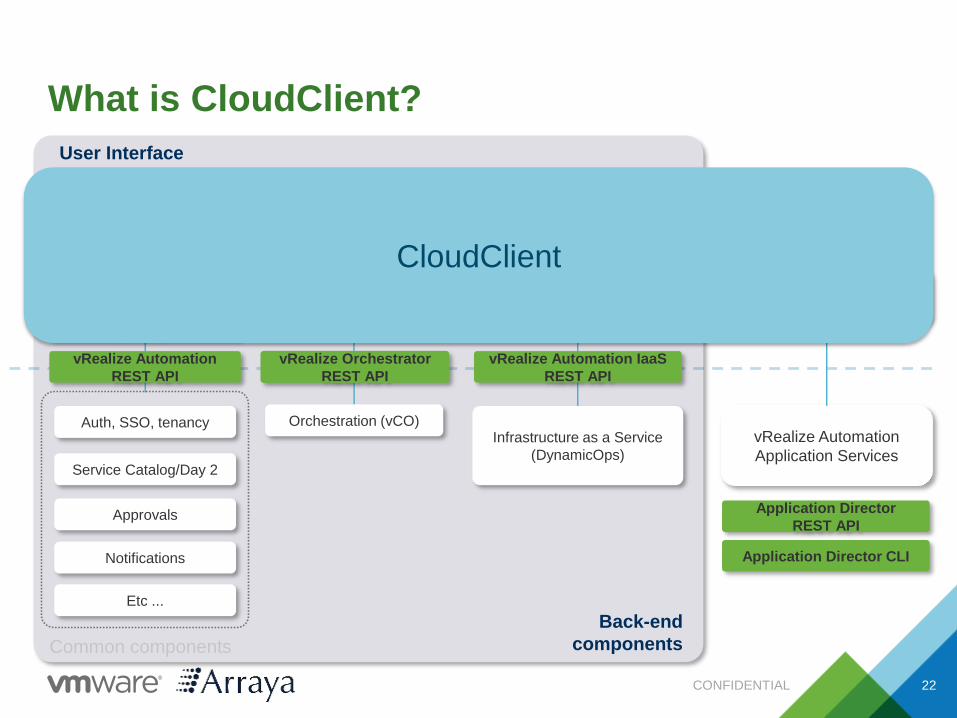
What is CloudClient?
CONFIDENTIAL 22
Self-Service Catalog
User Interface
Common Services
AdministrationHome Page
Advanced Services
Designer (XaaS)IaaS Design and
Administration (IaaS)
Service Catalog/Day 2
Approvals
Orchestration (vCO)
Etc ...
Back-end
components
Application Design and
Administration (PaaS)
Notifications
Infrastructure as a Service
(DynamicOps)
vRealize Automation
Application Services
Common components
Application Director
REST API
vRealize Automation
REST API
vRealize Automation IaaS
REST API
vRealize Automation
Java SDK
Auth, SSO, tenancy
Application Director CLI
vRealize Orchestrator
REST API
vRealize Automation
API Explorer (CLI)
CloudClient
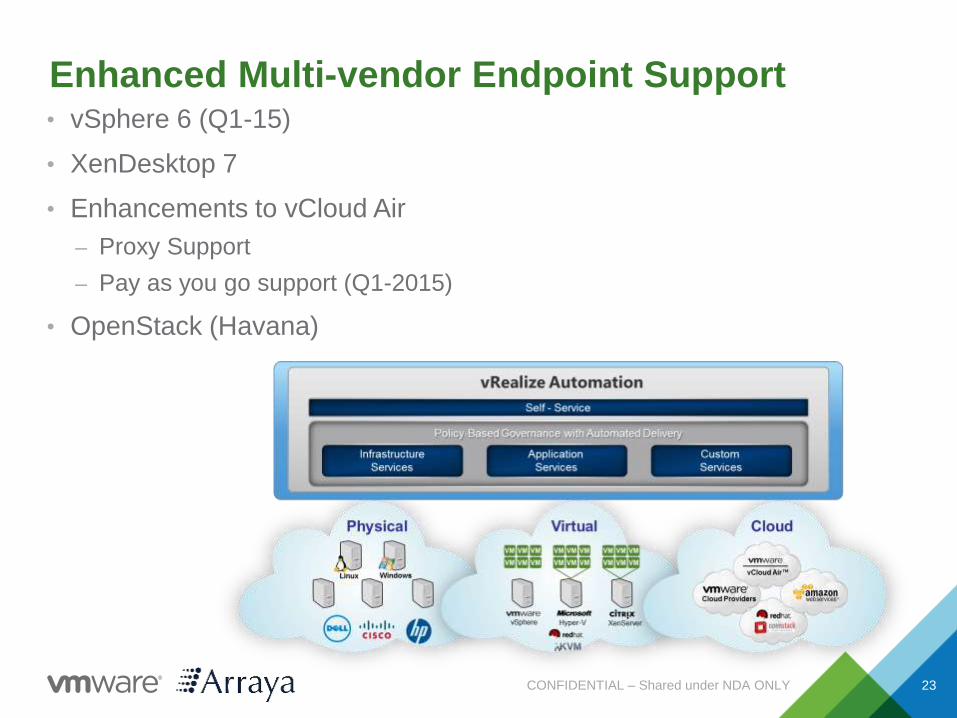
Enhanced Multi-vendor Endpoint Support• vSphere 6 (Q1-15)
• XenDesktop 7
• Enhancements to vCloud Air
– Proxy Support
– Pay as you go support (Q1-2015)
• OpenStack (Havana)
CONFIDENTIAL – Shared under NDA ONLY 23
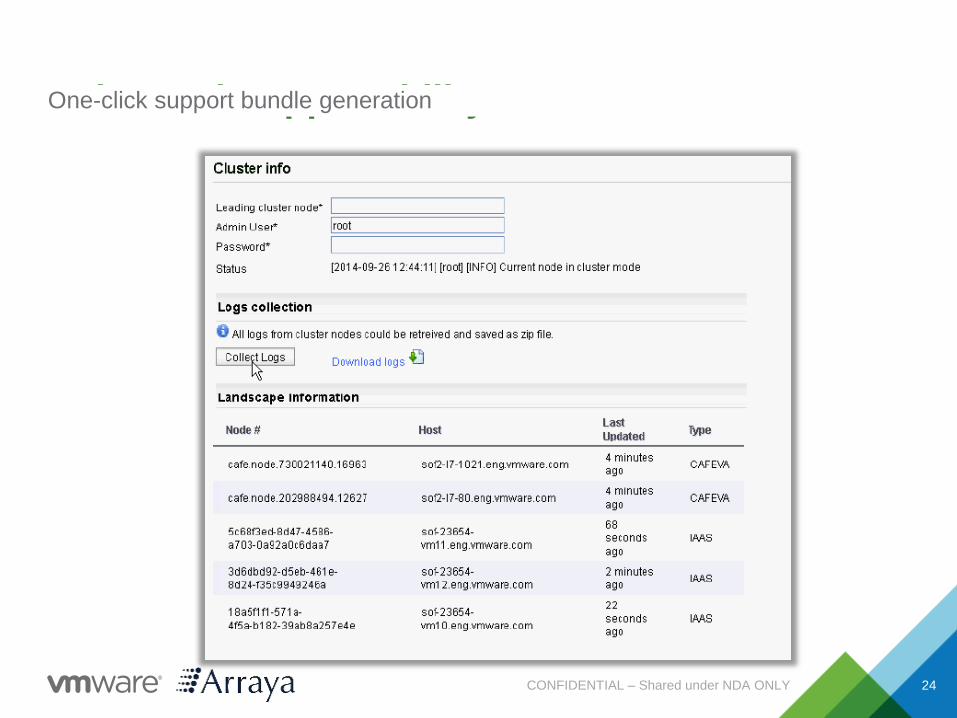
Enhanced Supportability
CONFIDENTIAL – Shared under NDA ONLY 24
One-click support bundle generation
© 2014 VMware Inc. All rights reserved.
Infrastructure & Operations Management with vRealize Operations
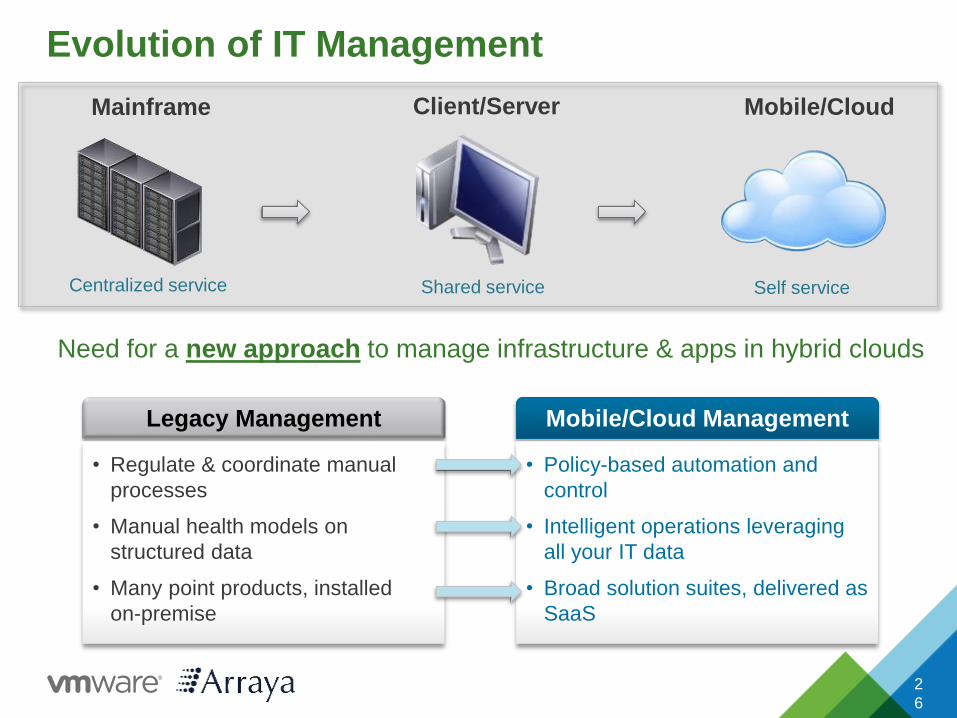
Legacy Management Mobile/Cloud Management
• Policy-based automation and
control
• Intelligent operations leveraging
all your IT data
• Broad solution suites, delivered as
SaaS
• Regulate & coordinate manual
processes
• Manual health models on
structured data
• Many point products, installed
on-premise
Mainframe Client/Server Mobile/Cloud
Need for a new approach to manage infrastructure & apps in hybrid clouds
Centralized service Shared service Self service
Evolution of IT Management
2
6
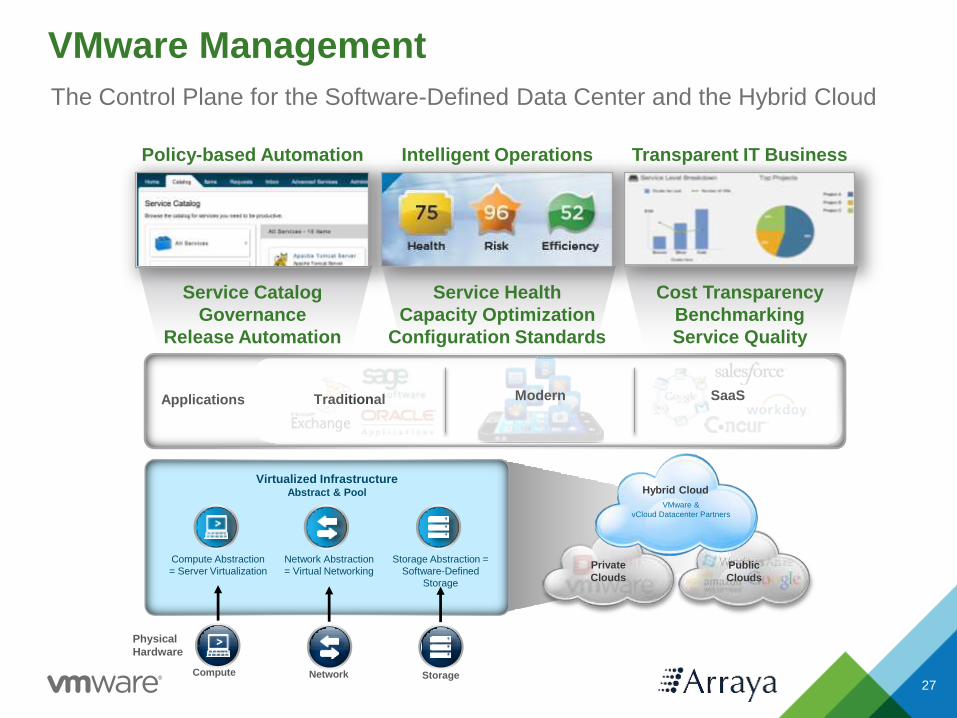
Policy-based Automation
Service Catalog
Governance
Release Automation
Intelligent Operations
Service Health
Capacity Optimization
Configuration Standards
Transparent IT Business
Cost Transparency
Benchmarking
Service Quality
VMware Management
27Compute
Physical
Hardware
Private
Clouds
Public
Clouds
Hybrid Cloud
VMware &
vCloud Datacenter Partners
Virtualized InfrastructureAbstract & Pool
Compute Abstraction
= Server Virtualization
Storage
Storage Abstraction =
Software-Defined
Storage
Network
Network Abstraction
= Virtual Networking
Applications Modern SaaSTraditional
The Control Plane for the Software-Defined Data Center and the Hybrid Cloud
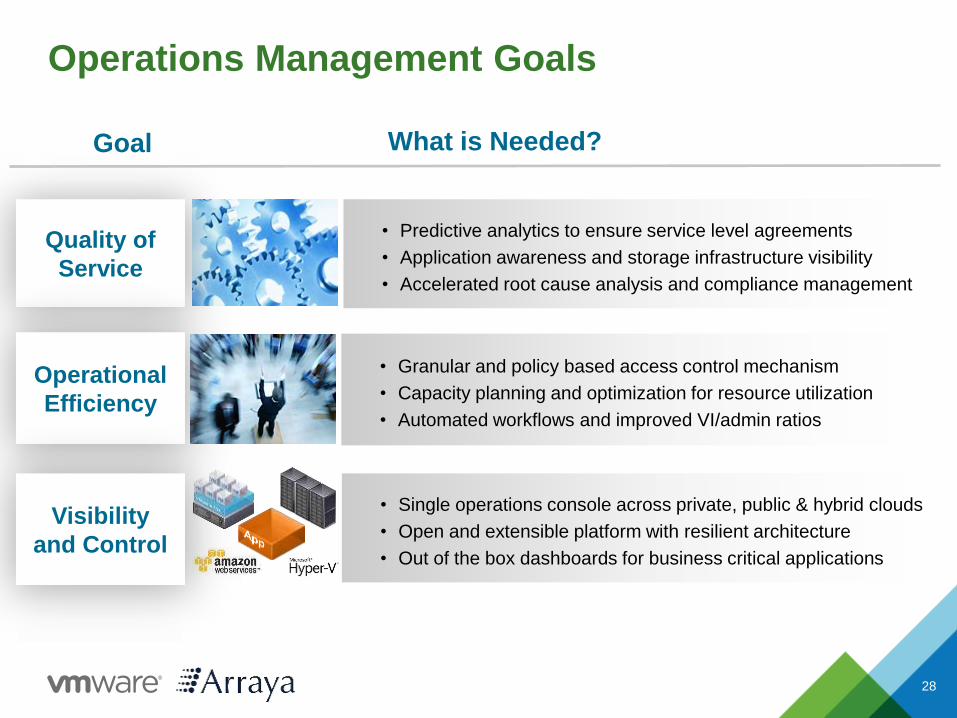
What is Needed?
• Predictive analytics to ensure service level agreements
• Application awareness and storage infrastructure visibility
• Accelerated root cause analysis and compliance management
• Granular and policy based access control mechanism
• Capacity planning and optimization for resource utilization
• Automated workflows and improved VI/admin ratios
• Single operations console across private, public & hybrid clouds
• Open and extensible platform with resilient architecture
• Out of the box dashboards for business critical applications
Goal
Operations Management Goals
Quality of
Service
Operational
Efficiency
Visibility
and Control
28
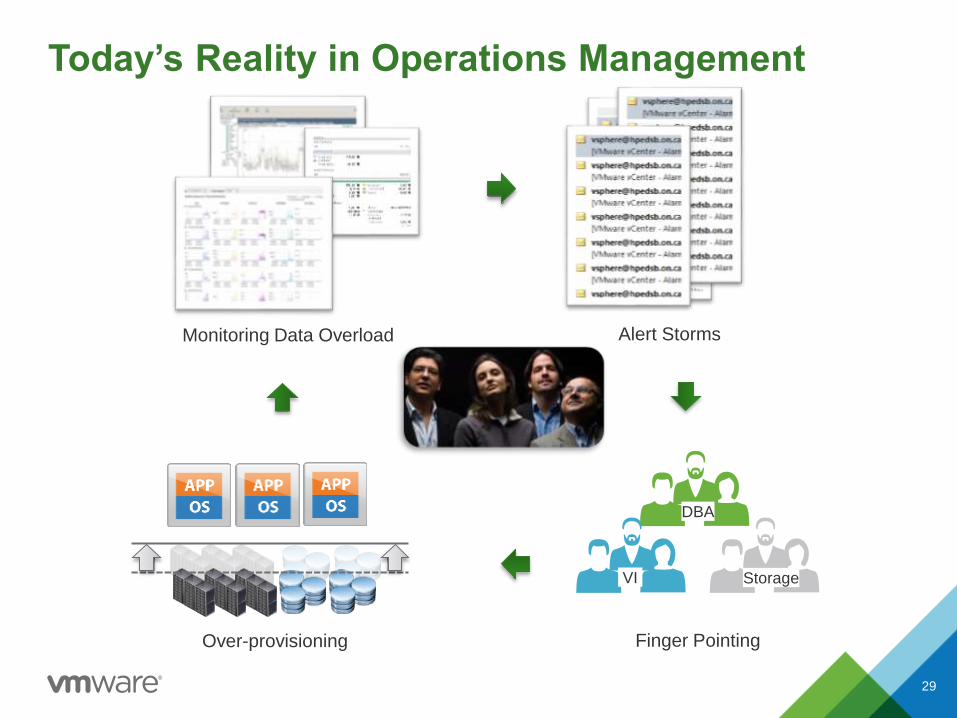
Today’s Reality in Operations Management
Monitoring Data Overload Alert Storms
Finger Pointing
DBA
VI Storage
Over-provisioning
29
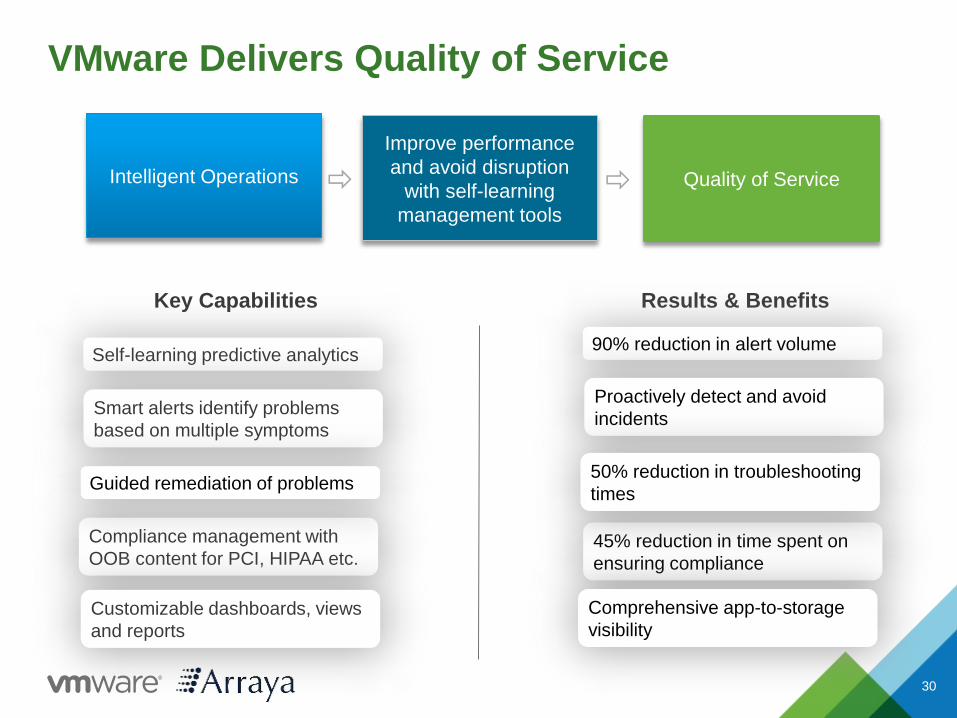
VMware Delivers Quality of Service
Improve performance
and avoid disruption
with self-learning
management tools
Key Capabilities Results & Benefits
90% reduction in alert volume
Proactively detect and avoid
incidents
Intelligent Operations
Quality of Service
45% reduction in time spent on
ensuring compliance
Compliance management with
OOB content for PCI, HIPAA etc.
Self-learning predictive analytics
Smart alerts identify problems
based on multiple symptoms
Comprehensive app-to-storage
visibilityCustomizable dashboards, views
and reports
50% reduction in troubleshooting
timesGuided remediation of problems
30
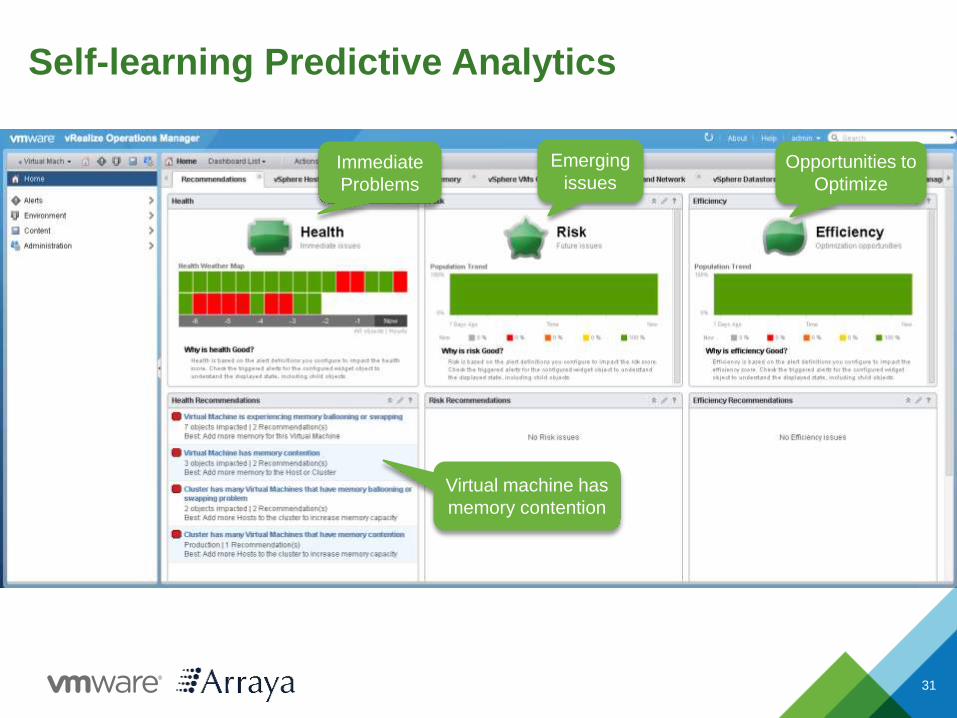
Immediate
Problems
Emerging
issuesOpportunities to
Optimize
Virtual machine has
memory contention
Self-learning Predictive Analytics
31
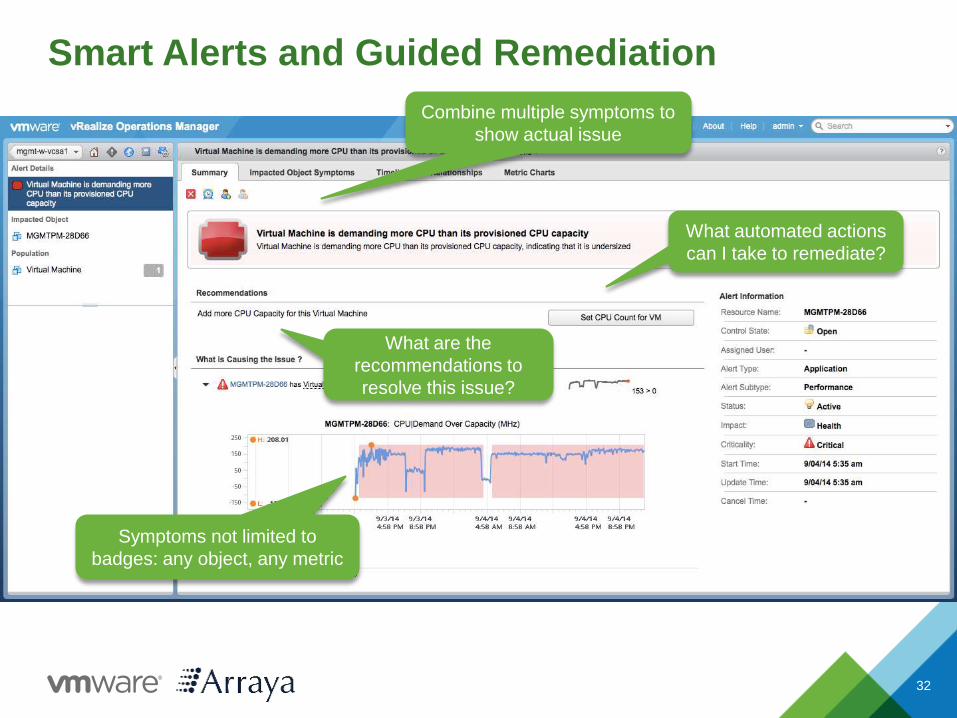
Smart Alerts and Guided Remediation
Combine multiple symptoms to
show actual issue
Symptoms not limited to
badges: any object, any metric
What are the
recommendations to
resolve this issue?
What automated actions
can I take to remediate?
32
LUNS
Admin gets alerted
that Oracle App is
slow
Oracle VM has
performance issue
Storage LUN health
is red
VNX | Target HBA Resets
Target HBA Resets is high,
limiting application
performance
Check LUN Details
(EMC VNX: LUN44)
IO OUTSTANDING
DISK IO
(870/1024)
High I/O
outstanding
Check EMC VNX Analytics
SP-A is red
1 2
34
Transaction latency
above normal
Troubleshooting Across App, VM, and Storage
33
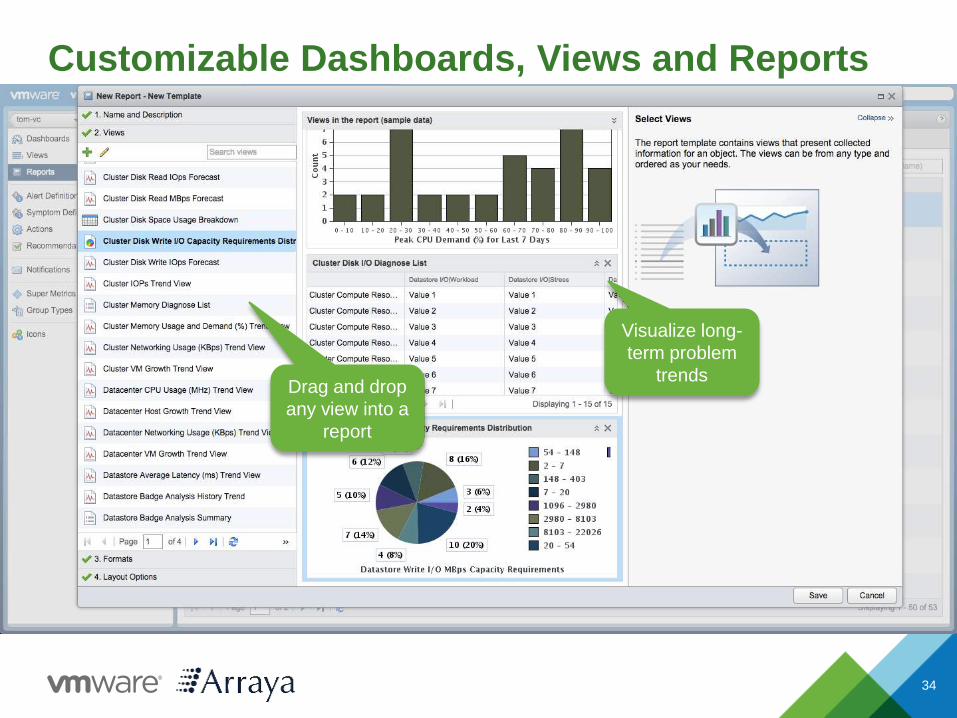
Customizable Dashboards, Views and Reports
Historical metrics
trends reveal Latency
Spike!
Select the type of view
you want - lists, trends
or distributions
Pick the objects and
data you want to see
Visualize long-
term problem
trendsDrag and drop
any view into a
report
34
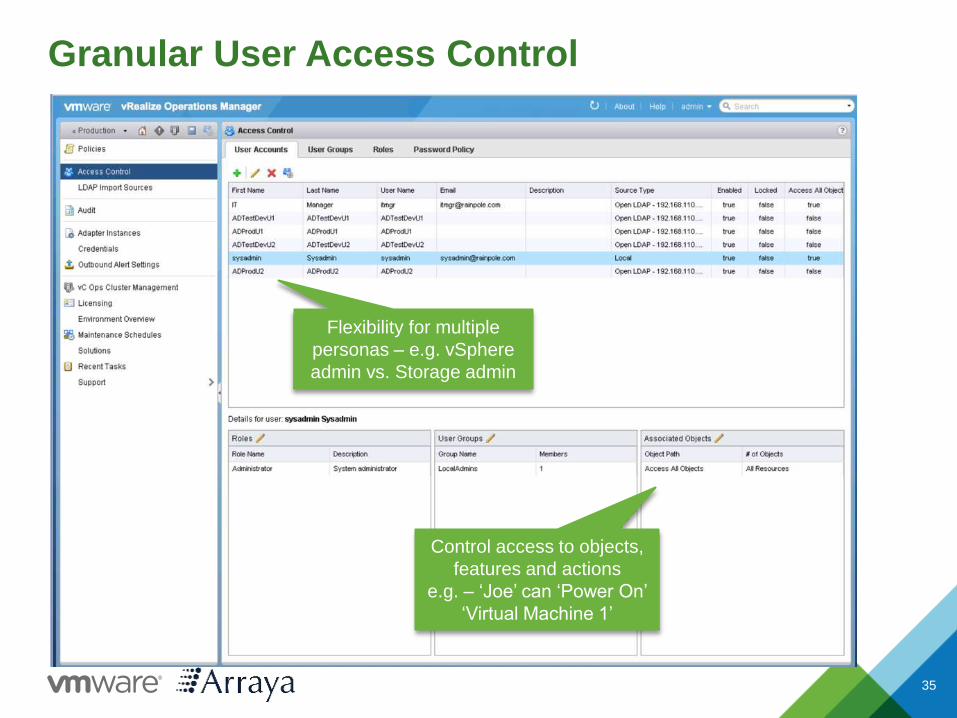
Granular User Access Control
35
Flexibility for multiple
personas – e.g. vSphere
admin vs. Storage admin
Control access to objects,
features and actions
e.g. – ‘Joe’ can ‘Power On’
‘Virtual Machine 1’
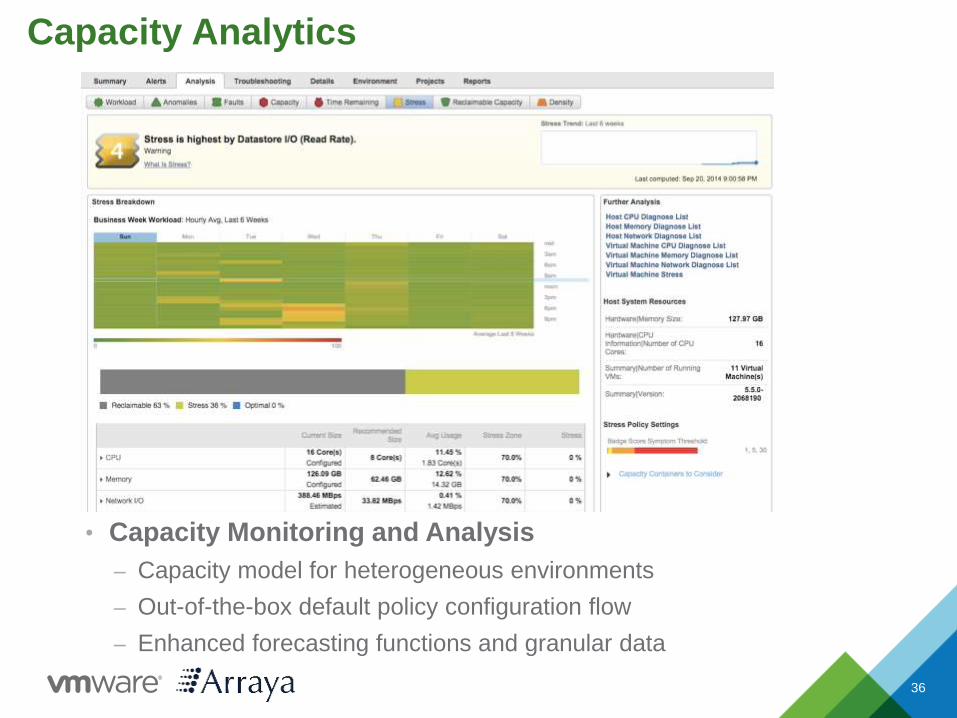
36
• Capacity Monitoring and Analysis
– Capacity model for heterogeneous environments
– Out-of-the-box default policy configuration flow
– Enhanced forecasting functions and granular data
Capacity Analytics
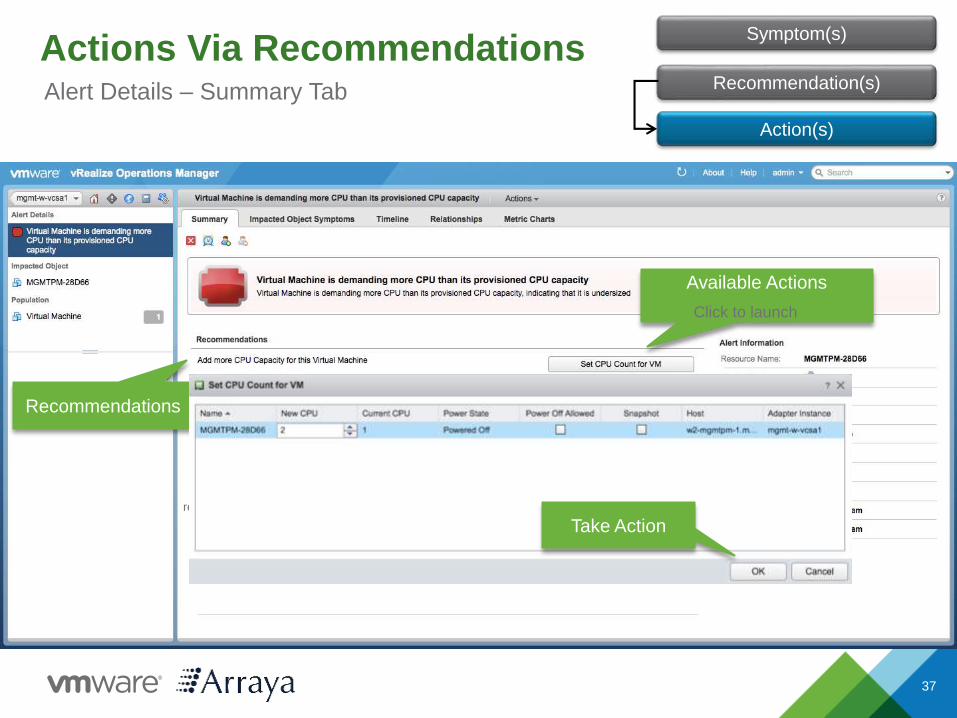
Available Actions
Click to launch
Recommendations
real-time metrics& events
Actions Via RecommendationsSymptom(s)
Recommendation(s)
Action(s)
Take Action
Alert Details – Summary Tab
37
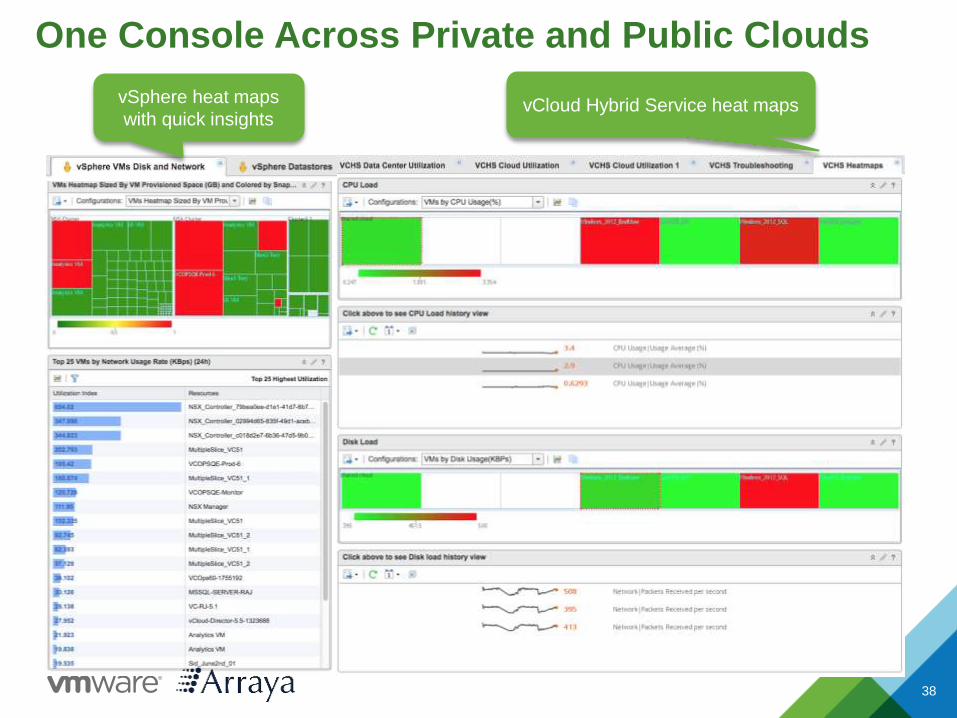
38
vCloud Hybrid Service heat mapsvSphere heat maps
with quick insights
One Console Across Private and Public Clouds
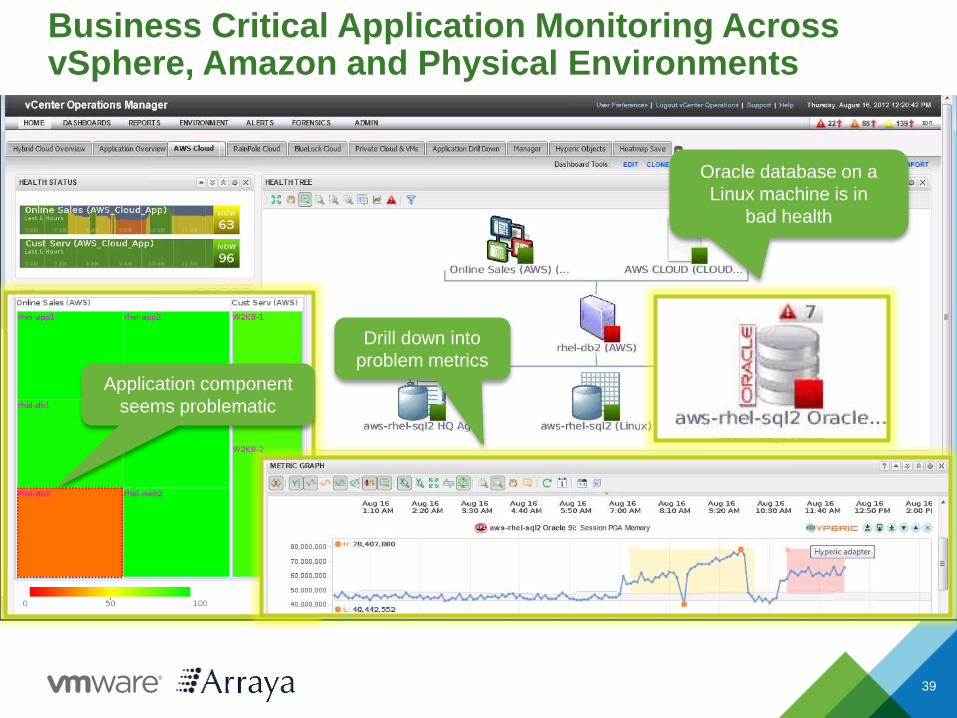
Business Critical Application Monitoring Across vSphere, Amazon and Physical Environments
Oracle database on a
Linux machine is in
bad health
Drill down into
problem metrics
Application component
seems problematic
39
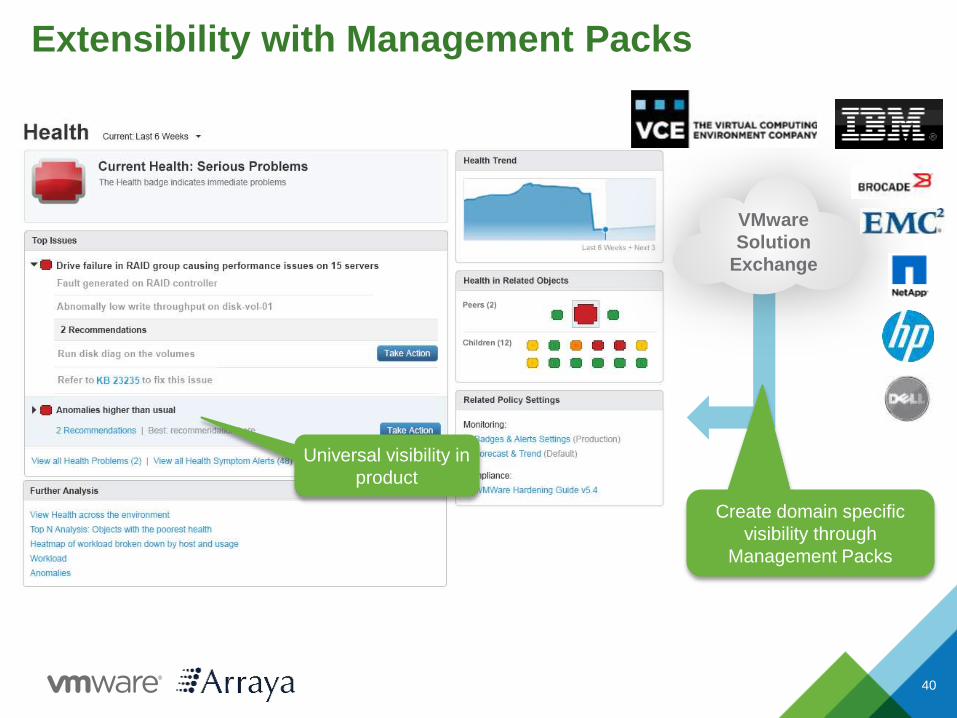
Extensibility with Management Packs
40
VMware
Solution
Exchange
Universal visibility in
product
Create domain specific
visibility through
Management Packs
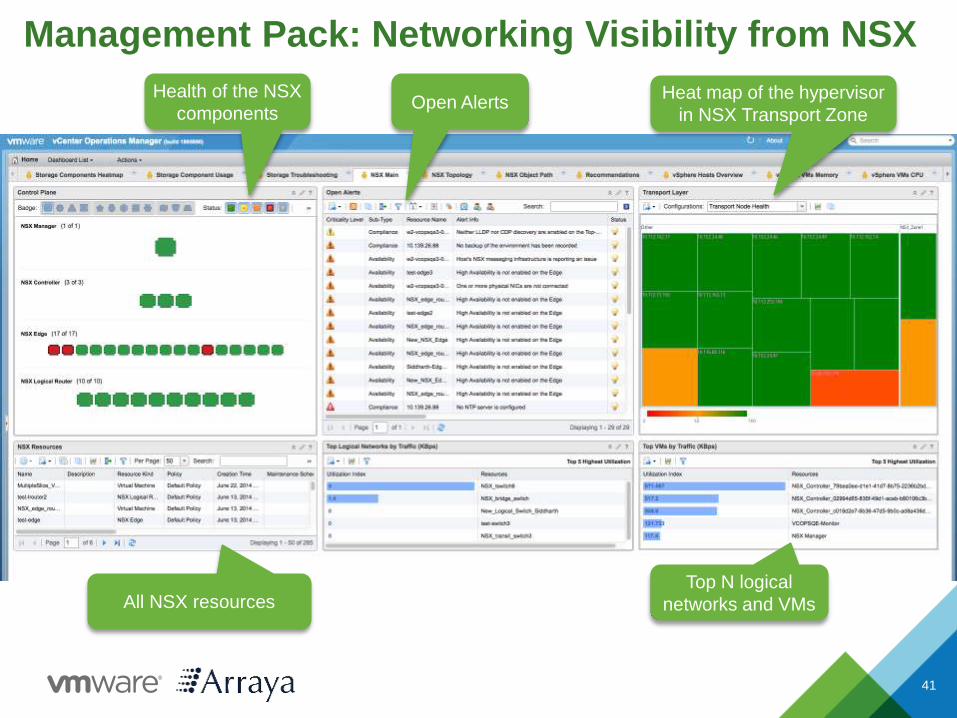
Management Pack: Networking Visibility from NSX
Open Alerts
Top N logical
networks and VMs
41
Health of the NSX
componentsHeat map of the hypervisor
in NSX Transport Zone
All NSX resources
What’s New in vRealizeOperations
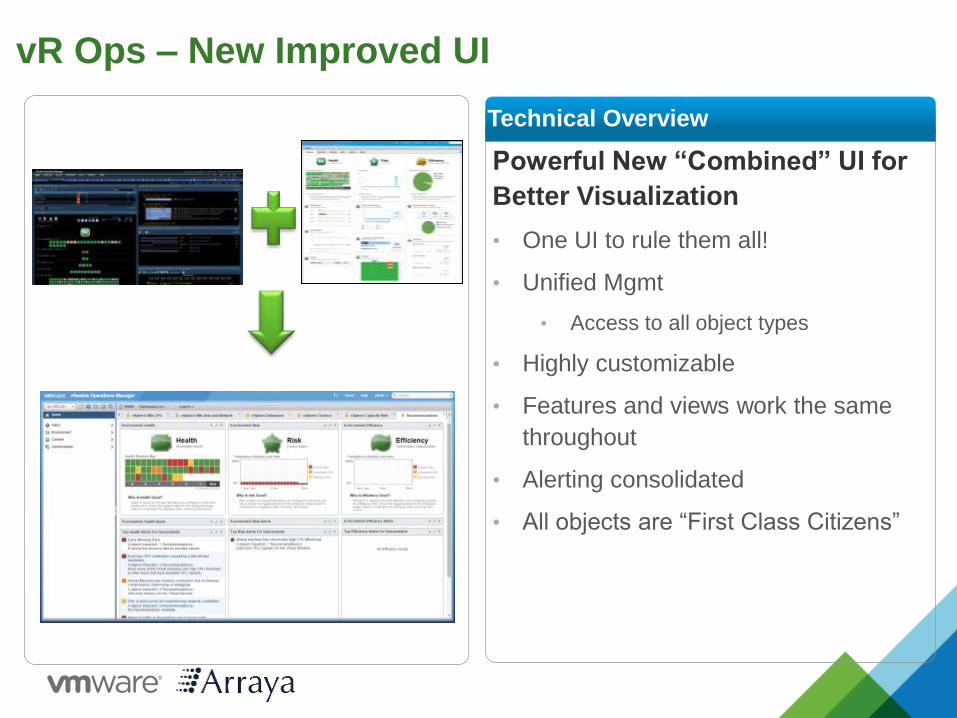
vR Ops – New Improved UI
Powerful New “Combined” UI for
Better Visualization
• One UI to rule them all!
• Unified Mgmt
• Access to all object types
• Highly customizable
• Features and views work the same
throughout
• Alerting consolidated
• All objects are “First Class Citizens”
Technical Overview
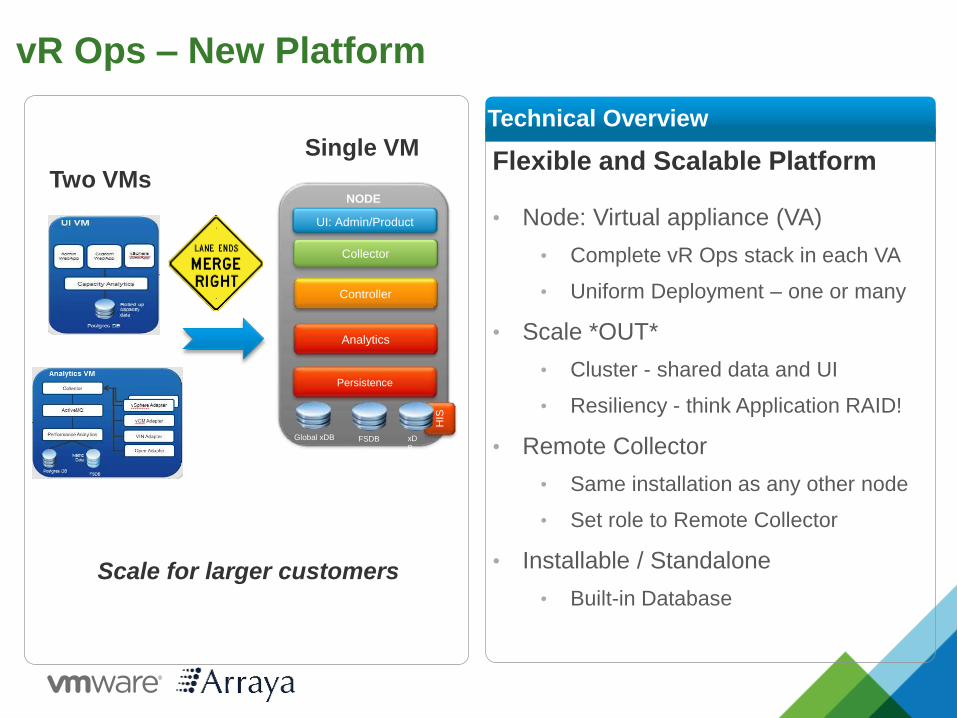
vR Ops – New Platform
Flexible and Scalable Platform
• Node: Virtual appliance (VA)
• Complete vR Ops stack in each VA
• Uniform Deployment – one or many
• Scale *OUT*
• Cluster - shared data and UI
• Resiliency - think Application RAID!
• Remote Collector
• Same installation as any other node
• Set role to Remote Collector
• Installable / Standalone
• Built-in Database
Technical Overview
Collector
UI: Admin/Product
Persistence
Analytics
Controller
HIS
NODE
FSDBGlobal xDB xD
B
Two VMs
Single VM
Scale for larger customers
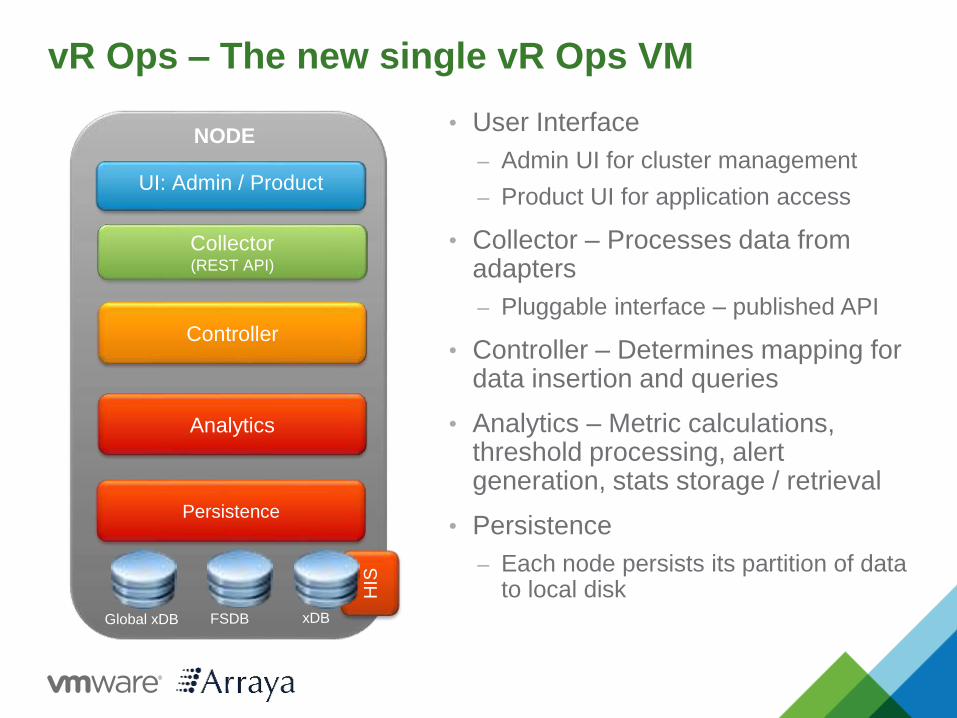
vR Ops – The new single vR Ops VM
Slice
Collector(REST API)
UI: Admin / Product
Persistence
Analytics
Controller
HIS
NODE
FSDB xDBGlobal xDB
• User Interface
– Admin UI for cluster management
– Product UI for application access
• Collector – Processes data from adapters
– Pluggable interface – published API
• Controller – Determines mapping for data insertion and queries
• Analytics – Metric calculations, threshold processing, alert generation, stats storage / retrieval
• Persistence
– Each node persists its partition of data to local disk
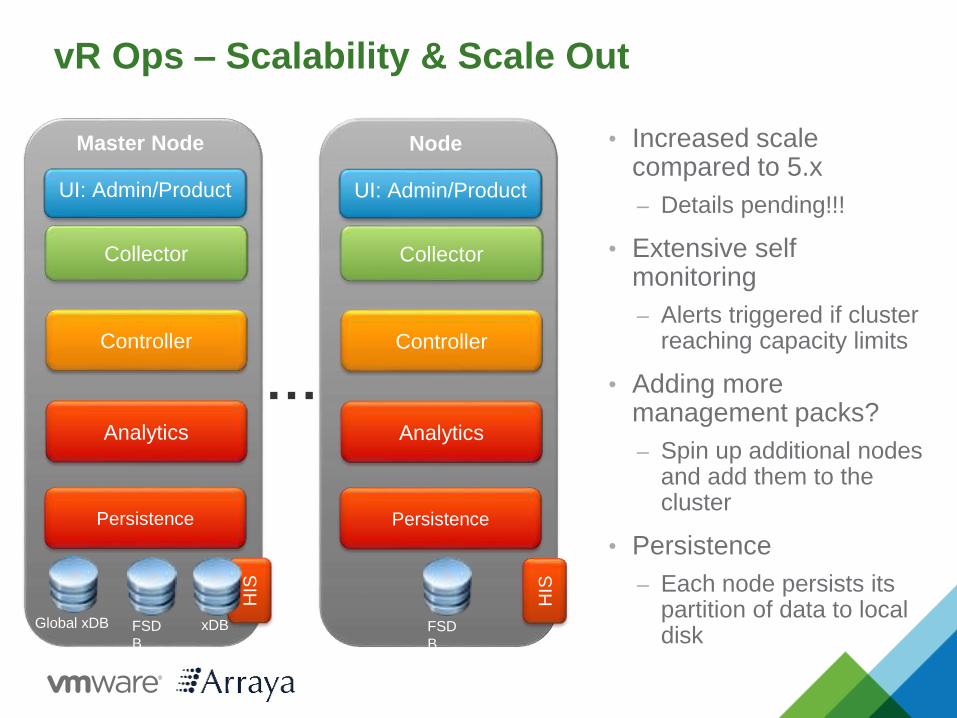
vR Ops – Scalability & Scale Out
Collector
UI: Admin/Product
Persistence
Analytics
Controller
HIS
Node
FSD
B
Collector
UI: Admin/Product
Persistence
Analytics
Controller
HIS
Master Node
FSD
B
Global xDB xDB
…
• Increased scale compared to 5.x
– Details pending!!!
• Extensive self monitoring
– Alerts triggered if cluster reaching capacity limits
• Adding more management packs?
– Spin up additional nodes and add them to the cluster
• Persistence
– Each node persists its partition of data to local disk
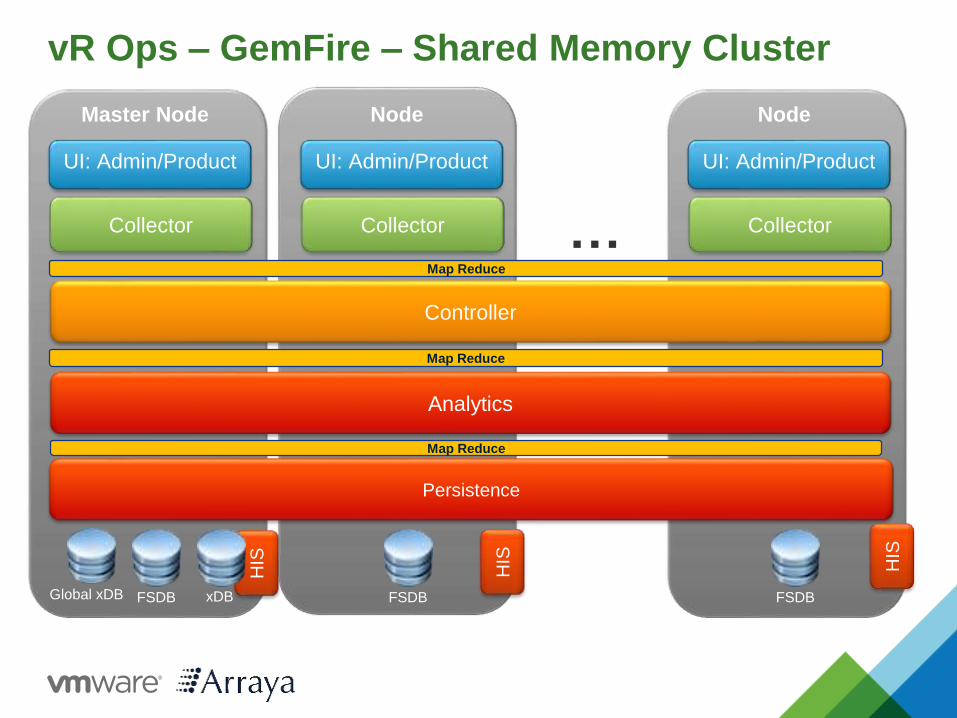
vR Ops – GemFire – Shared Memory Cluster
Collector
UI: Admin/Product
Node
FSDB
Collector
UI: Admin/Product
Persistence
Analytics
Controller
HIS
Map Reduce
Map Reduce
Map Reduce
Master Node
FSDBGlobal xDB xDB
Collector
UI: Admin/Product
HIS
Node
FSDB
…
HIS
vR Ops – High Availability & Resiliency
Collector
UI: Admin/Product
FSDB
Collector
UI: Admin/Product
Persistence
Analytics
Controller
HIS
Map Reduce
Map Reduce
Map Reduce
Master Node
FSDBPostgres xDB
Collector
UI: Admin/Product
HIS
Node
FSD
B
…
HIS
Node
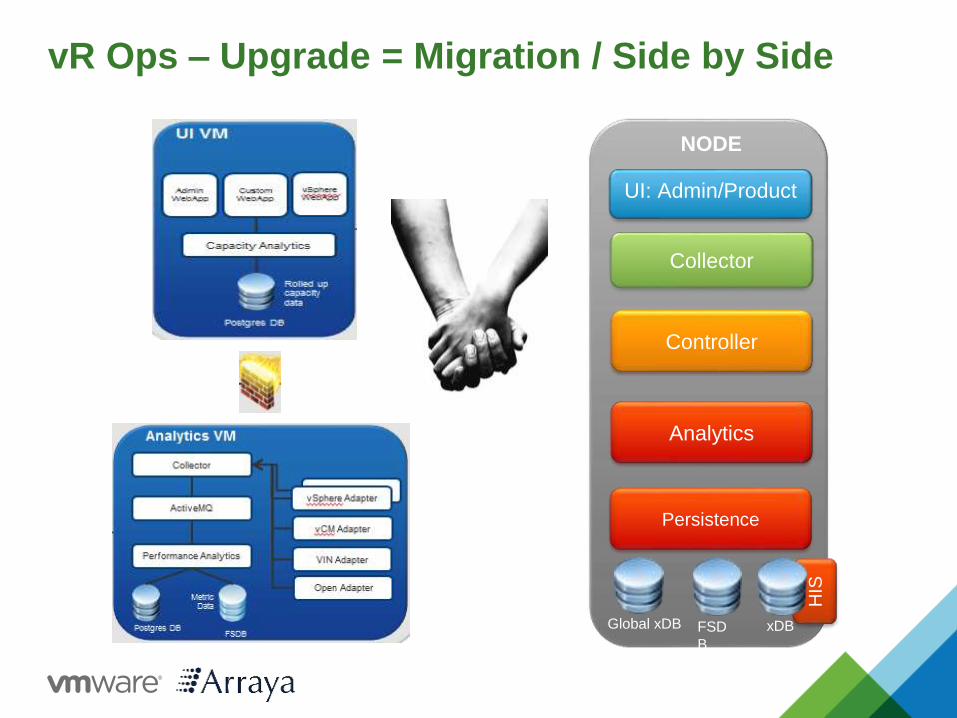
vR Ops – Upgrade = Migration / Side by Side
Collector
UI: Admin/Product
Persistence
Analytics
Controller
HIS
NODE
FSD
B
Global xDB xDB
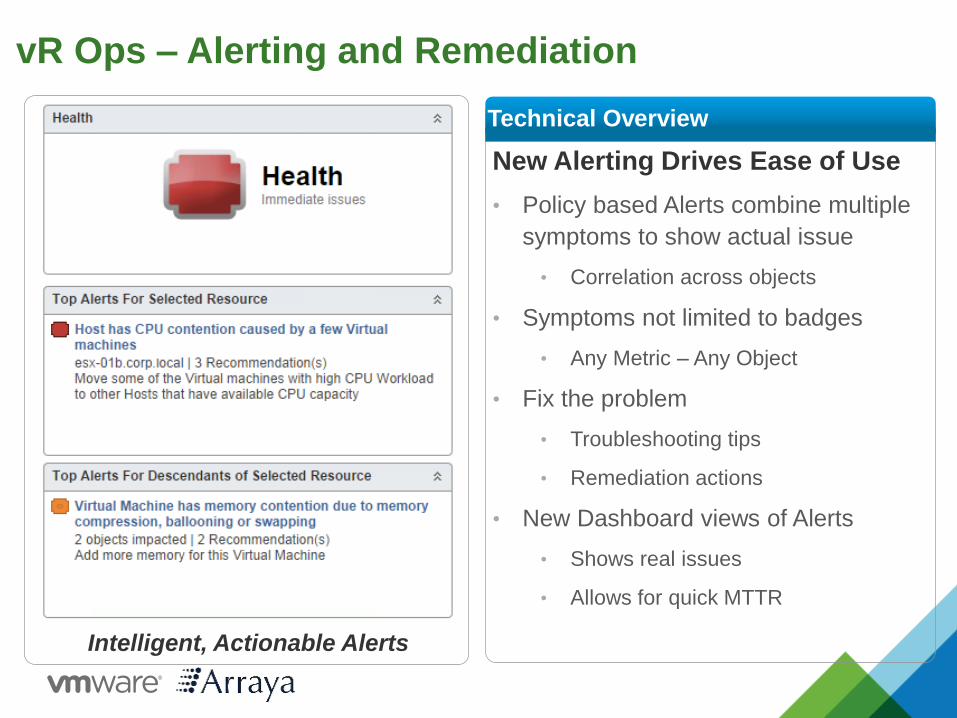
vR Ops – Alerting and Remediation
New Alerting Drives Ease of Use
• Policy based Alerts combine multiple
symptoms to show actual issue
• Correlation across objects
• Symptoms not limited to badges
• Any Metric – Any Object
• Fix the problem
• Troubleshooting tips
• Remediation actions
• New Dashboard views of Alerts
• Shows real issues
• Allows for quick MTTR
Technical Overview
Intelligent, Actionable Alerts
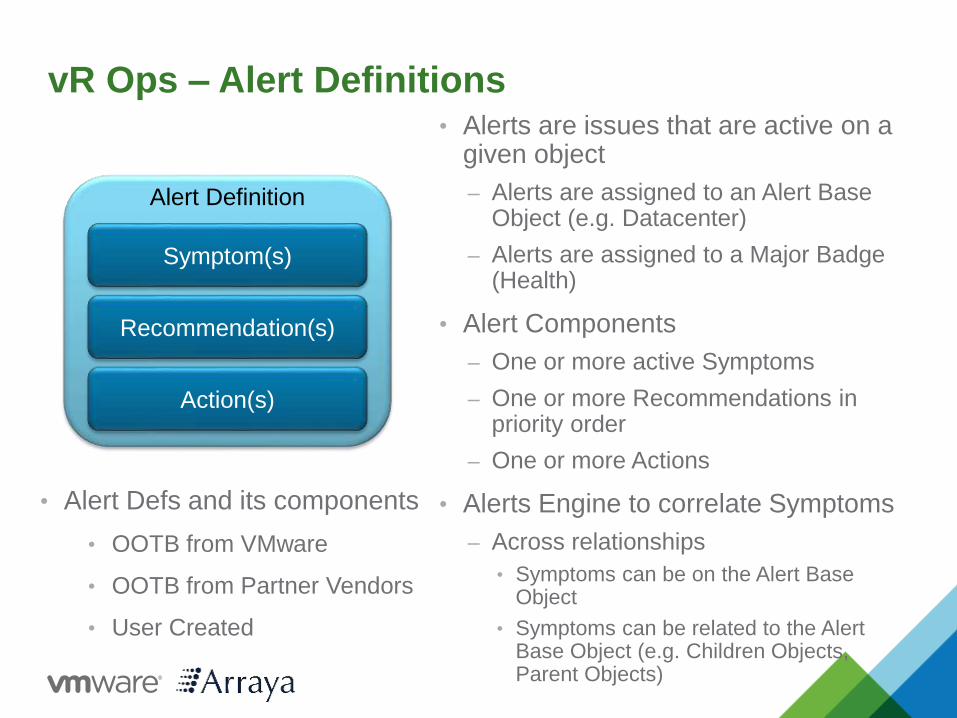
vR Ops – Alert Definitions• Alerts are issues that are active on a
given object
– Alerts are assigned to an Alert Base Object (e.g. Datacenter)
– Alerts are assigned to a Major Badge (Health)
• Alert Components
– One or more active Symptoms
– One or more Recommendations in priority order
– One or more Actions
• Alerts Engine to correlate Symptoms
– Across relationships
• Symptoms can be on the Alert Base Object
• Symptoms can be related to the Alert Base Object (e.g. Children Objects, Parent Objects)
Alert Definition
Symptom(s)
Recommendation(s)
Action(s)
• Alert Defs and its components
• OOTB from VMware
• OOTB from Partner Vendors
• User Created
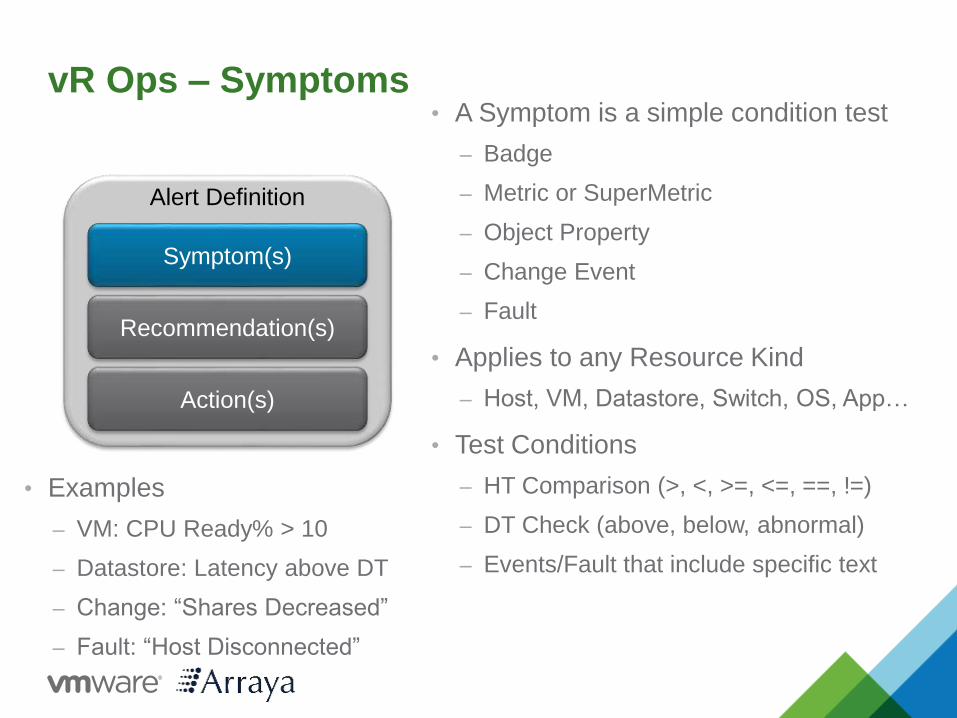
vR Ops – Symptoms• A Symptom is a simple condition test
– Badge
– Metric or SuperMetric
– Object Property
– Change Event
– Fault
• Applies to any Resource Kind
– Host, VM, Datastore, Switch, OS, App…
• Test Conditions
– HT Comparison (>, <, >=, <=, ==, !=)
– DT Check (above, below, abnormal)
– Events/Fault that include specific text
• Examples
– VM: CPU Ready% > 10
– Datastore: Latency above DT
– Change: “Shares Decreased”
– Fault: “Host Disconnected”
Alert Definition
Symptom(s)
Recommendation(s)
Action(s)
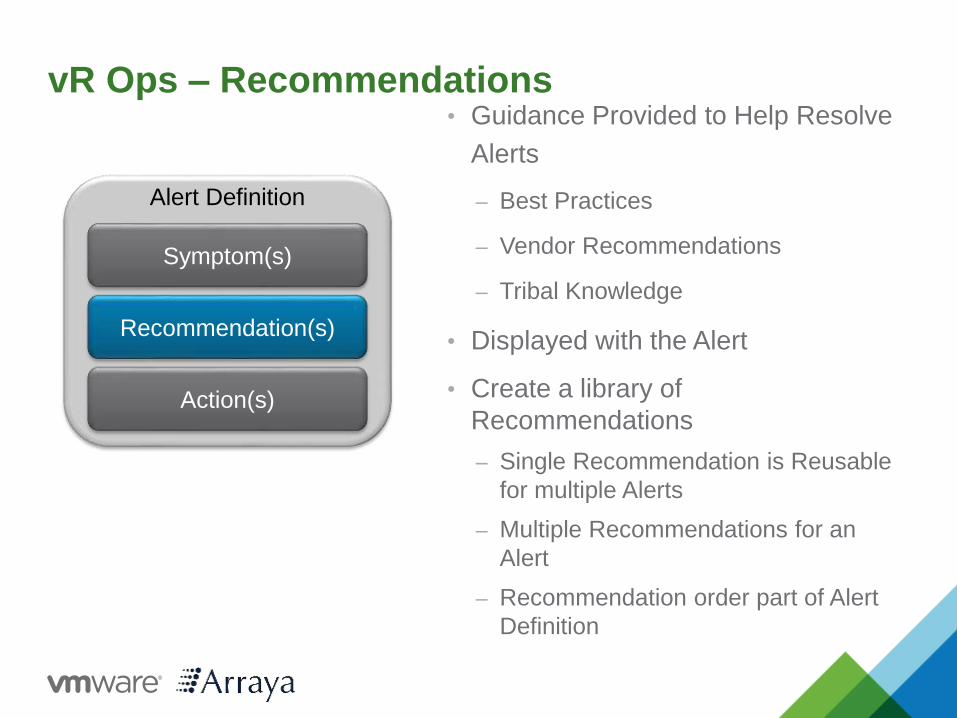
vR Ops – Recommendations• Guidance Provided to Help Resolve
Alerts
– Best Practices
– Vendor Recommendations
– Tribal Knowledge
• Displayed with the Alert
• Create a library of
Recommendations
– Single Recommendation is Reusable
for multiple Alerts
– Multiple Recommendations for an
Alert
– Recommendation order part of Alert
Definition
Alert Definition
Symptom(s)
Recommendation(s)
Action(s)
Alert Definition
Symptom(s)
Recommendation(s)
Action(s)
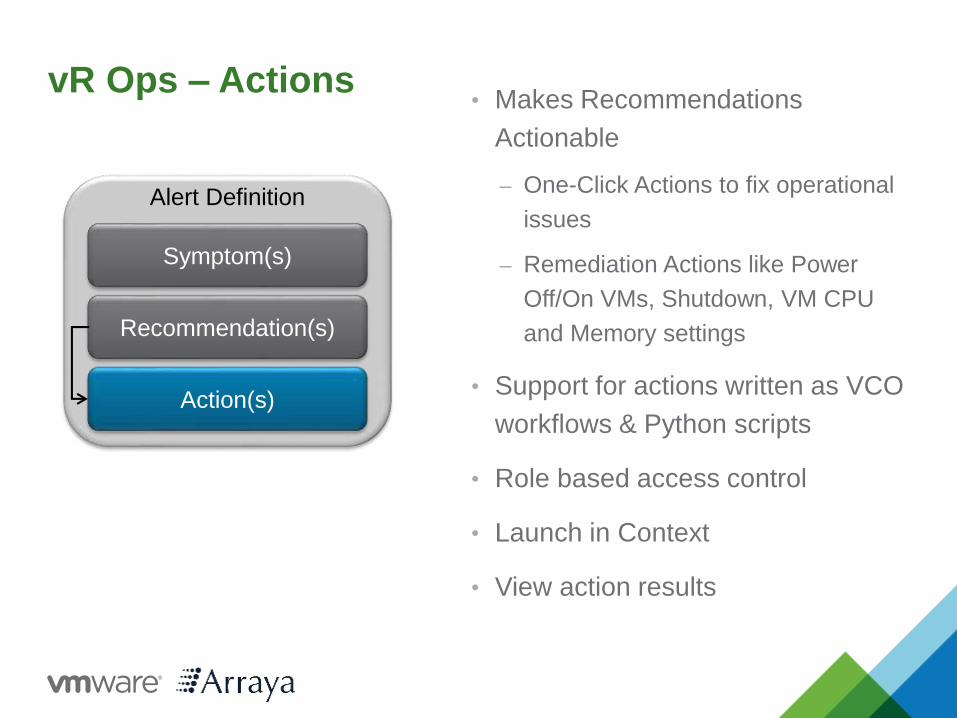
vR Ops – Actions• Makes Recommendations
Actionable
– One-Click Actions to fix operational
issues
– Remediation Actions like Power
Off/On VMs, Shutdown, VM CPU
and Memory settings
• Support for actions written as VCO
workflows & Python scripts
• Role based access control
• Launch in Context
• View action results
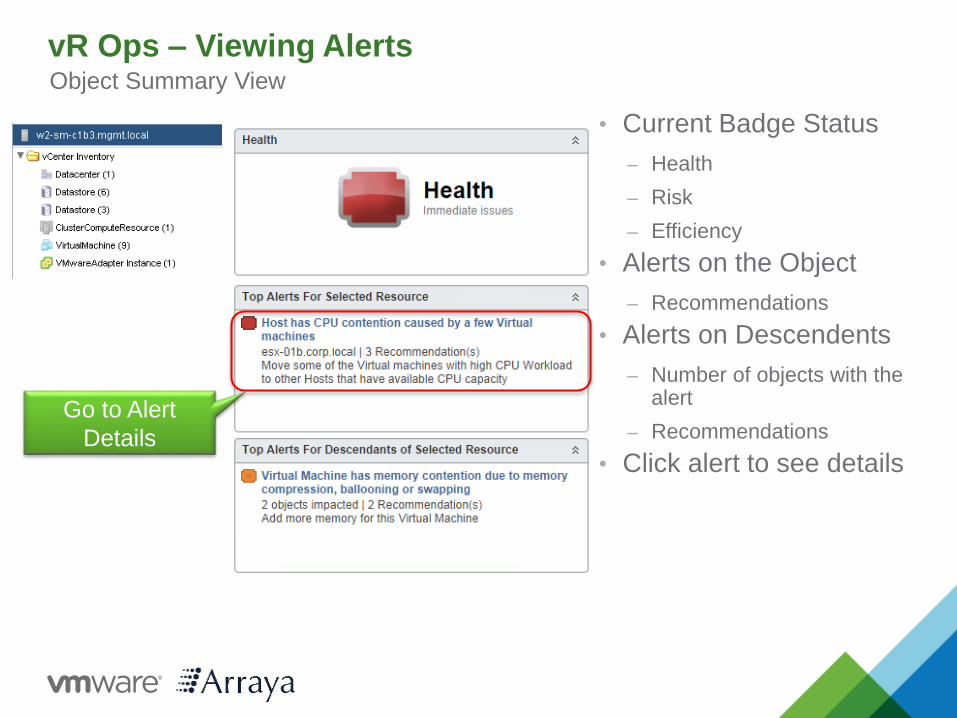
vR Ops – Viewing Alerts
• Current Badge Status
– Health
– Risk
– Efficiency
• Alerts on the Object
– Recommendations
• Alerts on Descendents
– Number of objects with the alert
– Recommendations
• Click alert to see details
Object Summary View
Go to Alert
Details
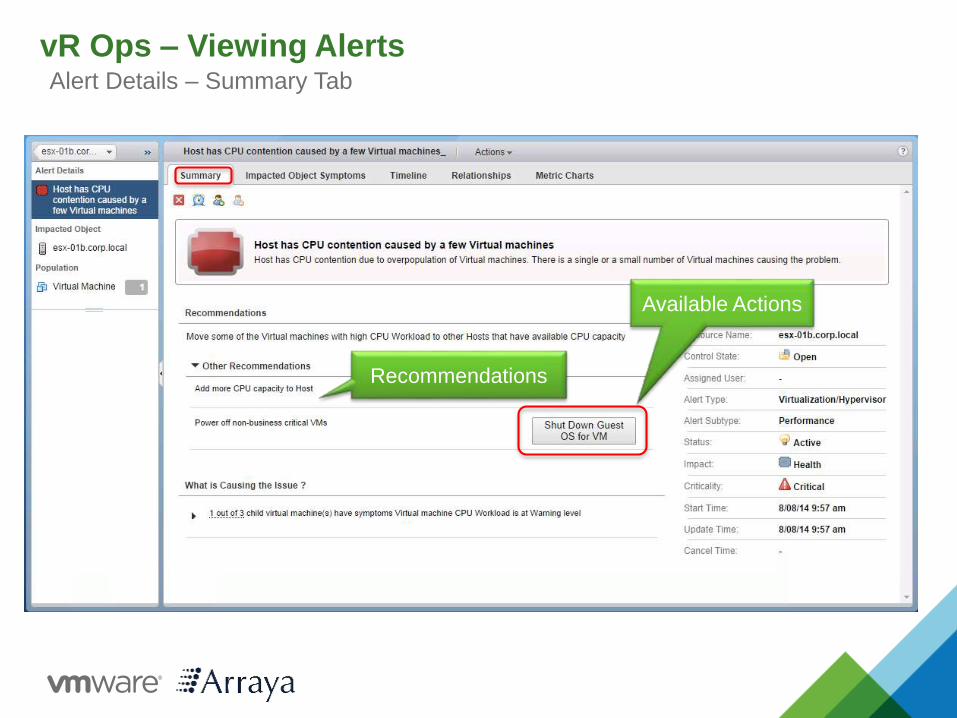
vR Ops – Viewing AlertsAlert Details – Summary Tab
Available Actions
Recommendations
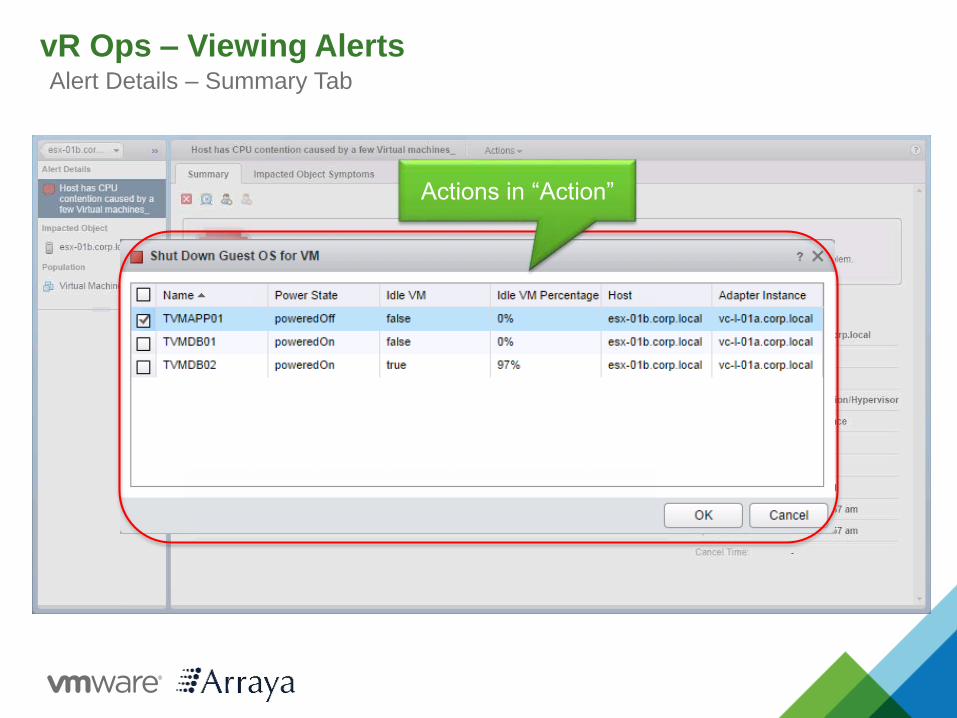
vR Ops – Viewing AlertsAlert Details – Summary Tab
Actions in “Action”
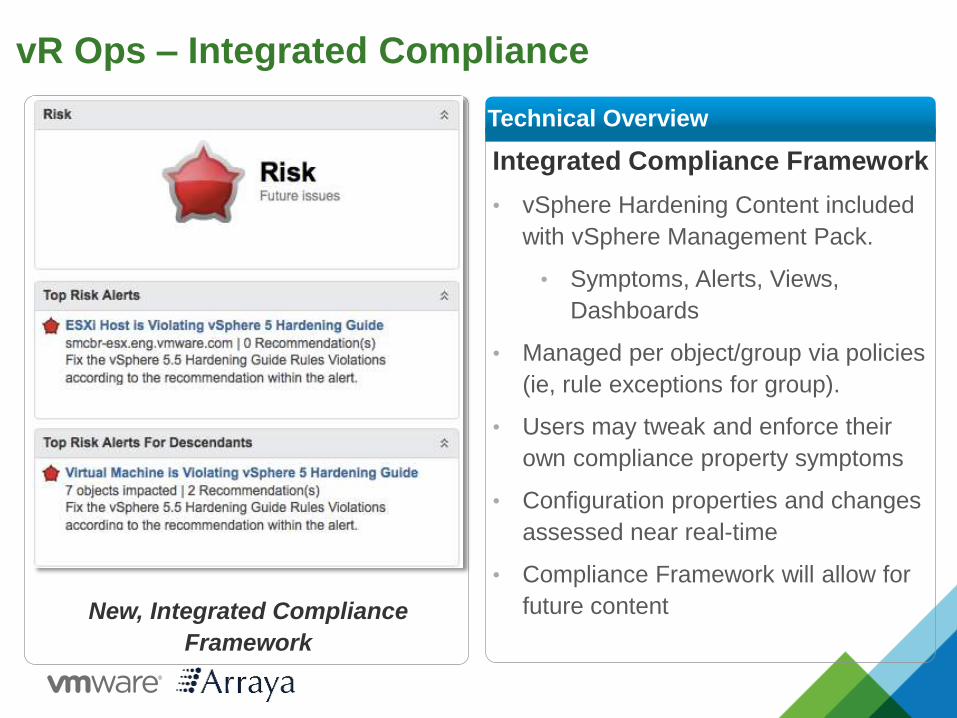
vR Ops – Integrated Compliance
Integrated Compliance Framework
• vSphere Hardening Content included
with vSphere Management Pack.
• Symptoms, Alerts, Views,
Dashboards
• Managed per object/group via policies
(ie, rule exceptions for group).
• Users may tweak and enforce their
own compliance property symptoms
• Configuration properties and changes
assessed near real-time
• Compliance Framework will allow for
future content
Technical Overview
New, Integrated Compliance
Framework
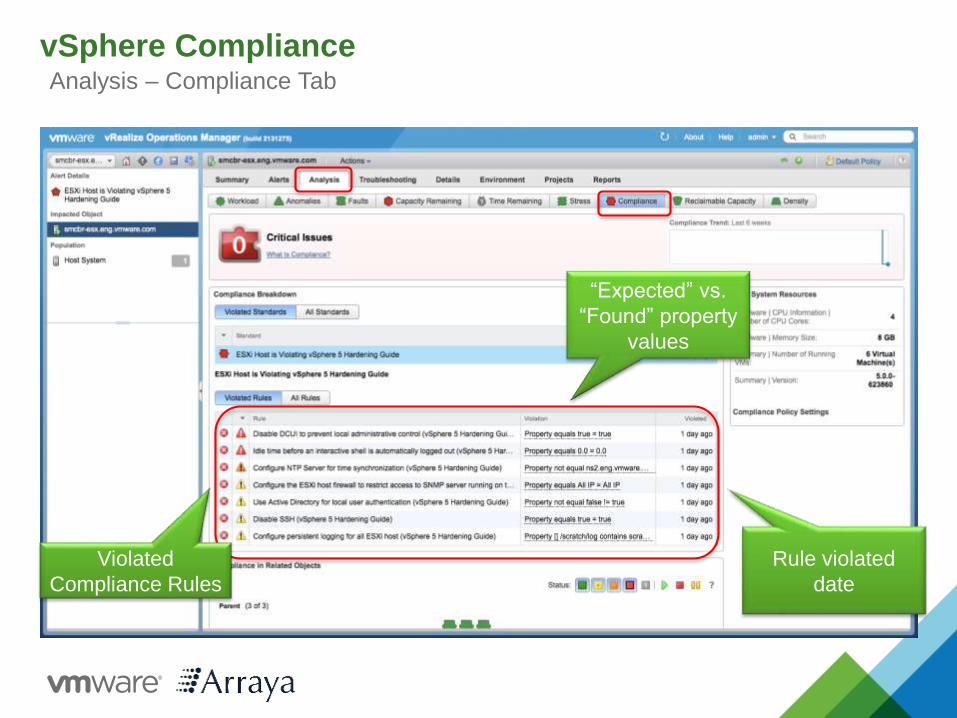
vSphere ComplianceAnalysis – Compliance Tab
“Expected” vs.
“Found” property
values
Violated
Compliance Rules
Rule violated
date
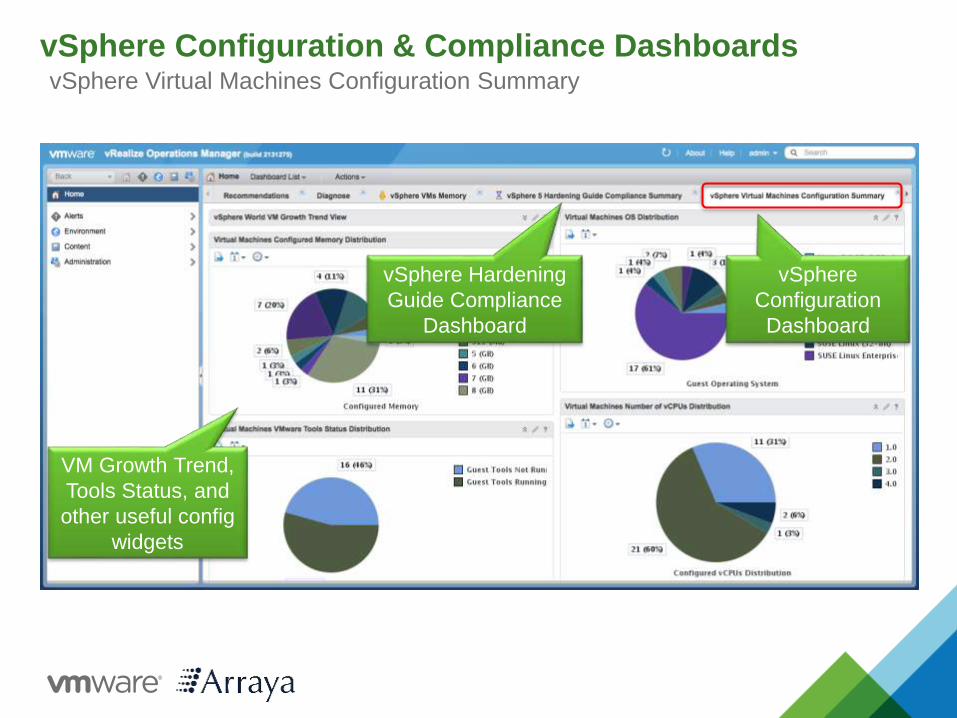
vSphere Configuration & Compliance DashboardsvSphere Virtual Machines Configuration Summary
vSphere
Configuration
Dashboard
VM Growth Trend,
Tools Status, and
other useful config
widgets
vSphere Hardening
Guide Compliance
Dashboard
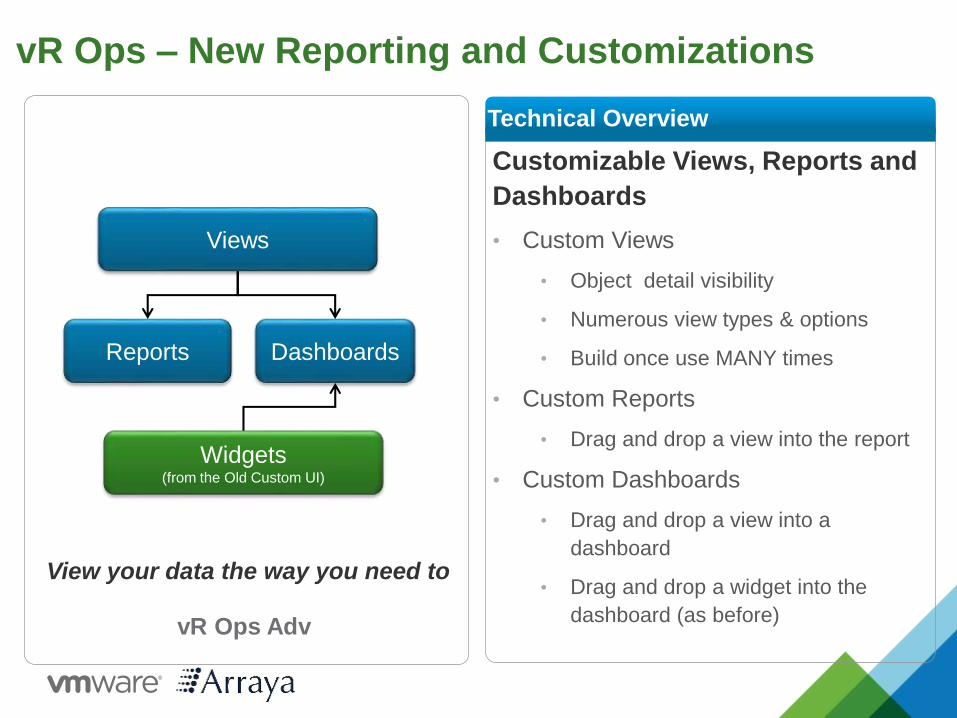
vR Ops – New Reporting and Customizations
Customizable Views, Reports and
Dashboards
• Custom Views
• Object detail visibility
• Numerous view types & options
• Build once use MANY times
• Custom Reports
• Drag and drop a view into the report
• Custom Dashboards
• Drag and drop a view into a
dashboard
• Drag and drop a widget into the
dashboard (as before)
Technical Overview
Views
Reports Dashboards
Widgets(from the Old Custom UI)
View your data the way you need to
vR Ops Adv
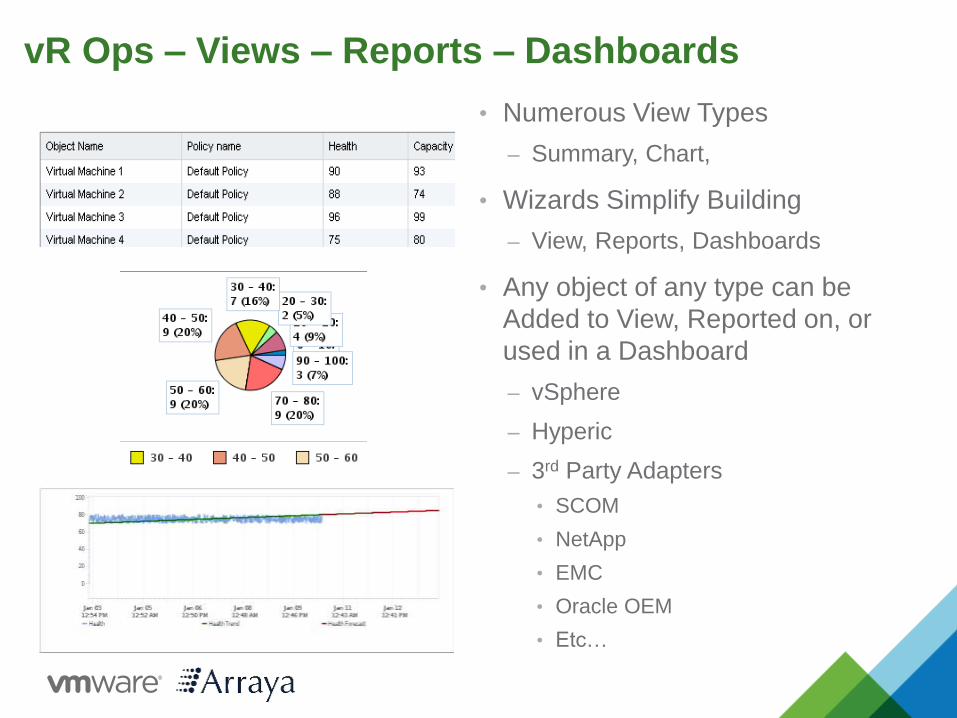
vR Ops – Views – Reports – Dashboards
• Numerous View Types
– Summary, Chart,
• Wizards Simplify Building
– View, Reports, Dashboards
• Any object of any type can be
Added to View, Reported on, or
used in a Dashboard
– vSphere
– Hyperic
– 3rd Party Adapters
• SCOM
• NetApp
• EMC
• Oracle OEM
• Etc…
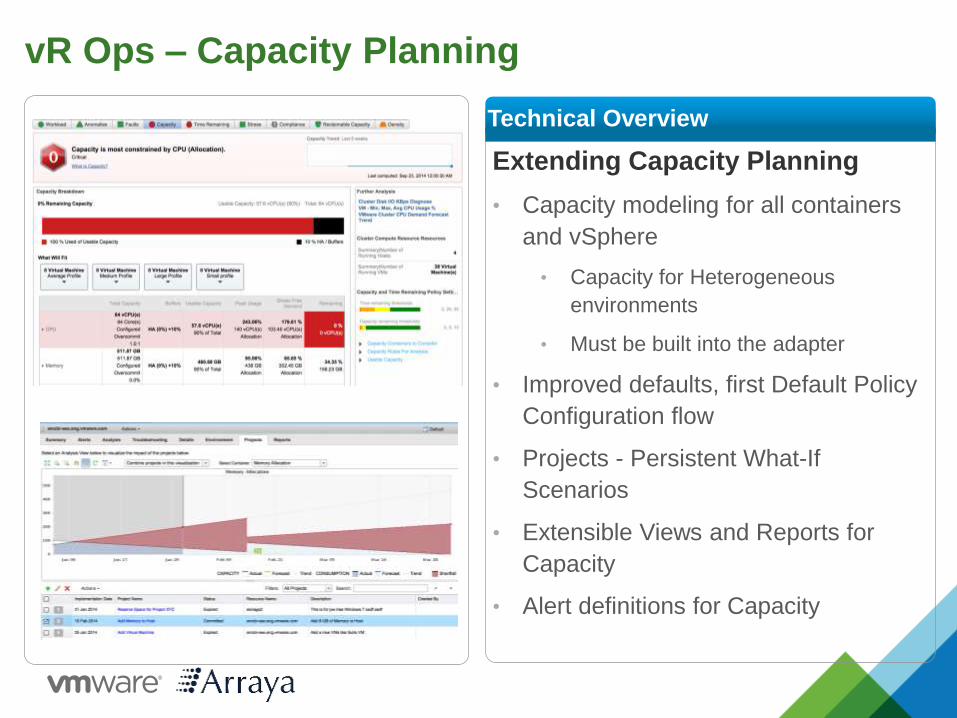
vR Ops – Capacity Planning
Extending Capacity Planning
• Capacity modeling for all containers
and vSphere
• Capacity for Heterogeneous
environments
• Must be built into the adapter
• Improved defaults, first Default Policy
Configuration flow
• Projects - Persistent What-If
Scenarios
• Extensible Views and Reports for
Capacity
• Alert definitions for Capacity
Technical Overview
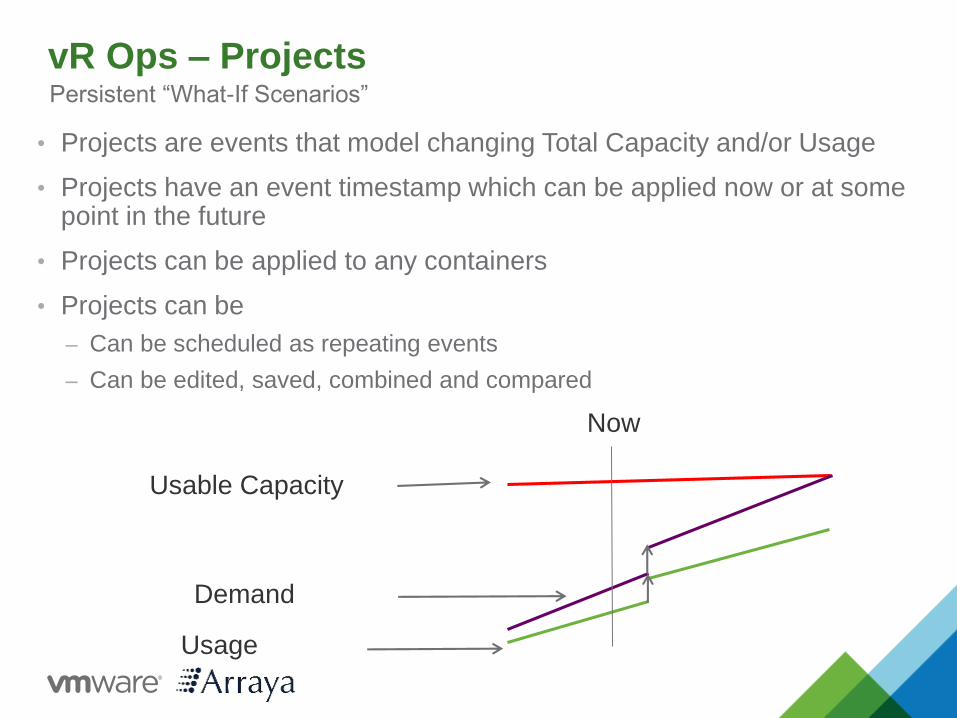
vR Ops – Projects
• Projects are events that model changing Total Capacity and/or Usage
• Projects have an event timestamp which can be applied now or at some point in the future
• Projects can be applied to any containers
• Projects can be
– Can be scheduled as repeating events
– Can be edited, saved, combined and compared
Now
Usable Capacity
Usage
Demand
Persistent “What-If Scenarios”
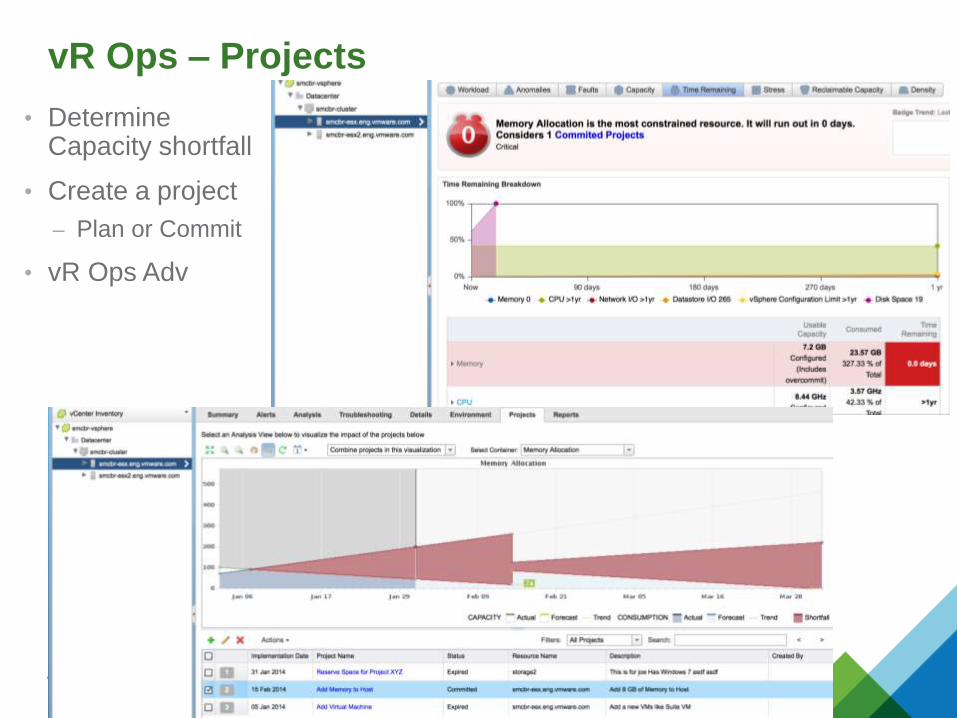
vR Ops – Projects
• Determine Capacity shortfall
• Create a project
– Plan or Commit
• vR Ops Adv
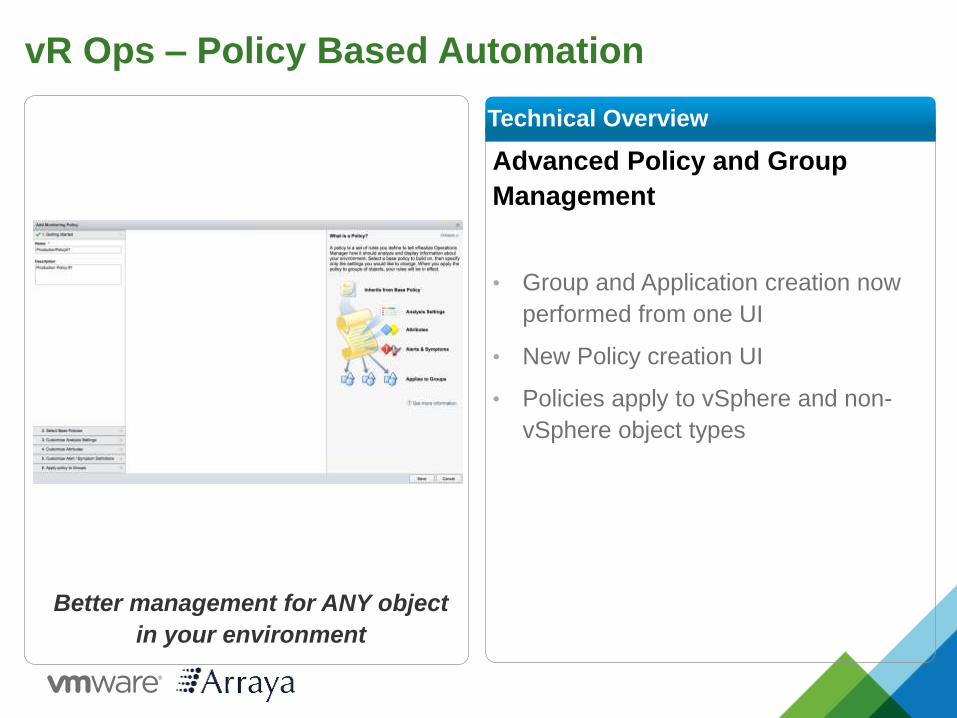
vR Ops – Policy Based Automation
Advanced Policy and Group
Management
• Group and Application creation now
performed from one UI
• New Policy creation UI
• Policies apply to vSphere and non-
vSphere object types
Technical Overview
Better management for ANY object
in your environment
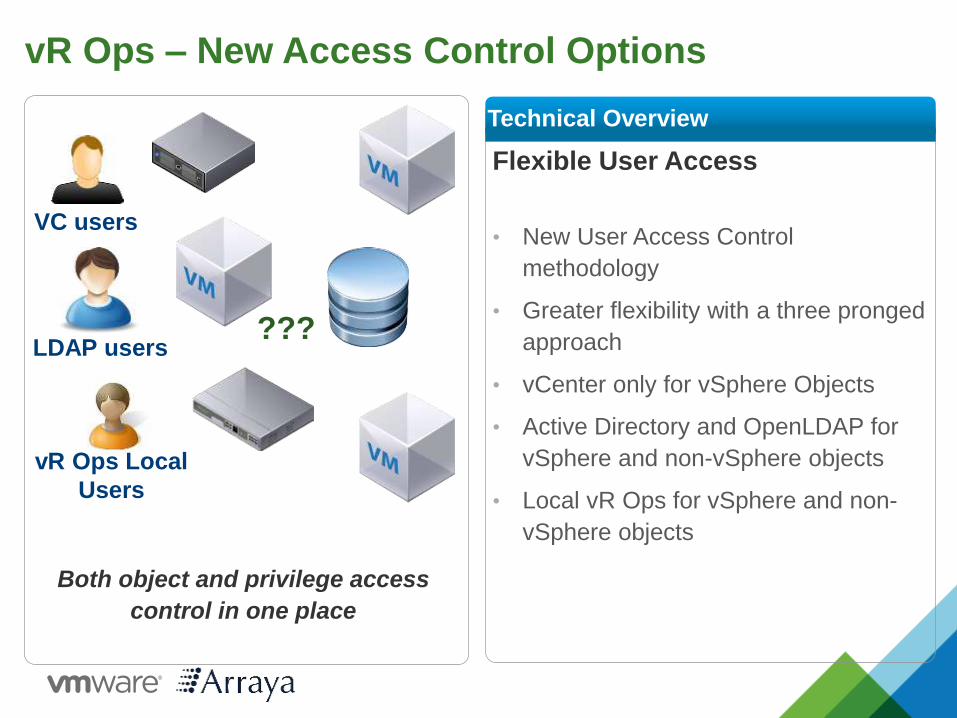
vR Ops – New Access Control Options
Flexible User Access
• New User Access Control
methodology
• Greater flexibility with a three pronged
approach
• vCenter only for vSphere Objects
• Active Directory and OpenLDAP for
vSphere and non-vSphere objects
• Local vR Ops for vSphere and non-
vSphere objects
Technical Overview
VC users
LDAP users
vR Ops Local
Users
Both object and privilege access
control in one place
???
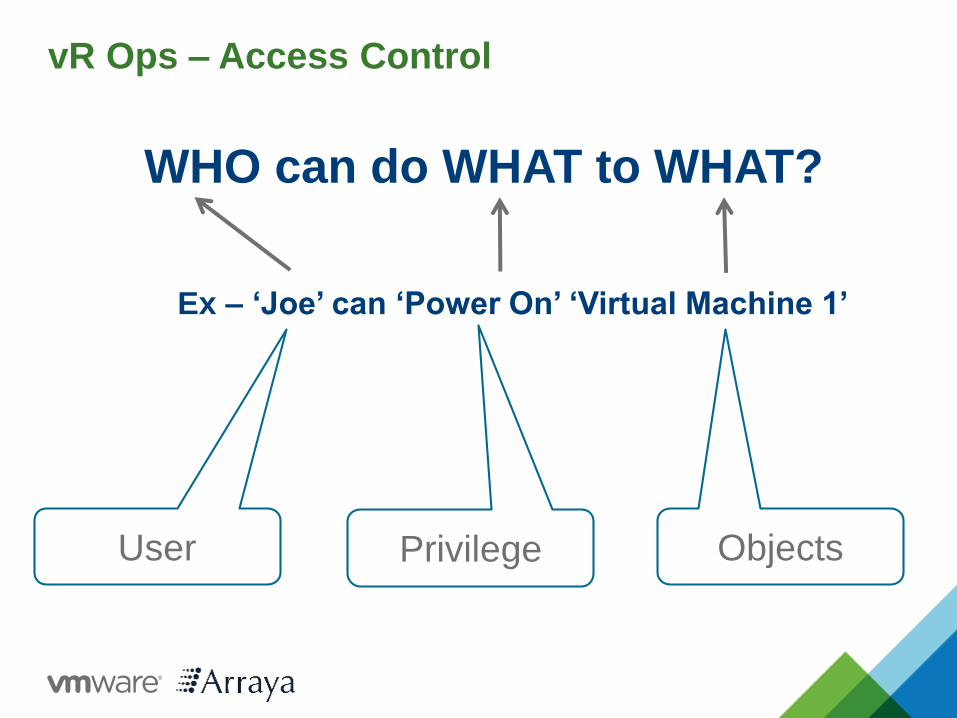
vR Ops – Access Control
WHO can do WHAT to WHAT?
Ex – ‘Joe’ can ‘Power On’ ‘Virtual Machine 1’
User Privilege Objects
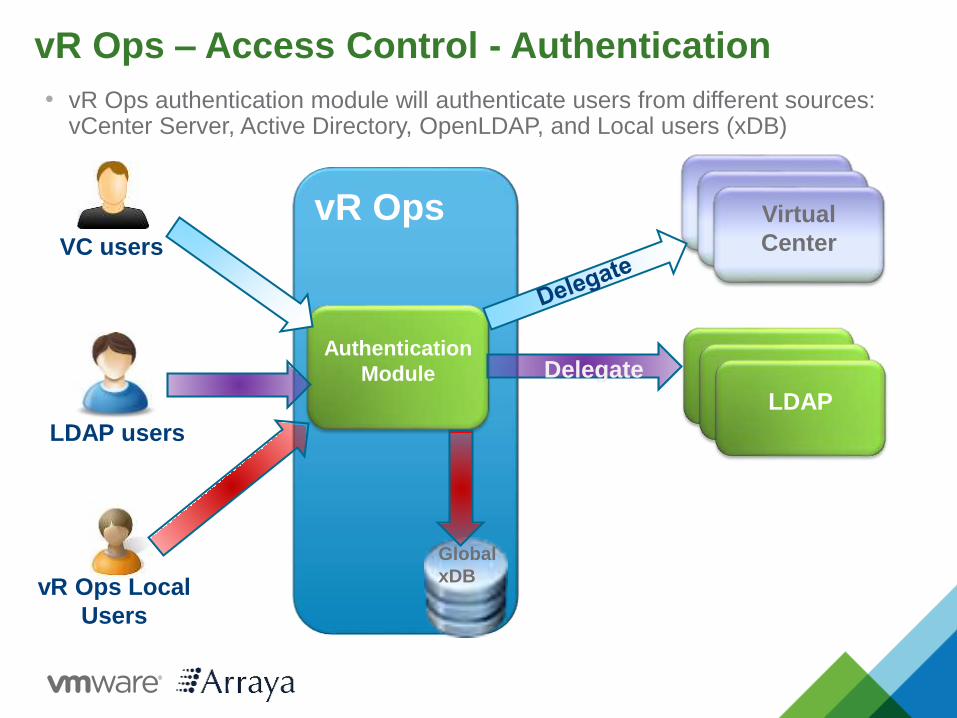
vR Ops – Access Control - Authentication
• vR Ops authentication module will authenticate users from different sources: vCenter Server, Active Directory, OpenLDAP, and Local users (xDB)
FSDB
vR Ops
Authentication
Module
Global
xDB
VC users
LDAP users
vR Ops Local
Users
Virtual
Center
LDAPDelegate
Virtual
CenterVirtual
Center
LDAPLDAP
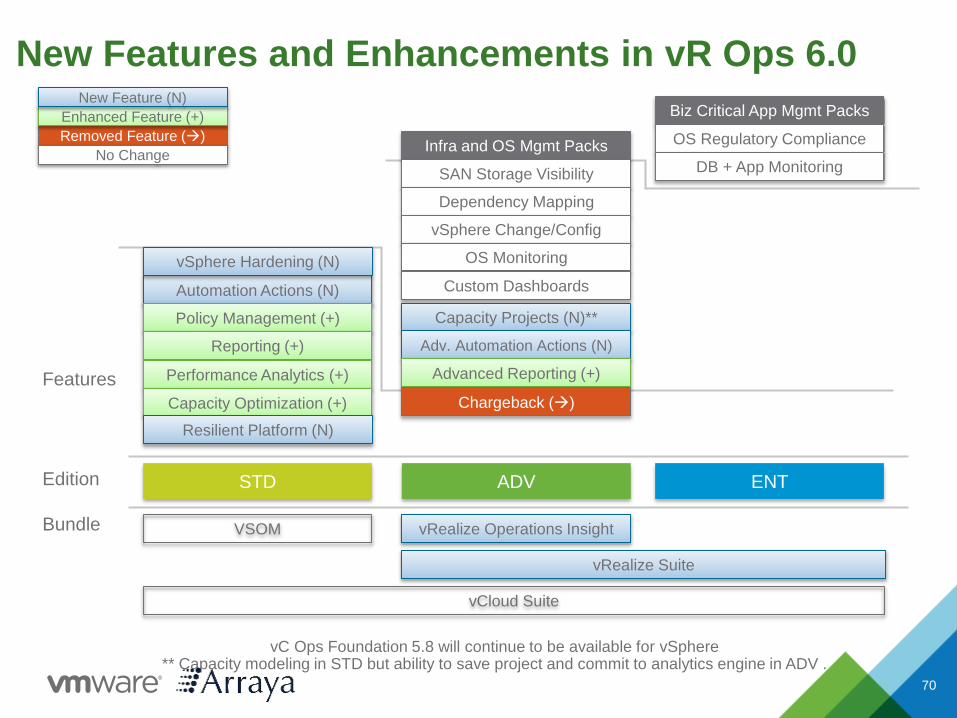
New Features and Enhancements in vR Ops 6.0
70
Automation Actions (N)
Biz Critical App Mgmt Packs
STD ADV ENT
VSOM vRealize Operations Insight
Edition
Bundle
Features
Policy Management (+)
Reporting (+)
Performance Analytics (+)
Capacity Optimization (+)
Infra and OS Mgmt Packs
SAN Storage Visibility
Dependency Mapping
vSphere Change/Config
OS Monitoring
OS Regulatory Compliance
DB + App Monitoring
vC Ops Foundation 5.8 will continue to be available for vSphere** Capacity modeling in STD but ability to save project and commit to analytics engine in ADV .
Custom Dashboards
Capacity Projects (N)**
Adv. Automation Actions (N)
Advanced Reporting (+)
Chargeback ()
Removed Feature ()
Enhanced Feature (+)
New Feature (N)
No Change
Resilient Platform (N)
vCloud Suite
vRealize Suite
vSphere Hardening (N)
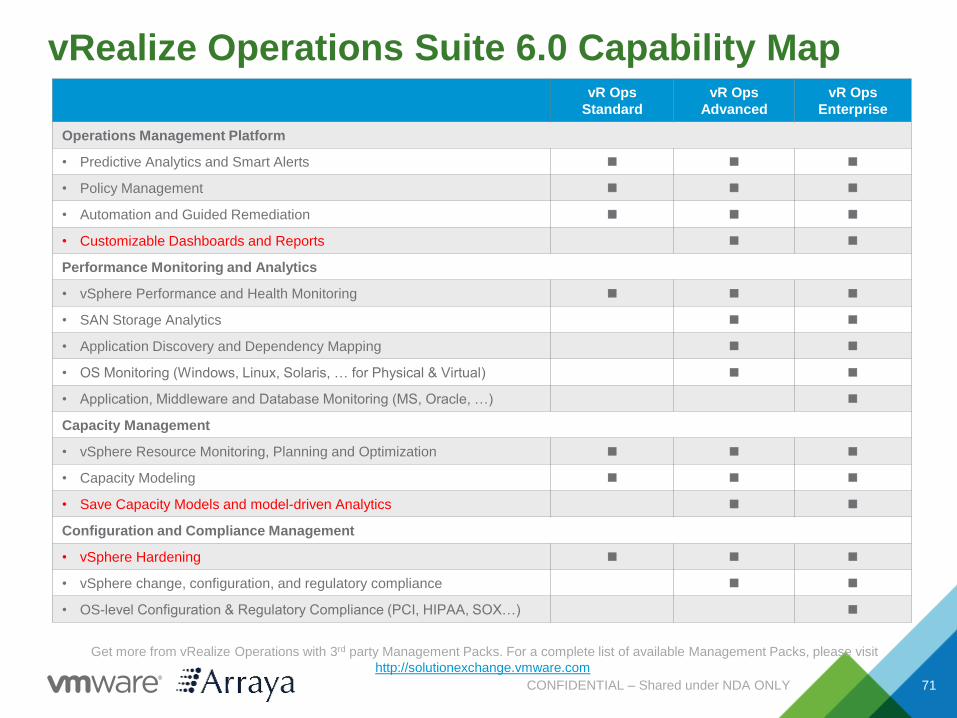
vRealize Operations Suite 6.0 Capability Map
CONFIDENTIAL – Shared under NDA ONLY 71
vR Ops
Standard
vR Ops
Advanced
vR Ops
Enterprise
Operations Management Platform
• Predictive Analytics and Smart Alerts
• Policy Management
• Automation and Guided Remediation
• Customizable Dashboards and Reports
Performance Monitoring and Analytics
• vSphere Performance and Health Monitoring
• SAN Storage Analytics
• Application Discovery and Dependency Mapping
• OS Monitoring (Windows, Linux, Solaris, … for Physical & Virtual)
• Application, Middleware and Database Monitoring (MS, Oracle, …)
Capacity Management
• vSphere Resource Monitoring, Planning and Optimization
• Capacity Modeling
• Save Capacity Models and model-driven Analytics
Configuration and Compliance Management
• vSphere Hardening
• vSphere change, configuration, and regulatory compliance
• OS-level Configuration & Regulatory Compliance (PCI, HIPAA, SOX…)
Get more from vRealize Operations with 3rd party Management Packs. For a complete list of available Management Packs, please visit
http://solutionexchange.vmware.com
New Operations Content
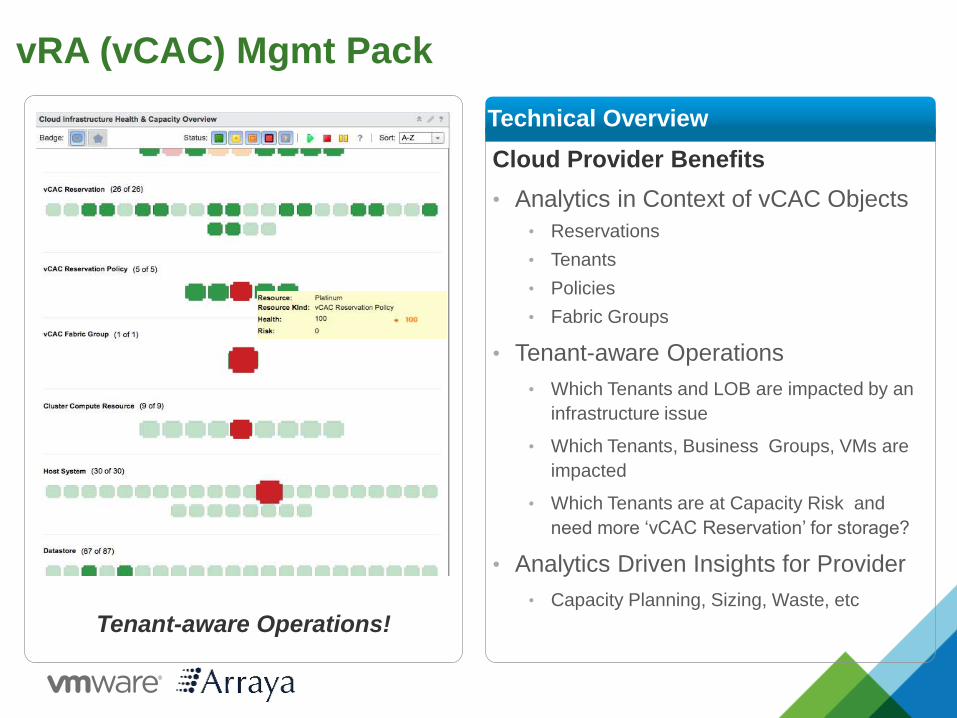
vRA (vCAC) Mgmt Pack
Cloud Provider Benefits
• Analytics in Context of vCAC Objects
• Reservations
• Tenants
• Policies
• Fabric Groups
• Tenant-aware Operations
• Which Tenants and LOB are impacted by an
infrastructure issue
• Which Tenants, Business Groups, VMs are
impacted
• Which Tenants are at Capacity Risk and
need more ‘vCAC Reservation’ for storage?
• Analytics Driven Insights for Provider
• Capacity Planning, Sizing, Waste, etc
Technical Overview
Tenant-aware Operations!
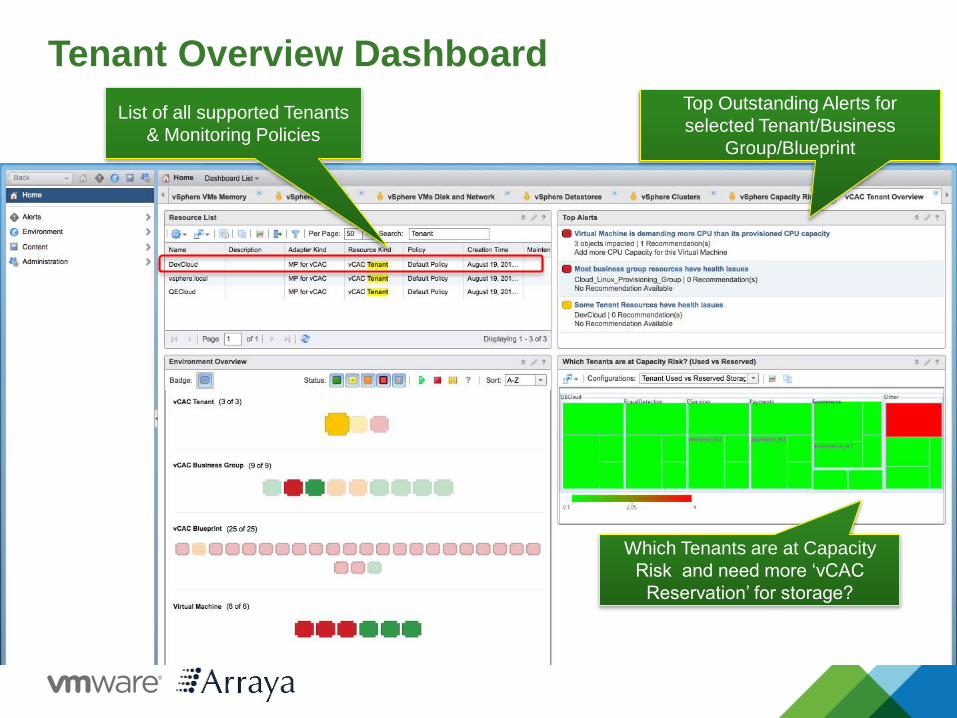
Tenant Overview Dashboard
List of all supported Tenants
& Monitoring Policies
Top Outstanding Alerts for
selected Tenant/Business
Group/Blueprint
Which Tenants are at Capacity
Risk and need more ‘vCAC
Reservation’ for storage?
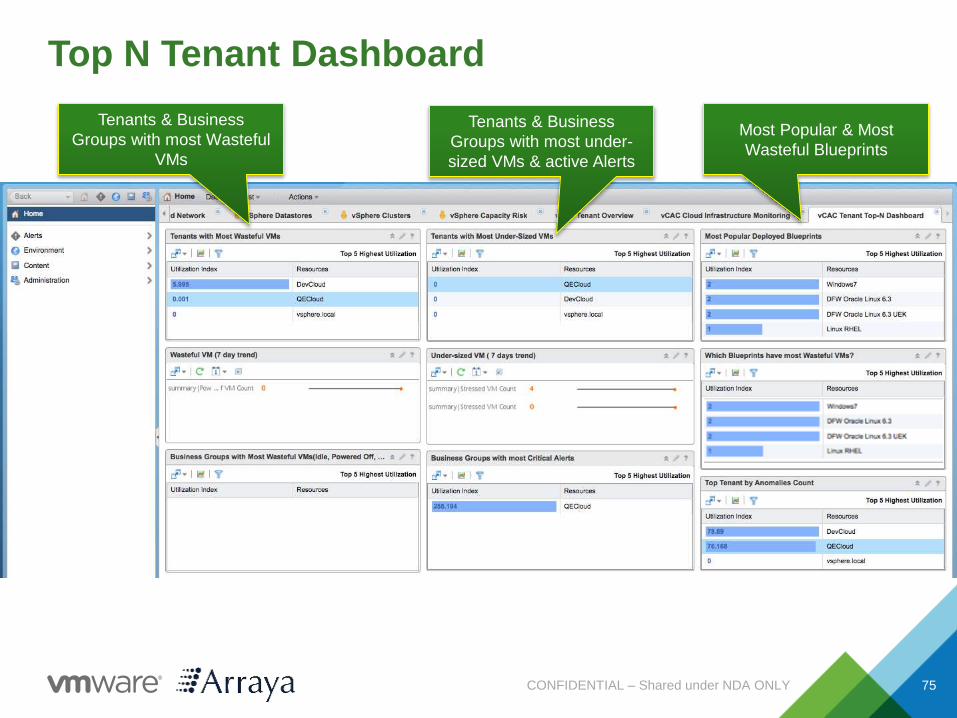
Top N Tenant Dashboard
CONFIDENTIAL – Shared under NDA ONLY 75
Tenants & Business
Groups with most Wasteful
VMs
Tenants & Business
Groups with most under-
sized VMs & active Alerts
Most Popular & Most
Wasteful Blueprints
Thank You