Embed Size (px)
Citation preview

Broadband Market Evolution & Measurement Capability Development
Dr Neil Davies Predictable Network Solutions Ltd
Peter Thompson Predictable Network Solutions Ltd
Martin Geddes
Martin Geddes Consulting Ltd
© 2012 All Rights Reserved
PREDICTABLE
NETWORK
SOLUTIONS

Dr Neil Davies Co-founder, Predictable Network Solutions Ltd
Ex: University of Bristol (23 years).
Former technical head of joint university/research institute (SRF/PACT).
Peter Thompson CTO, Predictable Network Solutions Ltd
Ex: GoS Networks, U4EA, SGS-Thomson, INMOS & Universities of Bristol, Warwick and Cambridge.
Authority on technical and commercial issues of converged networking.
Martin Geddes Founder, Martin Geddes Consulting Ltd
Ex: BT, Telco 2.0, Sprint, Oracle, Oxford University.
Thought leader on future of telecommunications industry.
PREDICTABLE
NETWORK SOLUTIONS

Dr Neil Davies Co-founder, Predictable Network Solutions Ltd
Ex: University of Bristol (23 years).
Former technical head of joint university/research institute (SRF/PACT).
Peter Thompson CTO, Predictable Network Solutions Ltd
Ex: GoS Networks, U4EA, SGS-Thomson, INMOS & Universities of Bristol, Warwick and Cambridge.
Authority on technical and commercial issues of converged networking.
Martin Geddes Founder, Martin Geddes Consulting Ltd
Ex: BT, Telco 2.0, Sprint, Oracle, Oxford University.
Thought leader on future of telecommunications industry.
PREDICTABLE NETWORK
SOLUTIONS
The only ex-ante network performance engineering company in the world.
• New mathematical performance techniques.
• Performance assessment methodology.
• World’s first network contention management solution.
Consultancy on the future of telecoms and the Internet.
• Business model innovation.
• Technology & product ideation.
• Organisation development.
• Public & private workshops.
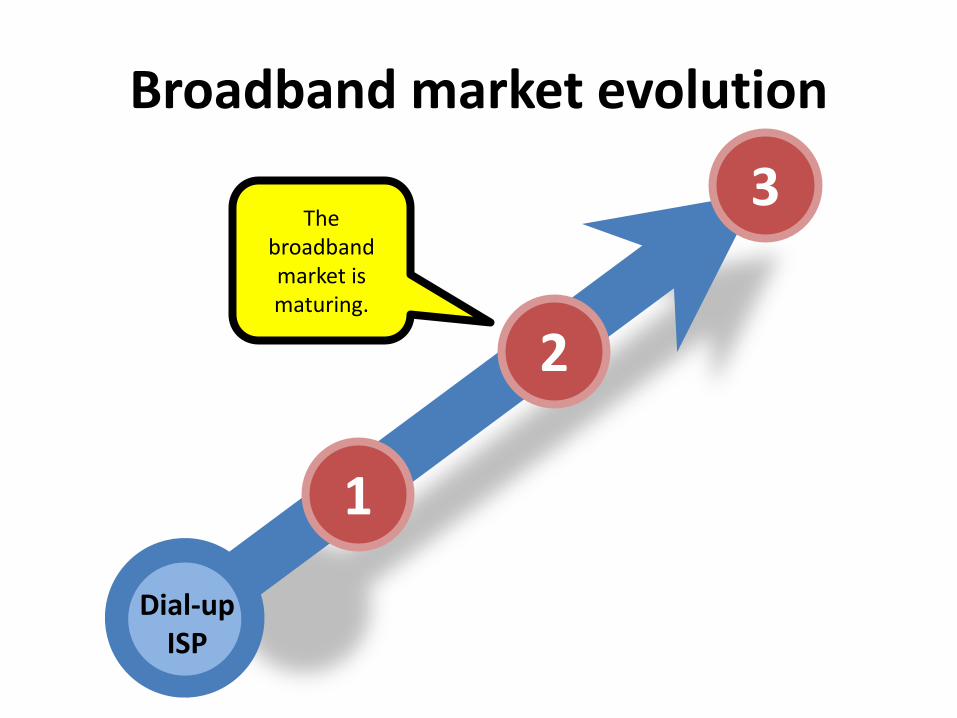
Dial-up ISP
1
2
3
Broadband market evolution
The broadband market is maturing.
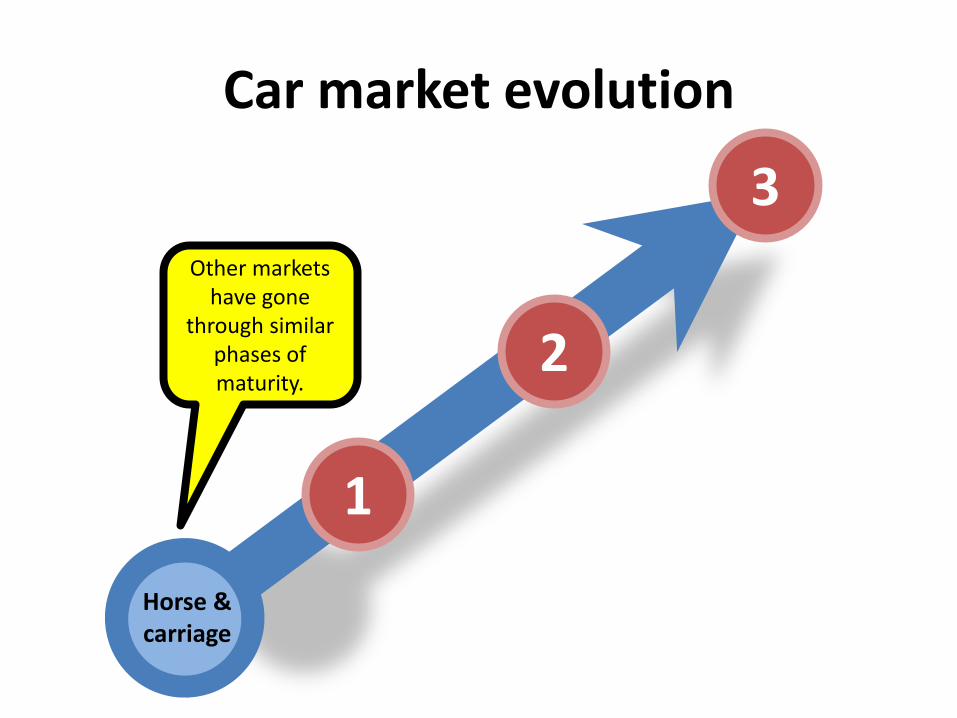
Horse & carriage
1
2
3
Car market evolution
Other markets have gone
through similar phases of maturity.

1
1970s car adverts
emphasised speed.
(Embedded video – click here to view directly.)
The metric of top speed
was easy to define.

2
Then we saw consumer
choice move towards safety.
We developed new crash
test metrics.

3
Today, fuel economy tends to be high up
the list of priorities in
buyers’ minds.
Now we look at grammes of CO2/km.
Dial-up ISP
Broadband market evolution
Let’s look how the broadband
market is maturing
through similar phases.

Dial-up ISP
1
Stage 1: Coverage
At first, everything was
about coverage.
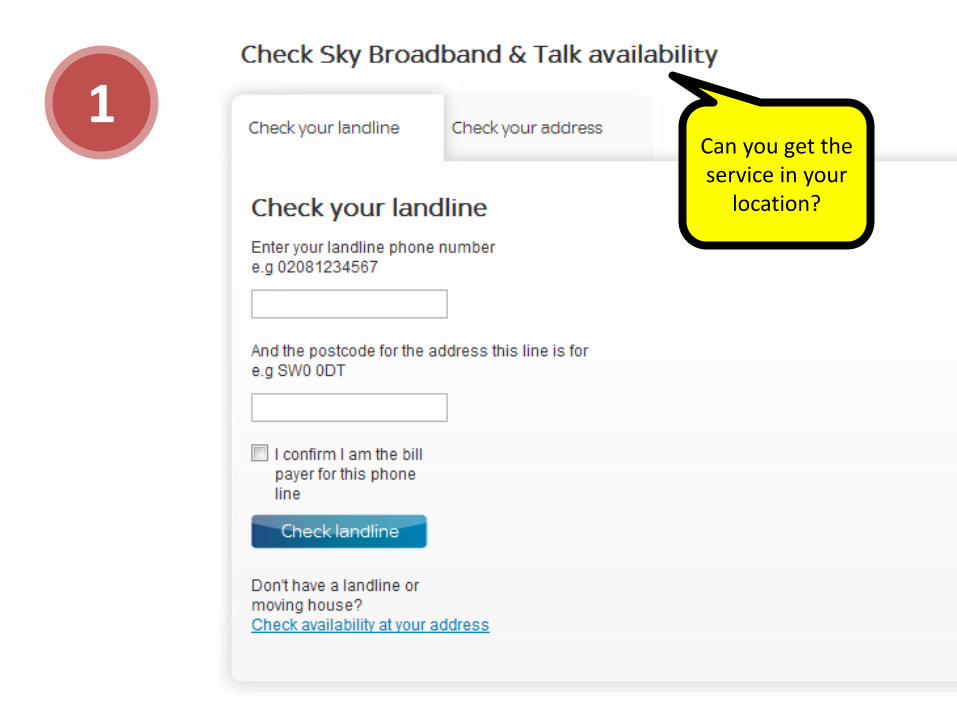
1 Can you get the service in your
location?

Dial-up ISP
1
Increased usage, so rising demand for…
Faster!
Dial-up ISP
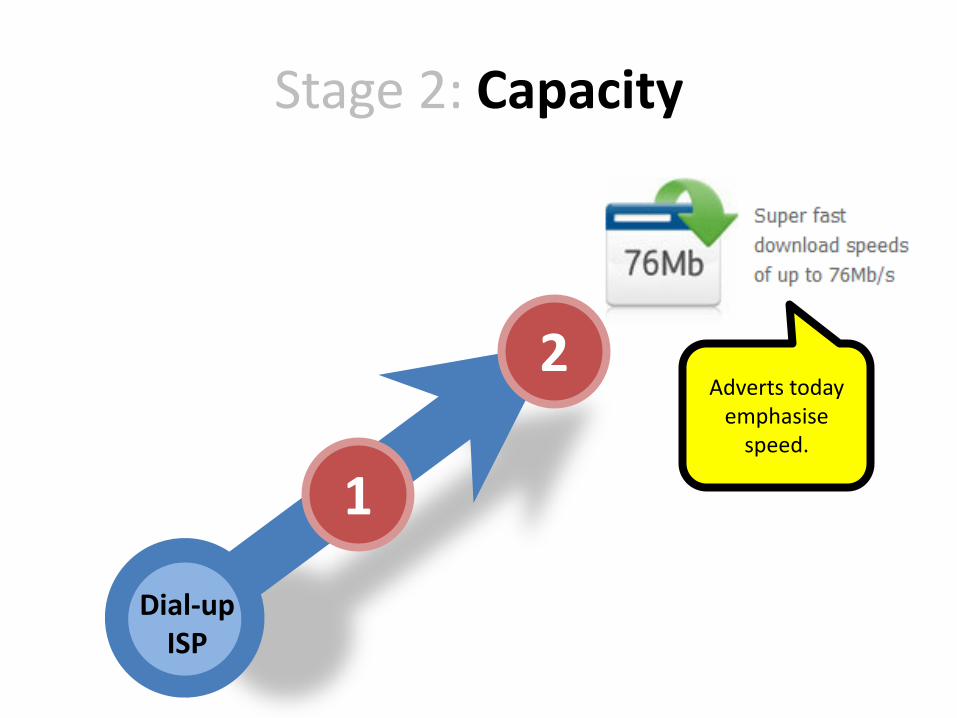
1
2
Stage 2: Capacity
Adverts today emphasise
speed.

2
Speed, speed, speed.
Dial-up ISP
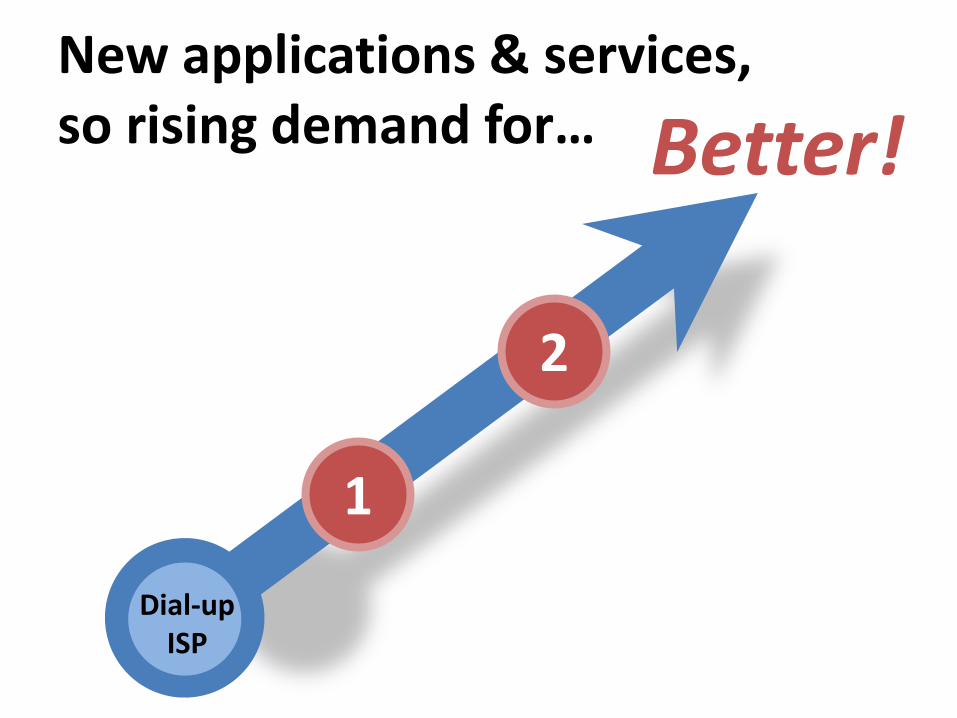
1
2
Better! New applications & services, so rising demand for…
Dial-up ISP
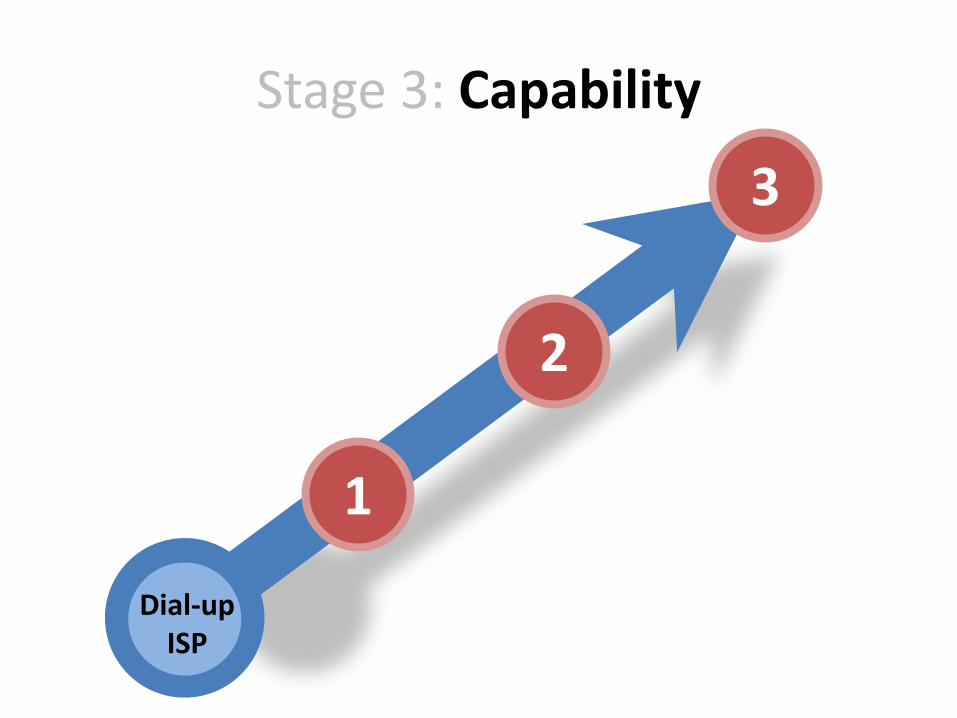
1
2
3
Stage 3: Capability
Capability 3
“Fit-for-purpose
broadband”

3
Megabits per second are easy to measure.
But how do you measure capability?

Today’s market offers don’t give you any of the
right clues.
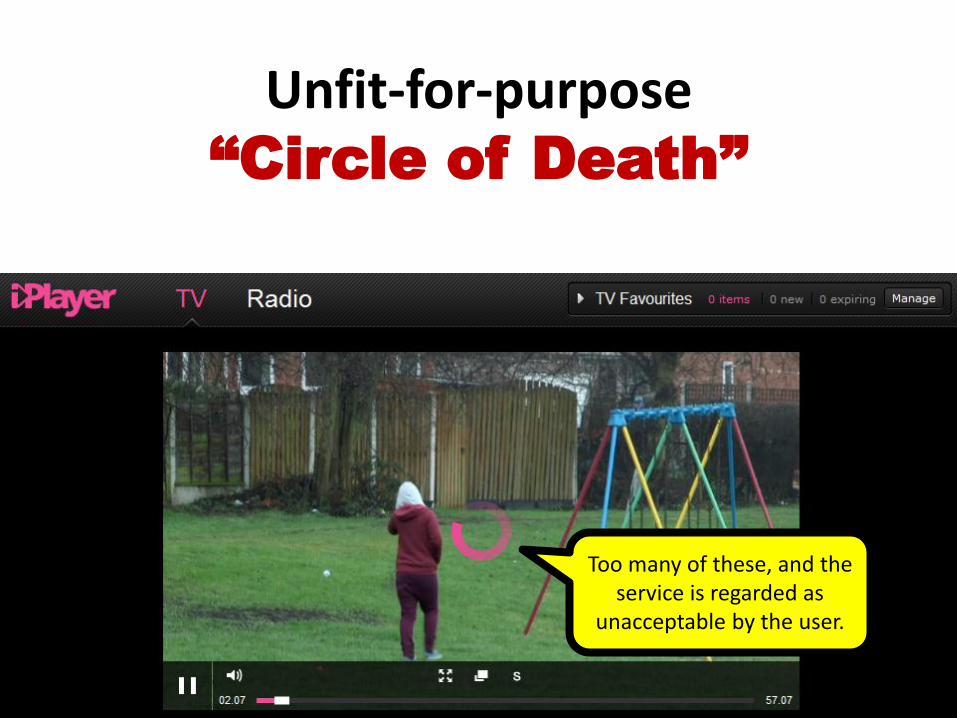
Unfit-for-purpose
“Circle of Death”
Too many of these, and the service is regarded as
unacceptable by the user.
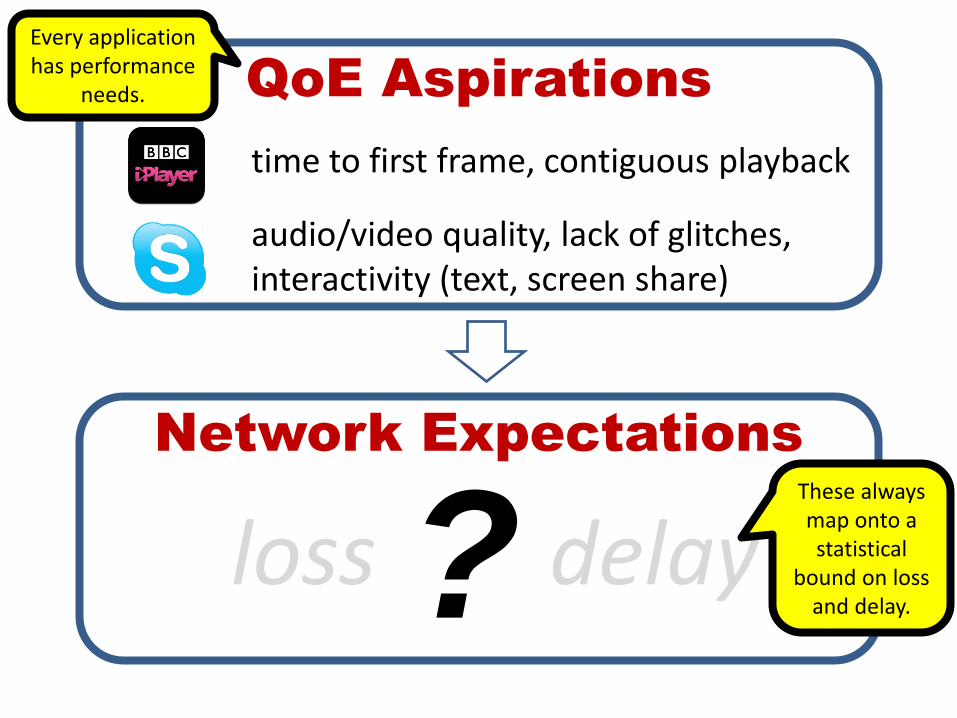
QoE Aspirations
Network Expectations
time to first frame, contiguous playback
audio/video quality, lack of glitches, interactivity (text, screen share)
loss delay ?
Every application has performance
needs.
These always map onto a statistical
bound on loss and delay.
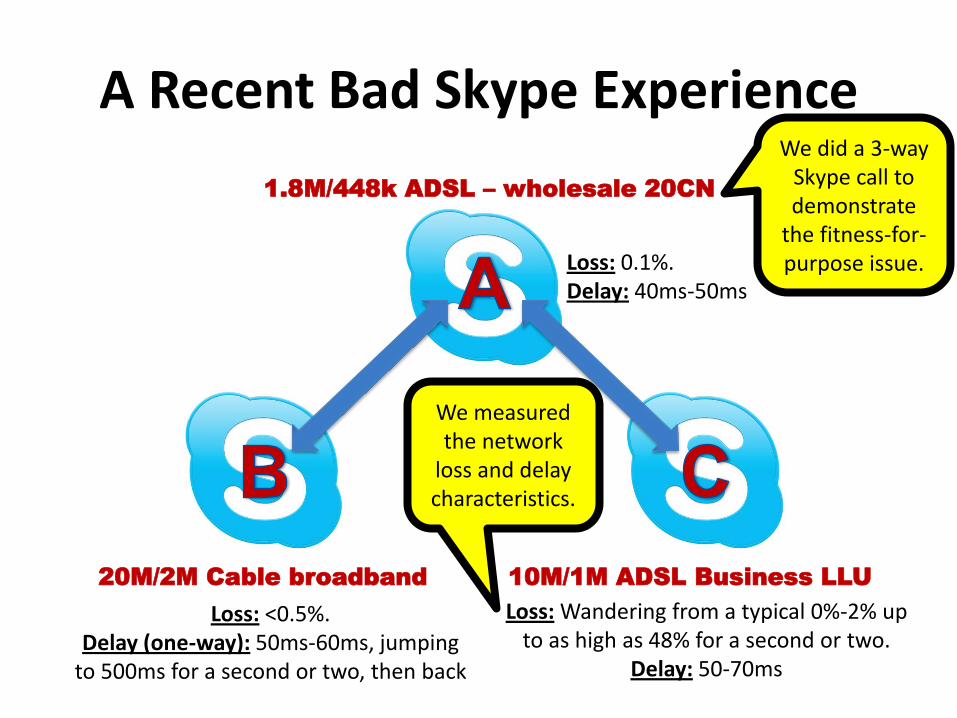
A Recent Bad Skype Experience
20M/2M Cable broadband 10M/1M ADSL Business LLU
1.8M/448k ADSL – wholesale 20CN
Loss: <0.5%. Delay (one-way): 50ms-60ms, jumping
to 500ms for a second or two, then back
Loss: Wandering from a typical 0%-2% up to as high as 48% for a second or two.
Delay: 50-70ms
Loss: 0.1%. Delay: 40ms-50ms
We did a 3-way Skype call to demonstrate
the fitness-for-purpose issue.
We measured the network
loss and delay characteristics.
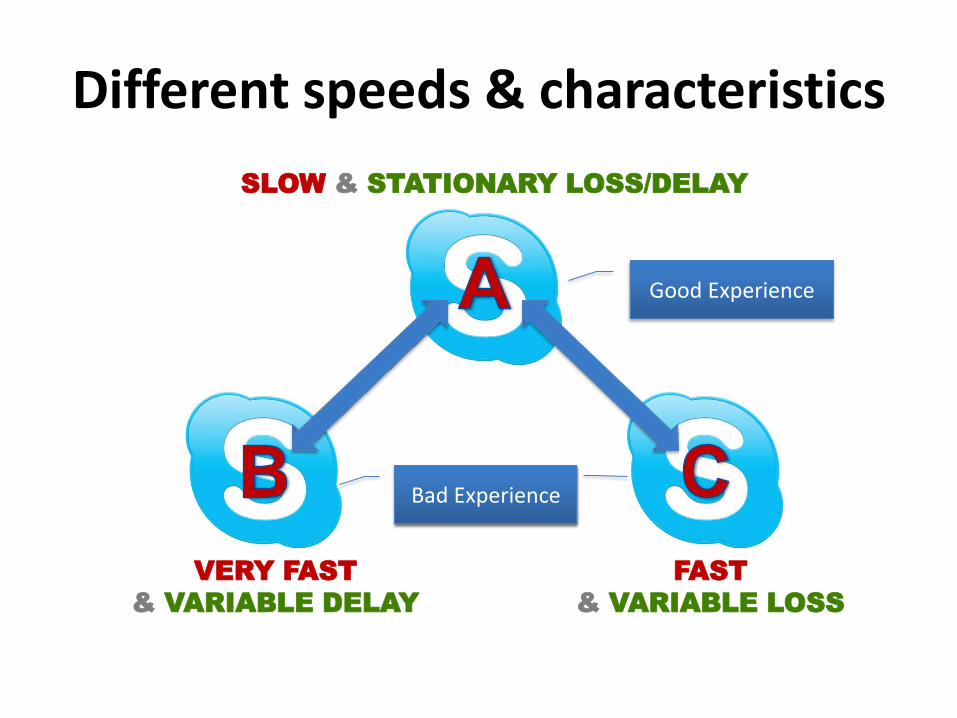
Different speeds & characteristics
VERY FAST
& VARIABLE DELAY
FAST
& VARIABLE LOSS
SLOW & STATIONARY LOSS/DELAY
Good Experience
Bad Experience Bad Experience

Summary: Speed is not the only difference
Bad Skype QoE
SPEED
VA
RIA
BIL
IT
Y
SLOW FAST
LOW
HIGH
Another factor was affecting
outcomes.

Cable Broadband: High speed, just as advertised
Cable user happens to be on SamKnows network measuring
service.
Figures show the average throughput
is as claimed.

Cable Broadband: SamKnows reported AVERAGE delays
Are these statistics averaged over hourly
periods telling the whole story?

Averages hide essential detail
14.49 21.68
14.51
42.63
86.62
13.79
0
20
40
60
80
100
07-May 09-May 11-May 13-May 15-May
De
lay
(ms)
Day
Average Delay (by Day)
Rep
ort
ed b
y Sa
mK
no
ws
133.06
720.28
169.71
668.74
0
200
400
600
800
00:00 04:00 08:00 12:00 16:00 20:00 00:00
De
lay
(ms)
9th May
Average Delay (by Hour)
Rep
ort
ed b
y Sa
mK
no
ws
0
200
400
600
0 10 20 30 40 50 60 70 80
De
lay
(ms)
Per second during call
Delay (during call – afternoon of 9th)
Dir
ectl
y m
easu
red
Delay varying too fast for Skype to
compensate

Quality of Experience: Depends on multiple characteristics
SPEED
STA
TIO
NA
RIT
Y
SLOW FAST
LOW
Fastest connection had the WORST Skype experience
HIGH
Determines the chance that applications can adapt to the network
Determines which applications are feasible
Most stationary connection had the BEST Skype experience
Stationarity is the inverse of variability
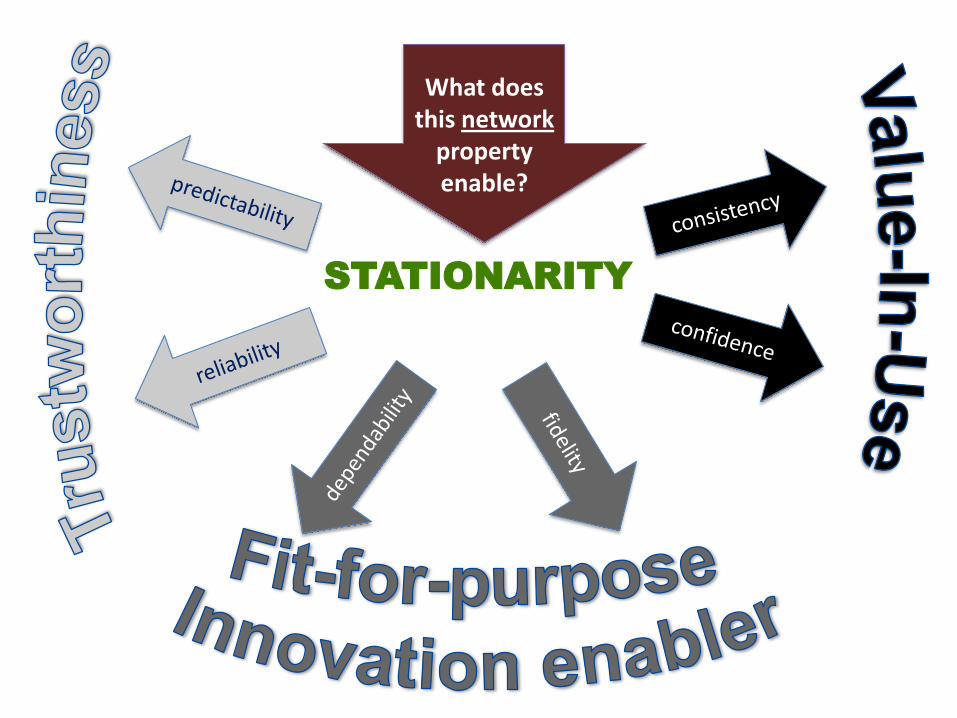
What does
this network property enable?
STATIONARITY

The application
Hierarchy of Need
3. Reasonable bounds on loss and delay
2. Sufficient stationarity
1. Sufficient capacity
Note: exact requirements are application-dependent
We need to evolve our metrics to capture a richer set of capabilities that contribute to
fitness-for-purpose.
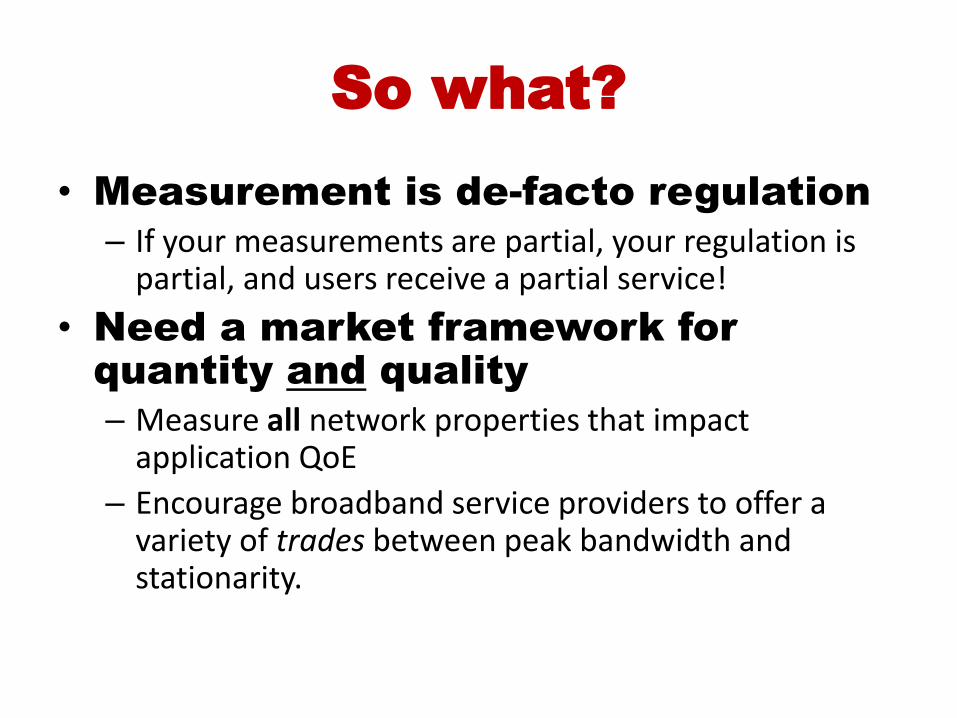
So what?
• Measurement is de-facto regulation
– If your measurements are partial, your regulation is partial, and users receive a partial service!
• Need a market framework for
quantity and quality
– Measure all network properties that impact application QoE
– Encourage broadband service providers to offer a variety of trades between peak bandwidth and stationarity.

What next for regulators?
• Internal education
– Dispel the bandwidth myth
– Raise capability to reason on network quality management
• Measure and report stationarity
– Allow service providers to compete on more than just (peak) bandwidth
• Engage stakeholders in a dialogue on quality
– Raise external awareness and provide forum for collective industry progress
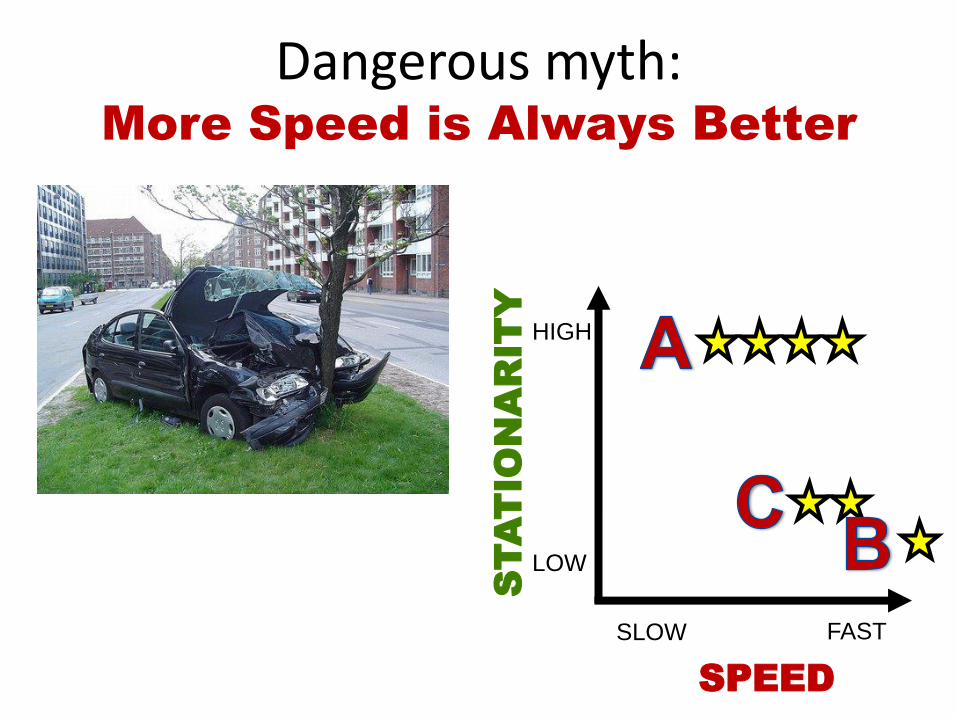
Dangerous myth: More Speed is Always Better
SPEED
STA
TIO
NA
RIT
Y
SLOW FAST
LOW
HIGH

www.martingeddes.com
Free
Future of Communications
newsletter

Neil Davies [email protected]
Peter Thompson [email protected]
Martin Geddes [email protected]
PREDICTABLE
NETWORK
SOLUTIONS