Embed Size (px)
DESCRIPTION
Objective Capital's Rare Earths, Speciality & Strategic Metals Investment Summit 2011Ironmongers' Hall, City of London17 March 2011Speaker: Gerry Clarke, Strategic Metals Expert
Citation preview

RARE EARTHS, SPECIALITY& STRATEGIC METALSINVESTMENT SUMMIT
IRONMONGERS’ HALL, CITY OF LONDON ● THURSDAY, 17 MAR 2011www.ObjectiveCapitalConferences.com
Lithium oversupply?Gerry Clarke – Strategic Metals Expert

Lithium Oversupply?
Rare Earths, Speciality & Strategic Metals Investment Summit
Gerry ClarkeObjective Capital 17 March 2011

Lithium Consumer Awareness
Mood stabilising drugs since the 19th century 1929 lithium citrate a component for a hangover cure
Mundane spectrum of uses
7UpLate 20th century the preferred battery for portable computers,
communications devices & tools
Today – one of the best known elements – consumer goodsFuture -- auto mobility, grid storage, nuclear

Lithium in transition post millennium
Forecasts of prospective automotive demand growth so disproportionate to established lithium markets, exacerbated by ill-informed opinion concerning lithium reserves and resources, spawned wide-ranging commentary as to whether or not there is sufficient lithium available in the Earth’s crust and therefore the capability of the extractive industries to meet growth prospects. Decades of unexciting lithium market dynamics with just a few producers fuelled scepticism and created the conditions that have led to a gold-style “rush” by the industry to prove otherwise. Pain looks an inevitability for many.

Scene SetterPre-2000Through 1990s markets stable, well known, generally unexciting growthSmall batteries for hand held devices and power tools growing demandDuring 1990s supply restructured with entry of SQM in 1996Major shift from minerals in USA to brines in ChileLithium carbonate prices fell 60%: $4,300 (‘95) to $1,600/te (‘99)
Post-2000New markets exciting: automotive, high tech, energy related, greenAlarmist statements made over lithium resource adequacyLithium rush accelerates: today 50 companies support 82 projectsThe four established major producers are all expansionistLithium carbonate prices now in the $4,500-5,000/te range (SignumB) Demand forecasts difficult , range up to 283k tpa LCE in 2020 (Byron Capital)Recycling lithium from batteries 2030s expected to reduce primary demand

What is lithium?
• A highly chemically reactive element not found on Earth in elemental form.
• The commercial world uses the name of the element when talking about the array of lithium resource types, supply and demand.
• Lithium is a very broad term of convenience.

Terrestrial Lithium Occurrence
Sodium Magnesium Potassium LithiumEarth’s Crust (ppm*) 23,000 29,000 15,000 17Sea Water 11,050 1,326 416 0.18
Lithium is the lightest and smallest metallic element. Geochemically, lithium is relatively rare having an average crustal abundance value of just 17 ppmwhich compares with 23,000 ppm for sodium. However, geological processes provide traps for all elements at different stages of crustal evolution which act to concentrate many of them to levels that far exceed their average crustal abundance values. Lithium is elusive until the later stages of geochemical differentiation where it is found trapped in crystalline form in older intrusive igneous rocks, in younger sedimentary sequences, and in solution in naturally occurring brines.
*ppm: parts per million
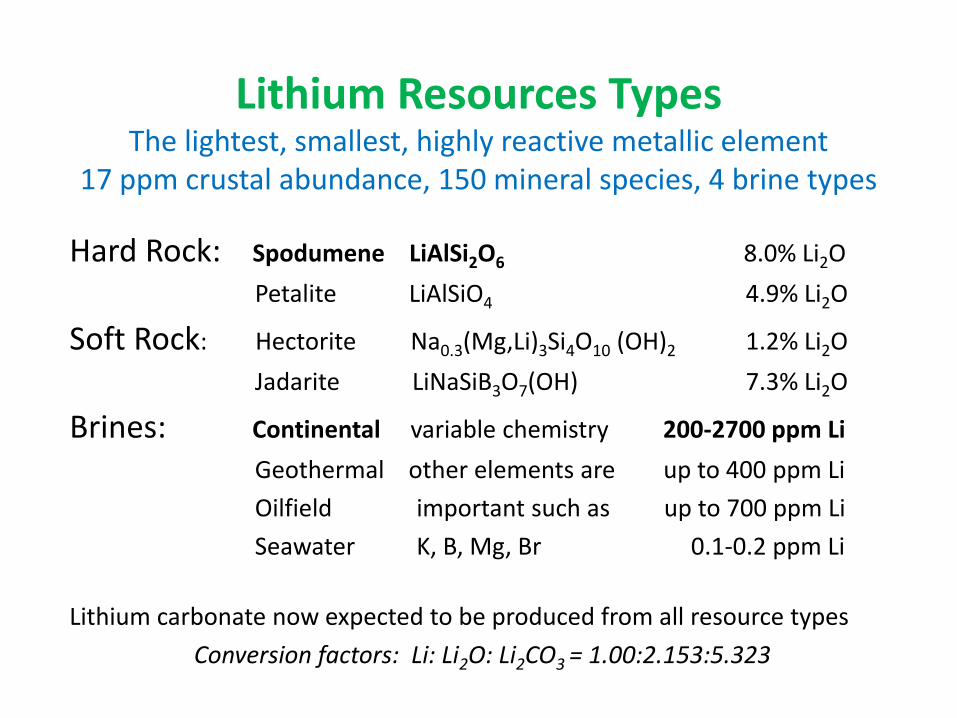
Lithium Resources TypesThe lightest, smallest, highly reactive metallic element
17 ppm crustal abundance, 150 mineral species, 4 brine types
Hard Rock: Spodumene LiAlSi2O6 8.0% Li2O
Petalite LiAlSiO4 4.9% Li2O
Soft Rock: Hectorite Na0.3(Mg,Li)3Si4O10 (OH)2 1.2% Li2O
Jadarite LiNaSiB3O7(OH) 7.3% Li2O
Brines: Continental variable chemistry 200-2700 ppm Li
Geothermal other elements are up to 400 ppm Li
Oilfield important such as up to 700 ppm Li
Seawater K, B, Mg, Br 0.1-0.2 ppm Li
Lithium carbonate now expected to be produced from all resource types
Conversion factors: Li: Li2O: Li2CO3 = 1.00:2.153:5.323

Lithium Resource ProvincesHigh Altitude Continental Plateaus
AmericasPuna Plateau: Argentina salars: Hombre Muerto, Cauchari, Olaroz, Rincon
Bolivia salars: Uyuni, Pastos Grandes
Chile salars: Region II Atacama, Region III various
Clayton Valley: Silver Peak, Nevada, USA
AsiaWestern China & Tibet: Qaidam basin salt lakes, Qinghai , China
Zabuye & Dangxiongcuo salt lakes, Tibet
Green colour denotes lithium producing region

Lithium Resource ProvincesHard Rock Pegmatite Veins
Americas: Canada: Ontario & Quebec
USA: North Carolina (former major production)
Brazil: Minas Gerais
Australia: WA: Greenbushes, Mt Cattlin, Mt Marion
Southern Africa: Zimbabwe: Masvingo, Bikita
Congo: Manono& Kitolo, Katanga
Asia: Eastern China: Sichuan, Hunan & Jiangxi Provinces
Northwest China: Xinjiang Province
South Asian Russia: Tuva, Irkutsk &Chita Republics
Europe: Atlantic: Portugal, Spain, Ireland
Alpine: Austria
Fennoscandia: Finland, Russia (Murmansk, Kola)

The Lithium MajorsContinental Brines ‘000s mtpa LCE
SQM Salar de Atacama, Chile 40.0 (+??)
Chemetall Foote Salar de Atacama, Chile 38.0 (+17)
FMC Corp S Hombre Muerto, Argentina 17.5 (+5.5)
Hard Rock
Talison Lithium Greenbushes, WA 47.0 (+63.0)
Bikita Minerals Masvingo, Zimbabwe 7.5e (??)
Total 150.0
China brines and hard rock could add 100k tpa LCE
Expansions (if all occur) at all majors add another 86k tpa LCE
Add to this near pipeline development/exploration projects --

Automotive Electrification RevolutionA very long time coming as not new
Driven by fear , demographic change, and aspiration: Peak oil production imminent: fossil fuel resource depletionAdverse fossil fuel demographics: national energy security concernAdverse effects of global climate changePollution associated with urbanisation and traffic congestion Mobility aspirations of increasing populations in emerging nations
Structural change transiting from total fossil fuel dependency to mixed dependenciesResource-rich /Battery technology poor: Argentina, Bolivia, Chile, AustraliaResource-poor/Battery technology rich: China, Korea, JapanResource-rich/Battery technology improving: USA, CanadaResource-poor/Battery technology improving: Europe (Germany, France)
National Roadmaps to electrificationCanada: 500,000 evs by 2018; USA: 1m evs by 2015; Australia: 1m evs by 2015; Germany: 1m evs by 2020; S Korea: 1m evs by 2015; China: 1m evs by 2015; Japan: 50% next generation vehicles by 2020 evs: electric vehicles

But, it’s not just auto demand (Byron Capital)
Nuclear Energy: Nuclear reactors controlled through absorption of neutronsLithium occurs as two isotopes: 7.5% 6 Li & 92.5% 7Li – a good neutron absorberSafer smaller nuclear reactors being developed, e.g. Japanese micro RAPID (apartments)RAPID needs 1.9 tonnes 95% 6Li LCE (from 40 tonnes LCE) to produce 200 kW electricityIAEA forecasts 1,000 such reactors in service by 2040 with 1,900 tonnes LCE in themA 1.2 GW reactor, 6,000 times RAPID, testing by 2020: would use 11,400 tonnes LCE
Solar Energy: Due to Li ‘s low melting point (181oC) & high heat capacity (3.6J/gK) Major potential for large scale concentration of solar powerLiNO3 combined with other salts: very low melting toC and very high decomposition toCEnables far higher energy storage characteristics compared with oilsGreenpeace study: modest 5.5 GW, annual installs by 2015: maybe 7,500 tpa LCE
Glass: Adding 0.10-0.17% Li2O to glass mixture saves energy and reduces costsLowers melting temperature by 25oC and energy consumption by 5-10%Total market penetration for worldwide flat glass production of around 50m tpaWould require 48 tonnes of Li2O mostly in mineral form : maybe 119, 000 tpa LCE

Lithium Demand Forecast (after Byron Capital 2011)
‘000 Tonnes LCE 2008 2011 2014 2017 2020 CAAG%
Long established uses: 73% of total market reducing to 42% over 10 yearsGrease, Aluminium, A/C, Casting, Other 52.4 58.9 66.2 74.5 4.2Glass and ceramics 28.9 33.2 38.4 44.4 5.4 Sub-Total 81.3 92.1 104.6 118.9 4.6
High-tech change uses underway: 27% of total market rising to 43%Small Batteries 28.2 35.5 44.7 56.3 10.0Automotive 2.2 15.9 41.7 64.2 28.4Sub-Total 30.4 51.4 86.4 120.5 29.7
Energy related uses waiting to happen: rising to 15% of total market from zero Grid storage 0 2.2 8.4 9.7Solar 0 4.5 8.8 11.0Nuclear 0 0 0.2 22.7Sub-Total 0 6.7 17.4 43.5
GRAND TOTAL 118.6 111.6 150.1 208.3 282.8 14.5

Near Projects in Development
Company Start Location Plan capacity*
Galaxy Resources 2011 Aus/China 17k
Orocobre 2012 Argentina 15k
Canada Lithium 2012 Quebec 19k
Western Lithium 2014 Nevada 27k
Lithium Americas 2014 Argentina 15k
Total 93k tpa LCE
*Company published LCE annual capacity
By 2012 Talison’s Greenbushes, WA capacity will equal 2010 world lithium demand: 110k tpa LCE Reserves: 9.6m. tonnes 3.9% Li20 (920k LCE) M&I Resources :22.0m tonnes 3.7% Li20 (2m LCE)Total resource unknown as open along strike & depth. Update reserves statement June 2011Capacity: 315k tpa spodumene concentrates (47k LCE) going to 740k tpa (110k LCE) June 2012Reviewing potential to establish lithium carbonate plant in AustraliaCourtesy: Talison Lithium, Greenbushes, WA

All Chile lithium reserves: 7.5m tonnes (USGS)
Salar de Atacama, Chile 2,800 square kms

SQM’s final LiCl evaporation pond In 2010 the brine volume (2,700 ppm Li) pumped to produce 1.5m tonnes of potash contained such a large volume of lithium in excess of the 40k tpa LCE capacity that 400k tonnes LCE were reinjected into the aquifer.

Pipeline Lithium ProjectsTraditional Resource Types
Continental Brines ProjectsOrocobre Salar de Olaroz, Argentina Toyota Tsusho 15k* 2012Rincon Lithium Salar de Rincon, Argentina 1.5k 2011Lithium One Salar de Vida, Argentina KORES/GS Caltex/LG ? ? Lithium Americas Salar de Cauchari, Argentina Magna, Mitsubishi ? ?Comibol Salar de Uyuni, Bolivia KORES pilot 480 ?
Hard Rock ProjectsGalaxy Resources Mt Cattlin, WA Mitsubishi/ 17k 2011
Chinese Cathode MakersNemaska Exploration Tianqi 25kCanada Lithium Val d’Or, Quebec Mitsui 20k 2012/13Nordic Mining Lantta, Finland 4k 2011/12
NB: Scores of other exploration/early development projects down the list roughly evenly split between brines and minerals *tpa Li2CO3

Brines or Mines for Li2CO3
Brines MinesCapital Expenditure Lower HigherUnit production cost Lower HigherGrade Lower/Variable Higher/ConsistentRecovery Lower HigherDeposit geology Highly variable More predictableMineral chemistry Highly variable PredictableBy-product credits Large potential Some potentialProduction lead time Longer (harvesting) Shorter (mining)Ease for expansion Resource dependent Resource dependentProcess complexity Variable – chemistry Est physical/chemical

Different Strategies Apparent Talison Lithium: 25 years as a WA lithium miner in WA Began trading on TSX September 2010
September 2010, stepped into brines by merger with Salares Lithium Inc. Greenbushes, WA: world’s largest and highest grade (3.9% Li2O) spodumene deposit Present Greenbushes expansion designed for further expansion and increased recoverySalares 7 Project: Atacama Region III, Chile; started drilling 2 of 7 brine lakes February 2011 Completed scoping study for Li2CO3 plant W.A. -- potential opex of $US2,800/tLCE indicatedTalison strategy of being in mines & brines: two-pronged strategy for long term & credibility
Galaxy Resources: New WA miner, late 2010 Postponed Hong Kong IPO indefinitely (14/03/11)
Mt Cattlin, WA: Ore grade 1.1% Li2O, 137k tpa spodumene concentrates Commissioning 17,000 tpa Li2CO3 plant Zhangjiagang Port, Jiangsu Province, 2nd qtr 2011 Acquired 20% in Lithium One’s James Bay spodumene project, 11.75m M+I, 1.3% Li2O Galaxy focussed on mines and Li2CO3 plant in China
NB: As Galaxy ramps to 137k tpa concs (2011), Talison expands to 315k (‘11) &740k tpa (‘12)

Novel Lithium Resource Developments
BrinesOilfield: Canada, Alberta: Leduc/Beaverhill Form’s: Channel Resources
Recovery of Li, Br, B, K from hydrocarbon well watersUSA, Mid-West: Smackover Formation
Geothermal : USA, Salton Sea, California: Simbol Materials initiatedProduction of Li2CO3 (99.999%) & Mn, Zn from geothermal plants
Seawater: South Korea, POSCO5-year plan to establish 20k-100k tpa C plant by 2014
Soft sedimentary rocksHectorite: USA, Kings Valley, northern Nevada: Western Lithium Corp
27.7k tpa LCE, 11m. tonnes LCE history reserve*, 2014 commission Jadarite: Serbia, Jadar Valley: Rio Tinto Exploration
New mineral, 114m. tonne inferred, 13.1% B2O3, 1.8% Li2O, 2016

Lithium Reserves & Resources (USGS 2011)
Resources of which Reserves (tonnes Li)Argentina 2,600,000 850,000Australia 630,000 580,000Bolivia 9,000,000 -Brazil 1,000,000 64,000Canada 360,000 -Chile 7,500,000+ 7,500,000China 5,400,000 3,500,000Congo 1,000,000 -Portugal - 10,000Serbia 1,000,000 -USA 4,000,000 38,000Zimbabwe - 23,000Total 32,490,000 12,565,000 contained elemental LiNB: Refer US Geological Survey (USGS) for resource and reserve definitions

PrognosisProjects in Argentina, Australia, Bolivia, Canada, China, Finland, Serbia, USA announced cumulative target tonnages of at least 228k tpa LCE. Others such as Lithium One in Canada and Argentina, and Lithium Americas in Argentina set to join the list.
Three of the four majors combined 102.5k tpa LCE capacity increasing to 188k tpaLCE by 2020. SQM’s intent, to sustain market share, implies at least 268k tpa.
Adding pipeline projects takes combined capacity towards 380k tpa LCE & beyond all 2020 demand forecasts: Byron Capital: 283,000 LCE. TRU Group: 245,000 tpa LCE
A widening lithium supply-demand gap by 2020 looks set for around 100k tpa LCE
Other longer term lithium exploration projects part of broader portfolios including Au, Ta, Nb, U, REMs, PGMs, add market value and the stock of resource knowledge for future benefit. Market play profits versus longer term resource knowledge need.
Fall-out from 82 “lithium projects” would appear inevitable in today’s supply demand scenario but a sceptical world is being shown that there are substantial lithium resources to partner technological change before lithium recycling kicks in around 2035.

Arguments for supply diversityWhat is the reality for majors’ production and expansion?• Lead times for new pond build, processing expansion,
pumping and concentration time to 6% Li2O: 4-5 years?Supply diversification• Corporately -- away from oligopoly• Geographically -- South America and Australia• National strategic dimension encouraging resource IDTwo broad geographical markets• East Asia: China increasing demand to feed under capacity
Japan & South Korea • Rest of the World: Resource type: brines variable & unpredictable in nature

March 2011 Developments “from left field”Orocobre, Olaroz, Jujuy Province, Argentina
A new decree, in addition to EIS approval, announced: Exploration and exploitation level projects will now require assessment by a Committee of (7) Experts and, following a positive recommendation from this Committee, approval by the joint resolution of the Minister of Production and the Secretary General of the Provincial Government.
Orocobre has two projects in Jujuy, one with EIS approval and one in submission, and a third in neighbouring Salta Province. The company expects to win approval in close cooperation with Jujuy Province
Rodinia Lithium has distanced itself from the new decree reminding investors of its two flagship projects in Salta Province (Salar de Diaballos) and Clayton Valley, Nevada. Rodinia has Salinas Grandes, Jujuy

March 2011 Developments “from left field”Nemaska Exploration closes $3.7m. private placement
with Chengdu Tianqi Industry group March 2011
Heralded last year but closed this month was “new boy” NemaskaExploration clinching a deal with China’s leading lithium battery chemical producer Sichuan Tianqi Lithium Industries Inc.
Tianqi converts spodumene concentrate , imported mainly from Australia , to produce Li2CO3 (& others) and, through subsidiaries, has a significant share of the Chinese lithium market.
Tianqi policy to diversify sources of supply – anecdotally spooked by W.A.’s now rescinded 40% mineral project tax last year.
Tianqi now looking to markets outside China and longer term potential for Tianqi to establish conversion plant in Canada.

March 2011 Developments “from left field”Canada Lithium undertaking compliant resource audit
Following internal review indicating a material reduction in the measured, indicated and inferred mineral resources incorporated in its Oct. 28, 2010 43-101-compliant report *, Canada Lithium appointed Roscoe Postle and Associates Inc. to undertake a preliminary independent review of its previously announced mineral resources.
The review will take a couple of weeks but the ensuing audit is expected take a number of months. Engineering and design continues. The current mine plan, developed on the basis of the Oct. 28 20101 compliant report*, will be reviewed following the review/audit.
*M+I Resources: 46m tonnes grading 1.19% Li2O Inferred Resources: 57m. Tonnes grading 1.18% Li2O
To early to know whether or not the required review/audit may delay Canada Lithium from becoming Canada’s first lithium mine into production in 2012
Thank You
Keith Evans
Ihor Kunasz
Pedro Pavlovic
Roskill Information Services
Daniela Desormeaux at SignumBox
Many other individuals