Embed Size (px)
Citation preview

NOPARROTS.COM DRUPAL TRAINING
MINI CASE STUDY:
BUILDING GRAPHS IN DRUPAL
BY USING RULES, CONTENT PERMISSIONS, VIEWS GROUPING AND VIEWS
CHARTS CHARTS AND INTEGRATING WITH APACHE SOLR
Instructor: Sidharth Kshatriya
Twitter #noparrots
Video tutorial available at Video tutorial available at Video tutorial available at Video tutorial available at
httphttphttphttp://www.noparrots.com/content/mini://www.noparrots.com/content/mini://www.noparrots.com/content/mini://www.noparrots.com/content/mini----casecasecasecase----studystudystudystudy----creatingcreatingcreatingcreating----aaaa----barbarbarbar----chartchartchartchart----inininin----drupaldrupaldrupaldrupal
NoParrots.comINTRODUCTION
� Project Content Type
� Cost Field e.g. Rs. 400 Million, 300 Million
� Want to classify the costs in three categories
� < 100 million rupees
� >= 100 million and <= 200 million rupees
� > 200 million rupees
� Want the classification to happen automatically
� Do this by using “Rules” module
� Hiding the classification field using “Content Permissions” module
NoParrots.comBUILDING A TABLE
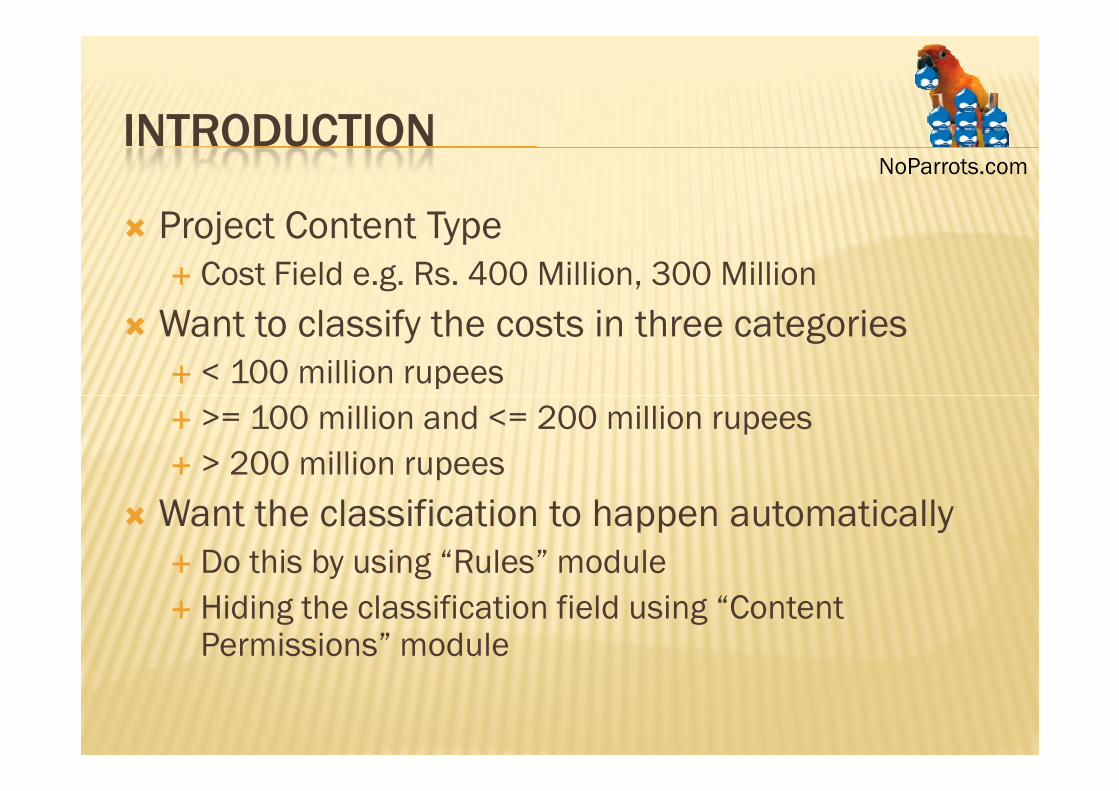
� Build a table using Views Group By
CostCostCostCost NumberNumberNumberNumber of Projectof Projectof Projectof Project
Less than 100 million 2
Between 100 and 200
million
3
Greater than 200 million 1
NoParrots.comGRAPHING
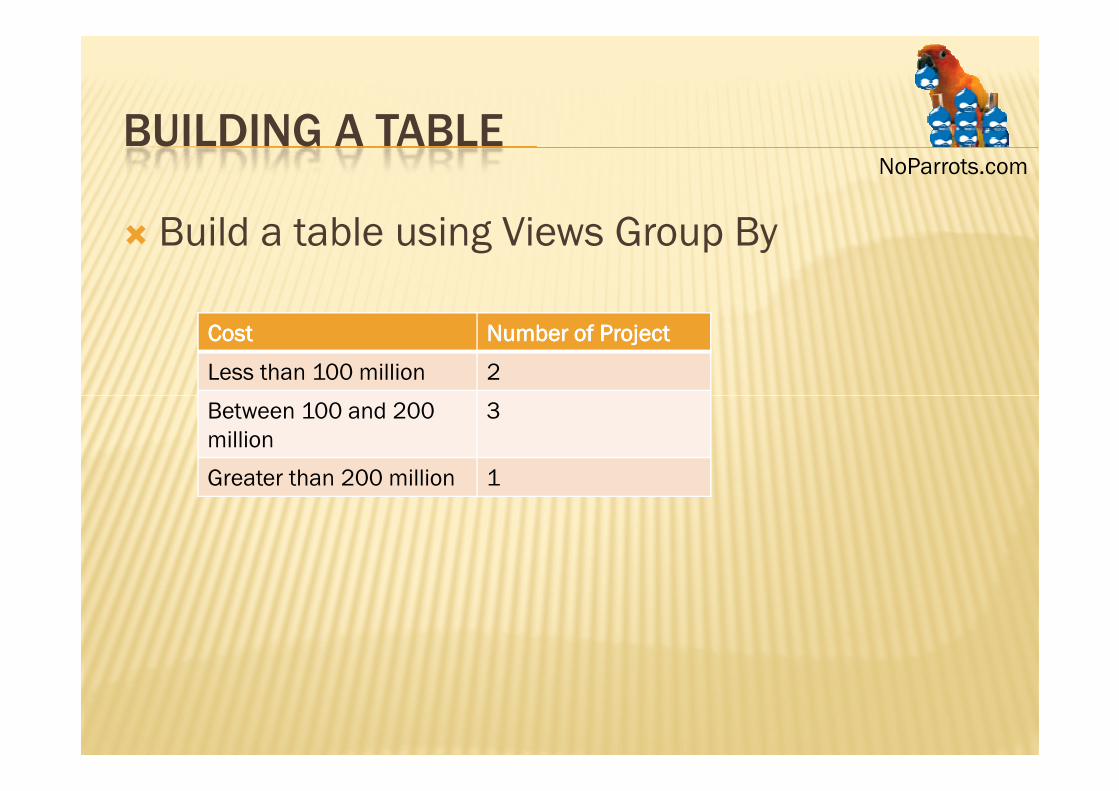
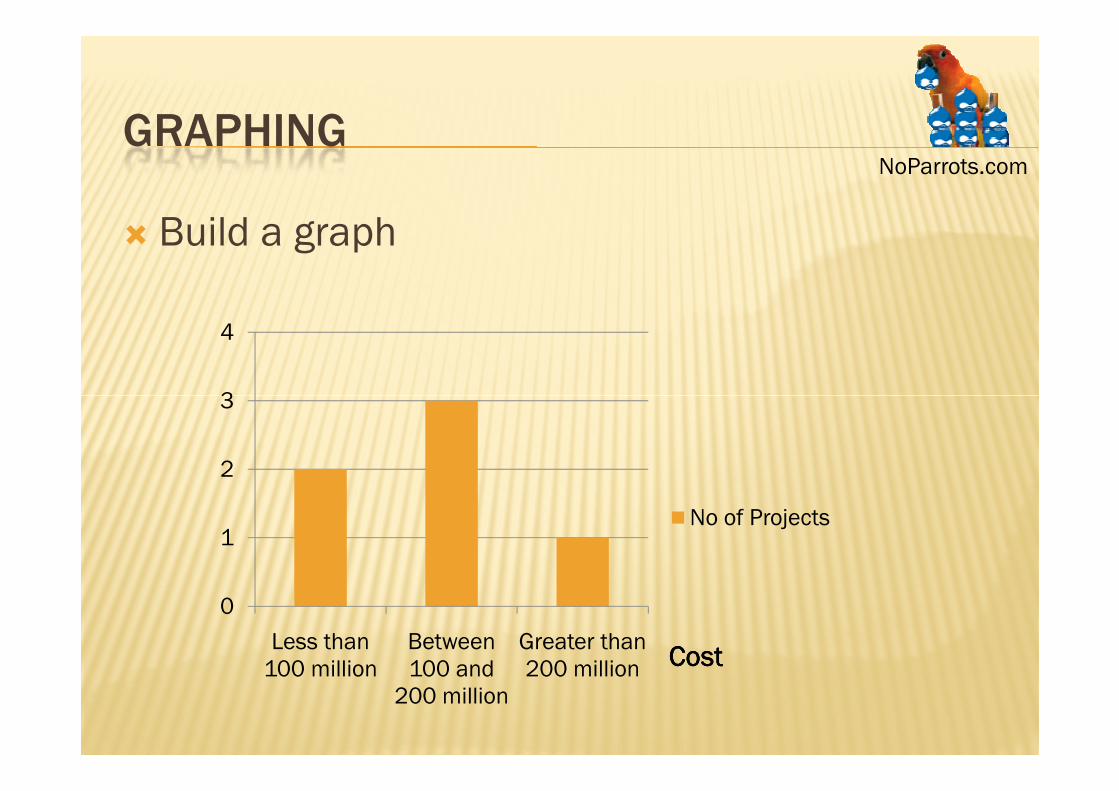
� Build a graph
3
4
0
1
2
3
Less than 100 million
Between 100 and
200 million
Greater than 200 million CostCostCostCost
No of Projects
NoParrots.comAPACHE SOLR
� Being able to search for these projects under
these categories using Apache Solr
� These categories should be available as facets
NoParrots.comPRE-REQUISITES
� Modules Required
� Content Permissions (bundled with CCK module)
�Rules (rules)
� SWF Tools (swftools)� SWF Tools (swftools)
� Views (views)
� Views Charts (views_charts)
� Charts and Graphs (charts_graphs)