Embed Size (px)
Citation preview

1
© 2012 AIRCOM International Ltd
Public Safety Broadband Demonstration - Broomfield, CO March 7, 2012
Service Assurance – Performance Management Challenges
Steve Bowker – AIRCOM CTO [email protected]
2 © 2012 AIRCOM International Ltd
Introduction to AIRCOM International AIRCOM is a leading independent provider of end-to-end software products and
consulting services designed to plan, manage and optimise mobile networks
Global market leader in mobile Network Planning, Optimisation and Performance Management (PM) solutions
Recognized and Trusted Industry Expert across all major radio and core technologies including GSM, CDMA, UMTS, WiMAX and LTE
350+ mobile operator customers in 135+ countries including product and service deployments with all of the top 20 largest global mobile operators
Software Consulting Services
Core Capabilities
Strategy and Technology Planning
Network Design and Planning
Spectrum Re-farming Solutions
Vendor Management
Roll-out Management
Optimisation and Audit Services
Network operations outsourcing
Core Capabilities
Market Leading Radio Planning Tool – AIRCOM ASSET
Highly scalable, flexible Mobile Network Performance Management – AIRCOM OPTIMA
Integrated RAN/Backhaul Planning and Optimisation/Dimensioning capabilities
Multi-Technology / Multi-Vendor tools, already Interfacing to all leading equipment
3 © 2012 AIRCOM International Ltd
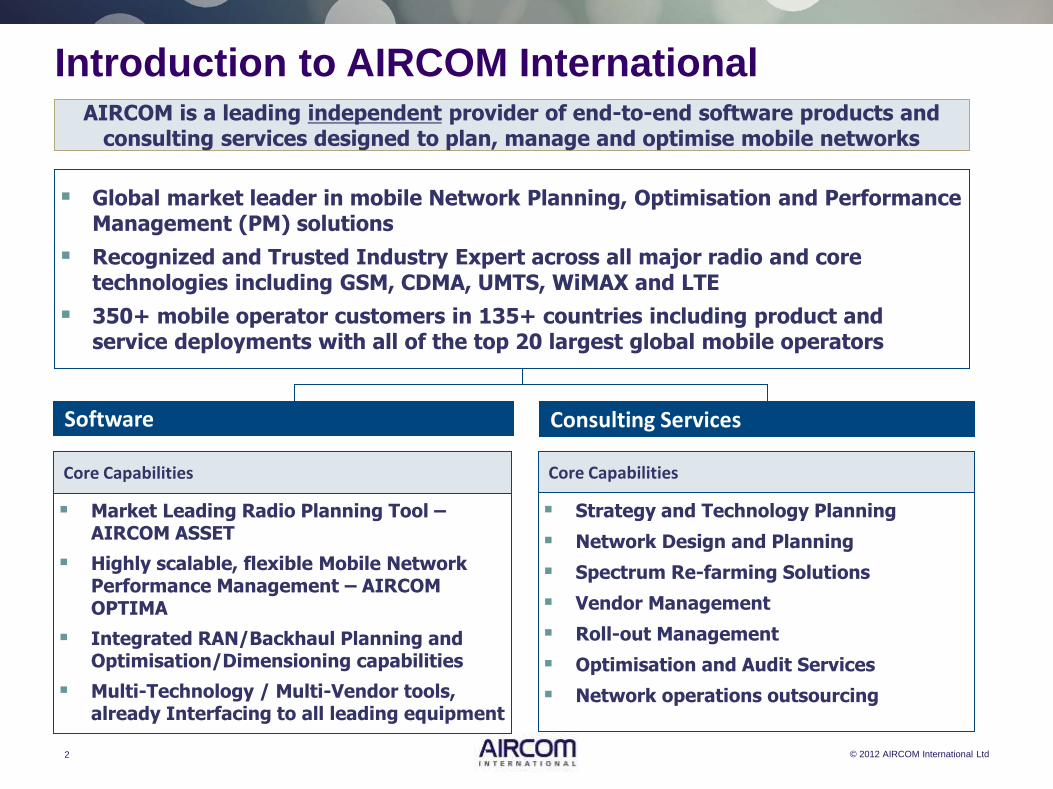
AIRCOM Trusted Advisor to Operators for LTE/SON
AIRCOM selected for Technology Evaluation and during first LTE deployments
Executed LTE Field Trials and facilitated NEP supplier evaluation for Tier 1 USA mobile network operator (MNO)
Performed interworking study for USA Tier 2 LTE network
LTE versions of our software tools are commercially deployed at over 20 MNOs
Our consultancy services have been used to deliver LTE solutions across 3 continents NA, EU & APAC Figure: AIRCOM Field Trial Evaluation Framework used for Tier 1 USA MNO
4 © 2012 AIRCOM International Ltd
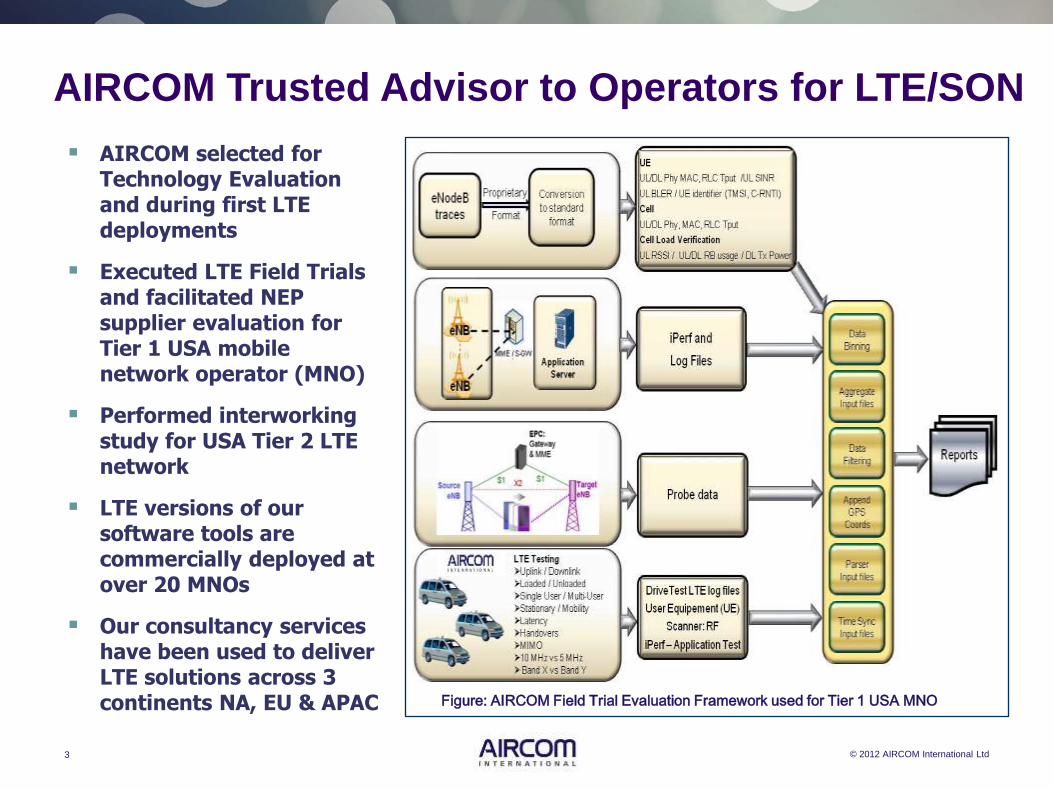
LTE Technology Lifecycle
Technology
assessment
Network
dimensioning
Capacity and
investment
planning
Initial RAN
planning
Core network
Dimensioning
Site acquisition/
friendly sites
Final radio
planning
Design
optimisation
Core and
transmission
design
Initial parameter
configuration
Commissioning
Pre-launch
optimisation
KPI definition
Build capacity
Post- launch
optimisation
Performance
analysis
Network
operation
Optimisation &
expansion
Emergency
Planning
1 2 3 4 5 6
ASSET
CONNECT
I-VIEW DIMENSION
ASSET
CONNECT
I-VIEW DIMENSION
ASSET
CAPACITY
ANALYSIS
CONNECT
I-VIEW DIMENSION
OPTIMA
OPTIMA
I-VIEW LIVE PLAN
CARRIED TRAFFIC
ANALYSIS
ASSET
CONNECT
I-VIEW DIMENSION
OPTIMA
I-VIEW LIVE PLAN
CARRIED TRAFFIC
ANALYSIS
ASSET
CONNECT
I-VIEW DIMENSION
I-VIEW SON
LTE Strategic
Consulting
Competence
Development
LTE Strategic
Consulting
LTE Design
Consulting
Competence
Development
LTE Strategic
Consulting
LTE Design
Consulting
LTE Rollout
Competence
Development
LTE Design
Consulting
LTE Rollout
Pre-Launch
Optimisation
Competence
Development
LTE Design/Rollout
Consulting
Post-Launch
Optimisation
Capacity Planning
Competence
Development
LTE Plan & Design
Services
LTE Optimisation
Capacity Planning
Competence
Development

5
© 2012 AIRCOM International Ltd
PSCR Service Assurance Harmonized Performance Management (PM)
6 © 2012 AIRCOM International Ltd
Why Harmonize Performance Management (PM)?
It’s critical that all First Responder organisations get the communications services they
need when they need them
Harmonized PM means the First Responder Network Authority (FirstNet) can centrally
monitor and assess communications services for all public safety agencies using
common metrics and processes irrespective of network vendor used or geographical
region
Correlation of data from many sources throughout the communications ecosystem is
required to evaluate the true quality of experience (QoE), bringing together the
application layer, wireless network and transport infrastructure including both the user
and control plane (signalling) information
Traditional Performance Management (PM) systems have struggled to meet the
demands of UMTS when monitoring a USA nationwide network. LTE is in it’s infancy but
has the same challenges such as per eNodeB PM files creating a processing challenge,
flat architecture disconnecting QoE from resource performance etc....
Public Safety Networks require best in class support systems, that perform under all
conditions and provide common harmonized information where and when it’s needed
7 © 2012 AIRCOM International Ltd
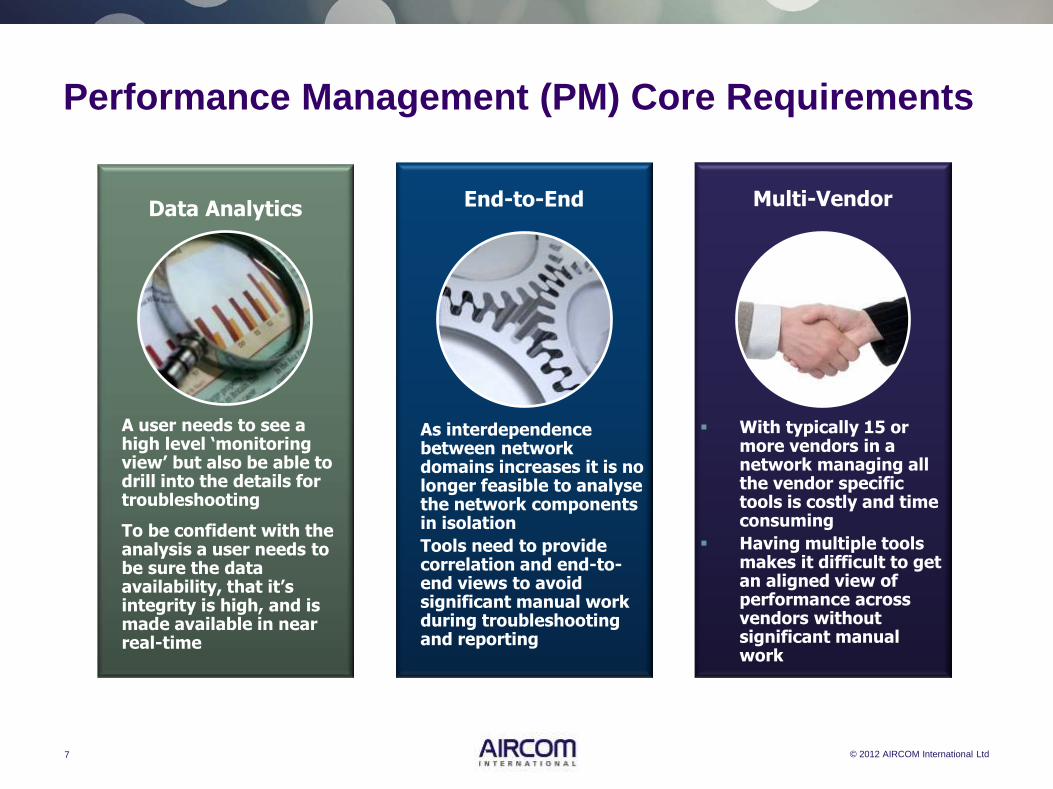
Performance Management (PM) Core Requirements
Data Analytics
A user needs to see a high level ‘monitoring view’ but also be able to drill into the details for troubleshooting
To be confident with the analysis a user needs to be sure the data availability, that it’s integrity is high, and is made available in near real-time
End-to-End
As interdependence between network domains increases it is no longer feasible to analyse the network components in isolation
Tools need to provide correlation and end-to-end views to avoid significant manual work during troubleshooting and reporting
Multi-Vendor
With typically 15 or more vendors in a network managing all the vendor specific tools is costly and time consuming
Having multiple tools makes it difficult to get an aligned view of performance across vendors without significant manual work
8 © 2012 AIRCOM International Ltd
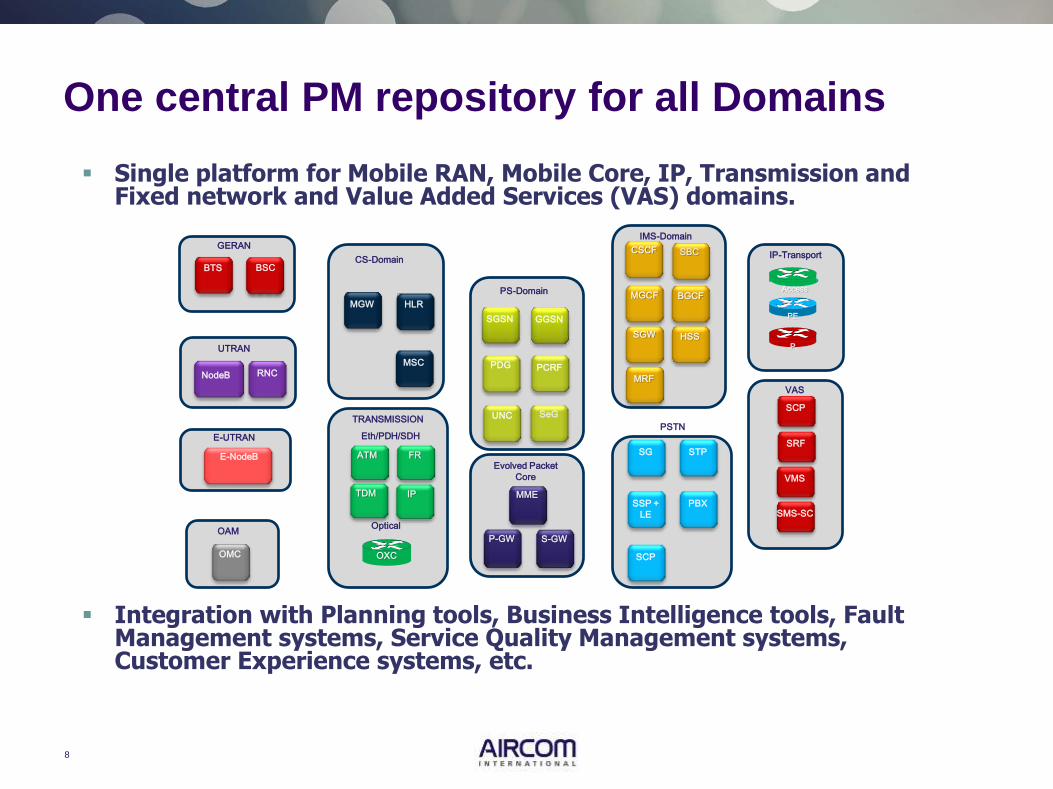
Single platform for Mobile RAN, Mobile Core, IP, Transmission and Fixed network and Value Added Services (VAS) domains.
Integration with Planning tools, Business Intelligence tools, Fault Management systems, Service Quality Management systems, Customer Experience systems, etc.
One central PM repository for all Domains
UTRAN
RNC NodeB
GERAN
BTS
Eth/PDH/SDH
ATM FR
IP TDM
TRANSMISSION
Optical
HSS
MRF
SGW
MGCF BGCF
CSCF
IMS-Domain
SBC
MGW
MSC
CS-Domain
HLR
OAM
OMC
GGSN SGSN
PCRF
SeG UNC
PS-Domain
PDG
MME
P-GW S-GW
Evolved Packet
Core
E-NodeB
E-UTRAN
SCP
VAS
SRF
VMS
SMS-SC
PE
P
Access
IP-Transport
SG
PSTN
STP
SSP +
LE
PBX
SCP OXC
BSC
9
© 2012 AIRCOM International Ltd
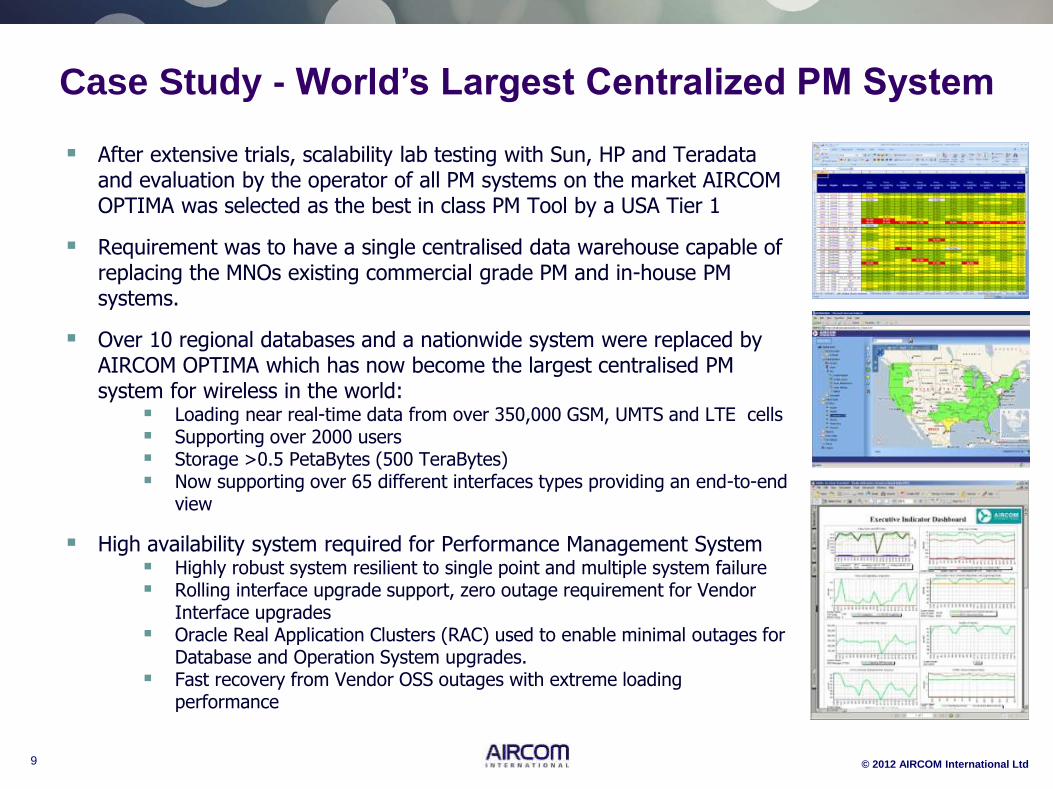
Case Study - World’s Largest Centralized PM System
After extensive trials, scalability lab testing with Sun, HP and Teradata and evaluation by the operator of all PM systems on the market AIRCOM OPTIMA was selected as the best in class PM Tool by a USA Tier 1
Requirement was to have a single centralised data warehouse capable of replacing the MNOs existing commercial grade PM and in-house PM systems.
Over 10 regional databases and a nationwide system were replaced by AIRCOM OPTIMA which has now become the largest centralised PM system for wireless in the world:
Loading near real-time data from over 350,000 GSM, UMTS and LTE cells Supporting over 2000 users Storage >0.5 PetaBytes (500 TeraBytes) Now supporting over 65 different interfaces types providing an end-to-end
view
High availability system required for Performance Management System Highly robust system resilient to single point and multiple system failure Rolling interface upgrade support, zero outage requirement for Vendor
Interface upgrades Oracle Real Application Clusters (RAC) used to enable minimal outages for
Database and Operation System upgrades. Fast recovery from Vendor OSS outages with extreme loading
performance

10
© 2012 AIRCOM International Ltd
PSCR Service Assurance Key Performance Indicators (KPIs)
11
© 2012 AIRCOM International Ltd
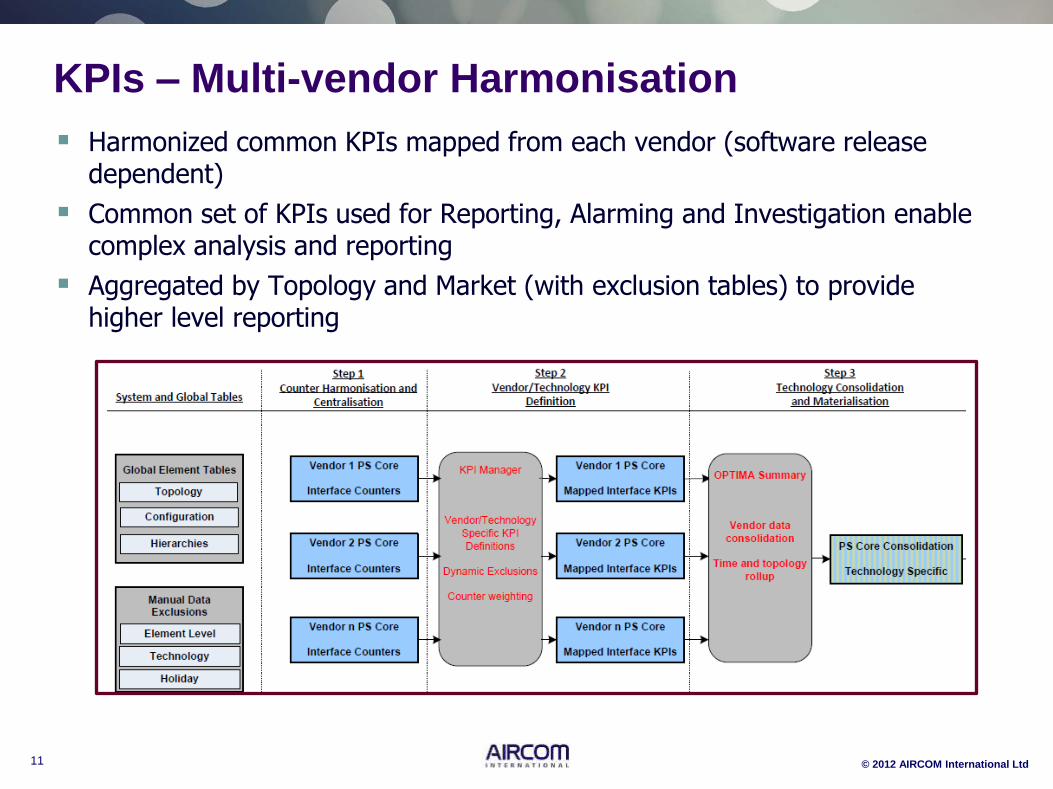
KPIs – Multi-vendor Harmonisation
Harmonized common KPIs mapped from each vendor (software release dependent)
Common set of KPIs used for Reporting, Alarming and Investigation enable complex analysis and reporting
Aggregated by Topology and Market (with exclusion tables) to provide higher level reporting
12 © 2012 AIRCOM International Ltd
A selection of AIRCOM’s vendor coverage
13 © 2012 AIRCOM International Ltd
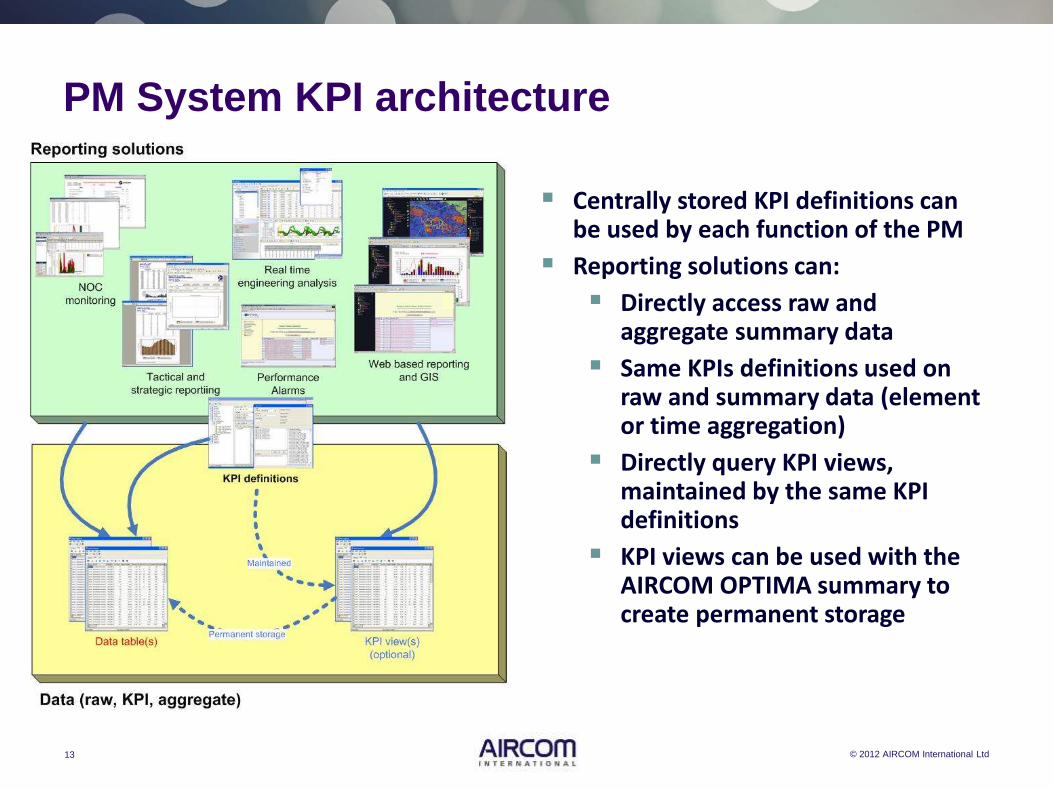
PM System KPI architecture
Copyright 2008 AIRCOM
International
Centrally stored KPI definitions can be used by each function of the PM
Reporting solutions can:
Directly access raw and aggregate summary data
Same KPIs definitions used on raw and summary data (element or time aggregation)
Directly query KPI views, maintained by the same KPI definitions
KPI views can be used with the AIRCOM OPTIMA summary to create permanent storage
14 © 2012 AIRCOM International Ltd
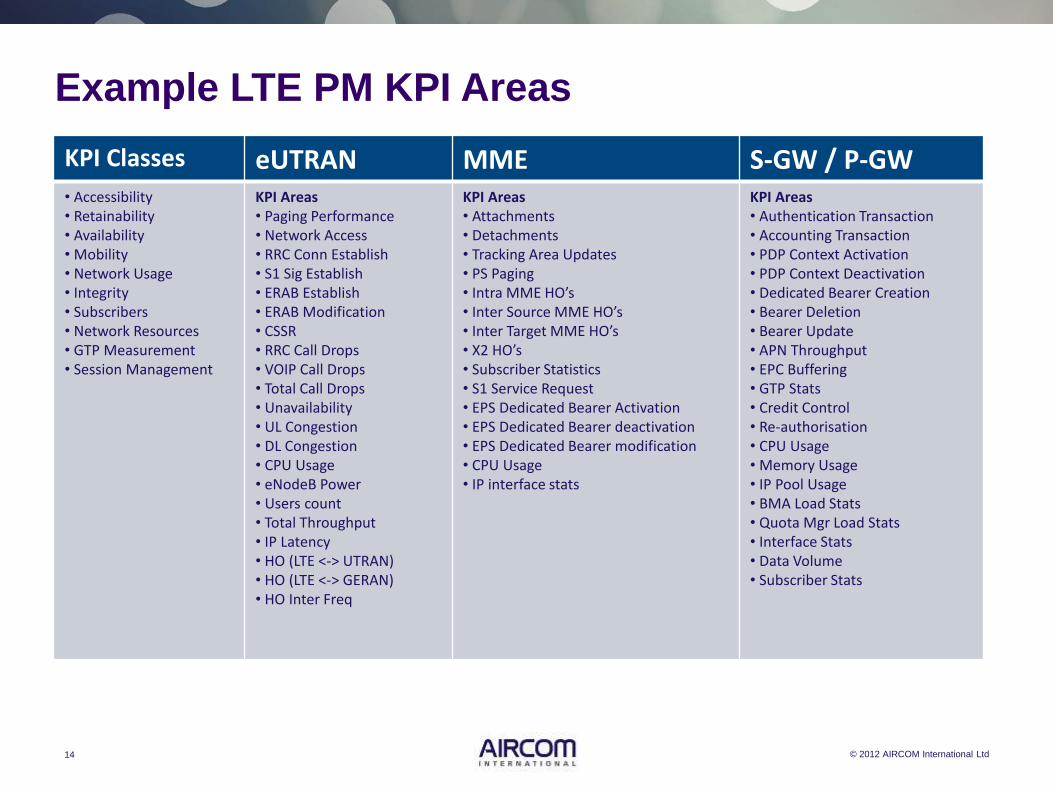
Example LTE PM KPI Areas
KPI Classes eUTRAN MME S-GW / P-GW • Accessibility • Retainability • Availability • Mobility • Network Usage • Integrity • Subscribers • Network Resources • GTP Measurement • Session Management
KPI Areas • Paging Performance • Network Access • RRC Conn Establish • S1 Sig Establish • ERAB Establish • ERAB Modification • CSSR • RRC Call Drops • VOIP Call Drops • Total Call Drops • Unavailability • UL Congestion • DL Congestion • CPU Usage • eNodeB Power • Users count • Total Throughput • IP Latency • HO (LTE <-> UTRAN) • HO (LTE <-> GERAN) • HO Inter Freq
KPI Areas • Attachments • Detachments • Tracking Area Updates • PS Paging • Intra MME HO’s • Inter Source MME HO’s • Inter Target MME HO’s • X2 HO’s • Subscriber Statistics • S1 Service Request • EPS Dedicated Bearer Activation • EPS Dedicated Bearer deactivation • EPS Dedicated Bearer modification • CPU Usage • IP interface stats
KPI Areas • Authentication Transaction • Accounting Transaction • PDP Context Activation • PDP Context Deactivation • Dedicated Bearer Creation • Bearer Deletion • Bearer Update • APN Throughput • EPC Buffering • GTP Stats • Credit Control • Re-authorisation • CPU Usage • Memory Usage • IP Pool Usage • BMA Load Stats • Quota Mgr Load Stats • Interface Stats • Data Volume • Subscriber Stats
15 © 2012 AIRCOM International Ltd
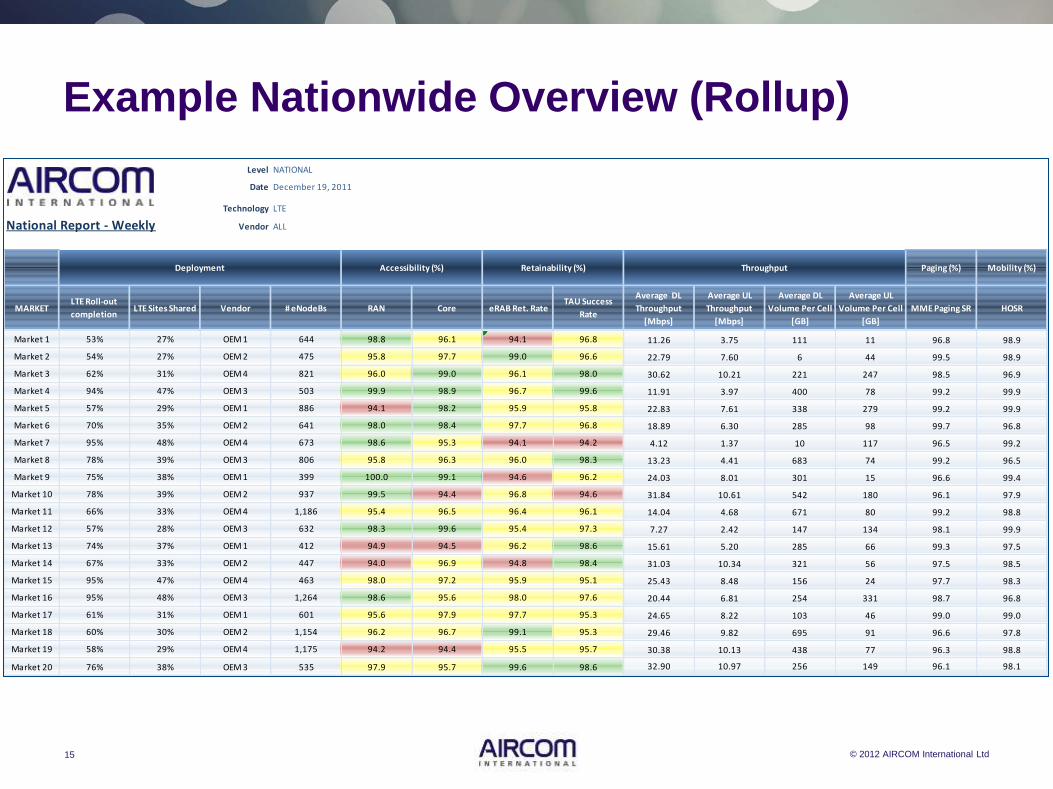
Example Nationwide Overview (Rollup)
Level NATIONAL
Date December 19, 2011
Technology LTE
National Report - Weekly Vendor ALL
Paging (%) Mobility (%)
MARKETLTE Roll-out
completionLTE Sites Shared Vendor # eNodeBs RAN Core eRAB Ret. Rate
TAU Success
Rate
Average DL
Throughput
[Mbps]
Average UL
Throughput
[Mbps]
Average DL
Volume Per Cell
[GB]
Average UL
Volume Per Cell
[GB]
MME Paging SR HOSR
Market 1 53% 27% OEM 1 644 98.8 96.1 94.1 96.8 11.26 3.75 111 11 96.8 98.9
Market 2 54% 27% OEM 2 475 95.8 97.7 99.0 96.6 22.79 7.60 6 44 99.5 98.9
Market 3 62% 31% OEM 4 821 96.0 99.0 96.1 98.0 30.62 10.21 221 247 98.5 96.9
Market 4 94% 47% OEM 3 503 99.9 98.9 96.7 99.6 11.91 3.97 400 78 99.2 99.9
Market 5 57% 29% OEM 1 886 94.1 98.2 95.9 95.8 22.83 7.61 338 279 99.2 99.9
Market 6 70% 35% OEM 2 641 98.0 98.4 97.7 96.8 18.89 6.30 285 98 99.7 96.8
Market 7 95% 48% OEM 4 673 98.6 95.3 94.1 94.2 4.12 1.37 10 117 96.5 99.2
Market 8 78% 39% OEM 3 806 95.8 96.3 96.0 98.3 13.23 4.41 683 74 99.2 96.5
Market 9 75% 38% OEM 1 399 100.0 99.1 94.6 96.2 24.03 8.01 301 15 96.6 99.4
Market 10 78% 39% OEM 2 937 99.5 94.4 96.8 94.6 31.84 10.61 542 180 96.1 97.9
Market 11 66% 33% OEM 4 1,186 95.4 96.5 96.4 96.1 14.04 4.68 671 80 99.2 98.8
Market 12 57% 28% OEM 3 632 98.3 99.6 95.4 97.3 7.27 2.42 147 134 98.1 99.9
Market 13 74% 37% OEM 1 412 94.9 94.5 96.2 98.6 15.61 5.20 285 66 99.3 97.5
Market 14 67% 33% OEM 2 447 94.0 96.9 94.8 98.4 31.03 10.34 321 56 97.5 98.5
Market 15 95% 47% OEM 4 463 98.0 97.2 95.9 95.1 25.43 8.48 156 24 97.7 98.3
Market 16 95% 48% OEM 3 1,264 98.6 95.6 98.0 97.6 20.44 6.81 254 331 98.7 96.8
Market 17 61% 31% OEM 1 601 95.6 97.9 97.7 95.3 24.65 8.22 103 46 99.0 99.0
Market 18 60% 30% OEM 2 1,154 96.2 96.7 99.1 95.3 29.46 9.82 695 91 96.6 97.8
Market 19 58% 29% OEM 4 1,175 94.2 94.4 95.5 95.7 30.38 10.13 438 77 96.3 98.8
Market 20 76% 38% OEM 3 535 97.9 95.7 99.6 98.6 32.90 10.97 256 149 96.1 98.1
Deployment Accessibility (%) Retainability (%) Throughput

16
© 2012 AIRCOM International Ltd
PSCR Service Assurance End to End KPI Consolidation
17
© 2012 AIRCOM International Ltd
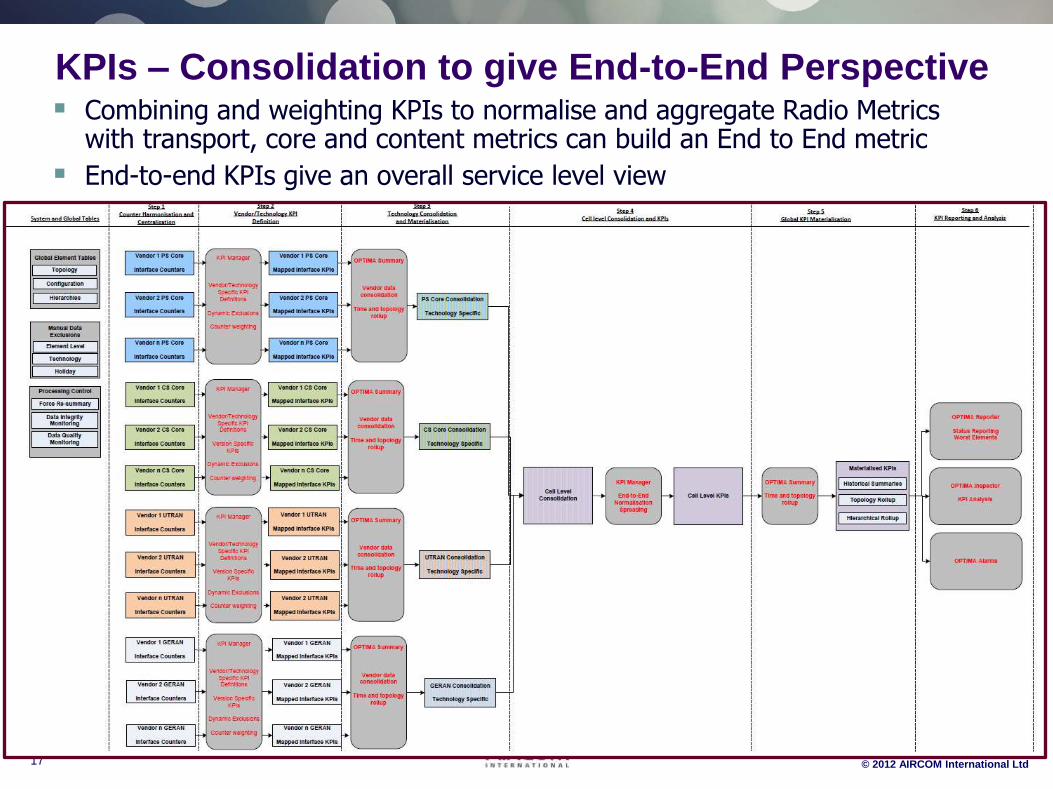
Combining and weighting KPIs to normalise and aggregate Radio Metrics with transport, core and content metrics can build an End to End metric
End-to-end KPIs give an overall service level view
KPIs – Consolidation to give End-to-End Perspective
18 © 2012 AIRCOM International Ltd
PM data can be supplemented with Probe data for further analysis to show:
Volume of traffic traversing the network per service
Additional KPIs: Packet size, Peak Packet Rate, mean to peak ratio
Proportionate traffic breakdown into each PSCR service by device type, location etc….
Throughput breakdown by service type vs time
Round-Trip Time, Delay, Jitter, Packet Loss Etc…
E2E KPI – Supplementing with Probe Data Sources
19 © 2012 AIRCOM International Ltd
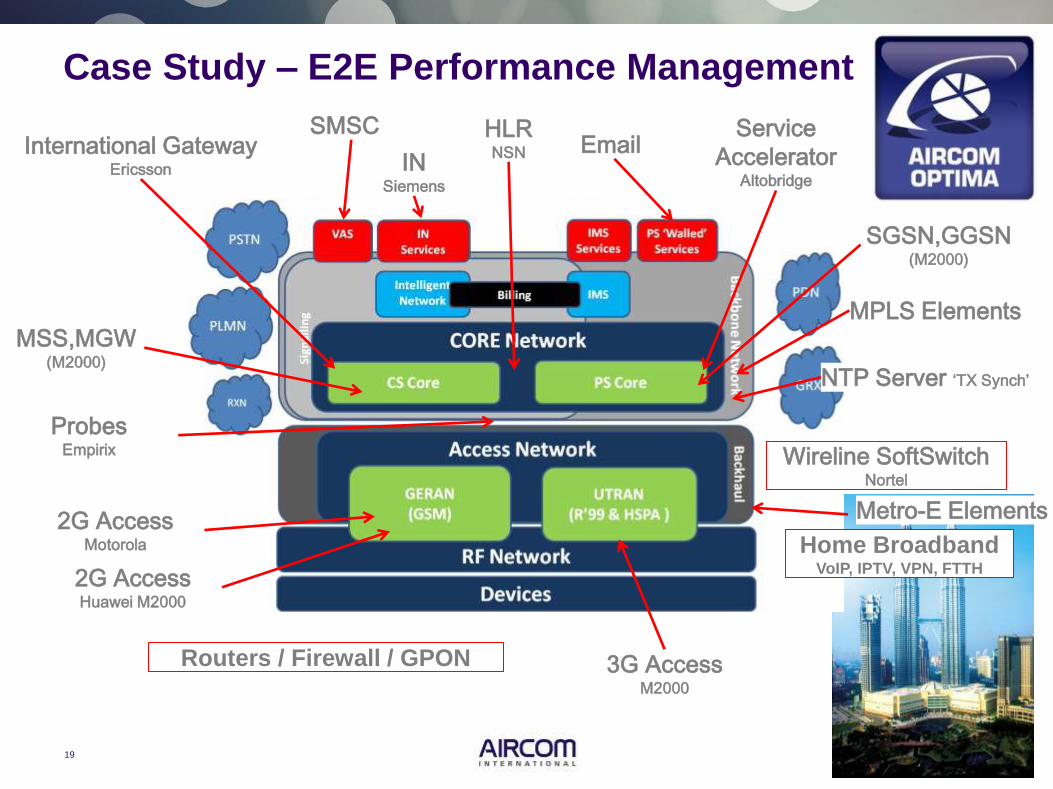
Case Study – E2E Performance Management
International Gateway Ericsson
SMSC
IN Siemens
HLR NSN Email
Service
Accelerator Altobridge
MPLS Elements
NTP Server ‘TX Synch’
Metro-E Elements 2G Access Motorola
3G Access M2000
Probes Empirix
MSS,MGW (M2000)
SGSN,GGSN
(M2000)
Wireline SoftSwitch Nortel
Routers / Firewall / GPON
2G Access Huawei M2000
Home Broadband
VoIP, IPTV, VPN, FTTH
20 © 2012 AIRCOM International Ltd
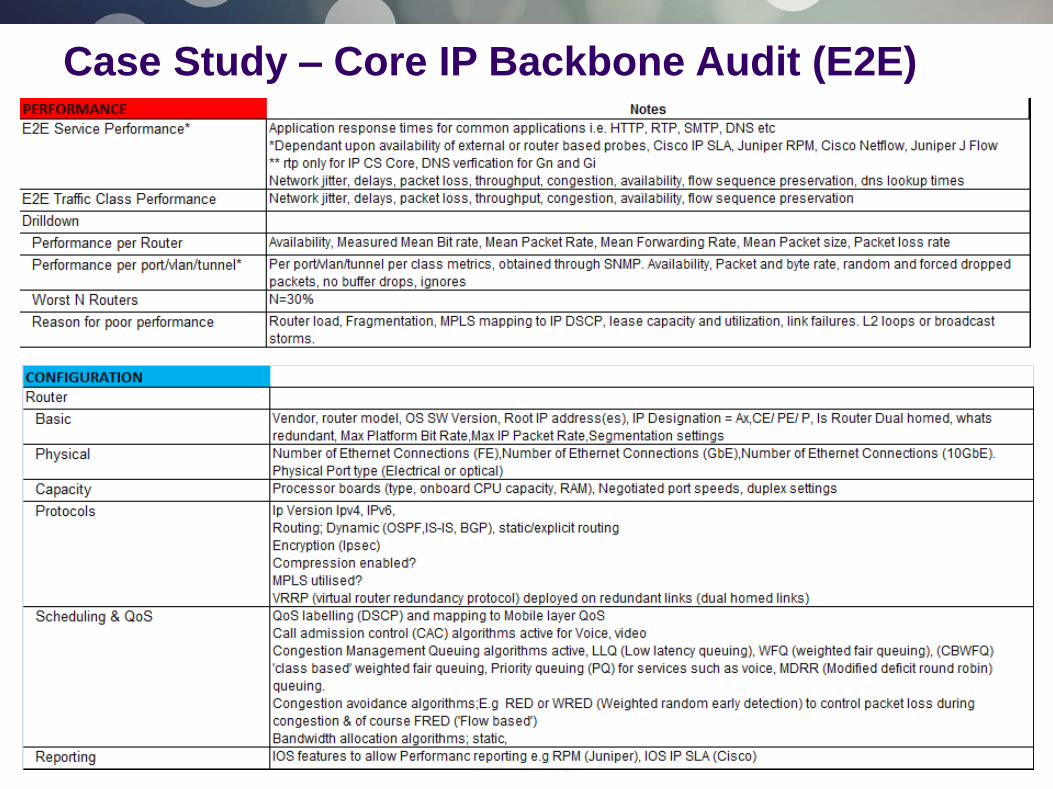
Case Study – Core IP Backbone Audit (E2E)

21
© 2012 AIRCOM International Ltd
PSCR Service Assurance PM Functions for Success
22
© 2012 AIRCOM International Ltd
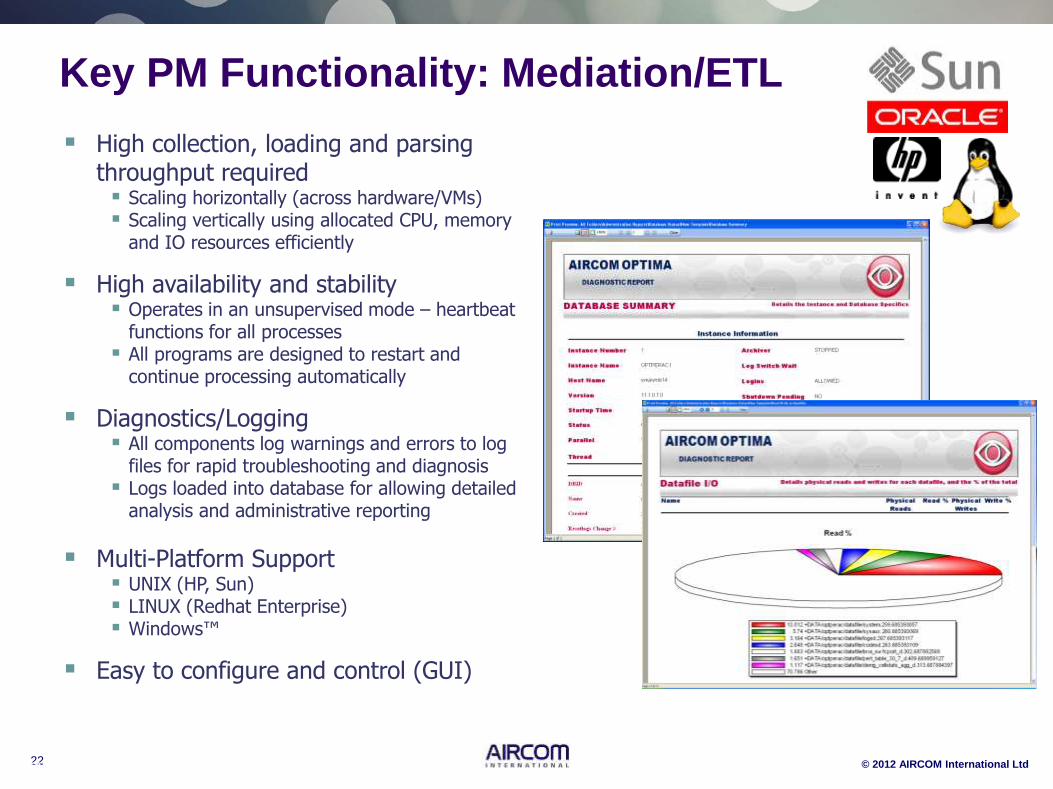
Key PM Functionality: Mediation/ETL
High collection, loading and parsing throughput required Scaling horizontally (across hardware/VMs) Scaling vertically using allocated CPU, memory
and IO resources efficiently
High availability and stability Operates in an unsupervised mode – heartbeat
functions for all processes All programs are designed to restart and
continue processing automatically
Diagnostics/Logging All components log warnings and errors to log
files for rapid troubleshooting and diagnosis Logs loaded into database for allowing detailed
analysis and administrative reporting
Multi-Platform Support UNIX (HP, Sun) LINUX (Redhat Enterprise) Windows™
Easy to configure and control (GUI)
Copyright 2006 AIRCOM
International
23
© 2012 AIRCOM International Ltd
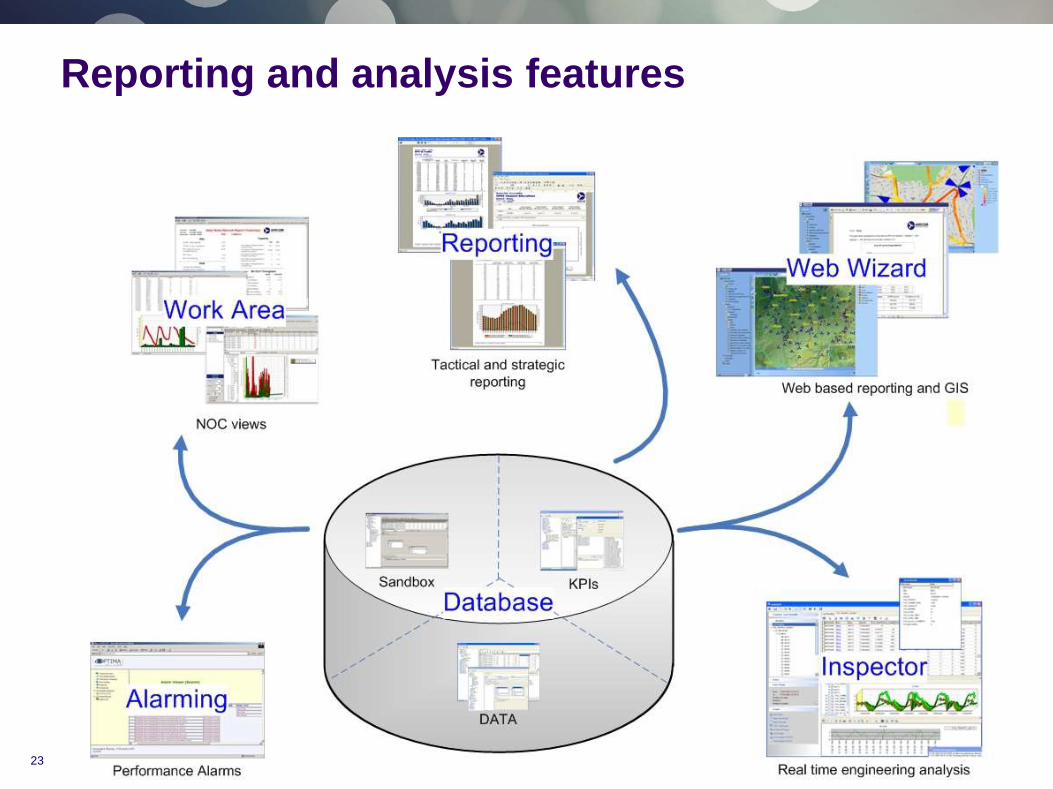
Reporting and analysis features
24
© 2012 AIRCOM International Ltd
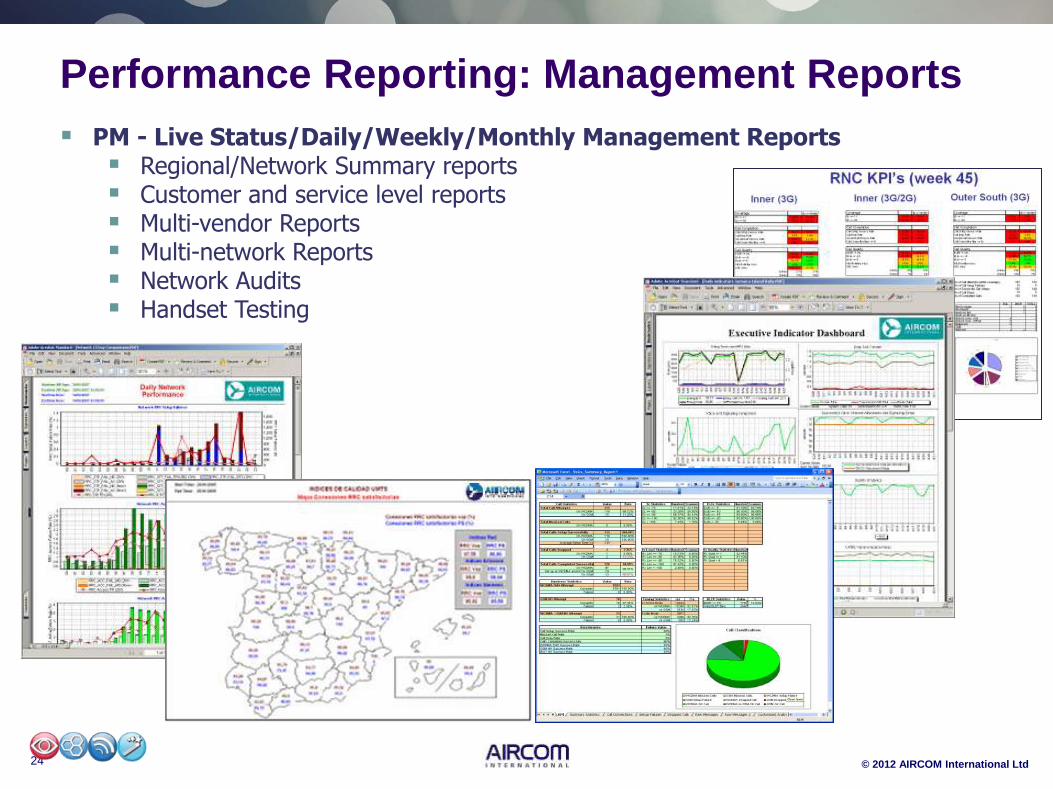
Performance Reporting: Management Reports
PM - Live Status/Daily/Weekly/Monthly Management Reports Regional/Network Summary reports Customer and service level reports Multi-vendor Reports Multi-network Reports Network Audits Handset Testing
25
© 2012 AIRCOM International Ltd
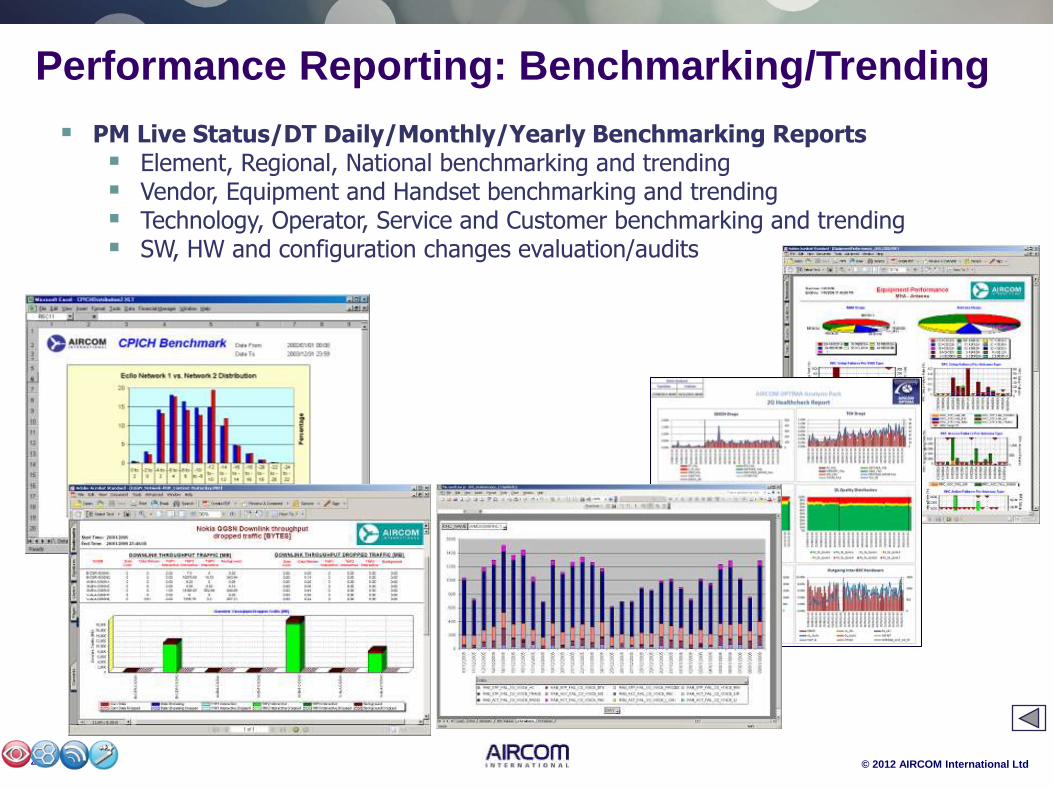
Performance Reporting: Benchmarking/Trending
PM Live Status/DT Daily/Monthly/Yearly Benchmarking Reports Element, Regional, National benchmarking and trending Vendor, Equipment and Handset benchmarking and trending Technology, Operator, Service and Customer benchmarking and trending SW, HW and configuration changes evaluation/audits
26
© 2012 AIRCOM International Ltd
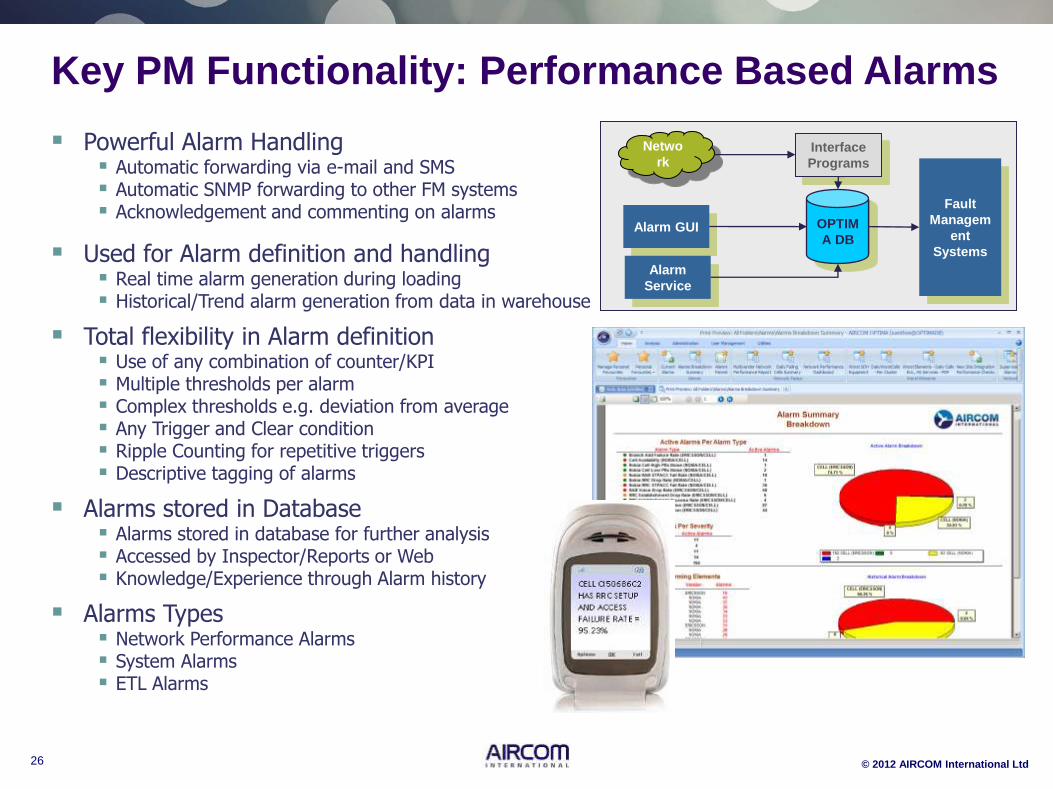
Powerful Alarm Handling Automatic forwarding via e-mail and SMS Automatic SNMP forwarding to other FM systems Acknowledgement and commenting on alarms
Used for Alarm definition and handling Real time alarm generation during loading Historical/Trend alarm generation from data in warehouse
Total flexibility in Alarm definition Use of any combination of counter/KPI Multiple thresholds per alarm Complex thresholds e.g. deviation from average Any Trigger and Clear condition Ripple Counting for repetitive triggers Descriptive tagging of alarms
Alarms stored in Database Alarms stored in database for further analysis Accessed by Inspector/Reports or Web Knowledge/Experience through Alarm history
Alarms Types Network Performance Alarms System Alarms ETL Alarms
Key PM Functionality: Performance Based Alarms
Alarm GUI
Fault
Managem
ent
Systems
OPTIM
A DB
Alarm
Service
Netwo
rk Interface
Programs
27 © 2012 AIRCOM International Ltd
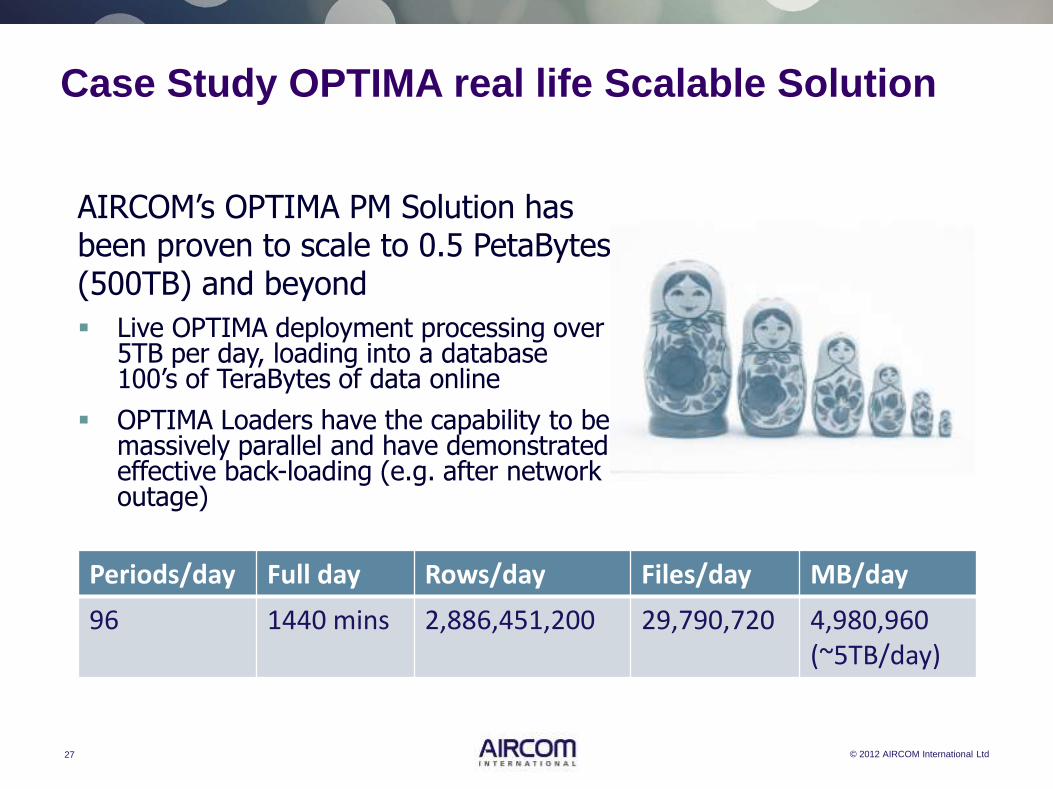
Case Study OPTIMA real life Scalable Solution
AIRCOM’s OPTIMA PM Solution has been proven to scale to 0.5 PetaBytes (500TB) and beyond
Live OPTIMA deployment processing over 5TB per day, loading into a database 100’s of TeraBytes of data online
OPTIMA Loaders have the capability to be massively parallel and have demonstrated effective back-loading (e.g. after network outage)
Periods/day Full day Rows/day Files/day MB/day
96 1440 mins 2,886,451,200 29,790,720 4,980,960 (~5TB/day)

28
© 2012 AIRCOM International Ltd
PSCR Service Assurance Integrated Planning and PM KPIs
29
© 2012 AIRCOM International Ltd
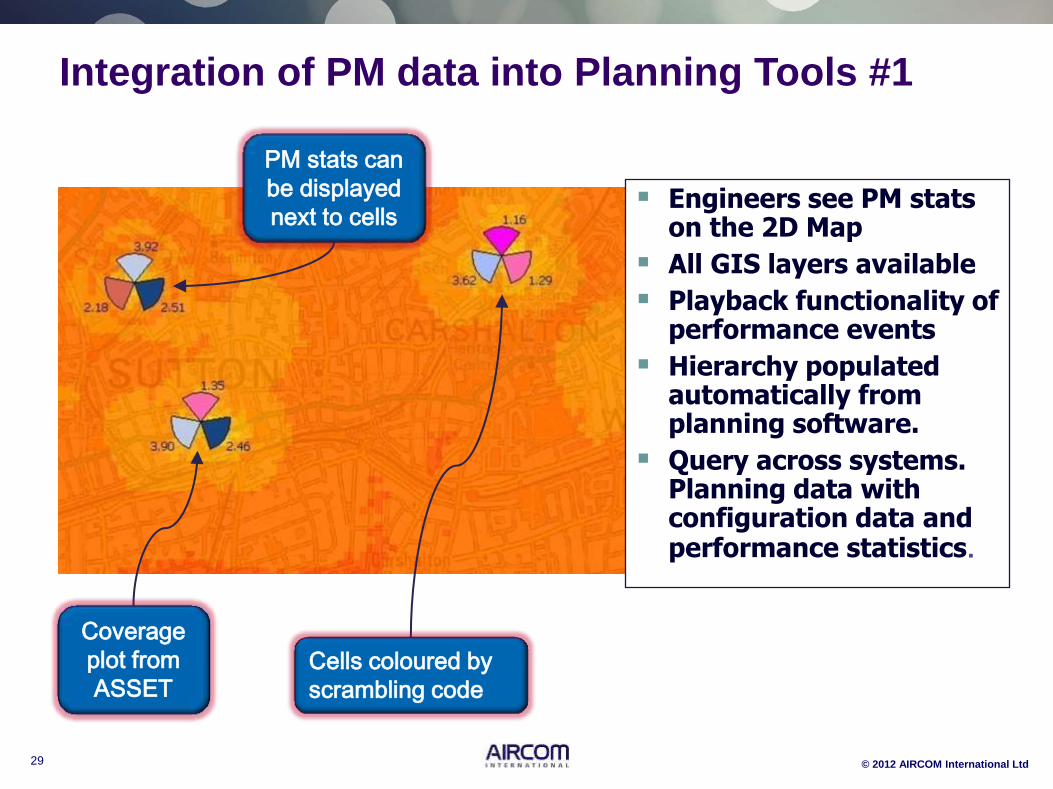
Integration of PM data into Planning Tools #1
Engineers see PM stats on the 2D Map
All GIS layers available
Playback functionality of performance events
Hierarchy populated automatically from planning software.
Query across systems. Planning data with configuration data and performance statistics.
PM stats can
be displayed
next to cells
Coverage
plot from
ASSET Cells coloured by
scrambling code
30
© 2012 AIRCOM International Ltd
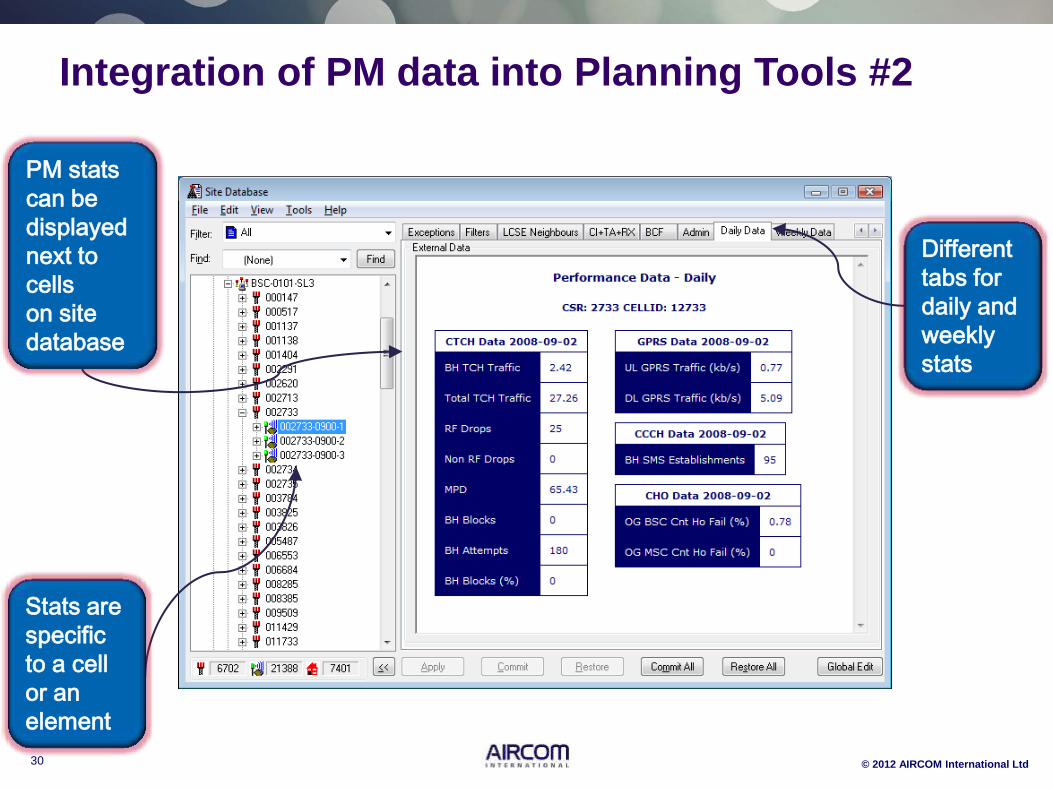
Integration of PM data into Planning Tools #2
Different
tabs for
daily and
weekly
stats
PM stats
can be
displayed
next to
cells
on site
database
Stats are
specific
to a cell
or an
element
31
© 2012 AIRCOM International Ltd
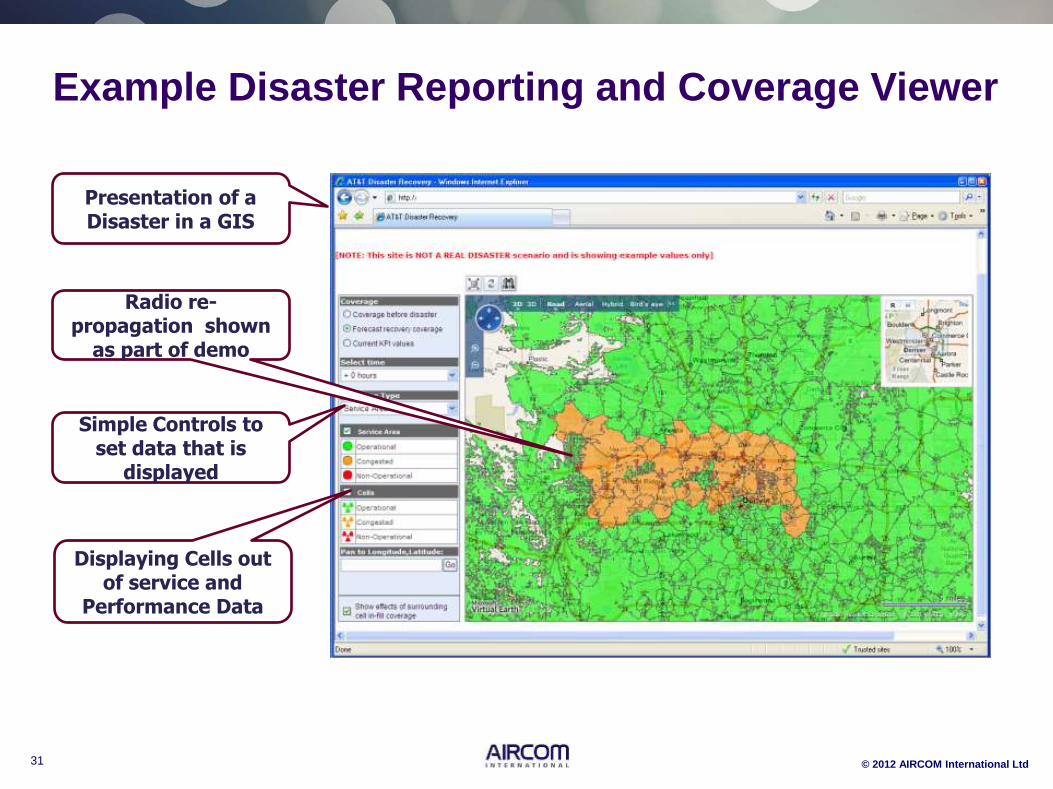
Presentation of a Disaster in a GIS
Radio re-propagation shown
as part of demo
Simple Controls to set data that is
displayed
Displaying Cells out of service and
Performance Data
Example Disaster Reporting and Coverage Viewer

32
© 2012 AIRCOM International Ltd
Thank You