Embed Size (px)
Citation preview
QQuuaalliittyy AAssssuurraannccee IInnffoorrmmaattiioonn GGuuiiddee
1. Quality Assurance Terms and Acronyms
A B C D E F G H I J K L M N O P Q R S T U V W XYZ #
2. Acronyms of Technical Organizations (with website links) 3. Quality Standards List 4. Quality Assurance Definitions
A B C D E F G H I J K L M N O P Q R S T U V W XYZ
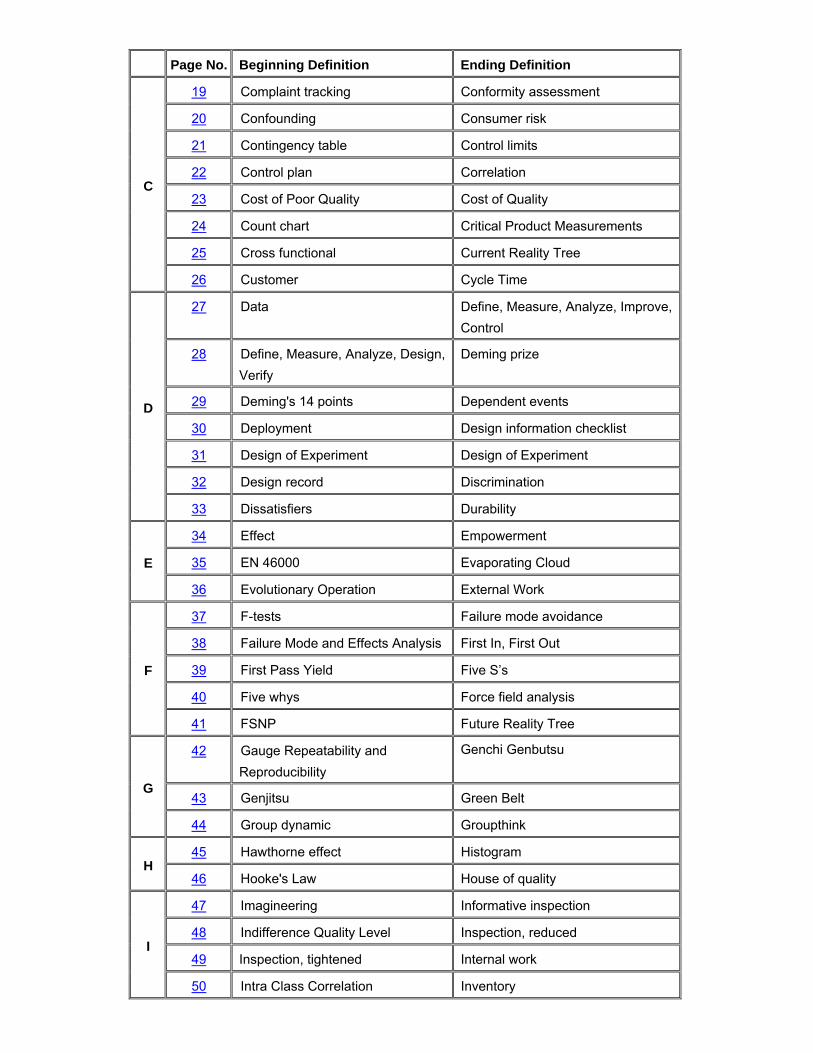
Page No. Beginning Definition Ending Definition
A
1 Abilene paradox Acceptance control chart
2 Acceptance sampling plan Activity Based Costing
3 Activity network diagram Am. Customer Satisfaction Index
4 Am. National Standards Institute Am. Std. Code for Info. Interchange
5 Analysis of Means Appearance item
6 Apportionment Assignable cause
7 Assn. for Quality and Participation Average chart
8 Average Outgoing Quality Axiomatic design
B
9 Baka-yoke Baseline measurement
10 Batch Bias
11 Big Q, little q Blocking
12 Board of Standards Review Brown–Forsythe test
13 BS 7799 Bx Life
C
14 c-chart Cascading
15 CASCO Certified Calibration Technician
16 Certified HACCP Auditor Chain reaction
17 Chain sampling plan Checklist
18 Check sheet Company culture
Page No. Beginning Definition Ending Definition
C
19 Complaint tracking Conformity assessment
20 Confounding Consumer risk
21 Contingency table Control limits
22 Control plan Correlation
23 Cost of Poor Quality Cost of Quality
24 Count chart Critical Product Measurements
25 Cross functional Current Reality Tree
26 Customer Cycle Time
D
27 Data Define, Measure, Analyze, Improve, Control
28 Define, Measure, Analyze, Design, Verify
Deming prize
29 Deming's 14 points Dependent events
30 Deployment Design information checklist
31 Design of Experiment Design of Experiment
32 Design record Discrimination
33 Dissatisfiers Durability
E
34 Effect Empowerment
35 EN 46000 Evaporating Cloud
36 Evolutionary Operation External Work
F
37 F-tests Failure mode avoidance
38 Failure Mode and Effects Analysis First In, First Out
39 First Pass Yield Five S’s
40 Five whys Force field analysis
41 FSNP Future Reality Tree
G
42 Gauge Repeatability and Reproducibility
Genchi Genbutsu
43 Genjitsu Green Belt
44 Group dynamic Groupthink
H 45 Hawthorne effect Histogram
46 Hooke's Law House of quality
I
47 Imagineering Informative inspection
48 Indifference Quality Level Inspection, reduced
49 Inspection, tightened Internal work
50 Intra Class Correlation Inventory
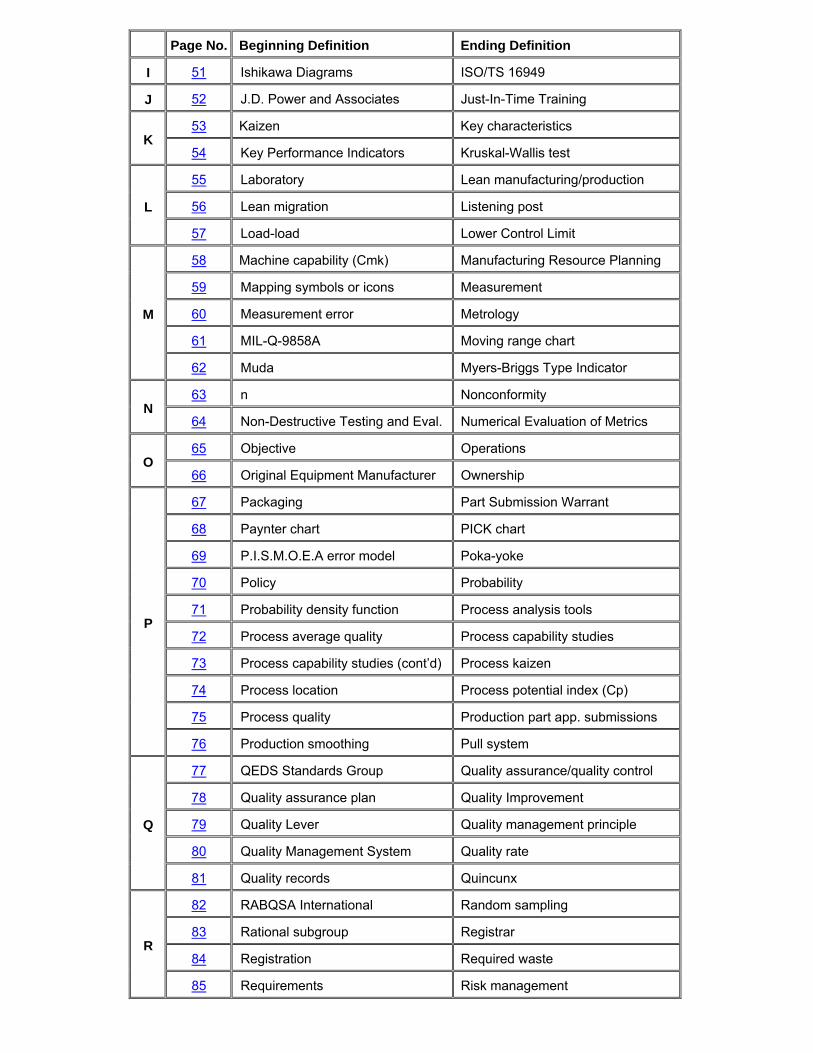
Page No. Beginning Definition Ending Definition
I 51 Ishikawa Diagrams ISO/TS 16949
J 52 J.D. Power and Associates Just-In-Time Training
K 53 Kaizen Key characteristics
54 Key Performance Indicators Kruskal-Wallis test
L
55 Laboratory Lean manufacturing/production
56 Lean migration Listening post
57 Load-load Lower Control Limit
M
58 Machine capability (Cmk) Manufacturing Resource Planning
59 Mapping symbols or icons Measurement
60 Measurement error Metrology
61 MIL-Q-9858A Moving range chart
62 Muda Myers-Briggs Type Indicator
N 63 n Nonconformity
64 Non-Destructive Testing and Eval. Numerical Evaluation of Metrics
O 65 Objective Operations
66 Original Equipment Manufacturer Ownership
P
67 Packaging Part Submission Warrant
68 Paynter chart PICK chart
69 P.I.S.M.O.E.A error model Poka-yoke
70 Policy Probability
71 Probability density function Process analysis tools
72 Process average quality Process capability studies
73 Process capability studies (cont’d) Process kaizen
74 Process location Process potential index (Cp)
75 Process quality Production part app. submissions
76 Production smoothing Pull system
Q
77 QEDS Standards Group Quality assurance/quality control
78 Quality assurance plan Quality Improvement
79 Quality Lever Quality management principle
80 Quality Management System Quality rate
81 Quality records Quincunx
R
82 RABQSA International Random sampling
83 Rational subgroup Registrar
84 Registration Required waste
85 Requirements Risk management
Page No. Beginning Definition Ending Definition
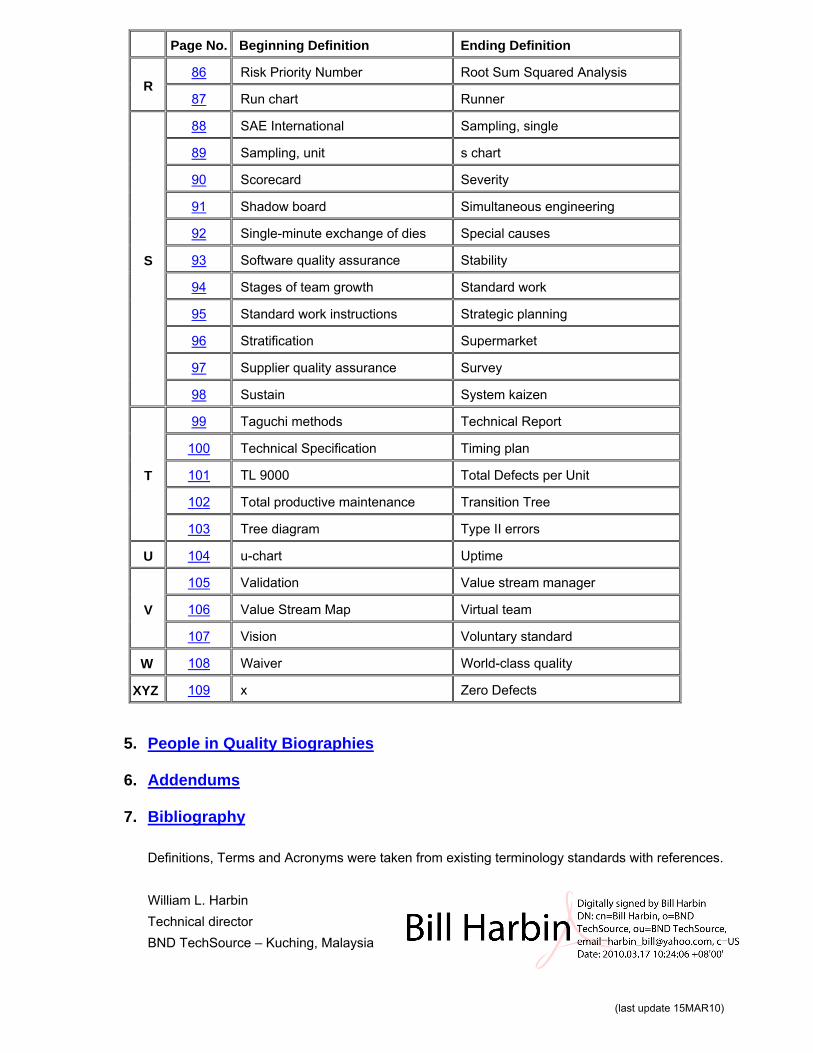
R 86 Risk Priority Number Root Sum Squared Analysis
87 Run chart Runner
S
88 SAE International Sampling, single
89 Sampling, unit s chart
90 Scorecard Severity
91 Shadow board Simultaneous engineering
92 Single-minute exchange of dies Special causes
93 Software quality assurance Stability
94 Stages of team growth Standard work
95 Standard work instructions Strategic planning
96 Stratification Supermarket
97 Supplier quality assurance Survey
98 Sustain System kaizen
T
99 Taguchi methods Technical Report
100 Technical Specification Timing plan
101 TL 9000 Total Defects per Unit
102 Total productive maintenance Transition Tree
103 Tree diagram Type II errors
U 104 u-chart Uptime
V
105 Validation Value stream manager
106 Value Stream Map Virtual team
107 Vision Voluntary standard
W 108 Waiver World-class quality
XYZ 109 x Zero Defects
5. People in Quality Biographies
6. Addendums
7. Bibliography
Definitions, Terms and Acronyms were taken from existing terminology standards with references. William L. Harbin Technical director BND TechSource – Kuching, Malaysia
(last update 15MAR10)
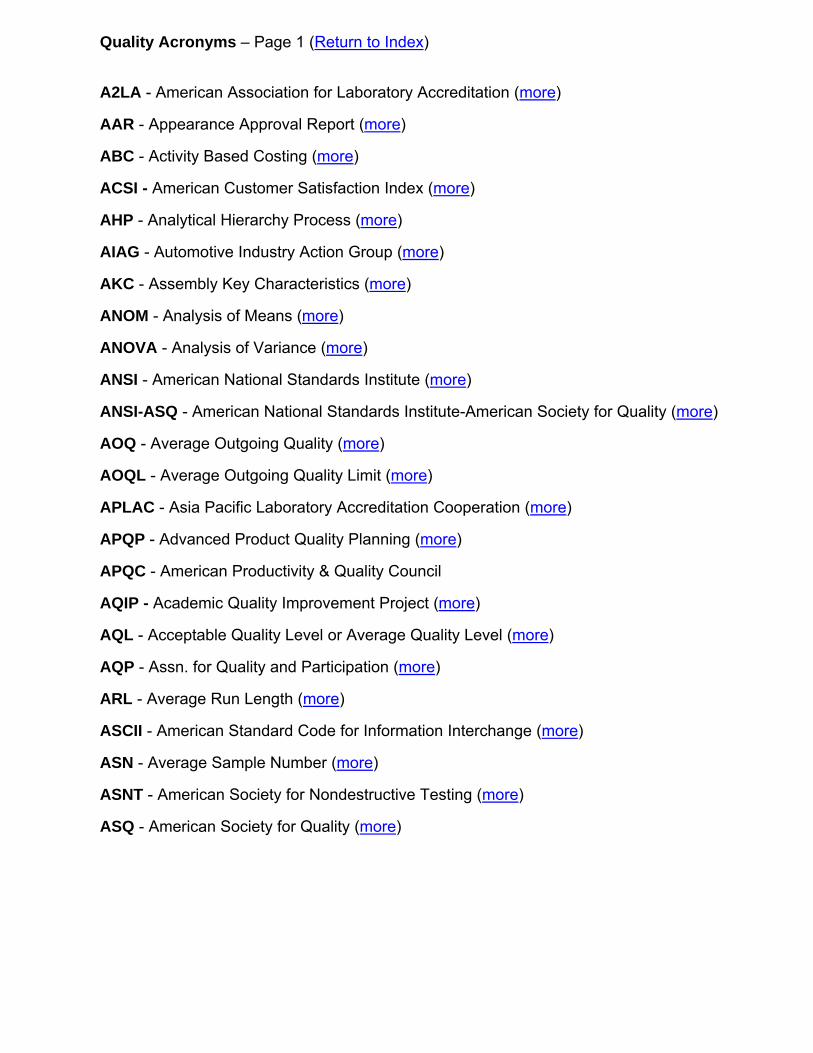
Quality Acronyms – Page 1 (Return to Index)
A2LA - American Association for Laboratory Accreditation (more)
AAR - Appearance Approval Report (more)
ABC - Activity Based Costing (more)
ACSI - American Customer Satisfaction Index (more)
AHP - Analytical Hierarchy Process (more)
AIAG - Automotive Industry Action Group (more)
AKC - Assembly Key Characteristics (more)
ANOM - Analysis of Means (more)
ANOVA - Analysis of Variance (more)
ANSI - American National Standards Institute (more)
ANSI-ASQ - American National Standards Institute-American Society for Quality (more)
AOQ - Average Outgoing Quality (more)
AOQL - Average Outgoing Quality Limit (more)
APLAC - Asia Pacific Laboratory Accreditation Cooperation (more)
APQP - Advanced Product Quality Planning (more)
APQC - American Productivity & Quality Council
AQIP - Academic Quality Improvement Project (more)
AQL - Acceptable Quality Level or Average Quality Level (more)
AQP - Assn. for Quality and Participation (more)
ARL - Average Run Length (more)
ASCII - American Standard Code for Information Interchange (more)
ASN - Average Sample Number (more)
ASNT - American Society for Nondestructive Testing (more)
ASQ - American Society for Quality (more)
Quality Acronyms – Page 2 (Return to Index)
ASQC - American Society for Quality Control (more)
ASTD - American Society for Training and Development (more)
ASTM - American Society for Testing and Materials (more)
ATI - Average Total Inspection (more)
Quality Acronyms – Page 3 (Return to Index)
BAT- Best Available Techniques
BB - Black Belt (more)
BCR - Blast Create Refine
BIC (AP) - Best in Class (Action Plans)
BIST - Built-In Self Test
BKM - Best Known Methods
BOK - Body of Knowledge (more)
BOM - Bill Of Material (more)
BPM - Business Process Management
BPMS - Business Process Management System (more)
BPO - Business Process Outsourcing
BPR - Business Process Reengineering (more)
BSR - Board of Standards Review (more); Buzz, Squeak, Rattle
BTS - Build-To-Schedule Ratio (more)

Quality Acronyms – Page 4 (Return to Index)
CAB - Corrective Action Board; Competitive Analysis Benchmarking
CAD - Computer Aided Design (more)
CAE - Computer Aided Engineering (more)
CAF - Common Assessment Framework
CAM - Computer Aided Manufacturing (more)
CAPA - Corrective And Preventive Action (more)
CAPS - Computer-Assisted Problem Solving
CAR - Corrective Action Report (Request, Recommendation) (more)
CAIT - Computer-Aided Inspection and Testing
CART - Classification and Regression Tree
CAT - Complex Adaptive Thinking
CBA - ASQ Certified Biomedical Auditor (more)
CC - Critical Characteristic (more)
C-chart - Count chart (more)
CCT - ASQ Certified Calibration Technician (more)
CE - Concurrent Engineering (more)
CFT - Cross Functional Team
CFA - Component Failure Analysis
CFR - Constant Failure Rate
CGMP - Current Good Manufacturing Practices (more)
CHA - ASQ Certified HACCP Auditor (more)
CHAID - Chi-square Automatic Interaction Detection (more)
CI - Continuous Improvement (more)
CIM - Computer Integrated Manufacturing
CIP - Continuous Improvement Program
CLCA - Closed-Loop Corrective Action (more)
CLL - Cycle Line Layout (more)
CMI - ASQ Certified Mechanical Inspector; superseded by CQI (more)
Quality Acronyms – Page 5 (Return to Index)
Cmk - Machine capability (more)
CMM - Capability Maturity Model (more); Coordinate Measuring Machine (more)
CMQ/OE - ASQ Certified Manager of Quality/Organizational Excellence (more)
CMS - Coordinate Measuring System
CMVSS - Canadian Motor Vehicle Safety Standards (per Transport Canada)
COB - Close Of Business
COP - Conformity of Production; Customer Ordered Production
COPQ - Cost of Poor Quality (more)
COQ - Cost of Quality (more)
CoV - Coefficient of Variance
Cp - Process potential index (more)
CPIM - Certified in Production and Inventory Management
CPIP - Current Product Improvement Team
Cpk - Process capability index (more)
CPM - Critical Path Method
CQA - ASQ Certified Quality Auditor (more)
CQE - ASQ Certified Quality Engineer (more)
CQI - ASQ Certified Quality Inspector (more); Continuous Quality Improvement (more)
CQIA - ASQ Certified Quality Improvement Associate (more)
CQM - ASQ Certified Quality Manager; superseded by CMQ/OE (more)
CQP - Critical Quality Problem
CQPA - ASQ Certified Quality Process Analyst (more)
CQT - ASQ Certified Quality Technician (more)
CRD - Conflict Resolution Diagram (more)
CRE - ASQ Certified Reliability Engineer (more)
CRM - Customer Relationship Management (more)
CRT - Current Reality Tree (more)
Quality Acronyms – Page 6 (Return to Index)
CSF - Critical Success Factors
CSI – Customer Satisfaction Index (more)
CSM - Customer-Supplier Model (more)
C-Sketch - Collaborative Sketch (more)
CSP - Continuous Sampling Plan
CSQE - Certified Software Quality Engineer (more)
CSSBB - ASQ Certified Six Sigma Black Belt (more)
CSSGB - ASQ Certified Six Sigma Green Belt (more)
CSU - Consistent Standard Units
C/T – Cycle Time (more)
CTC - Critical to Cost, Concept to Customer
CTD - Critical to Delivery
CTP - Critical to Process
CTQ - Critical to Quality (more)
CTQC - Critical to Quality Characteristic
CTS - Critical to Satisfaction
CUSUM - Cumulative Sum (more)
CWQC - Company Wide Quality Control
CWQI - Company Wide Quality Improvement
CY - Calendar Year
Quality Acronyms – Page 7 (Return to Index)
D-chart – Demerit chart (more)
DCOV - Define Characterize Optimize Verify (failure mode avoidance process)
DCP - Dimensional Control Plan / Dynamic Control Plan
DCT - Defect Control Tool
DD - Defect Density
DDMS - Defect Data Management System
DFA - Design For Assembly
DFC - Datum Flow Chain
DFE - Design For Excellence
DFMA - Design For Manufacturing and Assembly (more)
DFMEA - Design Failure Mode Effects Analysis (more)
DFMC - Design for Mass Customization
DFSS - Design For Six Sigma (more)
DFR - Design For Reliability
DIF-DOF - Design In Function - Design Out Failure
DM - Defect Management
DMADV - Design Measure Analyze Design Verify (more)
DMAIC (R) -Define, Measure, Analyze, Implement and Control (Realize) (more)
DMEDI - Define, Measure, Explore, Develop, Implement
DMR - Discrepant Material Report (SCAR)
DOE - Design Of Experiments (more)
DOPU - Defect Opportunities Per Unit
DP - Dual Phase
DPMO - Defects Per Million Opportunities
DPO - Defects Per Opportunity
DPR - Design Pre-Requisites
DPU - Defects Per Unit
DQR - Durability Quality Reliability
Quality Acronyms – Page 8 (Return to Index)
DRC - Design Rule Check
DTD - Dock to Dock (more)
DTR - Dimensional Test Report
DVER - Design rule Verification (more)
DVP&R - Design Verification Plan & Report (more)
Quality Acronyms – Page 9 (Return to Index)
E3 - Early Equipment Evaluation
EA - European Cooperation for Accreditation (more)
EAR - Engineering Action Request
EAU - Estimated Annual Usage
ECA - Engineering Capability Assessment
ECN - Engineering Change Notification
ECO - Engineering Change Order
ECR - Engineering Change Request
EDA - Exploratory Data Analysis
EDI - Electric Data Interchange (more)
EFR - Early Failure Rate (also ELF, IMF)
EI - Employee Involvement (more)
EIP - Equipment Improvement Program; Equipment Improvement Project
ELF - Early Life Failure (also EFR, IMF)
EWMA - Exponentially Weighted Moving Average
EPLS - Economic Production Lot Size
EPM - Equipment Performance Metrics
EQA - European Quality Award
ES - Engineering Specification
ESC - Early Stage Control
ESS - Environmental Stress Screening
ETQR - External Total Quality and Reliability
EVM - Earned Value Management
EVOP - Evolutionary Operation (more)
EWMA - Exponentially Weighted Moving Average
Quality Acronyms – Page 10 (Return to Index)
FA - Failure Analysis
FAA - Function Attribute Analysis
FACR - Findings, Analysis, Conclusions and Recommendations
FAIT - First Article Inspection and Test
FDC - Fault Detection and Classification
FEA - Finite Element Analysis
FEED – Front End Engineering and Design
FIFO - First In, First Out (more)
FIRTFT - Fix It Right The First Time
FLD - Forming Limit Diagram
FMA - Failure Mode Analysis (more)
FMEA - Failure Mode and Effects Analysis (more)
FMECA - Failure Mode Effects and Criticality Analysis (more)
FMEM - Failure Mode and Effects Management
FMS - Forms Management System; Facility Management System
FMVSS - Federal Motor Vehicle Safety Standards (per NHTSA)
FORM - First Order Reliability Method
FPY - First Pass Yield (more)
FRACAS - Failure Reporting Analysis, Corrective Action System
FRC - First Run Capability (more)
FRT - Future Reality Tree (more)
FSNP - Forming Storming Norming Performing (in team problem solving efforts) (more)
FTA - Fault Tree Analysis (more)
FTC - First Time Capability
FTQ - First Time Quality (more)
FTT - First Time Through (more)
Quality Acronyms – Page 11 (Return to Index)
GB - Green Belt (more)
GLP - Good Laboratory Practice
GCA - Global Customer Audit
GD&T – Geometric Dimensioning and Tolerancing (more)
GLP - Good Laboratory Practices (more)
GMP - Good Manufacturing Practices (more)
GR&R - Gauge Repeatability & Reproducibility (more)
Quality Acronyms – Page 12 (Return to Index)
HACCP - Hazard Analysis and Critical Control Point (more)
HALT - Highly Accelerated Life Test (more)
HASA - Highly Accelerated Stress Audits (more)
HASS - Highly Accelerated Stress Screening (more)
HPEM - Harr's Point Estimation Method
HRA - Human Reliability Analysis
HSE – Health, Safety, Environmental
Quality Acronyms – Page 13 (Return to Index)
IAAC - Inter-American Accreditation Cooperation (more)
IAR - International Accreditation Registry (more)
IATF - International Automotive Task Force (more)
ICC – Intra Class Correlation (more)
ICIS - In Control and In Specification
IDEA - Investigate, Design, Execute, Adjust
IDOV - Identify, Design, Optimize, Verify
ILAC - International Laboratory Accreditation Cooperation (more)
IMF - Infant Mortality Failure (also EFR, ELF)
I/MR - Individual/Moving Range (chart) (more)
IPE - Interpret, Plan, Execute (a problem-solving methodology)
IPO – Input(s), Process, Output(s)
IQ - Installation Qualification
IQL - Indifference Quality Level (more)
ISIR - Initial Sample Inspection Report (now PSW)
ISR - Initial Sample Report (now PSW)
ISW - Initial Sample Warrant (now PSW)

Quality Acronyms – Page 14 (Return to Index)
JIT - Just in Time (more)
JITT - Just in Time Training (more)
Quality Acronyms – Page 15 (Return to Index)
KCC - Key Control Characteristic
KLT - Key Life Test
KPA - Key Process Area
KPC - Key Process (Product) Characteristic (more)
KPI - Key Process (Product) Indicator (more)
KPIV - Key Process Improvement Variable (more)
KPOV - Key Process Output Variables (more)
KQI - Key Quality Indicator
Quality Acronyms – Page 16 (Return to Index)
LAR - Lot Age Report
LCA – Life Cycle Analysis, Life Cycle Assessment
LCC - Life Cycle Cost
LCL - Lower Control Limit (more)
LDA - Linear Discriminant Analysis
LFMEA - Logistics Failure Modes and Effects Analysis
LHS - Latin Hypercube Simulation
LOC - Level of Concern
LSL - Lower Specification Limit (more)
LTPD - Lot Tolerance Percentage Defective (more)
LUTI - Learn Use Train Inspect
Quality Acronyms – Page 17 (Return to Index)
MANOVA - Multi-variant Analysis of Variances
MAP - Manufacturing Automation Protocol
MBB - Master Black Belt (more)
M &TE - Measuring & Test Equipment
MBNQA - Malcolm Baldrige National Quality Award (more)
MBTI - Myers-Briggs Type Indicator (more)
MCS - Monte Carlo Simulation (more)
MCT - Machine Cycle Time
MDO - Multidisciplinary Design Optimization
MDR - Material Discrepancy Report (SCAR)
MDT - Module Development Team
MEOST - Multiple Environment Over Stress Test
MEPEM - Materials Equipment People Environment Methods
MKC - Manufacturing Key Characteristics (more)
MRA - Mutual Recognition Agreement (more)
MRP - Material Requirements Planning (more)
MRP II - Manufacturing Resource Planning (more)
MSA - Measurement System Analysis (more)
MSE - Mean Squared Error; Measurement System Evaluation (more)
MSDS - Material Safety Data Sheet
MTBF - Mean Time Between Failures (more)
MTQ - Motivation Teamwork Quality
MTR - Material Test Report
MTTA - Mean Time To Assist
MTTC - Mean Time To Correct
MTTCR - Mean Time To Correct and Recover
MTTF - Mean Time To Failure
MTTR - Mean Time To Repair
Quality Acronyms – Page 18 (Return to Index)
NBR - Negative Branch Reservations
NCR - Non-Conformance Report
NDE - Non-Destructive Evaluation (more)
NDT - Non-Destructive Testing (more)
NEM - Numerical Evaluation of Metrics (more)
NFF - No Fault Found
NGT - Nominal Group Technique (more)
NIST - National Institute of Standards and Technology (more)
NMR - Non-conformance Material Report
NP chart - Number of affected units chart (more)
Quality Acronyms – Page 19 (Return to Index)
OCLP - Ongoing Process Control Plan
OC - Operating Characteristic curve (more)
OCT - Operator Cycle Time
OEE - Overall Equipment Effectiveness (more)
OEM - Original Equipment Manufacturer (more)
OFAT - One Factor At a Time
OIC - Observe, Infiltrate, Collaborate (ways to grasp the situation)
OPT - Optimized Production Technology
OQ - Operational Qualification
OTED - One Touch Exchange of Dies (more)
OVAT - One Variable At a Time
Quality Acronyms – Page 20 (Return to Index)
PAPA - Part and Process Audit
PCA - Principal Component Analysis
P-chart - Percent chart (more)
PCP - Part Certification Process
PCPA - Process Control Plan Audit
PCR - Principle Component Regression
PDCA (E. Deming) or PDSA (W. Shewhart) - Plan Do Check (Study) Act (more)
PDF - Probability Density Function
PDLA - Plant Design Layout & Analysis
PDP - Product Development Planning
PDPC - Process Decision Program Chart
PDQ - Proactive Design for Quality
PDM – Product Data Management
PERT - Program Evaluation and Review Technique
PFA - Product Family Architecture
PFMEA - Process Failure Mode Effects Analysis (more)
PICK - Possible, Implement, Challenge and Kill (more)
PIP - Product Improvement Plan (more)
P.I.S.M.O.E.A - Part, Instrument, Standard, Method, Operator, Environment, &
Assumptions (more)
PIST - Percent of Inspection points Satisfying Tolerance (more)
PKC - Product Key Characteristics (more)
PLEX - Plant Experiments
PLM - Product Lifecycle Management
PM - Preventive Maintenance
PMAP - Process Map (more)
Quality Acronyms – Page 21 (Return to Index)
PMT - Program Management Team
P/N - Part Number
PO - Purchase Order
POM - Production & Operations Management
PONC - Price of Non-Conformance
PPAP - Production Parts Approval Process (more)
PPC - Pre-Product Clinic
Ppk - Process performance index (more)
PPM - Parts Per Million - defects per one million parts (more)
PQ - Performance Qualification
PQP - Purchasing Quality Procedure
PRA - Probabilistic Risk Assessment
PRT - Pre-requisite Tree (more)
PSW - Product Sample Warrant (more)
PTR - Performance Test Report; Product Technical Requirements
PTQ - Partnering for Total Quality
PVP&R - Process Validation Plan & Report
Quality Acronyms – Page 22 (Return to Index)
QA - Quality Assurance (more)
QADF - Quality Assurance Document File
QC - Quality Control (more)
QCD - Quality Cost Delivery
Q chart - Quality score chart (more)
QCIR - Quality Control Inspection Record
QFD - Quality Function Deployment (more)
QFS - Qualified for Sourcing
QITD - Quality is In The Detail
QIS - Quality Information System
QM - Quality Management (more)
QMS - Quality Management System (more)
QOO - Quality of Operations
QOS - Quality Operating System
QP - Quality Procedure
QPR - Quality Problem Report
QS-9000 - Quality System 9000 (superseded by ISO/TS 16949:2002)
QSA - Quality System Assessment (or Audit)
QSER - Questioning, Solving, Experimenting, Reflecting
QSIT - Quality System Inspection Technique (US Food & Drug Administration)
QSR - Quality System Requirements
QTAT - Quick Turn Around Time
QWL - Quality of Working Life
Quality Acronyms – Page 23 (Return to Index)
RAM - Reliability, Availability, and Maintainability
R Chart – Range Chart (more)
RCA - Request for Corrective Action; Root Cause Analysis (more)
RBDO - Reliability Based Design Optimization
RFP - Request For Proposal
RFQ - Request For Quotation
RIMCY - Residuals, Interactions, Main, Cube, Y = c + mx (response optimization)
RMSEP - Root Mean Square Error of Prediction
ROCOF - Rate of Change of Failure
RPEM - Rosenblueth's Point Estimation Method
RPM - Recurrence Prevention Meeting
RPN - Risk Priority Number (ref: FMEA) (more)
RSM - Response Surface Method
RSS - Root Sum Square (more)
RSS Analysis - Root Sum Square Analysis (more)
RTY - Rolled Throughput Yield (more)
R&M - Reliability & Maintainability
Quality Acronyms – Page 24 (Return to Index)
SARA - Scan, Analyze, Respond, Assess
SC - Significant Characteristic
SCAMPER - Substitute, Combine, Adapt, Modify, Put (to other uses), Eliminate,
Reverse (more)
SCAR - Supplier Corrective Action Report
SCOR - Supply Chain Operations Reference (more)
SCORE - Supplier Cost Reduction Effort (Chrysler)
SCP - Systematic Creativity Process
SDE - Supplier Development Engineer
SDS - System Design Specification
SDWT - Self Directed Work Teams (more)
SET - Simultaneous Engineering Team
SFDC - Shop Floor Data Collection
SFMEA - System Failure Mode and Effects Analysis
SIC - Standard Industrial Classification
SIPOC - Suppliers-Inputs-Process-Outputs-Customers (process thinking-helps with
deriving the process map) (more)
SIT - Structured Inventive Thinking
SMART - Specific Measurable Achievable Relevant Time Bound
SMED - Single Minute Exchange of Dies (more)
S/N - Signal to Noise ratio (more)
SNN - Supplier Non-conformance Notice
SNR - Signal to Noise Ratio
SOFM - Self Organizing Feature Map
Quality Acronyms – Page 17 (Return to Index)
SOP - Standard Operating Procedure (more); Start of Production
SORM - Second Order Reliability Method
SOW - Statement of Work
SP - System Procedure
SPC - Statistical Process Control (more)
SPIT - Single Point in Time
SPS - Statistical Problem Solving
SPSM - Structured Problem Solving Methodologies
SQA - Software Quality Assurance (more); Supplier Quality Assistance (more)
SQC - Statistical Quality Control (more)
SQE - Supplier Quality Engineering
SQTF - Supplier Quality Task Force
SSDD - Six Sigma for Design and Development
SSI - Sales Satisfaction Index (JD Power)
STAC - Statistical Test Acceptance Criteria
STAP - Short-Term Action Program
STCA - Space and Time Characteristics Analysis
STEP - Standard for the Exchange of Product Model Data
SWIMTOO - Scrap-rework, Waiting, Inventory, Motion, Transportation, Over-processing,
Over-production (See 7 wastes)
SWOT - Strengths, Weaknesses, Opportunities, Threats (more)
Quality Acronyms – Page 25 (Return to Index)
T&E - Tooling & Equipment
TBD - To Be Determined
TDU - Total Defects per Unit (more)
TGR – Things Gone Right
TGW – Things Gone Wrong
TRIZ - Theory of Inventive Problem Solving; (Teoriya Resheniya Izobreatatelskikh
Zadatch) (more)
TMAP or TMP - Thought Process Map (more)
TOC - Theory of Constraints (more)
TOPS - Team Oriented Problem Solving
TPM - Total Productive Maintenance (more)
TPS - Toyota Production System (more)
TQC - Total Quality Control (more)
TQM - Total Quality Management (more)
TR - Technical Report (more)
TRT - Transition Tree (more)
TS - Technical Specification (more)
Quality Acronyms – Page 26 (Return to Index)
UCL - Upper Control Limit (more)
UDE - Undesired Effects
USL - Upper Specification Limit (more)
V4L - Variety, Velocity, Variability, Visibility & Learning
VA / VE - Value Analysis / Value Engineering (more)
VLQ - Vehicle Line Quality
VOC - Voice of the Customer (more)
VOP - Voice of Process (more)
VPDQ - Vehicle Product Data Quality
VRT - Variability Reduction Team
VSA – Variation Simulation Analysis (i.e. Vis VSA)
VSM - Value Stream Mapping (more)
WFM - Work Flow Measurement (Management)
WI - Work Instructions
WIIFM - What's in it for me
WYSIWYG – What you see is what you get
YTD - Year To Date
Quality Acronyms – Page 19 (Return to Index)
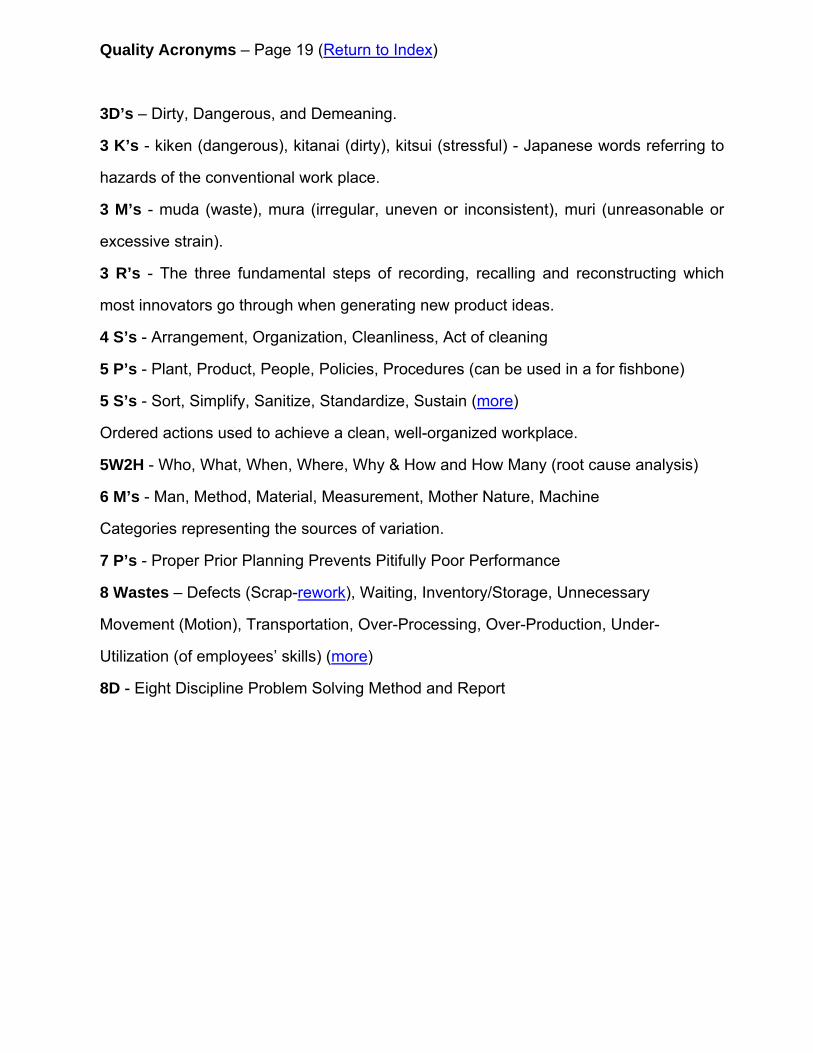
3D’s – Dirty, Dangerous, and Demeaning.
3 K’s - kiken (dangerous), kitanai (dirty), kitsui (stressful) - Japanese words referring to
hazards of the conventional work place.
3 M’s - muda (waste), mura (irregular, uneven or inconsistent), muri (unreasonable or
excessive strain).
3 R’s - The three fundamental steps of recording, recalling and reconstructing which
most innovators go through when generating new product ideas.
4 S’s - Arrangement, Organization, Cleanliness, Act of cleaning
5 P’s - Plant, Product, People, Policies, Procedures (can be used in a for fishbone)
5 S’s - Sort, Simplify, Sanitize, Standardize, Sustain (more)
Ordered actions used to achieve a clean, well-organized workplace.
5W2H - Who, What, When, Where, Why & How and How Many (root cause analysis)
6 M’s - Man, Method, Material, Measurement, Mother Nature, Machine
Categories representing the sources of variation.
7 P’s - Proper Prior Planning Prevents Pitifully Poor Performance
8 Wastes – Defects (Scrap-rework), Waiting, Inventory/Storage, Unnecessary
Movement (Motion), Transportation, Over-Processing, Over-Production, Under-
Utilization (of employees’ skills) (more)
8D - Eight Discipline Problem Solving Method and Report
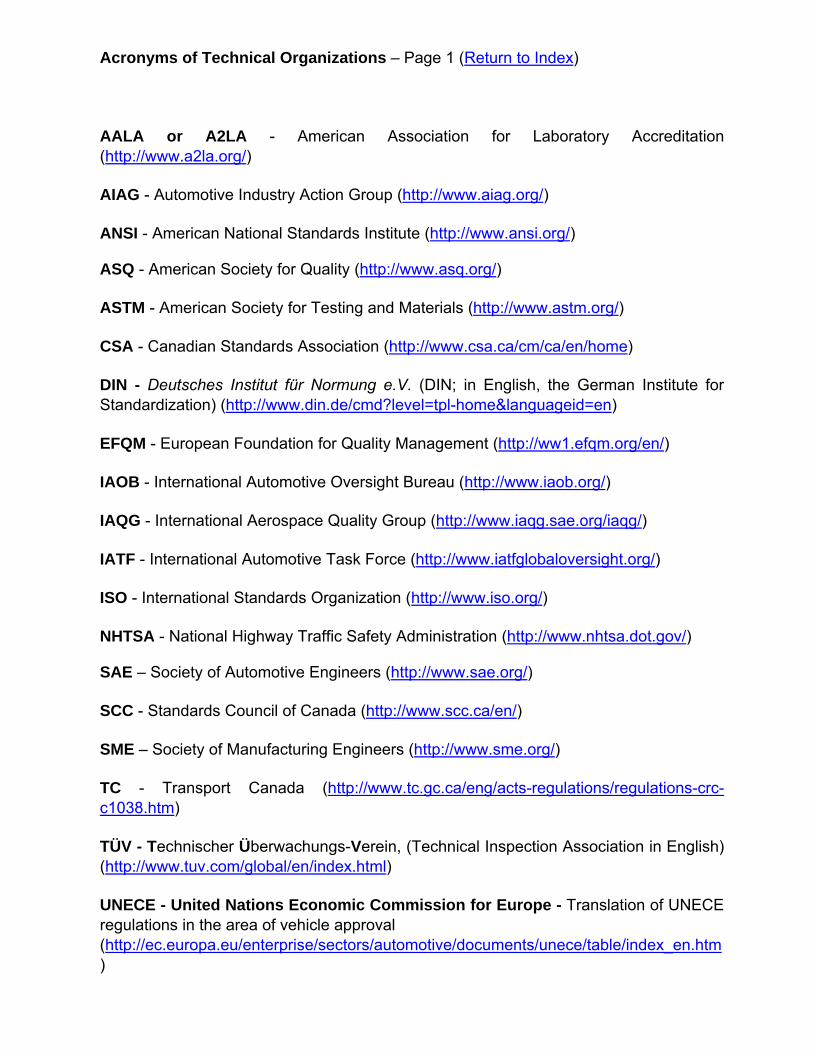
Acronyms of Technical Organizations – Page 1 (Return to Index)
AALA or A2LA - American Association for Laboratory Accreditation (http://www.a2la.org/)
AIAG - Automotive Industry Action Group (http://www.aiag.org/)
ANSI - American National Standards Institute (http://www.ansi.org/)
ASQ - American Society for Quality (http://www.asq.org/)
ASTM - American Society for Testing and Materials (http://www.astm.org/)
CSA - Canadian Standards Association (http://www.csa.ca/cm/ca/en/home)
DIN - Deutsches Institut für Normung e.V. (DIN; in English, the German Institute for Standardization) (http://www.din.de/cmd?level=tpl-home&languageid=en)
EFQM - European Foundation for Quality Management (http://ww1.efqm.org/en/)
IAOB - International Automotive Oversight Bureau (http://www.iaob.org/)
IAQG - International Aerospace Quality Group (http://www.iaqg.sae.org/iaqg/)
IATF - International Automotive Task Force (http://www.iatfglobaloversight.org/)
ISO - International Standards Organization (http://www.iso.org/)
NHTSA - National Highway Traffic Safety Administration (http://www.nhtsa.dot.gov/)
SAE – Society of Automotive Engineers (http://www.sae.org/)
SCC - Standards Council of Canada (http://www.scc.ca/en/)
SME – Society of Manufacturing Engineers (http://www.sme.org/)
TC - Transport Canada (http://www.tc.gc.ca/eng/acts-regulations/regulations-crc-c1038.htm)
TÜV - Technischer Überwachungs-Verein, (Technical Inspection Association in English) (http://www.tuv.com/global/en/index.html)
UNECE - United Nations Economic Commission for Europe - Translation of UNECE regulations in the area of vehicle approval (http://ec.europa.eu/enterprise/sectors/automotive/documents/unece/table/index_en.htm)
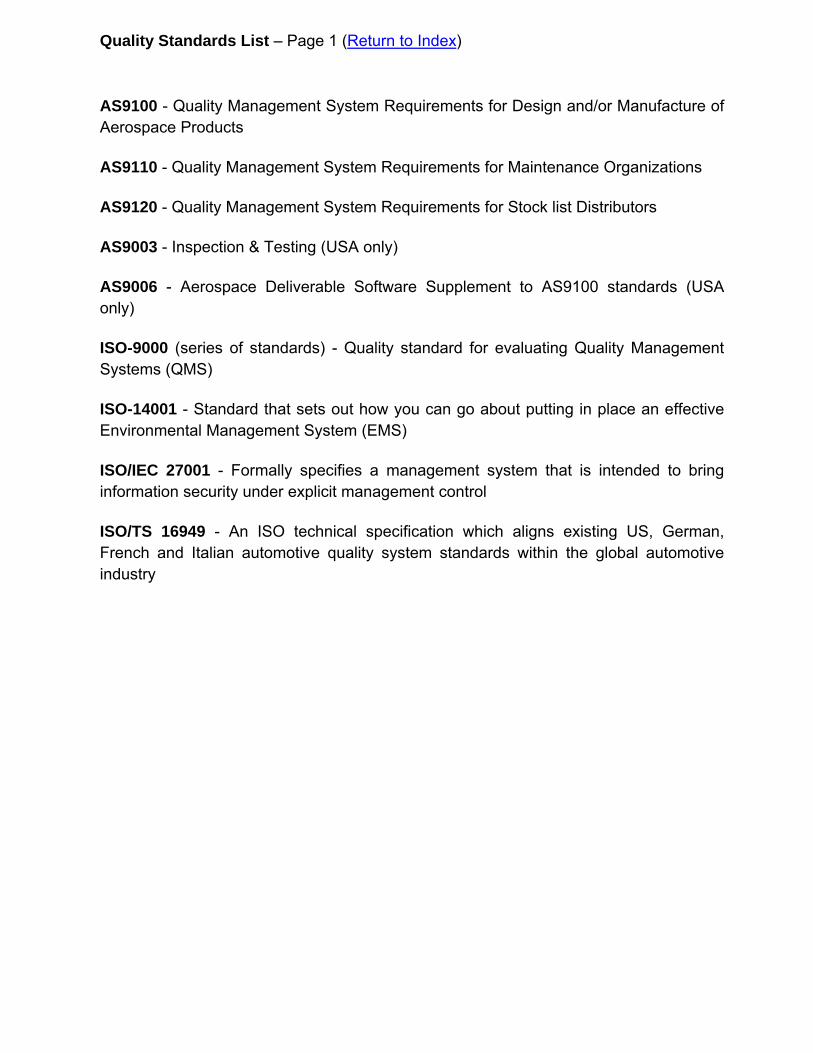
Quality Standards List – Page 1 (Return to Index)
AS9100 - Quality Management System Requirements for Design and/or Manufacture of Aerospace Products
AS9110 - Quality Management System Requirements for Maintenance Organizations
AS9120 - Quality Management System Requirements for Stock list Distributors
AS9003 - Inspection & Testing (USA only)
AS9006 - Aerospace Deliverable Software Supplement to AS9100 standards (USA only)
ISO-9000 (series of standards) - Quality standard for evaluating Quality Management Systems (QMS)
ISO-14001 - Standard that sets out how you can go about putting in place an effective Environmental Management System (EMS)
ISO/IEC 27001 - Formally specifies a management system that is intended to bring information security under explicit management control
ISO/TS 16949 - An ISO technical specification which aligns existing US, German, French and Italian automotive quality system standards within the global automotive industry
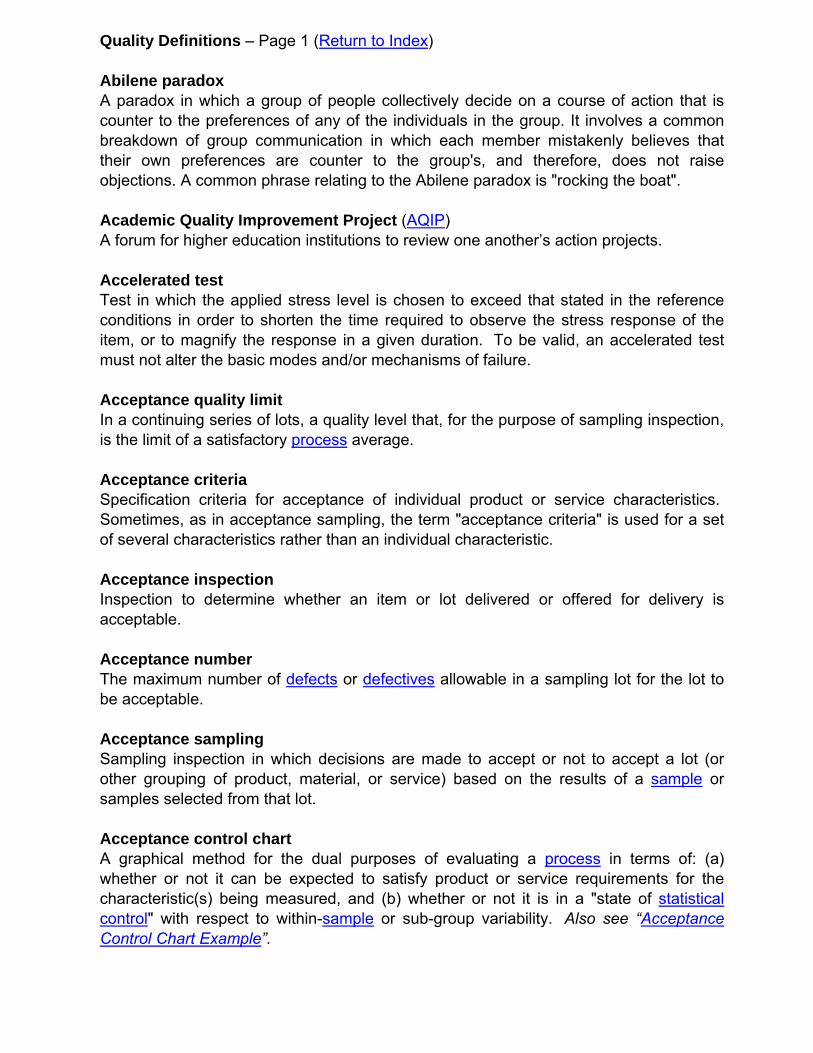
Quality Definitions – Page 1 (Return to Index) Abilene paradox A paradox in which a group of people collectively decide on a course of action that is counter to the preferences of any of the individuals in the group. It involves a common breakdown of group communication in which each member mistakenly believes that their own preferences are counter to the group's, and therefore, does not raise objections. A common phrase relating to the Abilene paradox is "rocking the boat". Academic Quality Improvement Project (AQIP) A forum for higher education institutions to review one another’s action projects. Accelerated test Test in which the applied stress level is chosen to exceed that stated in the reference conditions in order to shorten the time required to observe the stress response of the item, or to magnify the response in a given duration. To be valid, an accelerated test must not alter the basic modes and/or mechanisms of failure. Acceptance quality limit In a continuing series of lots, a quality level that, for the purpose of sampling inspection, is the limit of a satisfactory process average. Acceptance criteria Specification criteria for acceptance of individual product or service characteristics. Sometimes, as in acceptance sampling, the term "acceptance criteria" is used for a set of several characteristics rather than an individual characteristic. Acceptance inspection Inspection to determine whether an item or lot delivered or offered for delivery is acceptable. Acceptance number The maximum number of defects or defectives allowable in a sampling lot for the lot to be acceptable. Acceptance sampling Sampling inspection in which decisions are made to accept or not to accept a lot (or other grouping of product, material, or service) based on the results of a sample or samples selected from that lot. Acceptance control chart A graphical method for the dual purposes of evaluating a process in terms of: (a) whether or not it can be expected to satisfy product or service requirements for the characteristic(s) being measured, and (b) whether or not it is in a "state of statistical control" with respect to within-sample or sub-group variability. Also see “Acceptance Control Chart Example”.
Quality Definitions – Page 2 (Return to Index) Acceptance sampling plan A specific plan that indicates the sampling sizes and associated acceptance or nonacceptance criteria to be used. Accreditation Certification by a recognized body of the facilities, capability, objectivity, competence and integrity of an agency, service or operational group or individual to provide the specific service or operation needed. Accreditation body An organization with authority to accredit other organizations to perform services such as quality system certification. Accredited registrars Accredited Registrars are qualified organizations certified by a national body to perform audits to the QS9000 standard and to register the audited facility as meeting these requirements for a given commodity. Acceptable Quality Level (AQL) AQL is limit of a satisfactory process average at a particular quality level when a continuing series of lots is considered. Also called “average quality level”. Accuracy The closeness of agreement between an observed value and an accepted reference value. Also see “precision”. ACLASS Accreditation Services An ANSI-ASQ National Accreditation Board company that provides accreditation services for: testing and calibration laboratories in accordance with ISO/IEC 17025; reference material producers in accordance with ISO Guide 34; and inspection bodies in accordance with ISO/IEC 17020. Activity Based Costing (ABC) A system for making business decisions based on cost information of fundamental business activities as tasks related to product design, development, quality, manufacturing, distribution, customer acquisition, service and support. ABC is sometimes considered a form of business process re-engineering as it insists on surfacing a manageable number of cost drivers that can be used to trace variable business costs to customer, products and processes.
Quality Definitions – Page 3 (Return to Index) Activity network diagram An arrow diagram used in planning. Also see “Activity Network Diagram Example”. Advanced Product Quality Planning (APQP) A structured method of defining the steps necessary to ensure that a product satisfies the customer. In the automotive industry, APQP is a systematic product introduction process that aims to facilitate supply chain communication and ensure quality throughout the vehicle development process. It is used during the design and development of new vehicles and component systems to reduce the risk of unexpected failure due to errors in design and manufacture. This is a structured method of defining and establishing the steps necessary to assure that a product satisfies the customer. Also see “PPAP”. Adverse event Healthcare term for any event that is not consistent with the desired, normal or usual operation of the organization; also known as a sentinel event. Affinity diagram A way to organize facts, opinions, ideas and issues into natural groupings as an aid to diagnosis on a complex problem. A large number of ideas are generated and then organized into groupings to reveal major themes. Agile manufacturing Tools, techniques, and initiatives that enable a plant or company to thrive under conditions of unpredictable change. Agile manufacturing not only enables a plant to achieve rapid response to customer needs, but also includes the ability to quickly reconfigure operations and strategic alliances to respond rapidly to unforeseen shifts in the marketplace. Alignment Actions to ensure that a process or activity supports the organization’s strategy, goals and objectives. American Association for Laboratory Accreditation (A2LA) An organization that formally recognizes another organization’s competency to perform specific tests, types of tests or calibrations. American Customer Satisfaction Index (ACSI) Released for the first time in October 1994, an economic indicator and cross industry measure of the satisfaction of U.S. household customers with the quality of the goods and services available to them. This includes goods and services produced in the United States and imports from foreign firms that have substantial market shares or dollar sales. ASQ is a founding sponsor of the ACSI, along with the University of Michigan Business School and the CFI Group.
Quality Definitions – Page 4 (Return to Index) American National Standards Institute (ANSI) A private, nonprofit organization that administers and coordinates the U.S. voluntary standardization and conformity assessment system. It is the U.S. member body in the International Organization for Standardization, known as ISO. American National Standards Institute-American Society for Quality (ANSI-ASQ) Organization that accredits certification bodies for ISO 9001 quality management systems, ISO 14001 environmental management systems and other industry specific requirements. American Society for Nondestructive Testing (ASNT) A technical society for non-destructive testing (NDT) professionals. American Society for Quality (ASQ) A professional, non-profit association that develops, promotes and applies quality related information and technology for the private sector, government and academia. ASQ serves more than 108,000 individuals and 1,100 corporate members in the United States and 108 other countries. American Society for Quality Control (ASQC) Name of ASQ from 1946 through the middle of 1997, when the name was changed to ASQ. American Society for Testing and Materials (ASTM) Non-profit organization that provides a forum for the development and publication of voluntary consensus standards for materials, products, systems and services. American Society for Testing and Materials (ASTM) International International non-profit organization that provides a forum for the development and publication of voluntary consensus standards for materials, products, systems and services. American Society for Training and Development (ASTD) A membership organization providing materials, education and support related to workplace learning and performance. American Standard Code for Information Interchange (ASCII) Basic computer characters accepted by all American machines and many foreign ones.
Quality Definitions – Page 5 (Return to Index) Analysis of Means (ANOM) A statistical procedure for troubleshooting industrial processes and analyzing the results of experimental designs with factors at fixed levels. It provides a graphical display of data. Ellis R. Ott developed the procedure in 1967 because he observed that nonstatisticians had difficulty understanding analysis of variance. Analysis of means is easier for quality practitioners to use because it is an extension of the control chart. In 1973, Edward G. Schilling further extended the concept, enabling analysis of means to be used with non-normal distributions and attributes data in which the normal approximation to the binomial distribution does not apply. This is referred to as analysis of means for treatment effects. Also see “Analysis of Means (ANOM) Chart Example”. Analysis of Variance (ANOVA) A basic statistical technique for determining the proportion of influence a factor or set of factors has on total variation. It subdivides the total variation of a data set into meaningful component parts associated with specific sources of variation to test a hypothesis on the parameters of the model or to estimate variance components. There are three models: fixed, random and mixed. Analytical Hierarchy Process (AHP) Developed by Thomas Saaty, AHP provides a proven, effective means to deal with complex decision making and can assist with identifying and weighting selection criteria, analyzing the data collected for the criteria and expediting the decision-making process. Andon board A production area visual control device, such as a lighted overhead display. It communicates the status of the production system and alerts team members to emerging problems (from andon, a Japanese word meaning “light”). It is one of the main tools of Jidohka. An example of visual management or visual control. ANOVA Gauge Repeatability & Reproducibility Is a Measurement Systems Analysis technique which uses Analysis of Variance (ANOVA) random effects model to assess a measurement system. Also see “gauge R&R”. ANSI ACS X12 Transaction standards for electronic communication and shipping notification. Appearance Approval Report (AAR) A standard report form, to communicate information on product / part appearance. Appearance item A product that is visible once the vehicle is complete. Certain customers will identify appearance items on the engineering drawings. In these cases, special approval for appearance (color, grain, texture, etc.) is required prior to production part submissions.
Quality Definitions – Page 6 (Return to Index) Apportionment Synonymous with the term Reliability Apportionment, which is the assignment of reliability goals from system to subsystem in such a way that the whole system will have the required reliability. Appraisal cost The cost of ensuring an organization is continually striving to conform to customers’ quality requirements. Approved drawing Is an engineering drawing signed by the engineer and released through the customer's system. Approved material Approved Materials are materials governed either by industry standard specifications (e.g., SAE, ASTM, DIN, ISO, etc.) or by customer specifications. Arrow diagram A planning tool to diagram a sequence of events or activities (nodes) and their interconnectivity. It is used for scheduling and especially for determining the critical path through nodes. Also see “ Arrow Diagram Example”. AS9100 An international quality management standard for the aerospace industry published by the Society of Automotive Engineers and other organizations worldwide. It is known as EN9100 in Europe and JIS Q 9100 in Japan. The standard is controlled by the International Aerospace Quality Group. Also see “JIS Q 9100”. Asia Pacific Laboratory Accreditation Cooperation (APLAC) A cooperative of laboratory accreditation bodies. Assessment A systematic evaluation procedure of collecting and analyzing data to determine the current, historical or projected compliance of an organization to a standard. This process includes a document review, an on-site audit, and an analysis and report. Customers may also include a self-assessment, internal audit results and other materials in the assessment. Assignable cause A name for the source of variation in a process that is not due to chance and therefore can be identified and eliminated. Also called “special cause”.
Quality Definitions – Page 7 (Return to Index) Assn. for Quality and Participation (AQP) It was an independent organization until 2004, when it became an affiliate organization of ASQ. Continues today as ASQ’s Team and Workplace Excellence Forum. Attribute The property a unit has of being either bad or good. That is, the quality characteristic of a unit is either within the specified requirements or it is not. Attribute data Attributes data are qualitative data that can be counted for recording and analysis. Examples include the presence or absence of a required label, the installation of all required fasteners. Attributes data are not acceptable for production part submissions unless variables data cannot be obtained. The control charts based on attribute data are percent chart, number of affected units chart, count chart, count-per-unit chart, quality score chart, and demerit chart. Audit The on-site verification activity, such as inspection or examination, of a process or quality system, to ensure compliance to requirements. An audit can apply to an entire organization or might be specific to a function, process or production step. Automotive Industry Action Group (AIAG) A global automotive trade association with about 1,600 member companies that focuses on common business procedures, implementation guidelines, education and training. Autonomation A form of automation in which machinery automatically inspects each item after producing it and ceases production and notifies humans if a defect is detected. Toyota expanded the meaning of jidohka to include the responsibility of all workers to function similarly—to check every item produced and, if a defect is detected, make no more until the cause of the defect has been identified and corrected. Also see “jidohka”. Availability The ability of a product to be in a state to perform its designated function under stated conditions at a given time. Average amount of inspection In a given sampling scheme, the number of items expected to be inspected per lot in order to reach a decision for a certain average batch quality level. Average chart A control chart in which the subgroup average, X-bar, is used to evaluate the stability of the process level. Also see “Control Chart Examples”.
Quality Definitions – Page 8 (Return to Index) Average Outgoing Quality (AOQ) The expected average quality level of outgoing product for a given value of incoming product quality. Average Outgoing Quality Limit (AOQL) The maximum average outgoing quality over all possible levels of incoming quality for a given acceptance sampling plan and disposal specification. Average Run Lengths (ARL) On a control chart, the number of subgroups expected to be inspected before a shift in magnitude takes place. Average Sample Number (ASN) The average number of sample units inspected per lot when reaching decisions to accept or reject. Average Total Inspection (ATI) The average number of units inspected per lot, including all units in rejected lots (applicable when the procedure calls for 100% inspection of rejected lots). A3 report The A3 report is a tool used for problem solving in the course of work. The name "A3" describes the size of paper on which the report is written. The steps of the report include identifying a problem, understanding the current condition, determining the root cause, developing a target condition, implementation plan, and follow-up plan. These steps are all written and drawn (not typed) out on a single piece of A3 paper. Axiomatic design A systems design methodology using matrix methods to systematically analyze the transformation of customer needs into functional requirements, design parameters, and process variables.
Quality Definitions – Page 9 (Return to Index) Baka-yoke A Japanese term for a manufacturing technique for preventing mistakes by designing the manufacturing process, equipment and tools so an operation literally cannot be performed incorrectly. In addition to preventing incorrect operation, the technique usually provides a warning signal of some sort for incorrect performance. Also see “poka-yoke”. Balanced array In an experiment the array of factors and levels must be balanced. To satisfy this there must be:
1. Equal numbers of levels in each column. 2. The Sum Product of each pair of columns equals zero (taking levels as '+' and '-').
Balanced plant A plant in which the capacity of all resources is balanced exactly with market demand. Balanced scorecard A framework which translates a company's vision and strategy into a coherent set of performance measures. A balanced business scorecard helps businesses evaluate how well they meet their strategic objectives. It typically has four to six components, each with a series of sub-measures. Each component highlights one aspect of the business. The balanced scorecard includes measures of performance that are lagging (return on capital, profit), medium-term indicators (like customer satisfaction indices) and leading indicators (such as adoption rates for, or revenue from, new products). Balancing the line The process of evenly distributing both the quantity and variety of work across available work time, avoiding overburden and underuse of resources. This eliminates bottlenecks and downtime, which translates into shorter flow time. Baldrige award See “Malcolm Baldrige National Quality Award”. Bartlett test A form of F-test for more than 2 samples of data. Used for showing equal variances for normal data. Bartlett's test is sensitive to departures from normality. That is, if your samples come from non-normal distributions, then Bartlett's test may simply be testing for non-normality. The Levene test and Brown-Forsythe test are alternatives to the Bartlett test that are less sensitive to departures from normality. Baseline measurement The beginning point, based on an evaluation of output over a period of time, used to determine the process parameters prior to any improvement effort; the basis against which change is measured.
Quality Definitions – Page 10 (Return to Index) Batch A definite quantity of some product or material produced under conditions that are considered uniform. Batch and queue Producing more than one piece and then moving the pieces to the next operation before they are needed. Bathtub curve The sum of all reliability failures over time. Consists of the effects of early life failures, useful life failures and wear out failures. Bayes’ theorem A formula to calculate conditional probabilities by relating the conditional and marginal probability distributions of random variables. Bayesian inference A numerical estimate of the degree of belief in a hypothesis before and after evidence has been observed. Benchmarking A technique in which a company measures its performance against that of best in class companies, determines how those companies achieved their performance levels and uses the information to improve its own performance. Subjects that can be benchmarked include strategies, operations and processes. Benchmark data The results of an investigation to determine how competitors and/or best-in-class companies achieve their level of performance. Benefit-cost analysis An examination of the relationship between the monetary cost of implementing an improvement and the monetary value of the benefits achieved by the improvement, both within the same time period. Best practices A superior method or innovative practice that contributes to the improved performance of an organization, usually recognized as best by other peer organizations. Bias A systematic error which contributes to the difference between a population mean of measurements or test results and an accepted reference value. It is the difference between the observed range of measurements and a reference (known) value.
Quality Definitions – Page 11 (Return to Index) Big Q, little q A term used to contrast the difference between managing for quality in all business processes and products (big Q) and managing for quality in a limited capacity—traditionally only in factory products and processes (little q). Bimodal distribution A statistical distribution having two modes - indicating a mixing of two populations such as different shifts, machines, workers, etc. Binomial distribution The distribution of a binomial response variable, one which has two possible outcomes - yes, no; pass, fail, etc. Bill of Material (BOM) Total list of all components/materials required to manufacture the product. Black Belt (BB) A leadership structure for Six-sigma process improvement teams. Black Belts are highly-regarded, technically-oriented product or line personnel who have an ability to lead teams as well as to advise management. Full-time team leader responsible for implementing process improvement projects—define, measure, analyze, improve and control (DMAIC) or define, measure, analyze, design and verify (DMADV)—within a business to drive up customer satisfaction and productivity levels. Blemish An imperfection severe enough to be noticed but that should not cause any real impairment with respect to intended normal or reasonably foreseeable use. Also see “defect”, “imperfection” and “nonconformity”. Block diagram A diagram that shows the operation, interrelationships and interdependencies of components in a system. Boxes, or blocks (hence the name), represent the components; connecting lines between the blocks represent interfaces. There are two types of block diagrams:
1. A functional block diagram, which shows a system’s subsystems and lower level products and their interrelationships and which interfaces with other systems.
2. A reliability block diagram, which is similar to the functional block diagram but is modified to emphasize those aspects influencing reliability.
They are heavily used in the engineering world in hardware design, software design, and process flow diagrams. Also see “Block Diagram Example”. Blocking A technique used in classical DOE to remove the effects of unwanted noise or variability from the experimental response so that only the effects from the control factors are present in the response data.
Quality Definitions – Page 12 (Return to Index) Board of Standards Review (BSR) An American National Standards Institute board responsible for the approval and withdrawal of American National Standards. Body of Knowledge (BOK) The prescribed aggregation of knowledge in a particular area an individual is expected to have mastered to be considered or certified as a practitioner. Bottleneck Any resource whose capacity is equal to or less than the demand placed on it. Bottom line The essential or salient point; the primary or most important consideration. Also, the line at the bottom of a financial report that shows the net profit or loss. Boundary diagram Graphical illustration of a process or product and its interfaces to other parts, processes, sub-systems and systems. Also see “Boundary Diagram Example.” Box plot A box plot, also known as a box and whisker diagram, is a basic graphing tool that displays centering, spread, and distribution of a continuous data set. Also see “Box and Whisker Plot Analysis”. Box Score reporting Box Scores are used widely within lean accounting. The standard format of the box score shows a 3-dimensional view of value stream performance; operational performance measurements, financial performance, and how the value stream capacity is being used. The capacity information shows how much of the capacity within the value stream is used productively, how much is used to do non-productive activities, and how much value stream capacity is available for use. The box score shows the value stream performance on a single sheet of paper and using a simple and accessible format. Also see “Box Score Reporting Example” and “Decision-Making using Box Scores”. Brainstorming A method to get ideas from persons who are potential contributors. No criticism or discussion of ideas is allowed until all the ideas are recorded. The ideas are critically reviewed after the brainstorming session. Breakthrough improvement A dynamic, decisive movement to a new, higher level of performance. Brown–Forsythe test The Brown and Forsyth test statistic is the F statistic resulting from an ordinary one-way analysis of variance on the absolute deviations from the median.

Quality Definitions – Page 13 (Return to Index) BS 7799 A standard written by British commerce, government and industry stakeholders to address information security management issues, including fraud, industrial espionage and physical disaster. Might become an International Organization for Standardization standard. Build-To-Schedule Ratio (BTS) A metric that measures how well a plant executes plans to produce precisely what customers, in the proper sequence and mix. Bulk materials Products that do not have the characteristics of formed parts when received, but become part of the product during the manufacturing process.
Business process Series of logically related activities or tasks (such as planning, production, sales) performed together to produce a defined set of results. Also called “business function”. Business process mapping Refers to activities involved in defining exactly what a business entity does, who is responsible, to what standard a process should be completed and how the success of a business process can be determined. Business Process Management System (BPMS) A nine step model enables companies to model, deploy and manage mission-critical business processes, that span multiple enterprise applications, corporate departments. BPMS is usually used for lesser mature processes to make them Repeatable & Reliable. The nine step approach includes:
1. Create Process Mission. 2. Document Process. 3. Document Customer & Process requirements. 4. Identify Output & Process Measures. 5. Build process management system. 6. Establish data collection plan. 7. Process performance monitoring. 8. Develop dashboards with spec limits & targets. 9. Identify improvement opportunities.
Business Process Reengineering (BPR) The concentration on improving a business' process(es) to deliver output(s) that will achieve results meeting the firm’s objectives, priorities and mission. Bx Life The time at which x% of parts are expected to have failed. For example, B5 Life = time at which 5% of parts have failed.
Quality Definitions – Page 14 (Return to Index) c-chart See “count chart”. Calibration The comparison of a measurement instrument or system of unverified accuracy to a measurement instrument or system of known accuracy to detect any variation from the required performance specification. Capability The total range of inherent variation in a stable process determined by using data from control charts. Capability index The ratio of tolerance to 6 sigma, or the upper specification limit (USL) minus the lower specification limit (LSL) divided by 6 sigma. It is sometimes referred to as the engineering tolerance divided by the natural tolerance and is only a measure of dispersion. Measures of the capability of a manufacturing process to produce parts within given upper and lower variability limits (tolerances). In a process that is in statistical control (has only common causes of variation), as the Cp increases so does the difference between what the process is capable of producing and what it is required to produce. A Cp of 1 indicates 0.3 percent rejects or 3000 rejected parts per million (PPM), and is called the condition of Three Sigma. A Cp of 2 indicates 0.0007 percent rejects or 7 rejected ppm, a condition of six sigma. Also called process capability index, production capability index, or production capability ratio. Formula: (Upper variability limit - Lower variability limit) ÷ 6 x Standard deviation of the spread of variation. Capability Maturity Model (CMM) A framework that describes the key elements of an effective software process. It’s an evolutionary improvement path from an immature process to a mature, disciplined process. The CMM covers practices for planning, engineering and managing software development and maintenance to improve the ability of organizations to meet goals for cost, schedule, functionality and product quality. Capacity constraint resources A series of non-bottlenecks (based on the sequence in which jobs are performed) that can act as a constraint. Cascading The continuing flow of the quality message down to, not through, the next level of supervision until it reaches all workers. Also see “deployment”.
Quality Definitions – Page 15 (Return to Index) CASCO An International Organization for Standardization policy development committee for conformity assessment. Cause An identified reason for the presence of a defect or problem. Cause and effect diagrams A tool for analyzing process dispersion. Also see Fishbone or Ishikawa Diagrams. One of the 7 Basic Tools of Quality Control. Also see “Ishikawa Diagram Example”. Cell An arrangement of people, machines, materials and equipment in which the production (processing) steps are placed next to each other in sequential order and through which parts are produced (processed) in a continuous flow. The most common cell layout is a U shape. Cellular manufacturing Arranging machines in the correct production (processing) sequence, with operators remaining within the cell and materials presented to them from outside. CE mark A mandatory conformity mark on many products placed on the single market in the European Economic Area (EEA). The CE marking certifies that a product has met EU consumer safety, health or environmental requirements. CE stands for Conformité Européenne, "European conformity" in French. Centerline A line on a graph that represents the overall average (mean) operating level of the process. Central tendency The tendency of data gathered from a process to cluster toward a middle value somewhere between the high and low values of measurement. Certification The result of a person meeting the established criteria set by a certificate granting organization. Certified Biomedical Auditor (CBA) An ASQ certification. Certified Calibration Technician (CCT) An ASQ certification.
Quality Definitions – Page 16 (Return to Index) Certified HACCP Auditor (CHA) An ASQ certification. Certified Manager of Quality/Organizational Excellence (CMQ/OE) An ASQ certification; formerly certified quality manager (CQM). Certified Quality Auditor (CQA) An ASQ certification. Certified Quality Engineer (CQE) An ASQ certification. Certified Quality Improvement Associate (CQIA) An ASQ certification. Certified Quality Inspector (CQI) An ASQ certification; formerly certified mechanical inspector (CMI). Certified Quality Process Analyst (CQPA) An ASQ certification. Certified Quality Technician (CQT) An ASQ certification. Certified Reliability Engineer (CRE) An ASQ certification. Certified Six Sigma Black Belt (CSSBB) An ASQ certification. Certified Six Sigma Green Belt (CSSGB) An ASQ certification. Certified Software Quality Engineer (CSQE) An ASQ certification. Chain reaction A chain of events described by W. Edwards Deming: improve quality, decrease costs, improve productivity, increase market with better quality and lower price, stay in business, provide jobs and provide more jobs.
Quality Definitions – Page 17 (Return to Index) Chain sampling plan In acceptance sampling, a plan in which the criteria for acceptance and rejection apply to the cumulative sampling results for the current lot and one or more immediately preceding lots. Champion A business leader or senior manager who ensures resources will be available for training and projects, and who is involved in periodic project reviews; also an executive who supports and addresses Six Sigma organizational issues. Change agent An individual from within or outside an organization who facilitates change in the organization; might be the initiator of the change effort, but not necessarily. Changeover A process in which a production device is assigned to perform a different operation or a machine is set up to make a different part—for example, a new plastic resin and new mold in an injection molding machine. Changeover time The time required to modify a system or workstation, usually including both teardown time for the existing condition and setup time for the new condition. Characteristic The factors, elements or measures that define and differentiate a process, function, product, service or other entity. Characteristic matrix An analytical technique for displaying the relationship between process parameters and manufacturing stations. Chart A tool for organizing, summarizing and depicting data in graphic form. Charter A written commitment approved by management stating the scope of authority for an improvement project or team. Checklist A tool for ensuring that all the important steps or actions in an operation have been taken. Checklists contain items important or relevant to an issue or situation. Checklists are often confused with check sheets.
Quality Definitions – Page 18 (Return to Index) Check sheet A simple document that is used for collecting data in real-time and at the location where the data is generated. The document is typically a blank form that is devised for the quick, easy, and efficient recording of the desired information, which can be either quantitative or qualitative. When the information is quantitative, the check sheet is sometimes called a tally sheet. One of the 7 Basic Tools of Quality Control. Chi-square Automatic Interaction Detection (CHAID) A statistical technique used to segment customers on the basis of multiple alternative variables. The analysis creates a segmentation tree and continues to add different variables (branches), to the tree as long as it is statistically significant. Classification of defects The listing of possible defects of a unit, classified according to their seriousness. Note: Commonly used classifications: class A, class B, class C, class D; or critical, major, minor and incidental; or critical, major and minor. Definitions of these classifications require careful preparation and tailoring to the product(s) being sampled to ensure accurate assignment of a defect to the proper classification. A separate acceptance sampling plan is generally applied to each class of defects. Closed-Loop Corrective Action (CLCA) A sophisticated engineering system to document, verify and diagnose failures, recommend and initiate corrective action, provide follow-up and maintain comprehensive statistical records. Code of conduct: Expectations of behavior are mutually agreed upon by the team members. Collaborative Sketch (C-Sketch) Similar to Method 635, except that its starting point is the initial presentation of a single design concept, as a sketch, by each of the team members. Combinatorial optimization The efficient allocation of limited resources to yield the best solution to meet the objectives when the values of some or all of the variables must be integers and there are many possible combinations. Common causes Used to refer to variation that happens in the same way from worker to worker, hour to hour, lot to lot, etc. On a control chart, common causes by definition always fall within control limits. Also see “special causes”. Company culture A system of values, beliefs and behaviors inherent in a company. To optimize business performance, top management must define and create the necessary culture.
Quality Definitions – Page 19 (Return to Index) Complaint tracking Collecting data, disseminating them to appropriate persons for resolution, monitoring complaint resolution progress and communicating results. Compliance The state of an organization that meets prescribed specifications, contract terms, regulations or standards. Computer Aided Design (CAD) A type of software used by architects, engineers, drafters and artists to create precision drawings or technical illustrations of their designs. CAD software can be used to create 2-D drawings or 3-D models. Computer Aided Engineering (CAE) A broad term used by the electronic design automation industry for the use of computers to design, analyze and manufacture products and processes. CAE includes CAD and computer aided manufacturing (CAM), which is the use of computers for managing manufacturing processes. Computer-aided manufacturing (CAM) The use of computer software to control machine tools and related machinery in the manufacturing of work pieces. CAM may also refer to the use of a computer to assist in all operations of a manufacturing plant, including planning, management, transportation and storage. Concurrent Engineering (CE) A way to reduce cost, improve quality and shrink cycle time by simplifying a product’s system of life cycle tasks during the early concept stages. Conflict resolution The management of a conflict situation to arrive at a resolution satisfactory to all parties. Conflict Resolution Diagram (CRD) See “evaporating cloud”. (Part of the Theory of Constraints Thinking Process). Also see “Conflict Resolution Diagram Example”. Conformance An affirmative indication or judgment that a product or service has met the requirements of a relevant specification, contract or regulation. Conformity assessment All activities concerned with determining that relevant requirements in standards or regulations are fulfilled, including sampling, testing, inspection, certification, management system assessment and registration, accreditation of the competence of those activities and recognition of an accreditation program’s capability. .
Quality Definitions – Page 20 (Return to Index) Confounding Allowing two or more variables to vary together so that it is impossible to separate their unique effects. If an experiment does not vary x and y separately then the effects of the two factors cannot be distinguished. Blocking may be used to separate these effects where one is expected to be a critical x and one appears to be noise. The main effects and interactions can be confounded in order to reduce the number of runs in a fractional factorial design of experiments. Conjoint analysis Involves measurement of psychological judgments (such as one's preferences) or perceived similarities or differences between alternatives (for example - which factors - price, quality, dealer location - are most important to customers when buying a new car). Conjoint measurement The difference from conjoint analysis is that it permits the use of rating when evaluating pairs of attributes or attribute profiles. Consensus A state in which all the members of a group support an action or decision, even if some of them don’t fully agree with it. Constraint Anything that limits a system from achieving higher performance or throughput; also, the bottleneck that most severely limits the organization’s ability to achieve higher performance relative to its purpose or goal. Constraint analysis The use of one or more constraint satisfaction algorithms to specify the set of feasible solutions. Constraints are programmed in rules or procedures that produce solutions to particular configuration and design problems using one or more constraint satisfaction algorithms. Constraints management See “theory of constraints”. Consultant An individual who has experience and expertise in applying tools and techniques to resolve process problems and who can advise and facilitate an organization’s improvement efforts. Consumer The external customer to whom a product or service is ultimately delivered; also called end user. Consumer risk Pertains to sampling and the potential risk that bad products will be accepted and shipped to the consumer.
Quality Definitions – Page 21 (Return to Index) Contingency table A two-dimensional table constructed for classifying count data, the purpose of which is to determine whether two variables are dependent (or contingent) on each other. Continuous flow processing A method in which items are produced and moved from one production (processing) step to the next, one piece at a time. Each stage (process) makes only the one piece that the next stage (process) needs, and the transfer batch size is one. Also referred to as one-piece flow and single-piece flow. Continuous Improvement (CI) Process An ongoing effort to improve products, services or processes. These efforts can seek "incremental" improvement over time or "breakthrough" improvement all at once. Delivery (customer valued) processes are constantly evaluated and improved in the light of their efficiency, effectiveness and flexibility. Continuous Quality Improvement (CQI) A philosophy and attitude for analyzing capabilities and processes and improving them repeatedly to achieve customer satisfaction. Continuous sampling plan In acceptance sampling, a plan, intended for application to a continuous flow of individual units of product, which involves acceptance and rejection on a unit-by-unit basis and employs alternate periods of 100% inspection and sampling. The relative amount of 100% inspection depends on the quality of submitted product. Continuous sampling plans usually require that each t period of 100% inspection be continued until a specified number, i, of consecutively inspected units are found clear of defects. Note: For single level continuous sampling plans, a single d sampling rate (for example, inspect one unit in five or one unit in 10) is used during sampling. For multilevel continuous sampling plans, two or more sampling rates can be used. The rate at any time depends on the quality of submitted product. Control chart Based on the statistical variation of any process - control charts help focus on stability of a process. A graphical tool for monitoring a process and/or for determining where variation lies; control charts show results over time, with +/- 3σ boundaries representing the upper and lower control limits (UCL/LCLs). The chart frequently shows a central line to help detect a trend of plotted values toward either control limit. One of the 7 Basic Tools of Quality Control. Also see “Control Chart Examples”. Control limits The natural boundaries of a process within specified confidence levels, expressed as the upper control limit (UCL) and the lower control limit (LCL).
Quality Definitions – Page 22 (Return to Index) Control plan Written descriptions of the systems for controlling part and process quality by addressing the key characteristics and engineering requirements. They are written by suppliers to address the important characteristics and engineering requirements of the product. Each part shall have a Control Plan, but in many cases, "family" Control Plans can cover a number of parts produced using a common process. Customer approval of Control Plans may be required prior to production part submission. Control methods Standard methods implemented during the “control” phase of the DMAIC process include: fix, minimize, standardize, measure and monitor, communicate and audit. Controllable input(s) Input variables (x’s) that can be changed to see the effect on process output variables (y’s); sometimes called “Knob” variables. Coordinate Measuring Machine (CMM) A device that dimensionally measures 3-D products, tools and components with an accuracy approaching 0.0001 inches (0.0025mm). Corrective action A solution meant to reduce or eliminate an identified problem. Corrective Action Report (CAR) The full cycle corrective action tool that offers ease and simplicity for employee involvement in the corrective action/process improvement cycle. Corrective and Preventive Action (CAPA) CAPA focuses on the systematic investigation of discrepancies (failures and/or deviations) in an attempt to prevent their recurrence (for corrective action) or prevent from occurrence (for preventive action). To ensure that corrective and preventive actions are effective, the systematic investigation of the failure incidence is pivotal in identifying the corrective and preventive actions undertaken. CAPA is part of the overall quality management system (QMS). Correlation (statistical) A measure of the relationship between two data sets of variables.
Quality Definitions – Page 23 (Return to Index) Cost of Poor Quality (COPQ) The costs associated with providing poor quality products or services. There are four categories: internal failure costs (costs associated with defects found before the customer receives the product or service), external failure costs (costs associated with defects found after the customer receives the product or service), appraisal costs (costs incurred to determine the degree of conformance to quality requirements) and prevention costs (costs incurred to keep failure and appraisal costs to a minimum). Cost of Quality (COQ) The price of nonconformance (Philip B. Crosby) or the cost of poor quality (Joseph M. Juran), the term 'Cost of Quality', refers to the costs associated with providing poor quality product or service. Quality processes cannot be justified simply because "everyone else is doing them" - but return on quality (ROQ) has dramatic impacts as companies mature. Research shows that the costs of poor quality can range from 15%-40% of business costs (e.g., rework, returns or complaints, reduced service levels, lost revenue). Most businesses do not know what their quality costs are because they do not keep reliable statistics. Finding and correcting mistakes consumes an inordinately large portion resource. Typically, the cost to eliminate a failure in the customer phase is five times greater than it is at the development or manufacturing phase. Effective quality management decreases production costs because the sooner an error is found and corrected, the less costly it will be. Cost of quality comprises of four elements: 1 External Failure Cost
Cost associated with defects found after the customer receives the product or service ex: processing customer complaints, customer returns, warranty claims, product recalls.
2 Internal Failure Cost Cost associated with defects found before the customer receives the product or service ex: scrap, rework, re-inspection, re-testing, material review, material downgrades.
3 Inspection (appraisal) Cost Cost incurred to determine the degree of conformance to quality requirements (measuring, evaluating or auditing) ex: inspection, testing, process or service audits, calibration of measuring and test equipment.
4 Prevention Cost Cost incurred to prevent (keep failure and appraisal cost to a minimum) poor quality ex: new product review, quality planning, supplier surveys, process reviews, quality improvement teams, education and training.
Quality Definitions – Page 24 (Return to Index) Count chart (c-chart) A type of control chart used to monitor "count"-type data, typically total number of nonconformities per unit. It is also occasionally used to monitor the total number of events occurring in a given unit of time. The c-chart differs from the p-chart in that it accounts for the possibility of more than one nonconformity per inspection unit. Also see “Control Chart Examples”. Count per unit chart A control chart for evaluating the stability of a process in terms of the average count of events of a given classification per unit occurring in a sample. Also see “Control Chart Examples”. Cpk index Equals the lesser of the USL minus the mean divided by 3 sigma (or the mean) minus the LSL divided by 3 sigma. The greater the Cpk value, the better. Also see “differentiating Cpk and Ppk values”. Critical to Quality (CTQ) tree Used to decompose broad customer requirements into more easily quantified requirements. CTQs are what the customer expects of a product. The spoken needs of the customer. These needs would then be converted to measurable terms using tools such as DFMEA, etc. Critical Characteristics (CC) (in FMEA) Critical Characteristics are those product requirements (dimensions, performance tests) or process parameters that can affect compliance with government regulations of safe vehicle/product function and which require specific supplier, assembly, shipping, or monitoring and inclusion on Control Plans. Critical characteristics are identified with the inverted delta symbol. Critical input(s) x’s input for the tools (FMEA, DOE, SPC, etc.) and significant process knowledge have proved to have a major impact on the variability of the y’s. Critical process(es) Process(es) that present serious potential dangers to human life, health and the environment or that risk the loss of significant sums of money or customers. Critical product measurements Statistical measurements of the process capability in terms of its design specifications (limits) and performance (variability). Used in quality control, Cpk takes into account both accuracy (centering) and precision (dispersion) and helps determine the cause of failures and the need for changes in the product design, tooling, or the manufacturing process. Higher the Cpk value, greater the indication that the process is consistently under control (is within limits). A Cpk value of 1.33 is considered the minimum and, as it nears 2.0, the process approaches six sigma value meaning there are only 3.4 defective units out of one million produced. Also see “process capability”.
Quality Definitions – Page 25 (Return to Index) Cross functional A term used to describe a process or an activity that crosses the boundary between functions. A cross functional team consists of individuals from more than one organizational unit or function. Cross pilot See “scatter diagram”. Cultural resistance A form of resistance based on opposition to the possible social and organizational consequences associated with change. Culture change A major shift in the attitudes, norms, sentiments, beliefs, values, operating principles and behavior of an organization. Culture, organizational A common set of values, beliefs, attitudes, perceptions and accepted behaviors shared by individuals within an organization. Cumulative Sum control charts (CUSUM) A control chart on which the plotted value is the cumulative sum of deviations of successive samples from a target value. The ordinate of each plotted point represents the algebraic sum of the previous ordinate and the most recent deviations from the target. The CUSUM approach uses the current and recent past process data to detect small to moderate shifts in the process average or variability. CUSUM stands for "cumulative sum" of deviations from the target and puts equal weight on the current and recent past data. Also see “Cumulative Sum Control Chart Example”. Current controls (in FMEA) The mechanisms (for both design and process) which prevent the cause of the failure mode from occurring, or detect the failure mode, should it occur, before the product reaches your customer. For example, current controls include SPC, inspections, written procedures, training, preventive maintenance and all other activities that ensure a smooth running process. Current Good Manufacturing Practices (CGMP) Regulations enforced by the U.S. Food and Drug Administration for food and chemical manufacturers and packagers. Current Reality Tree (CRT) A way of analyzing many system or organizational problems at once. By identifying root causes common to most or all of the problems, the CRT can greatly aid focused improvement of the system. (Part of the Theory of Constraints Thinking Process) Also see “Current Reality Tree Example”.
Quality Definitions – Page 26 (Return to Index) Customer See “external customer” and “internal customer”. Customer delight The result of delivering a product or service that exceeds customer expectations. Customer Relationship Management (CRM) A strategy for learning more about customers’ needs and behaviors to develop stronger relationships with them. It brings together information about customers, sales, marketing, effectiveness, responsiveness, and market trends. It helps businesses use technology and human resources to gain insight into the behavior of customers and the value of those customers. Customer satisfaction The result of delivering a product or service that meets customer requirements. Customer Satisfaction Index (CSI) Introduced in 1994 by University of Michigan's Ross School of Business - CSI measures customer satisfaction at national level. Customer-Supplier Model (CSM) A model depicting Inputs flowing into a work process that, in turn, add value and produce Outputs delivered to a customer. Also called “customer-supplier methodology”. Customer-supplier partnership A long-term relationship between a buyer and supplier characterized by teamwork and mutual confidence. The supplier is considered an extension of the buyer’s organization. The partnership is based on several commitments. The buyer provides long-term contracts and uses fewer suppliers. The supplier implements quality assurance processes so incoming inspection can be minimized. The supplier also helps the buyer reduce costs and improve product and process designs. Cycle A sequence of operations repeated regularly. Cycle Line Layout (CLL) CLL provides a visual overview (to depict opportunities to eliminate waste, which enables process optimization) of a manufacturing process including - Operator Type (Direct/Indirect) and Percentage Utilization of Direct Labor, Operator Density by Workstation, Station Pitch, Line Side Layout including stock & stock storage methods & Identification of main fixed facilities. Cycle Time (C/T) Time that elapses between one product exiting the process to the next product coming out or the time it takes to complete a process step; typically the value-added time. If cycle time for every operation in a complete process can be reduced to equal takt time, products can be made in single-piece flow. Also see “takt time”.
Quality Definitions – Page 27 (Return to Index) Data A set of collected facts. There are two basic kinds of numerical data: measured or variable data, such as “16 ounces,” “4 miles” and “0.75 inches;” and counted or attribute data, such as “162 defects.” Data analysis Breaking down the data to draw significant insights. Steps involved in data analysis - validate (make sure that the data is good), summarize (compute central tendency and dispersion), assess (histograms, etc) search for structure (relationship between variables with scatter plots, correlation, regression, etc), compare (mean, standard deviation, etc) and present results and draw conclusions. Decision matrix A matrix teams use to evaluate problems or possible solutions. For example, a team might draw a matrix to evaluate possible solutions, listing them in the far left vertical column. Next, the team selects criteria to rate the possible solutions, writing them across the top row. Then, each possible solution is rated on a scale of 1 to 5 for each criterion, and the rating is recorded in the corresponding grid. Finally, the ratings of all the criteria for each possible solution are added to determine its total score. The total score is then used to help decide which solution deserves the most attention. Defect An event of nonconformance to specification. Occurrence is measured in DPU (Defects Per Unit), DPO (Defects Per Opportunity), DPMO (Defects Per Million Opportunities) or Sigma Level. A given unit may have any number of defects - based on the number of opportunities. A unit with one or more defects is defective. Defects are caused by errors and measured using c-chart or u-chart. A binomial distribution characterizes defectives. There are four classes of defects: class 1, very serious, leads directly to severe injury or catastrophic economic loss; class 2, serious, leads directly to significant injury or significant economic loss; class 3, major, is related to major problems with respect to intended normal or reasonably foreseeable use; and class 4, minor, is related to minor problems with respect to intended normal or reasonably foreseeable use. Also see “blemish”, “imperfection” and “nonconformity”. Defective A defective unit; a unit of product that contains one or more defects with respect to the quality characteristic(s) under consideration. Define, Measure, Analyze, Improve, Control (DMAIC) An improvement system for existing processes which fall below specifications and need to be improved incrementally.
Quality Definitions – Page 28 (Return to Index) Define, Measure, Analyze, Design, Verify (DMADV) An improvement system intended to develop new processes and/ or products at Six Sigma quality levels. Delighter A feature of a product or service that a customer does not expect to receive but that gives pleasure to the customer when received. Also called an “exciter”. Delphi method A systematic, interactive forecasting method which relies on a panel of experts. The experts answer questionnaires in two or more rounds. After each round, a facilitator provides an anonymous summary of the experts’ forecasts from the previous round as well as the reasons they provided for their judgments. Thus, experts are encouraged to revise their earlier answers in light of the replies of other members of their panel. Since its creation, the method has been used frequently to make predictions, seek consensus and generate ideas. The technique recognizes human judgment as legitimate and useful contribution and allows experts to generate ideas systematically for a complex problem.
1. Form the team 2. Selection of experts - most studies use a 15-35 member panel 3. Develop the first set of question or issues for idea generation 4. Transmission of the first set of questions to experts 5. Analysis of the first round of responses and feedback 6. Preparation and transmission of the second set of questions 7. Analysis of the second round of responses 8. Resolution
Demerit chart (d-chart) A control chart for evaluating a process in terms of a demerit (or quality score); in other words, a weighted sum of counts of various classified nonconformities. Also see “Control Chart Examples”. Deming cycle Another term for the plan-do-study-act cycle. Walter Shewhart created it (calling it the plan-do-check-act cycle), but W. Edwards Deming popularized it, calling it plan-do-study-act. Also see “plan-do-check-act cycle. Deming prize Award given annually to organizations that, according to the award guidelines, have successfully applied companywide quality control based on statistical quality control and will continue to do so. Although the award is named in honor of W. Edwards Deming, its criteria are not specifically related to Deming’s teachings. There are three separate divisions for the award: the Deming Application Prize, the Deming Prize for Individuals and the Deming Prize for Overseas Companies. The award process is overseen by the Deming Prize Committee of the Union of Japanese Scientists and Engineers in Tokyo.
Quality Definitions – Page 29 (Return to Index) Deming's 14 points
1. Establish Constancy of Purpose: plan and manage to the plan; detect and correct deviations.
2. Improve constantly and forever every system of production and service: small continuous improvement is better than infrequent quantum leaps.
3. Eliminate numerical goals and quotas, including management by objective: unsupported arbitrary objectives can be both restrictive & demoralizing.
4. Eliminate fear so that everyone may work effectively for the Company: mistakes happen and fear of disclosure impedes correction.
5. Institute leadership: managers must not be cops or directors but rather coaches of the creative team.
6. End the practice of awarding business largely on the basis of price: product quality, product improvement and reliability of supply are important.
7. Break down the barriers between departments: encourage communication and cooperation - eliminate chimneys and silos.
8. Institute training on the job: as product and process content grows, not all employees come equally prepared.
9. Eliminate the annual rating or merit system: performance is subject to variation whereas shared reward develops teamwork.
10. Institute a vigorous program of education and self-improvement: as employees promote the company, the company must develop its employees.
11. Eliminate slogans and exhortations: management, not an individual worker, is responsible for system performance.
12. Cease dependence on mass inspection: it is impractical to sort quality into a system that produces bad product.
13. Adopt the new philosophy: every department of the company can quantitatively measure its productivity.
14. Create a structure in top management to accomplish the transformation: successful systems can only be introduced and maintained by top management.
Density function The function which yields the probability that a particular random variable takes on any one of its possible values. Dependability The degree to which a product is operable and capable of performing its required function at any randomly chosen time during its specified operating time, provided that the product is available at the start of that period. (Non-operation related influences are not included.) Dependability can be expressed by the ratio: time available divided by (time available + time required). Dependent events Events that occur only after a previous event.
Quality Definitions – Page 30 (Return to Index) Deployment Dispersion, dissemination, broadcasting or spreading communication throughout an organization, downward and laterally. Also see “cascading”. Detection (in FMEA) An assessment of the likelihood that the current controls (design and process) will detect the cause (process weakness) of the failure mode, should it occur, thus preventing it from reaching your customer; the customer in this case could be the next operation, subsequent operations, or the end user. Design The planning that lays the basis for the making of every object or system. Most commonly linked with engineering. It can be used both as a noun and as a verb.
• As a verb, "to design" refers to the process of originating and developing a plan for a product, structure, system, or component with intention.
• As a noun, "a design" is used for either the final (solution) plan (e.g. proposal, drawing, model, description) or the result of implementing that plan in the form of the final product of a design process.
Design Failure Mode Effects Analysis (DFMEA) The application of the Failure Mode and Effects Analysis method specifically to product design. It is a paper-and-pencil analysis method used in engineering to document and explore ways that a product design might fail in real-world use. A DFMEA documents the key functions of a design, the primary potential failure modes relative to each function and the potential causes of each failure mode. The DFMEA method allows the design team to document what they know and suspect about a product's failure modes prior to completing the design, and then use this information to design out or mitigate the causes of failure. See also FMEA. Design for Manufacturability and Assembly (DFMA) A simultaneous engineering method designed to optimize the relationship between design function, manufacturability, and ease of assembly. Design for Six Sigma (DFSS) A separate and emerging business process management methodology related to traditional Six Sigma. While the tools and order used in Six Sigma require a process to be in place and functioning, DFSS has the objective of determining the needs of customers and the business, and driving those needs into the product solution so created. DFSS is relevant to the complex system/product synthesis phase, especially in the context of unprecedented system development. It is process generation in contrast with process improvement. Design information checklist A mistake proofing checklist designed to assure that all important items were considered in establishing design requirements.
Quality Definitions – Page 31 (Return to Index) Design of Experiment (DOE) DOE is a systematic approach to investigation of a system or process. A series of structured tests are created in which planned changes are made to the input variables of a process or system. The effects of these changes on a pre-defined output are then assessed. 'One change at a time' testing always carries the risk that the experimenter may find one input variable to have a significant effect on the response (output) while failing to discover that changing another variable may alter the effect of the first (i.e. some kind of dependency or interaction). This is because the temptation is to stop the test when this first significant effect has been found. In order to reveal an interaction or dependency, 'one change at a time' testing relies on the experimenter carrying the tests in the appropriate direction. In terms of resource the exact length and size of the experiment are set by the design (i.e. before testing begins). DOE is important as a formal way of maximizing information gained while resources required. It has more to offer than 'one change at a time' experimental methods, because it allows a judgment on the significance to the output of input variables acting alone, as well input variables acting in combination with one another. DOE can be used to find answers in situations such as "what is the main contributing factor to a problem?", "how well does the system/process perform in the presence of noise?", "what is the best configuration of factor values to minimize variation in a response?" etc. In general, these questions are given labels as particular types of study. In the examples given above, these are problem solving, parameter design and robustness study. In each case, DOE is used to find the answer; the only thing that marks them different is which factors would be used in the experiment. The order of tasks to using this tool starts with identifying the input variables and the response (output) that is to be measured. For each input variable, a number of levels are defined that represent the range for which the effect of that variable is desired to be known. An experimental plan is produced which tells the experimenter where to set each test parameter for each run of the test. The response is then measured for each run. The method of analysis is to look for differences between response (output) readings for different groups of the input changes. These differences are then attributed to the input variables acting alone (called a single effect) or in combination with another input variable (called an interaction). DOE is team oriented with a variety backgrounds (e.g. design, manufacturing, statistics etc.) should be involved when identifying factors and levels and developing the matrix as this is the most skilled part. Moreover, as this tool is used to answer specific questions, the team should have a clear understanding of the difference between control and noise factors. In order to draw the maximum amount of information a full matrix is needed which contains all possible combinations of factors and levels. If this requires too many experimental runs to be practical, fractions of the matrix can be taken dependent on which effects are of particular interest. The fewer the runs in the experiment the less information is available.
Quality Definitions – Page 32 (Return to Index) Design record Engineering requirements typically contained in various formats; examples include engineering drawings, math data and referenced specifications. Designing in quality versus inspecting in quality. Also see “prevention versus detection”. Design reviews A proactive procedure to prevent problems and misunderstandings during the design and development of a product or process. Design validation Testing to ensure that product conforms to defined user needs and/or requirements. Design validation follows successful design verification and is normally performed on the final product under defined, operating conditions. Multiple validations may be performed if there are different intended uses. Design Verification (DVER) Testing to ensure that all design output(s) meet design input requirements. Design verification may include activities such as: Design Review, Performing Alternate Calculations, Understanding Tests & Demonstrations and Review of Design Stage Documents before Release. Design Verification Plan and Report (DVP&R) Summary form which lists each individual test, when it was performed, the specification, results and the assessment pass/fail. Part of PPAP. Deviation In numerical data sets, the difference or distance of an individual observation or data value from the center point (often the mean) of the set distribution. Diagnosis The activity of discovering the cause(s) of quality deficiencies; the practice of investigating symptoms, collecting and analyzing data, and conducting experiments to test theories to determine the root cause(s) of deficiencies. Diagnostic journey and remedial journey A two-phase investigation used by teams to solve chronic quality problems. In the first phase, the diagnostic journey, the team journeys from the symptom of a chronic problem to its cause. In the second phase, the remedial journey, the team journeys from the cause to its remedy. Discrimination (in MSE) The technological ability of the measurement system to adequately differentiate between measured values for a selected parameter.
Quality Definitions – Page 33 (Return to Index) Dissatisfiers The features or functions a customer expects that either are not present or are present but not adequate; also pertains to employees’ expectations. Distribution (statistical): The amount of potential variation in the output(s) of a process, typically expressed by its shape, average or standard deviation. Dock-to-Dock (DTD) A metric that measures how long it takes for raw materials or sub-components coming into plant to be turned into finished products. Improving DTD time improves company’s ability to make on-time deliveries; lowers material handling, obsolescence and inventory carrying costs which in turn leads to lower total cost. Documentation Material defining the procedure to be followed (e.g. quality manual, operator instructions, graphics, and pictorials). Dodge-Romig sampling plans Plans for acceptance sampling developed by Harold F. Dodge and Harry G. Romig. Four sets of tables were published in 1940: single sampling lot tolerance tables, double sampling lot tolerance tables, single sampling average outgoing quality limit tables and double sampling average outgoing quality limit tables. Downtime Lost production time during which a piece of equipment is not operating correctly due to breakdown, maintenance, power failures or similar events. Driving forces Forces that tend to change a situation in desirable ways. Durability The probability that an item will continue to function at customer expectation levels, at the useful life without requiring overhaul or rebuild due to wear out.
Quality Definitions – Page 34 (Return to Index) Effect The result of an action being taken; the expected or predicted impact when an action is to be taken or is proposed. Effectiveness The state of having produced a decided on or desired effect. Efficiency The ratio of the output to the total input in a process. Efficient A term describing a process that operates effectively while consuming minimal resources (such as labor and time). Eight wastes Taiichi Ohno originally enumerated seven wastes (muda) and later added underutilized people as the eighth waste commonly found in physical production. The eight wastes are: 1. overproduction ahead of demand; 2. waiting for the next process, worker, material or equipment; 3. unnecessary transport of materials (for example, between functional areas of facilities, or to or from a stockroom or warehouse); 4. over-processing of parts due to poor tool and product design; 5. inventories more than the absolute minimum; 6. unnecessary movement by employees during the course of their work (such as to look for parts, tools, prints or help); 7. production of defective parts; 8. under-utilization of employees’ brainpower, skills, experience and talents. Eighty-twenty (80-20) A term referring to the Pareto principle, which was first defined by J. M. Juran in 1950. The principle suggests most effects come from relatively few causes; that is, 80% of the effects come from 20% of the possible causes. Also see “pareto chart”. Electric Data Interchange (EDI) The electronic exchange of data from customers to suppliers and from suppliers to customers. Employee Involvement (EI) An organizational practice whereby employees regularly participate in making decisions on how their work areas operate, including suggestions for improvement, planning, goal setting and monitoring performance Empowerment A condition in which employees have the authority to make decisions and take action in their work areas without prior approval. For example, an operator can stop a manufacturing process if he or she detects a problem, or a customer service representative can send out a replacement product if a customer calls with a problem.
Quality Definitions – Page 35 (Return to Index) EN 46000 Medical device quality management systems standard. EN 46000 is technically equivalent to ISO 13485:1996, an international medical device standard. The two are similar enough that if an organization is prepared to comply with one, it could easily comply with the other. EN 9100 An international quality management standard for the aerospace industry (see AS9100). End user See “consumer.” Environment Environment is all of the process conditions surrounding or affecting the manufacture and quality of a part or product. Equipment availability The percentage of time during which a process (or equipment) is available to run. This can sometimes be called uptime. To calculate operational availability, divide the machine’s operating time during the process by the net available time. Error detection A hybrid form of error proofing. It means a bad part can be made but will be caught immediately, and corrective action will be taken to prevent another bad part from being produced. A device is used to detect and stop the process when a bad part is made. This is used when error proofing is too expensive or not easily implemented. Error proofing Use of process or design features to prevent the acceptance or further processing of nonconforming products. Also known as “mistake proofing”. Ethics The practice of applying a code of conduct based on moral principles to day-to-day actions to balance what is fair to individuals or organizations with what is right for society. European Cooperation for Accreditation (EA) A cooperative organization of accreditation bodies. Evaporating cloud Also called the conflict cloud or conflict resolution diagram, this is a tool whose purpose is to identify the elements of a conflict or dilemma in order to facilitate the development of non-compromise, win-win solutions. (Part of the Theory of Constraints Thinking Process). Also see “Conflict Resolution Diagram Example”.
Quality Definitions – Page 36 (Return to Index) Evolutionary Operation (EVOP) Introduced in the 1950s by George Box, EVOP is an ongoing mode of using an operating full-scale process, so that information on how to improve the process is generated from a simple experimental design while production is underway. To avoid appreciable changes in the characteristics of the product, only small changes are made in the levels of the process variables. EVOP is designed to be run by process operators on a full-scale manufacturing process while it continues to produce satisfactory products. Experimentation The manipulation of controllable factors (independent variables) at different levels to see their effect on some response (dependent variable). Common methods include: trial-and-error, one-factor-at-a-time, full factorial, and fractional factorial design. Exciter See “delighter”. Expectations Customer perceptions about how an organization’s products and services will meet their specific needs and requirements. Experimental design A formal plan that details the specifics (i.e. design, process, etc.) for conducting an experiment, such as which responses, factors, levels, blocks, treatments and tools are to be used. External customer A person or organization that receives a product, service or information but is not part of the organization supplying it. Also see “internal customer”. External failure Nonconformance identified by the external customers. External setup Die setup procedures that can be performed safely while the machine is in motion. Also known as outer exchange of die. Also see “internal setup”. External work Set-up activities which can be performed while the machine (or process) is running. Also see “internal work”.
Quality Definitions – Page 37 (Return to Index) F-tests Used to test variances or dispersion effects. For example, if a company has two manufacturing lines making the same product but different regions of the world, an F-test may be used to compare the variance of one line's productivity vs. that of the other. [Statistical inference tests to compare the quality of different products / processes and compare the performance of different groups.] Fabrication See “manufacturing”. Facilitator A specifically trained person who functions as a teacher, coach and moderator for a group, team or organization. Facility Permanent, semi-permanent, or temporary commercial or industrial property such as a building, plant, or structure, built, established, or installed for the performance of one or more specific activities or functions. Factor analysis A statistical method used to describe variability among observed variables in terms of fewer unobserved variables. Factorial design Factorial design is generally employed in engineering and manufacturing experiments. It is appropriate when several factors are to be investigated at two or more levels and interaction of factors may be important. Also see “design of experiments”. Failure The inability of an item, product or service to perform required functions on demand due to one or more defects. Failure cost The cost resulting from the occurrence of defects. One element of cost of quality or cost of poor quality. Failure Mode Analysis (FMA) A procedure to determine which malfunction symptoms appear immediately before or after a failure of a critical parameter in a system. After all possible causes are listed for each symptom; the product is designed to eliminate the problems. Developed from a fault tree, a FMA chart is usually prepared to assess the probability of and assign priority to potential root causes of failure. Failure mode avoidance A quality discipline with focus on finding failure modes early in the course of development, then applying countermeasures to fix them.
Quality Definitions – Page 38 (Return to Index) Failure Mode and Effects Analysis (FMEA) Failure Mode and Effects Analysis is systematized technique which identifies and ranks the potential failure modes of a design or manufacturing process in order to prioritize improvement actions. FMEA useful in measure & improve phase of DMAIC and characterize in DFSS. Provides information in quantifying weighted priorities, risks and contributing characteristics of a problem. Helps drive team consensus. A procedure in operations management for analysis of potential failure modes within a system for classification by severity or determination of the effect of failures on the system. It is widely used in manufacturing industries in various phases of the product life cycle and is now increasingly finding use in the service industry.
• Failure Modes are any errors or defects in a process, design, or item, especially those that affect the customer, and can be potential or actual.
• Effects Analysis refers to studying the consequences of those failures. The FMEA identifies and ranks each potential risk of failure for each process step. Those potential failures that hold the highest Risk Priority Number (RPN) help engineering and management to determine how to expend time and financial budgets, as avoiding these potential failures can save a business time and money. Failure Mode Effects and Criticality Analysis (FMECA) A procedure performed after a failure mode effects analysis to classify each potential failure effect according to its severity and probability of occurrence. Fault Tree Analysis (FTA) A deductive analysis method that provides a systematic description of the combinations of possible occurrences in a system that can result in failure. It is a graphical representation of the boolean logic that relates to the result. The method can be applied as a diagnosis and development tool and is especially helpful in early design stages. Feasibility A determination that a process, design, procedure, or plan can be successfully accomplished in the required time frame. Feedback Communication from customers about how delivered products or services compare with customer expectations. Feeder lines A series of special assembly lines that allow assemblers to perform preassembly tasks off the main production line. First In, First Out (FIFO) Use of material produced by one process in the same order by the next process. A FIFO queue is filled by the supplying process and emptied by the customer process. When a FIFO lane gets full, production is stopped until the next (internal) customer has used some of that inventory.
Quality Definitions – Page 39 (Return to Index) First Pass Yield (FPY) Also referred to as the quality rate, the percentage of units that completes a process and meets quality guidelines without being scrapped, rerun, retested, returned or diverted into an offline repair area. FPY is calculated by dividing the units entering the process minus the defective units by the total number of units entering the process. The measure typically referred to as “yield”. The total number of parts that are accepted divided by the total number of parts that were started. First Run Capability (FRC) A process or system (or a specified portion of a process or system) is the percentage of input which flows through the process or system without being scrapped or incurring rework or repair. Given that N is the number of pieces, units, or transactions put into a process or system and W is the amount of given process/system input that was scrapped, repaired, or reworked (i.e. waste), then FRC can be calculated as: FRC=[(N-W)/N]x100% First Time Quality (FTQ) Calculation of the percentage of good parts at the beginning of a production run. First Time Through (FTT) A metric that measures the percentage of units that go through the manufacturing process without being scrapped, rerun, rested, returned by the downstream operation, or diverted into an off-line repair area. FTT is a leading indicator of quality and defects are calculated for each process and yield is calculated at the end production run and is a lagging indicator. Fishbone diagram A systematic analysis tool that organizes the effects of a problem and its possible causes, in a graphical display that often resembles the skeleton of a fish. Also see Cause-and-Effect or Ishikawa Diagrams. One of the 7 Basic Tools of Quality Control. Also see “Ishikawa Diagram Example”. Fitness for use A term used to indicate that a product or service fits the customer’s defined purpose for that product or service. Five S’s (5S) Five Japanese terms beginning with “s” used to create a workplace suited for visual control and lean production. Seiri means to separate needed tools, parts and instructions from unneeded materials and to remove the unneeded ones. Seiton means to neatly arrange and identify parts and tools for ease of use. Seiso means to conduct a cleanup campaign. Seiketsu means to conduct seiri, seiton and seiso daily to maintain a workplace in perfect condition. Shitsuke means to form the habit of always following the first four S’s.

Quality Definitions – Page 40 (Return to Index) Five whys A technique for discovering the root causes of a problem and showing the relationship of causes by repeatedly asking the question, “Why?” Five-phase lean approach A systematic method for implementing lean manufacturing that helps improve the manufacturing process and sustains gains made in the production cycle in an area or plant. The five phases are:
1. Stability (provides an environment with controlled process variables, decreased waste and increased business impact).
2. Continuous flow (characterized by reduced work in process inventory, time loss and defects, and increased process flexibility and repeatable processes between workstations).
3. Synchronous production (characterized by disciplined process repeatability and synchronization between operations and customer requirements);
4. Pull system (creates an environment in which material replenishment links operations with customer demand).
5. Level production (reduces response time or changes in demand and upstream schedule variability).
Flow chart A common type of diagram that represents an algorithm or process, showing the steps as boxes of various kinds, and their order by connecting these with arrows. This diagrammatic representation can give a step-by-step solution to a given problem. One of the 7 Basic Tools of Quality Control. Also see “Flow Chart Example”. Flow kaizen Radical improvement, usually applied only once within a value stream. Flow production Continuous movement of the product or service from start to finish without interruption or storage with the intent to eliminate batch sizing and produce at the smallest possible increment. Focus group survey Help better understand customer perceptions of a company's products/services. Focus groups consist of 8-10 current or potential customers who meet for a few hours to discuss a product and is usually moderated. Force field analysis A technique for analyzing what aids or hinders an organization in reaching an objective. An arrow pointing to an objective is drawn down the middle of a piece of paper. The factors that will aid the objective’s achievement, called the driving forces, are listed on the left side of the arrow. The factors that will hinder its achievement, called the restraining forces, are listed on the right side of the arrow.
Quality Definitions – Page 41 (Return to Index) Forming, Storming, Norming, & Performing (FSNP) teamwork Forming (bringing the team together, defining the task and the boundaries), Storming (brainstorming possible solutions and sifting through the ideas to pick the ones to evaluate), Norming (getting the team buy-in and working through the list of solutions) and Performing (implementing the possible solutions). Also see “stages of team growth”. Fractional factorial designs Experimental designs consisting of a carefully chosen subset (fraction) of the experimental runs of a full factorial design. Full factorial design The study of two or more factors where all possible combinations of the levels of the factors are investigated. In brief, 2k Full Factorial involves: a) an experiment with k factors; b) each factor is studied at 2 levels (high-low); c) investigate all combination of factors and levels. Note: 3k full factorials studies k factors, each at 3 levels (high, medium, low). Function A group of related actions contributing to a larger action. Functional layout The practice of grouping machines (such as grinding machines) or activities (such as order entry) by type of operation performed. Functional verification Functional verification is testing to ensure the part conforms to all customer and supplier engineering performance and material requirements. Functional verification (to applicable customer engineering material and performance standards) may be required by some customers annually unless another frequency is established in a customer approval control plan. Results shall be available for customer review upon request. Funnel experiment An experiment that demonstrates the effects of tampering. Marbles are dropped through a funnel in an attempt to hit a flat surfaced target below. The experiment shows that adjusting a stable process to compensate for an undesirable result or an extraordinarily good result will produce output that is worse than if the process had been left alone. Future Reality Tree (FRT) FRT is an effect-cause-effect sequence intended to show how a proposed changes would affect reality; specifically how and why we expect the proposal to produce a desired outcome. It is a paper-based logical simulation to test a proposed change for its ability to produce desired effects, as well as to test a change's tendency to produce new, undesirable effects. (Part of the Theory of Constraints Thinking Process). Also see “Future Reality Tree Example”.

Quality Definitions – Page 42 (Return to Index) Gauge Repeatability and Reproducibility (Gauge R&R) The Gauge R&R tells about the statistical properties of repeatability & reproducibility and reveal the capability of the gauges and users - not the statistical properties of the complete measuring system. The evaluation of a gauging instrument’s accuracy by determining whether its measurements are repeatable (there is close agreement among a number of consecutive measurements of the output for the same value of the input under the same operating conditions) and reproducible (there is close agreement among repeated measurements of the output for the same value of input made under the same operating conditions over a period of time). Also see “ANOVA Gauge R&R”. Gain sharing A reward system that shares the monetary results of productivity gains among owners and employees. Gantt chart Type of bar-chart that shows both the scheduled and completed work over a period. A time-scale is given on the chart's horizontal axis and each activity is shown as a separate horizontal rectangle (bar) whose length is proportional to the time required (or taken) for the activity's completion. In project planning, these charts show start and finish dates, critical and non-critical activities, slack time, and predecessor-successor relationships. Also called chronogram, it was invented in 1917 by the US engineer and a scientific-management pioneer, Henry L. Gantt (1861-1919). See “Gantt Chart Diagram”. Gap analysis Technique for determining the steps to be taken in moving from a current state to a desired future-state. It begins with (1) listing of characteristic factors (such as attributes, competencies, performance levels) of the present situation ("what is"), (2) cross-lists factors required to achieve the future objectives ("what should be"), and then (3) highlights the 'gaps' that exist and need to be 'filled.' Also called need-gap analysis, needs analysis, and needs assessment. Gatekeeper A timekeeper; in team meetings, a designated individual who helps monitor the team’s use of allocated time. Gemba Where all the activity is. 5 Rules to follow-1. Go to the gemba (also shop floor) first; 2. Check with genbutsu (the actual product); 3. Take countermeasures; 4. Find root cause; 5. Standardize to prevent recurrence. Genchi Genbutsu Go see the problem. This is the belief that practical experience is valued over theoretical knowledge. You must see the problem to know the problem.
Quality Definitions – Page 43 (Return to Index) Genjitsu The real facts and data. this along with gemba and genbutsu are the three reals fundamental to kaizen. Geometric Dimensioning and Tolerancing (GD&T) A language used on mechanical engineering drawings composed of symbols that are used to efficiently and accurately communicate geometry requirements for associated features on components and assemblies. GD&T is, and has been, successfully used for many years in the automotive, aerospace, electronic and the commercial design and manufacturing industries. In today’s modern and technically advanced design, engineering and manufacturing world, effective and accurate communication is required to ensure successful end products. Currently, ASME Y14.5–2009 is the accepted geometric dimensioning and tolerancing standard superseding ANSI Y14.5M-1994 used within the USA and ISO 1101-2004 is used outside of the USA. George M. Low Trophy The George M. Low Trophy is awarded to current NASA contractors, subcontractors, and suppliers in the aerospace industry who have demonstrated sustained excellence and outstanding achievements in quality and productivity for three or more years. Goal A broad statement describing a desired future condition or achievement without being specific about how much and when. Go/no-go State of a unit or product. Two parameters are possible: go (conforms to specifications) and no-go (does not conform to specifications). Good Laboratory Practices (GLP) or 21 CFR, part 58 144 requirements that control the procedures and operations of toxicology laboratories. Good Manufacturing Practices (GMP) or 21 CFR, parts 808, 812 and 820 Requirements governing the quality procedures of medical device manufacturers. Grade An indicator of category or rank related to features or characteristics that cover different sets of needs for products or services intended for the same functional use. Green Belt (GB) An employee who has been trained in the Six Sigma improvement method and will lead a process improvement or quality improvement team as part of his or her full-time job.
Quality Definitions – Page 44 (Return to Index) Group dynamic The interaction (behavior) of individuals within a team meeting. Groupthink A situation in which critical information is withheld from the team because individual members censor or restrain themselves, either because they believe their concerns are not worth discussing or because they are afraid of confrontation.
Quality Definitions – Page 45 (Return to Index) Hawthorne effect The concept that every change results (initially, at least) in increased productivity. Hazard Analysis and Critical Control Point (HACCP) A quality management system for effectively and efficiently ensuring farm to table food safety in the United States. HACCP regulations for various sectors are established by the Department of Agriculture and the Food and Drug Administration. Heijunka A method of leveling production, usually at the final assembly line, that makes just-in-time production possible. It involves averaging both the volume and sequence of different model types on a mixed model production line. Using this method avoids excessive batching of different types of product and volume fluctuations in the same product. Also see “production smoothing”. Hidden Factory Unintended steps/tasks in a process; i.e. rework. Highly Accelerated Life Test (HALT) A method for uncovering design defects and weaknesses in electronic and mechanical assemblies using a vibration system combined with rapid high and low temperature changes. The purpose of HALT is to optimize product reliability by identifying the functional and destructive limits of a product at an early stage in product development. Highly Accelerated Stress Audits (HASA) A technique in which a sample of parts (as opposed to 100% of the production as in HASS,) is subjected to stresses similar to the levels and duration for HALT. In monitoring the manufacturing process, the intent of HASA is to detect slight shifts in the attributes of the product so corrective actions can be taken and implemented before the performance of outgoing product approaches the specifications. Highly Accelerated Stress Screening (HASS) A technique for production screening that rapidly exposes process or production flaws in products. Its purpose is to expose a product to optimized production screens without affecting product reliability. Unlike HALT, HASS uses nondestructive stresses of extreme temperatures and temperature change rates with vibration. Histogram A graphical display of tabulated frequencies shown as bars. It shows what proportion of cases fall into each of several categories: it is a form of data binning. The categories are usually specified as non-overlapping intervals of some variable. The categories (bars) must be adjacent. One of the 7 Basic Tools of Quality Control. Also see “Histogram Interpretation”.
Quality Definitions – Page 46 (Return to Index) Hooke's Law Stress is proportional to strain. This law is valid only up to the proportional limit, or the end of the straight-line portion of the stress-strain curve. Homeostasis The stability of a system's internal environment, despite having to cope with an unpredictable external environment. Hoshin Kanri planning Breakthrough planning. A Japanese strategic planning practice in which a company develops up to four vision statements that indicate where the company should be in the next five years. Company goals and work plans are developed based on the vision statements. Periodic submitted audits are then conducted to monitor progress. Also see “value stream”. Hotelling’s T2 model A multivariate profile for detecting differential expressions in microarrays. House of quality A product planning matrix, that somewhat resembles a house, which is developed during quality function deployment and shows the relationship of customer requirements to the means of achieving these requirements.
Quality Definitions – Page 47 (Return to Index) Imagineering Developing in the mind’s eye a process without waste. Imperfection A quality characteristic’s departure from its intended level or state without any association to conformance to specification requirements or to the usability of a product or service. Also see “blemish”, “defect” and “nonconformity”. Improvement The positive effect of a process change effort. Iceberg effect 90% of an iceberg's mass is below the surface, not visible to the eye. Many aspects of business are like that. I/MR chart The I/MR chart is a combined chart consisting of: 'individuals' (I) chart with values of each individual observation that provides a means to assess the process center; and a 'moving range' (MR) chart with the range calculated from subgroups created from successive observations that provides a means to assess process variation. I/MR chart is used to draw a combined control chart for assessing whether process center and variation are in control when your data is individual observations. When subgroups are available use an X-Bar & R Chart. Also see “Control Chart Examples”. In-control process A process in which the statistical measure being evaluated is in a state of statistical control; in other words, the variations among the observed sampling results can be attributed to a constant system of chance causes. Also see “out-of-control process”. Incremental improvement Improvement implemented on a continual basis. Indicators Established measures to determine how well an organization is meeting its customers’ needs and other operational and financial performance expectations. Information flow The dissemination of information for taking a specific product from order entry through detailed scheduling to delivery. Also see “value stream”. Informative inspection A form of inspection for determining nonconforming product. Also see “judgment inspection”.
Quality Definitions – Page 48 (Return to Index) Indifference Quality Level (IQL) The point that divides acceptable from unacceptable performance. Input The term denoting either an entrance or changes which are inserted into a system and which activate/modify a process. It is an abstract concept, used in the modeling, system(s) design and system(s) exploitation. It is usually connected with other terms, e.g., input field, input variable, input parameter, input value, input signal, etc. Inputs The products, services and material obtained from suppliers to produce the outputs delivered to customers. Inspection Activities, such as measuring, examining, testing, gaging one or more characteristics of a product or service, and comparing these with specified requirements to determine conformity. Inspection cost The cost associated with inspecting a product to ensure it meets the internal or external customer’s needs and requirements; an appraisal cost. Inspection, curtailed Sampling inspection in which inspection of the sample is stopped as soon as a decision is certain. Thus, as soon as the rejection number for defectives is reached, the decision is certain and no further inspection is necessary. In single sampling, however, the whole sample is usually inspected in order to have an unbiased record of quality history. This same practice is usually followed for the first sample in double or multiple sampling. Inspection lot A collection of similar units or a specific quantity of similar material offered for inspection and acceptance at one time. Inspection, normal Inspection used in accordance with a sampling plan under ordinary circumstances. Inspection, 100% Inspection of all the units in the lot or batch. Inspection, reduced Inspection in accordance with a sampling plan requiring smaller sample sizes than those used in normal inspection. Reduced inspection is used in some inspection systems as an economy measure when the level of submitted quality is sufficiently good and other stated conditions apply. Note: The criteria for determining when quality is “sufficiently good” must be defined in objective terms for any given inspection system.
Quality Definitions – Page 49 (Return to Index) Inspection, tightened Inspection in accordance with a sampling plan that has stricter acceptance criteria than those used in normal inspection. Tightened inspection is used in some inspection systems as a protective measure when the level of submitted quality is sufficiently poor. The higher rate of rejections is expected to lead suppliers to improve the quality of submitted product. Note: The criteria for determining when quality is “sufficiently poor” must be defined in objective terms for any given inspection system. Instant pudding A term used to illustrate an obstacle to achieving quality or the supposition that quality and productivity improvement are achieved quickly through an affirmation of faith rather than through sufficient effort and education. W. Edwards Deming used this term, which was coined by James Bakken of Ford Motor Co., in his book Out of the Crisis. Inter-American Accreditation Cooperation (IAAC) A cooperative organization of accreditation bodies. Interim approval Permits shipment of products for a specified time period or quantity. Intermediate customers Organizations or individuals who operate as distributors, brokers or dealers between the supplier and the consumer or end user. Internal customer The recipient (person or department) within an organization of another person’s or department’s output (product, service or information). Also see “external customer”. Internal failure A product failure that occurs before the product is delivered to external customers. Internal setup Die setup procedures that must be performed while a machine is stopped; also known as “inner exchange of die”. Also see “external setup”. Internal work Set-up activities that require the machine (or process) be stopped. Also see “external work”.
Quality Definitions – Page 50 (Return to Index) Intra Class Correlation (ICC) A descriptive statistic that can be used when quantitative measurements are made on units that are organized into groups. It describes how strongly units in the same group resemble each other. While it is viewed as a type of correlation, unlike most other correlation measures it operates on data structured as groups, rather than data structured as paired observations. International Accreditation Registry (IAR) A not-for-profit organization that accredits training and certification program results to international standards and guidelines. International Aerospace Quality Group A cooperative organization of the global aerospace industry that is mainly involved in quality, cost reduction and process improvement efforts. International Automotive Task Force (IATF) A cooperative group of automotive manufacturers and others primarily responsible for the development and launch of International Organization for Standardization Technical Specification 16949. International Laboratory Accreditation Cooperation (ILAC) A cooperative organization of laboratory accreditation bodies. International Organization for Standardization A network of national standards institutes from 157 countries working in partnership with international organizations, governments, industry, business and consumer representatives to develop and publish international standards; acts as a bridge between public and private sectors. Interrelationship diagram A management tool that depicts the relationship among factors in a complex situation. Also called “relations diagram”. Also see “Relations Diagram Example”. Intervention The action of a team facilitator when interrupting a discussion to state observations about group dynamics or the team process. Inventory In lean, the money invested to purchase things an organization intends to sell.
Quality Definitions – Page 51 (Return to Index) Ishikawa Diagrams (also called fishbone diagrams or cause-and-effect diagrams) Diagrams that show the causes of a certain event. Common uses of the Ishikawa diagram are product design and quality defect prevention, to identify potential factors causing an overall effect. Each cause or reason for imperfection is a source of variation. Ishikawa diagrams were proposed by Kaoru Ishikawa in the 1960s. One of the 7 Basic Tools of Quality Control. Also see “Ishikawa Diagram Example”. ISO 9000 series of standards ISO 9001 is one of a series of quality management system standards. It can help bring out the best in your organization by enabling you to understand your processes for delivering your products/services to your customers. The ISO 9001 series of standards consist of:
• ISO 9000 – Fundamentals and Vocabulary: this introduces the user to the concepts behind the management systems and specifies the terminology used.
• ISO 9001 – Requirements: this sets out the criteria you will need to meet if you wish to operate in accordance with the standard and gain certification.
• ISO 9004 – Guidelines for performance improvement: based upon the eight quality management principles, these are intended to be used by senior management as a framework to guide their organizations towards improved performance by considering the needs of all interested parties, not just customers
ISO 14001 An internationally accepted standard that sets out how you can go about putting in place an effective Environmental Management System (EMS). The standard is intended to address the delicate balance between maintaining profitability and reducing environmental impact; with the commitment of your entire organization, it can enable you to achieve both objectives. ISO/IEC 27001 Formally specifies a management system that is intended to bring information security under explicit management control. ISO/IEC 27001 requires that management:
• Systematically examine the organization's information security risks, taking account of the threats, vulnerabilities and impacts.
• Design and implement a coherent and comprehensive suite of information security controls and/or other forms of risk treatment (such as risk avoidance or risk transfer) to address those risks that are deemed unacceptable.
• Adopt an overarching management process to ensure that the information security controls continue to meet the organization's information security needs on an ongoing basis.
ISO/TS 16949 An ISO technical specification which aligns existing US, German, French and Italian automotive quality system standards within the global automotive industry. It specifies the quality system requirements for the design/development, production, installation and servicing of automotive-related products.
Quality Definitions – Page 52 (Return to Index) J.D. Power and Associates A global marketing information services firm founded in 1968 by James David Power III. The firm conducts surveys of customer satisfaction, product quality, and buyer behavior for industries ranging from cars to marketing and advertising firms. Jidohka One of the two main pillars of TPS (Toyota Production System). It refers to the ability to stop production lines, by man or machine, in the event of problems such as equipment malfunction, quality issues, or late work. Jidohka helps prevent the passing of defects, helps identify and correct problem areas using localization and isolation, and makes it possible to “build” quality at the production process. Also see “autonomation”. Jishuken Management driven kaizen activity where management members identify areas in need of continuous improvement and spread information through the organization to stimulate kaizen activity. JIS Q 9100 An international quality management standard for the aerospace industry. Also see “AS9100”. Job instruction Quality system documentation that describes work conducted in one function in a company, such as setup, inspection, rework or operator. Joint commission A U.S. healthcare accreditation body; formerly known as Joint Commission for the Accreditation of Healthcare Organizations. Judgment inspection A form of inspection to determine nonconforming product. Also see “informative inspection”. Just-In-Time (JIT) One of the two main pillars of TPS (Toyota Production System). It refers to the manufacturing and conveyance of only what is needed, when it is needed, and in the amount needed. It is built upon three basic principles: the pull system, continuous flow processing and takt time. There is little or no manufacturing material inventory on hand at the manufacturing site and little or no incoming inspection. Just-In-Time Training (JITT) The provision of training only when it is needed to all but eliminate the loss of knowledge and skill caused by a lag between training and use.
Quality Definitions – Page 53 (Return to Index)
Kaizen A Japanese term that means gradual unending improvement by doing little things better and setting and achieving increasingly higher standards. Masaaki Imai made the term famous in his book, Kaizen: The Key to Japan’s Competitive Success. Taken from the Japanese words kai and zen where kai means change and zen means good. The popular meaning is continuous improvement of all areas of a company not just quality. Kanban Japanese term for “signal”. Kanban systems are pull systems, which replenish materials only as they are used. One of the primary tools of a just-in-time system. It maintains an orderly and efficient flow of materials throughout the entire course of manufacturing. It is usually a printed card that contains specific information such as part name, description and quantity. An example of visual management or visual control. Kano model In the late 1970s Dr. Noriaki Kano of Tokyo Rika University further refined the notion of quality derived partially from his study of Herzberg's "Motivator-Hygiene Theory" and re-defined quality along two dimensions in contrast to the linear "good-bad" "ok-not ok" dimension in existence all along. The two dimensions were:
1. The degree to which a product or service performs. 2. the degree to which the user is satisfied.
The correlation of quality on two axes further led to three unique definitions of quality, namely: basic quality, performance quality and excitement quality. Kansei Kansei engineering is a consumer-oriented technology process used to develop products. It uses the consumer’s feelings (kansei) as a guideline in creating the product. Kappa An attribute measurement system which compares how well a judge repeats him/her self and/or how well other judges agree. Kepner Tregoe analysis A structured approach to problem solving where the problem is analyzed in terms of what, where, when and the extent. Possible causes are identified. The most probable cause is tested. The true cause is verified. Key characteristics Product / Process / Manufacturing / Assembly features or characteristics that are highly constrained or for which minute deviations from specification have a significant impact on product performance, function and form. (PKC - product key characteristics; AKC - assembly key characteristics; MKC - manufacturing key characteristics)
Quality Definitions – Page 54 (Return to Index) Key Performance Indicators (KPI) KPI refers to the short list of measurable parameters that will indicate how well the business is doing at attaining its goals. In a manufacturing quality scenario, this may be the amount of scrap or rework that gets metered. Key process A major system level process that supports the mission and satisfies major consumer requirements. Key Product Characteristic (KPC) A product characteristic that can affect safety or compliance with regulations, fit, function, performance or subsequent processing of a product. Key process characteristic A process parameter that can affect safety or compliance with regulations, fit, function, performance or subsequent processing of product. Key Process Input Variables (KPIV) Input(s) to the process which can be categorized as controllable, critical, noise, or standard operating procedures. (Part of the Process Mapping methodology) Key Process Output Variables (KPOV) Examples of KPOVs are profits, customer satisfaction, and defect rate. (Part of the Process Mapping methodology) Key results area Customer requirements that are critical for the organization’s success. Kitting A process in which assemblers are supplied with kits—a box of parts, fittings and tools—for each task they perform. This eliminates time consuming trips from one parts bin, tool crib or supply center to another to get necessary materials. Knowledge brokering A systematic approach to seeking external ideas from people in a variety of industries, disciplines, contexts and then of combining the resulting lessons in new ways. Kruskal-Wallis test A non-parametric test to compare three or more samples. It tests the null hypothesis that all populations have identical distribution functions against the alternative hypothesis that at least one of the samples differs only with respect to location (median), if at all. It is the analogue to the F-test used in analysis of variance. While analysis of variance tests depend on the assumption that all populations under comparison are normally distributed, the Kruskal-Wallis test places no such restriction on the comparison. This is a non-parametric test equivalent to ANOVA. Samples should have same shape and distribution. If not, then use Moods Median test.
Quality Definitions – Page 55 (Return to Index) Laboratory A test facility that can include chemical, metallurgical, dimensional, physical, electrical and reliability testing or test validation. Laboratory scope A record containing the specific tests, evaluations and calibrations a laboratory has the ability and competency to perform, the list of equipment it uses, and a list of the methods and standards to which it adheres to each of these. Last off part comparison A comparison of the last part off a production run with a part off the next production run to verify that the quality level is equivalent. Layout Inspection Layout Inspection is the complete measurement of all part dimensions shown on the design record. A layout inspection may be required by some customers for all products annually unless another frequency is established in a customer approved control plan. Results shall be available for customer review upon request. Lead time The total time a customer must wait to receive a product after placing an order. Leadership An essential part of a quality improvement effort. Organization leaders must establish a vision, communicate that vision to those in the organization and provide the tools and knowledge necessary to accomplish the vision. Lean A production practice that considers the expenditure of resources for any goal other than the creation of value for the end customer to be wasteful, and thus a target for elimination. This means producing the maximum sellable products or services at the lowest operational cost while optimizing inventory levels. Lean enterprise A manufacturing company organized to eliminate all unproductive effort and unnecessary investment, both on the shop floor and in office functions. Lean manufacturing/production An initiative focused on eliminating all waste in manufacturing processes. Principles of lean manufacturing include zero waiting time, zero inventory, scheduling (internal customer pull system instead of push system), batch to flow (cut batch sizes), line balancing and cutting actual process times. The production systems are characterized by optimum automation, just-in-time supplier delivery disciplines, quick changeover times, high levels of quality and continuous improvement.
Quality Definitions – Page 56 (Return to Index) Lean migration The journey from traditional manufacturing methods to one in which all forms of waste are systematically eliminated. Lead Time Average time to manufacture and deliver a product or service, from order receipt to delivery to the customer. Lessons Learned An ongoing documentation of things the project manager and project team have learned throughout the project. Lessons learned are supplied to other project teams and project managers to apply to their ongoing projects. They are documented throughout the project, not just at the end of the project. Level loading A technique for balancing production throughput over time. Life cycle stages: Design, manufacturing, assembly, installation, operation and shutdown periods of product development. Levene test A test of the hypothesis that all factor standard deviations (or equivalently variances) are equal against the alternative that the standard deviations are not all equal. Likert Scale Discrete ordinal measurement scale e.g., 5-point grading, 7-point numerical rating, verbal rating (poor, good, excellent, etc.). Linearity The difference in the bias values and a reference (known) value through the operating range of the gauge. Line balancing A process in which work elements are evenly distributed and staffing is balanced to meet takt time. Listening post An individual who, by virtue of his or her potential for having contact with customers, is designated to collect, document and transmit pertinent feedback to a central collection authority in the organization.
Quality Definitions – Page 57 (Return to Index) Load-load A method of conducting single-piece flow in which the operator proceeds from machine to machine, taking the part from one machine and loading it into the next. The lines allow different parts of a manufacturing process to be completed by one operator, eliminating the need to move around large batches of work-in-progress inventory. Lost customer analysis Analysis conducted to determine why a customer or a class of customers was lost. Loss Function A graphical representation of the relationship between the customer's sensitivity (loss) and deviations from the target (design intent) - conducted without considering the specifications. Lot A collection of output(s) from which a sample is to be drawn and inspected to determine conformance with the standard. Lot, batch A definite quantity of some product manufactured under conditions of production that are considered uniform. Lot quality The value of percentage defective or of defects per hundred units in a lot. Lot size Also referred to as “N”. The number of units in a lot. Lot Tolerance Percentage Defective (LTPD) Expressed in percentage defective, the poorest quality in an individual lot that should be accepted. Note: LTPD is used as a basis for some inspection systems and is commonly associated with a small consumer risk. Lower Control Limit (LCL) Control limits that are calculated from time series process data; they are also referred to as the voice of the process. Lower Spec Limit (LSL) Customer supplied specification limits or tolerance for a process output; they are also referred to as the voice of the customer.
Quality Definitions – Page 58 (Return to Index) Machine capability (Cmk) Often known as Cmk. This is a short term machine capability index derived from the observations from uninterrupted production run. Even though the formulae are as same as Cp & Cpk calculation, the standard deviation used here is sample standard deviation. The preferred Cmk value is >1.67. Usually, the long term process capability to be planned and studied after achieving the targeted Cmk Value. Maintainability The probability that a given maintenance action for an item under given usage conditions can be performed within a stated time interval when the maintenance is performed under stated conditions using stated procedures and resources. Maintainability has two categories Serviceability (the ease of conducting scheduled inspections and servicing) and repairability (the ease of restoring service after a failure). Malcolm Baldrige National Quality Award (MBNQA) An award established by the U.S. Congress in 1987 to raise awareness of quality management and recognize U.S. companies that have implemented successful quality management systems. Awards can be given annually in six categories: manufacturing, service, small business, education, healthcare and nonprofit. The award is named after the late Secretary of Commerce Malcolm Baldrige, a proponent of quality management. The U.S. Commerce Department’s National Institute of Standards and Technology manages the award, and ASQ administers it. Management review A periodic management meeting to review the status and effectiveness of the organization’s quality management system. Manager An individual charged with managing resources and processes. Manufacturing The use of machines, tools and labor to produce items (products) for use or sale. It is most commonly applied to industrial production, in which materials are transformed through fabrication, assembly and/or installation into finished goods on a large scale. Also known as “fabrication” or “production”. Manufacturing process Includes all intermediate procedures, methods, and systems required for the production and integration of a product's components. Also known as “production process”. Manufacturing Resource Planning (MRP II) Material requirements planning, plus capacity planning and finance, interface to translate operational planning into financial terms and into a simulation tool to assess alternative production plans.
Quality Definitions – Page 59 (Return to Index) Mapping symbols or icons An easy, effective way to communicate the flow of materials and information through a plant. The symbol type doesn’t matter, as long as the use is consistent from map to map. Mapping the flow helps identify constraints and potential improvement opportunities. Markov model A probabilistic model that can accurately capture the effects of component failure rates and changing failure rates over time resulting from stress in other factors. Master Black Belt (MBB) Six Sigma or quality expert responsible for strategic implementations in an organization. An MBB is qualified to teach other Six Sigma facilitators the methods, tools and applications in all functions and levels of the company and is a resource for using statistical process control in processes. Material handling Methods, equipment and systems for conveying materials to various machines and processing areas and for transferring finished parts to assembly, packaging and shipping areas. Material Requirements Planning (MRP) A computerized system typically used to determine the quantity and timing requirements for production and delivery of items to both customers and suppliers. Using MRP to schedule production at various processes will result in push production because any predetermined schedule is an estimate only of what the next process will actually need. Matrix A planning tool for displaying the relationships among various data sets. Mean Parameter used to characterize the “process location” or “center”. Average of all data points in sample or population. Mean Time Between Failures (MTBF) The average time interval between failures for repairable product for a defined unit of measure; for example, operating hours, cycles and miles. Measure Number or quantity that records a directly observable value or performance. All measures have a unit attached to them: i.e. inch, centimeter, dollar, liter, etc. Measurement The act or process of quantitatively comparing results with requirements. Or, values made meaningful by quantifying into specific units. Measurements act as labels which make those values more useful in terms of details.
Quality Definitions – Page 60 (Return to Index) Measurement error Variation in measurement which can be attributed to variation in the item being measured or to the measurement system itself. Measurement system All operations, procedures, devices and other equipment or personnel used to assign a value to the characteristic being measured. Measurement System Analysis (MSA) Usually contains the Gauge R&R for the critical or high impact characteristics, and a confirmation that gauges used to measure these characteristics are calibrated. Also see “MSE”. Measurement System Evaluation (MSE) Identifies and quantifies the different sources of variation that affect a measurement system. Also see “MSA”. Measurement uncertainty The result of random effects and imperfect correction of systemic effects in obtaining a measurement value that results in variation from the actual true value. Also known as “measurement error”. Median The middle number or center value of a set of data in which all the data are arranged in sequence. Method 635 A variation of brainstorming developed by Professor Bernd Rohrbach in 1968. This method involves '6' people generating and writing down '3' potential solutions after studying a problem. After a set period of time, the solutions are handed to the next participant, who then either further develops the original three solutions ideas or provides three new ones. The handing over of potential solutions to the next person continues until everyone in the group gets a chance to see each of the original three solutions and contribute to the document. This method may generate less creative solutions because mostly individual nature of the contributions does not take advantage of group discussions. Metric A measurement, taken over a period of time that communicates vital information about a process or activity. A metric should drive appropriate leadership or management action. Physically, a metric package consists of an operational definition, measurement over time and presentation. Metrology The science of weights and measures or of measurement; a system of weights and measures.
Quality Definitions – Page 61 (Return to Index) MIL-Q-9858A A military standard that describes quality program requirements. MIL-STD-45662A A military standard that describes the requirements for creating and maintaining a calibration system for measurement and test equipment. MIL-STD-105E A military standard that describes the sampling procedures and tables for inspection by attributes. Mission An organization’s purpose. Mistake proofing Use of production or design features to prevent the manufacture or passing downstream a nonconforming product. Also known as “error proofing.” Mode The value occurring most frequently in a data set. Monument Any design, scheduling or production technology with scale requirements that call for designs, orders and products to be brought to the machine to wait in line for processing. The opposite of a right sized machine. Moods median test A special case of Pearson's chi-square test. It is a non-parametric test that tests the null hypothesis that the medians of the populations from which two samples are drawn are identical. The data in each sample are assigned to two groups, one consisting of data whose values are higher than the median value in the two groups combined, and the other consisting of data whose values are at the median or below. A Pearson's chi-square test is then used to determine whether the observed frequencies in each group differ from expected frequencies derived from a distribution combining the two groups. Monte Carlo Simulation (MCS) Also called Monte Carlo analysis, is a means of statistical evaluation of mathematical function s using random samples. This requires a good source of random numbers . There is always some error involved with this scheme, but the larger the number of random samples taken, the more accurate the result. Moving range chart A chart used when control charting individual data. The moving range is used to estimate the short-term variation which is then compared to the individual value variation. Also see “Control Chart Examples”.
Quality Definitions – Page 62 (Return to Index) Muda Japanese for waste; any activity that consumes resources but creates no value for the customer. Multiple Regression Most common statistical technique for predicting the value of a dependent variable in relation to one or more independent variables. Relationships can be linear, non-linear, logarithmic, etc. Multi-Vari analysis A powerful graphical analysis technique used to identify and quantify dominant sources of variation in a process. It is appropriate when the response variable (y) is continuous and the x's under investigation are discrete. Multi-Vari Analysis graphically depicts multiple sources of variation. It allows the examination of major families of variation, including positional (within unit or part), cyclical (unit-to-unit or part-to-part) and temporal (over time). The basic objective of Multi-Vari Analysis is to determine which family exhibits the largest variation. Multivariate control chart A control chart for evaluating the stability of a process in terms of the levels of two or more variables or characteristics. Also see “Control Chart Examples”. Mutual Recognition Agreement (MRA) A formal agreement providing mutual recognition of the validity of other organizations’ deliverables, typically found in voluntary standards and conformity assessment groups. Myers-Briggs Type Indicator (MBTI) A psychometric questionnaire designed to measure psychological preferences in how people perceive the world and make decisions. A method and instrument for identifying an individual’s personality type based on Carl Jung’s theory of personality preferences.
Quality Definitions – Page 63 (Return to Index) n The number of units in a sample. N The number of units in a population. Nagara system Smooth production flow, ideally one piece at a time, characterized by synchronization (balancing) of manufacturing processes and maximum use of available time; includes overlapping of operations where practical. A nagara production system is one in which seemingly unrelated tasks can be produced simultaneously by the same operator. National Institute of Standards and Technology (NIST) An agency of the U.S. Department of Commerce that develops and promotes measurements, standards and technology, and manages the Malcolm Baldrige National Quality Award. Natural team A team of individuals drawn from a single work group; similar to a process improvement team except that it is not cross functional in composition and it is usually permanent. Next operation as customer The concept of internal customers in which every operation is both a receiver and a provider. Noise Input(s) Input variables that impacts the y’s but are uncontrollable, difficult, or too costly to control. i.e., Environmental variables such as humidity, ambient temperature, etc. Non-Value Added Anything that does not transform the form, fit and or function of a product or service as defined by the customer the first time. Nominal Group Technique (NGT) A technique similar to brainstorming, used by teams to generate ideas on a particular subject. Team members are asked to come up with as many ideas as possible, writing them down. Each member is then asked to share one idea, which is recorded. After all the ideas are recorded, they are discussed and prioritized by the group. Nonconformance Nonconformance is product or material which does not conform to the customer requirements or specifications. Nonconformity Nonconformity is a process which does not conform to a quality system requirement. The non-fulfillment of a specified requirement. Also see “blemish”, “defect” and “imperfection”.
Quality Definitions – Page 64 (Return to Index) Non-Destructive Testing and Evaluation (NDT, NDE) Testing and evaluation methods that do not damage or destroy the product being tested. Non-linear parameter estimation A method whereby the difficult and labor intensive task of multi-parameter model calibration can be carried out automatically under the control of a computer. Non-normal distribution A symmetric (normal) distribution is one in which the 2 "halves" of the histogram appear as mirror-images of one another. A skewed (non-symmetric or non-normal) distribution is a distribution in which there is no such mirror-imaging. Also see “Histogram Interpretation: Skewed (Non-Normal) Curve”. Non-parametric tests All tests involving ranked data (data that can be put in order). Non-parametric tests are often used in place of their parametric counterparts when certain assumptions about the underlying population are questionable. For example, when comparing two independent samples, the Wilcoxon Mann-Whitney test does not assume that the difference between the samples is normally distributed, whereas its parametric counterpart, the two-sample t-test, does. Non-parametric tests can be, and often are, more powerful in detecting population differences when certain assumptions are not satisfied. Non-value added A term that describes a process step or function that is not required for the direct achievement of process output. This step or function is identified and examined for potential elimination. Also see “value added.” Normal distribution (statistical) The charting of a data set in which most of the data points are concentrated around the average (mean), thus forming a bell shaped curve. Also see “The Bell Curve”. Number of affected units chart (NP chart) A control chart for evaluating the stability of a process in terms of the total number of units in a sample in which an event of a given classification occurs. Also see “Control Chart Examples”. Numerical Evaluation of Metrics (NEM) Evaluation of control chart data to: 1) determine common or special cause or 2) determine where the majority of variation lies. Even though NEM uses control charts, it is different from SPC which is focused on ‘monitoring’ a process.
Quality Definitions – Page 65 (Return to Index) Objective A specific statement of a desired short-term condition or achievement; includes measurable end results to be accomplished by specific teams or individuals within time limits. Occurrence (in FMEA) An assessment of the likelihood that a particular cause will happen and result in the failure mode. One-factor-at-a-time method A method of designing experiments involving the testing of factors, or causes, one at a time instead of all simultaneously One-piece flow The opposite of batch and queue; instead of building many products and then holding them in line for the next step in the process, products go through each step in the process one at a time, without interruption. Meant to improve quality and lower costs. One Touch Exchange of Dies (OTED) The reduction of die setup to a single step. Also see “single-minute exchange of dies”, “internal setup” and “external setup”. Ongoing Process Capability Ongoing Process Capability is a long term measure of statistical process control or process performance. It differs from preliminary process capability by utilizing data from a longer time period so as to include all common causes of variation, in particular, those common causes that may result in process shifts affecting a number of sample intervals. The time required for ongoing capability evaluation depends on the time required for the sources of variation to vary throughout their full ranges, but will typically be three to six months. Operating Characteristic (OC) curve A graph to determine the probability of accepting lots as a function of the lots’ or processes’ quality level when using various sampling plans. There are three types: type A curves, which give the probability of acceptance for an individual lot coming from finite production (will not continue in the future); type B curves, which give the probability of acceptance for lots coming from a continuous process; and type C curves, which (for a continuous sampling plan) give the long-run percentage of product accepted during the sampling phase. Operating expenses The money required for a system to convert inventory into throughput. Operations Work or steps to transform raw materials to finished product.
Quality Definitions – Page 66 (Return to Index) Ordinal (data) If the observations in a data are assigned with numbers which can be arranged in some order, the data is said to be in Ordinal scale. All the data sets consisting of ranks are examples for Ordinal data. These data can be compared with respect to their order. Original Equipment Manufacturer (OEM) A company that uses product components from one or more other companies to build a product that it sells under its own company name and brand. Sometimes mistakenly used to refer to the company that supplies the components. Overall Equipment Effectiveness (OEE) The product of a machine’s operational availability, performance efficiency and first-pass yield. Used by manufacturers to determine productivity at the equipment level. It is usually formulated as a function of a number of mutually exclusive components, such as availability efficiency, performance efficiency, and quality efficiency in order to quantify various types of productivity losses, such as breakdown, set-up and adjustment, idling and minor storage, reduced speed, and quality defect and rework. Out-of-control process A process in which the statistical measure being evaluated is not in a state of statistical control. In other words, the variations among the observed sampling results can be attributed to a constant system of chance causes. Also see “in-control process”. Outlier An outlier is a data point that is located far from the rest of the data. Given a mean and standard deviation, a statistical distribution expects data points to fall within a specific range. Those that do not are called outliers and should be investigated. Out of spec A term that indicates a unit does not meet a given requirement or specification. Output The term denoting either an exit or changes which exit a system and which activate/modify a process. It is an abstract concept, used in the modeling, system(s) design and system(s) exploitation. Outputs Products, materials, services or information provided to customers (internal or external), from a process. Ownership The recognized possession of rights and liability created or passed to an individual person who, through integrity and competent ability, is recognized and empowered to decide and act; willingly accepting responsibility as well as accountability.
Quality Definitions – Page 67 (Return to Index) Packaging A unit that provides protection and containment of items plus ease of handling by manual or mechanical means. Painted floor A lean manufacturing technique to provide visual indications to determine stock levels. Similar to kanban. An example of visual management or visual control. Parallel operation A technique to create economy of scale by having two operators work together to perform tasks on either side of a machine. Using this technique reduces the time it takes a single operator to move from one side to the other, making the overall process more efficient. An example of parallel operation is having two people work on a changeover, supplementing each other’s work effort. Parameter A component of technology, product or process that can assume a nominal value that defines it. Pareto chart A graphical tool for ranking causes from most significant to least significant. It is based on the Pareto principle, which was first defined by Joseph M. Juran in 1950. The principle, named after 19th century economist Vilfredo Pareto, suggests most effects come from relatively few causes; that is, 80% of the effects come from 20% of the possible causes. A Pareto chart tests and/or illustrates this relationship by sorting and displaying metrics in a descending order chart. One of the 7 Basic Tools of Quality Control. Also see “Pareto Chart Example”. Partnership/alliance Both a strategy and a formal relationship between a supplier and a customer that produces cooperation for the benefit of both parties. Parts Per Million (PPM) PPM is a way of stating the performance of a process in terms of actual or projected defective material, which can include rejected, returned or suspect material in the calculation. PPM data can be used to indicate areas variation requiring attention. Part Submission Warrant (PSW) The form that summarizes the PPAP package is called PSW. The approval of the PSW indicates that the supplier responsible person (usually the Quality Engineer) has reviewed this package and that the customer has not identified any issues that would prevent its approval.
Quality Definitions – Page 68 (Return to Index) Paynter chart A matrix of problems, faults, failure types vs. occurrence frequency (days / weeks / months) - named after Marvin (Marv) Paynter (Ford Motor Company). Also see “Paynter Chart Example”. Pearson's chi-square (χ2) test Tests a null hypothesis stating that the frequency distribution of certain events observed in a sample is consistent with a particular theoretical distribution. The events considered must be mutually exclusive and have total probability 1. Percent chart (p-chart) A type of control chart used to monitor the proportion of nonconforming units in a sample, where the sample proportion nonconforming is defined as the ratio of the number of nonconforming units to the sample size, n. The p-chart only accommodates "pass"/"fail"-type inspection as determined by one or more go-no go gauges or tests, effectively applying the specifications to the data before they're plotted on the chart. A control chart for evaluating the stability of a process in terms of the percentage of the total number of units in a sample in which an event of a given classification occurs. Also referred to as a “proportion chart”. Also see “Control Chart Examples”. Percentage of Inspection points Satisfying Tolerance (PIST) The percentage of inspection points that are within the tolerances indicated on the design. Performance standard The metric against which a complete action is compared. Physical transformation task Taking a specific product from raw materials to a finished product delivered to the customer. Also see “value stream” and “information flow”. PICK chart Used for organizing process improvement ideas and categorizing them during the Identify and Prioritize Opportunities Phase of a Lean Six Sigma project. When faced with multiple improvement ideas a PICK chart may be used to determine the most useful. There are four categories on a 2x2 matrix; horizontal is scale of payoff (or benefits), vertical is ease of implementation. By deciding where an idea falls on the pick chart four proposed project actions are provided; Possible, Implement, Challenge and Kill (thus the name PICK). Also see “PICK Chart Example”.
Quality Definitions – Page 69 (Return to Index) P.I.S.M.O.E.A. error model P.I.S.M.O.E.A. (Part, Instrument, Standard, Method, Operator, Environment, & Assumptions) The typical statistical assumptions of a Gauge R&R study, include: normal process, random and independent trials, stable, and test-retest criteria. When one or more assumption is violated (e.g., non-normal measurement process, operator bias) the tool and analysis ultimately become unstable, confusing, and misleading. Gauge R&R evaluations for product and process control can be overestimated. There are also non-statistical assumptions related to measurement systems (e.g., calibration, operational, coefficients and rates of expansion, physical laws and constants). (source: AIAG's MSA Manual) Pitch The pace and flow of a product. Plan-Do-Check-Act (PDCA) A four-step process for quality improvement. In the first step (plan), a way to effect improvement is developed. In the second step (do), the plan is carried out, preferably on a small scale. In the third step (check), a study takes place between what was predicted and what was observed in the previous step. In the last step (act), action is taken on the causal system to effect the desired change. The plan-do-check-act cycle is sometimes referred to as the Shewhart cycle, because Walter A. Shewhart discussed the concept in his book Statistical Method From the Viewpoint of Quality Control, and as the Deming cycle, because W. Edwards Deming introduced the concept in Japan. The Japanese subsequently called it the Deming cycle. Also called the plan-do-study-act (PDSA) cycle. Point kaizen See “process kaizen”. Point of use A technique that ensures people have exactly what they need to do their jobs—work instructions, parts, tools and equipment—where and when they need them. Poisson distribution A discrete probability distribution that expresses the probability of a number of events occurring in a fixed time period if these events occur with a known average rate, and are independent of the time since the last event. Poka-yoke A Japanese term that means "fail-safing" or "mistake-proofing". A poka-yoke is any mechanism in a Lean manufacturing process that helps an equipment operator avoid (yokeru) mistakes (poka). Its purpose is to eliminate product defects by preventing, correcting, or drawing attention to human errors as they occur. Also see “baka-yoke”.
Quality Definitions – Page 70 (Return to Index) Policy An overarching plan (direction) for achieving an organization’s goals. Policy deployment The selection of goals and projects to achieve the goals, designation of people and resources for project completion and establishment of project metrics. Also see “hoshin kanri.” Population A theoretical, infinitely large sample. Precision The closeness of agreement between randomly selected individual measurements or test results. Also see “accuracy”. Preliminary Bill of Material An initial Bill of Material completed prior to design and drawing release. Prerequisite Tree (PRT) A structure describing all of the obstacles to achieving an objective, as well as the responses needed to overcome them, and the sequence in which they must be addressed. It identifies the minimum necessary conditions to achieving a specified objective. (Part of the Theory of Constraints Thinking Process). Also see “Prerequisite Tree Example”. Preventive action Action taken to remove or improve a process to prevent potential future occurrences of a nonconformance. Analyzing possible failure modes and putting in place appropriate action to avoid failure. For example; FMEAs, design reviews and validation, supplier evaluations, preventative maintenance and calibration. Prevention cost The cost incurred by actions taken to prevent a nonconformance from occurring; one element of cost of quality or cost of poor quality. Prevention versus detection A term used to contrast two types of quality activities. Prevention refers to activities for preventing nonconformances in products and services. Detection refers to activities for detecting nonconformances already in products and services. Another phrase to describe this distinction is “designing in quality versus inspecting in quality.” Probability (statistical) The likelihood of occurrence of an event, action or item.
Quality Definitions – Page 71 (Return to Index) Probability density function Used in defining a distribution - indicates when a new item is likely to fail.
Probability of acceptance Percentage of inspection lots estimated to be of acceptable quality when subjected to a specific sampling routine. Probability of rejection The probability that a lot will be rejected. Problem solving The act of defining a problem; determining the cause of the problem; identifying, prioritizing and selecting alternatives for a solution; and implementing a solution. Procedures Documented processes that are used when work affects more than one function or department of an organization. Or, the steps in a process and how these steps are to be performed for the process to fulfill a customer’s requirements. Process A set of interrelated work activities characterized by a set of specific input(s) and value added tasks that make up a procedure for a (set) of specific output(s). A combination of people, equipment, methods, materials and environment that produces output (a given product) or service. A process can involve any aspect of a business. All processes have inherent statistical variability which can be evaluated by statistical control methods. Process analysis tools Operations are composed of processes that add value. Enhancing processes can contribute to the success of organizations. Step-by-step approach to process analysis ensures better success. These steps are:
1. Define the problem. 2. Gather data to describe the problem. 3. Determine possible causes. 4. Select the root cause. 5. Develop solution strategies. 6. Test and evaluate solutions.
Process analysis activity should be undertaken on a regular basis to help in increasing the capacity, take full advantage of the processes, improve throughput and reduce cycle time. When doing such as analysis, some common pitfalls are:
1. Not understanding the problem. 2. Not considering all possible failure modes/causes. 3. Not identifying all root causes. 4. Runaway tests and analysis. 5. Adopting a 'remove & replace' mentality. 6. Silver bullet theory. 7. Failing to follow-through. 8. Tearing a system apart without a plan.
Quality Definitions – Page 72 (Return to Index) Process average quality Expected or average value of process quality. Process capability A statistical measure of the inherent process variability of a given characteristic. The most widely accepted formula for process capability is 6 sigma. A measurable property of a process to the specification, expressed as a process capability index (e.g., Cpk or Cpm) or as a process performance index (e.g., Ppk or Ppm). The output of this measurement is usually illustrated by a histogram and calculations that predict how many parts will be produced out of specification. The concept of process capability only holds meaning for processes that are in a state of statistical process control (SPC). Process capability index (Cpk) Measures a process's ability to create product within specification limits. Cpk represents the difference between the actual process average and the closest specification limit over the standard deviation, times three. By convention, when the Cpk is less than one, the process is referred to as incapable. When the Cpk is greater than or equal to one, the process is considered capable of producing a product within specification limits. In a Six Sigma process, the Cpk equals 2.0. The Cpk is inversely proportional to the standard deviation, or variability, of a process. The higher the Cpk, the narrower the process distribution as compared with the specification limits, and the more uniform the product. As the standard deviation increases, the Cpk index decreases. At the same time, the potential to create product outside the specification limits increases. Cpk can only have positive values. It will equal zero when the actual process average matches or falls outside one of the specification limits. The Cpk index can never be greater than the Cp, only equal to it. This happens when the actual process average falls in the middle of the specification limits. Comparison of the Voice of the Process (VOP) to the Voice of the Customer (VOC) requirements. Process capability indices measure how much common cause and special cause variation a process experiences relative to its specification limits and allows different processes to be compared with respect to how well an organization controls them. Also see “differentiating Cpk and Ppk values”. Process capability studies Process capability studies are short-term studies conducted to obtain early information on the performance of new or revised processes relative to internal or customer requirements. In many cases, preliminary studies should be conducted at several points in the evolution of new processes (e.g., at the equipment or tooling subcontractor's plant, after installation at the supplier's plant) These studies should be based on as many measurements as possible. When using X-Bar and R charts, at least twenty subgroups (typically three to five pieces, when taking sub-groups) are required to obtain sufficient data for decision making. When this amount of data is not available, control charts should be started with whatever data is available.
Quality Definitions – Page 73 (Return to Index) Process capability studies (cont’d) Formulae: Cp=(USL-LSL)/6s Cpu=(USL-Xbar)/3s Cpl=(Xbar-LSL)/3s Cpk=Minimum of (Cpu, Cpl) Process capability, Cpk uses 's' or the population standard deviation which is estimated using (Rbar/d2) or (Sbar/C2). Potential process capability, Ppk uses the 's' or the sample standard deviation from individual data. Ppk attempts to answer the question "does my 'sample' meet specification?" Cpk attempts to answer the question "does my process meet specification?" A Cp value significantly greater than the corresponding Cpk indicates an opportunity for improvement by centering the process. Process control The method for keeping a process within boundaries; the act of minimizing the variation of a process. Process dispersion The standard deviation of f(x), symbolized by “σ”, the Greek letter known as “sigma”. Process Failure Mode Effects Analysis (PFMEA) Recognizes and evaluates the potential failure of a process and its effects. It also identifies actions that will eliminate or reduce the probability of that failure occurring. It is a living document, and should be initiated before or at the feasibility phase, prior to tooling for production; it should also take into account all manufacturing operations from individual components to assemblies. See also FMEA Process flow diagram Depicts the flow of material through the process, including any rework or repair operations. Also called a process flow chart. Also see “Flow Chart Example”. Process improvement A series of actions taken by a process owner to identify, analyze and improve existing processes within an organization to meet new goals and objectives. These actions often follow a specific methodology or strategy to create successful results. The application of the plan-do-check-act cycle to processes to produce positive improvement and better meet the needs and expectations of customers. Process improvement team A structured group often made up of cross functional members who work together to improve a process or processes. Process kaizen Improvements made at an individual process or in a specific area. Sometimes called “point kaizen”.
Quality Definitions – Page 74 (Return to Index) Process location The mean or average of f(x), symbolized by “μ”, the Greek letter known as “mu”. Process management The pertinent techniques and tools applied to a process to implement and improve process effectiveness, hold the gains and ensure process integrity in fulfilling customer requirements. Process Map (PMAP) A type of flowchart depicting the steps in a process and identifying responsibility for each step and key measures. Process Mapping methodology - define scope, document all tasks, categorize value-add vs. non-value add tasks, list internal and external y's, list internal and external x's, classify x's as being control, standard operation or noise factor, identify data collection points. Also see “Process Map Example”. Process owner The person who coordinates the various functions and work activities at all levels of a process, has the authority or ability to make changes in the process as required and manages the entire process cycle to ensure performance effectiveness. Process performance index (Ppk) An estimate of the process capability of a process during its initial set-up, before it has been brought into a state of statistical control. Also see “differentiating Cpk and Ppk values”. Process performance management The overseeing of process instances to ensure their quality and timeliness; can also include proactive and reactive actions to ensure a good result.
Process potential index (Cp) Measures a process's potential capability, which is defined as the allowable spread over the actual spread. The allowable spread is the difference between the upper specification limit and the lower specification limit. The actual spread is determined from the process data collected and is calculated by multiplying six times the standard deviation, s. The standard deviation quantifies a process's variability. As the standard deviation increases in a process, the Cp decreases in value. As the standard deviation decreases (i.e., as the process becomes less variable), the Cp increases in value. By convention, when a process has a Cp value less than 1.0, it is considered potentially incapable of meeting specification requirements. Conversely, when a process Cp is greater than or equal to 1.0, the process has the potential of being capable. Ideally, the Cp should be as high as possible. The higher the Cp, the lower the variability with respect to the specification limits. In a process qualified as a Six Sigma process (i.e., one that allows plus or minus six standard deviations within the specifications limits), the Cp is greater than or equal to 2.0. However, a high Cp value doesn't guarantee a manufacturing process falls within specification limits because the Cp value doesn't imply that the actual spread coincides with the allowable spread (i.e., the specification limits). This is why the Cp is called the process potential.
Quality Definitions – Page 75 (Return to Index) Process quality The value of percentage defective or of defects per hundred units in product from a given process. Note: The symbols “p” and “c” are commonly used to represent the true process average in fraction defective or defects per unit; and “l00p” and “100c” the true process average in percentage defective or in defects per hundred units. Process re-engineering A strategy directed toward major rethinking and restructuring of a process; often referred to as the “clean sheet of paper” approach. Product assurance plan A part of the product quality plan. It is a prevention-oriented management tool that addresses product design, process design, and when applicable software design. Product Improvement Plan (PIP) Results-oriented approach to project review that involves stakeholders in a process of evaluation and planning to improve product/project performance. Product or service liability The obligation of an organization to make restitution for loss related to personal injury, property damage or other harm caused by its product or service. Production See “manufacturing”. Production (analysis) board A job site board on which hourly production targets are recorded, along with the actual production achieved. Details concerning problems and abnormal conditions are also recorded. Management checks the board hourly, takes steps to prevent recurrence of abnormalities and confirms the positive effects of the job site improvements that have been made. An example of visual management or visual control. Production Part Approval Process (PPAP) A Big Three automotive process that defines the generic requirements for approval of production parts, including production and bulk materials. Its purpose is to determine during an actual production run at the quoted production rates whether all customer engineering design record and specification requirements are properly understood by the supplier and that the process has the potential to produce product consistently meeting these requirements. The result of the PPAP process is a series of documents gathered in one specific location (a binder or electronically) called the "PPAP Package". The PPAP package is a series of documents which need a formal approval by the supplier and customer. Also see “PSW”. Production part approval submissions The submissions are based on small quantities of parts taken from a significant production run made with production tooling, processes, and cycle times. Parts for production part approval are checked by the supplier to all engineering requirements.
Quality Definitions – Page 76 (Return to Index) Production smoothing Keeping total manufacturing volume as constant as possible. Also see “heijunka”. Production tooling Manufacturing aids such as cutting tools, dies, fixtures, gauges, jigs, molds, and patterns of a specialized nature which (unless substantially modified) are limited in use to a specific production line or the performance of a specific contract or job. Production trial run Product made using all production tools, processes, equipment, environment, facility, and cycle time. Product warranty An organization’s stated policy that it will replace, repair or reimburse a buyer for a product if a product defect occurs under certain conditions and within a stated period of time. Productivity A measurement of output for a given amount of input. Profound knowledge, system of Defined by W. Edwards Deming, a system that consists of an appreciation for systems, knowledge of variation theory of knowledge and understanding of psychology. Project management The application of knowledge, skills, tools and techniques to a broad range of activities to meet the requirements of a particular project. Project team Manages the work of a project. The work typically involves balancing competing demands for project scope, time, cost, risk and quality, satisfying stakeholders with differing needs and expectations and meeting identified requirements. Proportion chart See “percent chart.” Pull system A method of controlling the flow of resources by replacing what has been consumed. An alternative to scheduling individual processes, in which the customer process withdraws the items it needs from a supermarket and the supplying process produces to replenish what was withdrawn; used to avoid push. Also see “kanban”.
Quality Definitions – Page 77 (Return to Index) QEDS Standards Group The U.S. Standards Group on Quality, Environment, Dependability and Statistics consists of the members and leadership of organizations concerned with the development and effective use of generic and sector specific standards on quality control, assurance and management; environmental management systems and auditing, dependability and the application of statistical methods. Q9000 series Refers to ANSI/ISO/ASQ Q9000 series of standards, which is the verbatim American adoption of the 2000 edition of the ISO 9000 series standards. QS 9000 Establishes a set of standards for the automotive industry. This standard incorporates ISO 9001 plus the automotive requirements. The QS-9000 3rd Edition will expire 14 Dec 2006 (and ISO 9000:1994 expires 15 Dec 2003). Beyond that date, ISO/TS 16949:2002 will replace QS-9000. TS 16949 is more process driven and is expected to help streamline the quality systems further. Qualitician Someone who functions as both a quality practitioner and a quality technician. Quality A subjective term for which each person or sector has its own definition. In technical usage, quality can have two meanings:
1. The characteristics of a product or service that bear on its ability to satisfy stated or implied needs.
2. A product or service free of deficiencies. According to Joseph Juran, quality means “fitness for use”; according to Philip Crosby, it means “conformance to requirements.”
Quality Assurance/Quality Control (QA/QC) Two terms having many interpretations because of the multiple definitions for the words “assurance” and “control.” For example, “assurance” can mean the act of giving confidence, the state of being certain or the act of making certain; “control” can mean an evaluation to indicate needed corrective responses, the act of guiding or the state of a process in which the variability is attributable to a constant system of chance causes.
• One definition of quality assurance is: all the planned and systematic activities implemented within the quality system that can be demonstrated to provide confidence that a product or service will fulfill requirements for quality.
• One definition for quality control is: the operational techniques and activities used to fulfill requirements for quality. Often, however, “quality assurance” and “quality control” are used interchangeably, referring to the actions performed to ensure the quality of a product, service or process.
Quality Definitions – Page 78 (Return to Index) Quality assurance plan A detailed plan setting forth the process that will be used to measure supplier performance; defines what the organization must do to ensure that the supplier has performed in accordance with the performance standards. Quality audit A systematic, independent examination and review to determine whether quality activities and related results comply with plans and whether these plans are implemented effectively and are suitable to achieve the objectives. Quality circle A team that follows a standard process of problem identification, root cause analysis, problem solving and implementation. A quality improvement or self-improvement study group composed of a small number of employees (10 or fewer) and their supervisor. Quality circles originated in Japan, where they are called quality control circles. Quality control See “quality assurance/quality control”. Quality costs See “cost of poor quality”. Quality engineering The analysis of a manufacturing system at all stages to maximize the quality of the process itself and the products it produces. “Quality Excellence” for suppliers of telecommunications. A set of operational, managerial and engineering activities that a company uses to ensure the quality characteristics of a product are at the nominal or required levels. Quality Functional Deployment (QFD) A method to transform user (customer) demands into design quality, to deploy the functions forming quality, and to deploy methods for achieving the design quality into subsystems and component parts, and ultimately to specific elements of the manufacturing process. The QFD process is often referred to as listening to the voice of the customer. Quality improvement Quality is inversely proportional to variability. Quality Improvement is the reduction of variability in products and processes.
Quality Definitions – Page 79 (Return to Index) Quality lever This concept demonstrates that the earlier in the manufacturing process a quality correction or improvement is made, the greater the payoff - both in fixing the process and in reducing the costs. Theoretically, an investment in product engineering quality will give you a payback of 100:1 by the time your product is shipped. At the manufacturing engineering stage investment will have a payback of 10:1 greater than those made at final inspection. Quality loss function A parabolic approximation of the quality loss that occurs when a quality characteristic deviates from its target value. The quality loss function is expressed in monetary units: the cost of deviating from the target increases quadratically the farther the quality characteristic moves from the target. The formula used to compute the quality loss function depends on the type of quality characteristic being used. The quality loss function was first introduced in this form by Genichi Taguchi. Quality Management (QM) The application of a quality management system in managing a process to achieve maximum customer satisfaction at the lowest overall cost to the organization while continuing to improve the process. Quality management plan A document describing an organization’s quality system. This document identifies the organizational structure, policy and procedures, functional responsibilities of management and staff, lines of authority, and its processes for planning, implementing, documenting, and assessing all activities conducted under the organization’s quality system. Quality management principle A comprehensive and fundamental rule or belief, for leading and operating an organization, aimed at continually improving performance over the long term by focusing on customers while addressing the needs of all other interested parties. 8 principles have emerged as fundamental to the management of quality - customer focus, continual improvement, mutually beneficial supplier relationships, involvement of people, factual approach, system approach, process approach, and leadership.
Quality Definitions – Page 80 (Return to Index) Quality Management System (QMS) Can be expressed as the organizational structure, procedures, processes and resources needed to implement quality management. Elements of a Quality Management System :
• Organizational Structure • Responsibilities • Procedures • Processes • Resources
Quality manual A Quality Manual is the supplier's document that describes the elements of the quality system used to assure customer requirements, needs, and expectations are met. Quality manuals shall include responsibilities and authorities for each element of the quality system. Quality month Quality month is celebrated annually in October in North America. This was started by the American Society for Quality in the early 1980s. Individuals and organizations hold special events to strengthen their commitment to quality and celebrate performance excellence. Quality plan A document or set of documents that describe the standards, quality practices, resources and processes pertinent to a specific product, service or project. Quality planning Quality Planning is a structured process for defining the methods that will be used in the production of a specific product or family of products. Quality planning embodies the concepts of defect prevention and continuous improvement as contrasted with defect detection. Quality planning sign-off A review and commitment by the Product Quality Planning Team that all planned controls and processes are being followed. Quality policy An organization’s general statement of its beliefs about quality, how quality will come about and its expected result. Quality rate See “first pass yield”.
Quality Definitions – Page 81 (Return to Index) Quality records Quality Records are the documented evidence that the supplier's processes were executed according to the quality system documentation and records results. Quality score chart (Q chart) A control chart for evaluating the stability of a process. The quality score is the weighted sum of the count of events of various classifications in which each classification is assigned a weight. Also see “Q Chart Example”. Quality tool An instrument or technique to support and improve the activities of process quality management and improvement. Quality trilogy A three-pronged approach to managing for quality. The three legs are quality planning (developing the products and processes required to meet customer needs), quality control (meeting product and process goals) and quality improvement (achieving unprecedented levels of performance). QuEST Forum A partnership of telecommunications suppliers and service providers. The QuEST Forum developed TL 9000. Queue time Time a product waits between the value-added process steps. If inventory exists between process steps, can be approximated by dividing the inventory by customer demand for a time frame. Quick changeover The ability to change tooling and fixtures rapidly (usually within minutes) so multiple products can be run on the same machine. Quincunx A tool that creates frequency distributions. Beads tumble over numerous horizontal rows of pins, which force the beads to the right or left. After a random journey, the beads are dropped into vertical slots. After many beads are dropped, a frequency distribution results. Quincunxes are often used in classrooms to simulate a manufacturing process. The quincunx was invented by English scientist Francis Galton in the 1890s.
Quality Definitions – Page 82 (Return to Index) RABQSA International Organization that designs, develops and delivers personnel and training certification sources. RAM Reliability/availability/maintainability. Random cause A cause of variation due to chance and not assignable to any factor. Random sampling A commonly used sampling technique in which sample units are selected so all combinations of n units under consideration have an equal chance of being selected as the sample. Range (statistical) The measure of dispersion in a data set (the difference between the highest and lowest values). Range chart (R chart) A control chart in which the subgroup range, R, evaluates the stability of the variability within a process. Also called the “within” chart as the points on the chart represent within group variation. This control chart is: used to display change within subgroups; the R chart for a set of data must be “in control”, more technically defined as “stable’, to be able to use an X-bar chart based on the same data. Also see “Control Chart Examples”. Random sample A sampling method whereby each service output in a lot has an equal chance of being selected. Random sampling A method of looking at a few individual items in a lot to determine the quality of that lot against a standard.
Quality Definitions – Page 83 (Return to Index) Rational subgroup A rational subgroup is one in which the samples are selected so that the chance for variation due to special causes occurring within a subgroup is minimized, while the chance for special cause variation between subgroups is maximized. The key item to remember when developing a sampling plan is that the variation between subgroups is going to be compared to the variation within subgroups. Taking consecutive samples for the subgroups minimizes the opportunity for the process to change and should minimize the within-subgroup variation. The sampling frequency will determine the opportunity the process has to change between subgroups. The variation within a subgroup represents the piece-to-piece variation over a short period of time. Any significant variation between subgroups would reflect changes in the process that should be investigated for appropriate action. (Source: AIAG SPC Manual). Red bead experiment An experiment developed by W. Edwards Deming to illustrate it is impossible to put employees in rank order of performance for the coming year based on their performance during the past year because performance differences must be attributed to the system, not to employees. Six people, 800 red beads and 3,200 white beads are needed for the experiment. The participants’ goal is to produce white beads, because the customer will not accept red beads. One person begins by stirring the beads in a jar and then, blindfolded, selecting a sample of 50 beads. That person hands the jar to the next person, who repeats the process, and so on. When everyone has his or her sample, the number of red beads for each is counted. The limits of variation between employees that can be attributed to the system are calculated. Everyone will fall within the calculated limits of variation that could arise from the system. The calculations will show there is no evidence one person will be a better performer than another in the future. The experiment shows that it would be a waste of management’s time to try to find out why, say, John produced four red beads and Jane produced 15; instead, management should improve the system, making it possible for everyone to produce more white beads. Red rabbit test Used to check how long it takes to identify a defect. In this test, a red part is added to the mix and the time until it is discovered is identified. Reengineering A breakthrough approach for restructuring an entire organization and its processes. Registered suppliers Registered Suppliers are suppliers who have received third party registration to a specific quality system standard for the commodity supplied. Registrar Generally accepted U.S. equivalent term for “certification body.”
Quality Definitions – Page 84 (Return to Index) Registration The act of including an organization, product, service or process in a compilation of those having the same or similar attributes. Registration to standards A process in which an accredited, independent third-party organization conducts an on-site audit of a company’s operations against the requirements of the standard to which the company wants to be registered. Upon successful completion of the audit, the company receives a certificate indicating it has met the standard requirements. In countries outside the United States, this generally known as certification. Regression analysis Any techniques for modeling and analyzing several variables, when the focus is on the relationship between a dependent variable and one or more independent variables. Helps to understand how the typical value of the dependent variable changes when any one of the independent variables is varied, while the other independent variables are held fixed. Rejection number The smallest number of defectives (or defects) in the sample or samples under consideration that will require rejection of the lot. Relations diagram See “interrelationship diagram”. Also see “Relations Diagram Example”. Reliability The probability of a product’s performing its intended function under stated conditions without failure for a given period of time. Rengi system Formal decision process. Repeatability (in MSE) Variation between successive measurements of the same part or characteristic, by the same person, using the same instrument; also known as test-retest error or operator uncertainty. Reproducibility (in MSE) The variation in measurements made by different people using the same measuring device to measure the same characteristic on the same product. Required waste Process that adds no value to the product, but is required by the current process.
Quality Definitions – Page 85 (Return to Index) Requirements The ability of an item to perform a required function under stated conditions for a stated period of time. Resource utilization Using a resource in a way that increases throughput. Response surface method A technique to find maximum or minimum condition - the basic strategy is in considering the graph (similar to contours on a topographical map) of the yield as a function of the two significant factors. The higher the hill, the better the yield. Results The effects that an organization obtains at the conclusion of a time period. Rework Action taken on nonconforming product so that it will meet the specified requirements. Right size Matching tooling and equipment to the job and space requirements of lean production. Right sizing is a process that challenges the complexity of equipment by examining how equipment fits into an overall vision for workflow through a factory. When possible, right sizing favors smaller, dedicated machines rather than large, multipurpose batch processing ones. Right the first time The concept that it is beneficial and more cost effective to take the necessary steps up front to ensure a product or service meets its requirements than to provide a product or service that will need rework or not meet customer needs. In other words, an organization should engauge in defect prevention rather than defect detection. Risk analysis Risk analysis has a primary purpose of answering two questions - 1. what can go wrong? and, 2. if something does go wrong, what is the probability of it happening & what are the consequences? Risk management Using managerial resources to integrate risk identification, risk assessment, risk prioritization, development of risk handling strategies and mitigation of risk to acceptable levels.
Quality Definitions – Page 86 (Return to Index) Risk Priority Number (RPN) Ranking of each potential risk of failure for each design and/or process step during a FMEA to assess relative priority of potential solutions. Calculated as “Severity x Occurrence x Detectability”. Robust design The design of products to be less sensitive to variations, including manufacturing variation, environment and abuse, increasing the probability that they will perform as intended. It is an integrated system of tools and techniques that are aimed at reducing product or process performance variability while simultaneously guiding that performance towards an optimal setting. Robustness measures are usually implemented for designs that are new so that the best values of the critical functional parameters are uncovered. Robust design follows the methods first proposed by Genichi Taguchi. Rolled Throughput Yield (RTY) Probability that a product will pass through the entire process without rework and defects. It is the product of the First Time Through (FTT) of all process steps. Root cause The source of a problem which, if eliminated, would prevent recurrence of the issue. A factor that caused a nonconformance and should be permanently eliminated through process improvement. Root cause analysis A class of problem solving methods aimed at identifying the root causes of problems or events. The practice of RCA is predicated on the belief that problems are best solved by attempting to correct or eliminate root causes, as opposed to merely addressing the immediately obvious symptoms. Steps involved in conducting a good root cause analysis:
1. Understand the goal of the analysis and be objective. 2. Obtain a clear understanding of the failure. 3. Clearly identify all possible root causes. 4. Evaluate the likelihood of each root cause. 5. Converge on the most likely root cause. 6. Clearly identify and evaluate all possible corrective actions. 7. Select the optimal corrective action. 8. Verify the corrective action(s).
Root Sum Squared (RSS) Analysis Each of the errors is squared. Then, they are added together, and the square root is taken. This (the square root of the sum of the squares) is the estimated uncertainty of the measurement.
Quality Definitions – Page 87 (Return to Index) Run chart Also known as a “run-sequence plot” is a chart showing a line connecting numerous data points collected from a process running over time. Often, the data displayed represent some aspect of the output or performance of a manufacturing or other business process. One of the 7 Basic Tools of Quality Control. Also see “Run Chart Example”. Run order (vs. standard order) Randomizing the standard order (to create a "run order") to determine the order in which run the combinations. (used in DOE). Runner A person on the production floor who paces the entire value stream through the pickup and delivery of materials through kanban usage.
Quality Definitions – Page 88 (Return to Index) SAE International Professional organization of individual engineers and related disciplines; formerly Society for Automotive Engineers. Sample In acceptance sampling, one or more units of product (or a quantity of material) drawn from a lot for purposes of inspection to reach a decision regarding acceptance of the lot. Samples need to be random, independent and unbiased. Sample size [n] The number of units in a sample. Sampling at random As commonly used in acceptance sampling theory, the process of selecting sample units so all units under consideration have the same probability of being selected. Note: Equal probabilities are not necessary for random sampling; what is necessary is that the probability of selection be ascertainable. However, the stated properties of published sampling tables are based on the assumption of random sampling with equal probabilities. An acceptable method of random selection with equal probabilities is the use of a table of random numbers in a standard manner. Sampling, double Sampling inspection in which the inspection of the first sample leads to a decision to accept a lot, reject it or take a second sample; the inspection of a second sample, when required, then leads to a decision to accept or to reject the lot. Sampling, multiple Sampling inspection in which, after each sample is inspected, the decision is made to accept a lot, reject it or take another sample. But there is a prescribed maximum number of samples, after which a decision to accept or reject the lot must be reached. Note: Multiple sampling as defined here has sometimes been called “sequential n sampling” or “truncated sequential e sampling.” The term “multiple sampling” is recommended. Sampling plan A scheme for determining sample sizes and actions for making decisions. 'The decision, based on counting the number of defectives in a sample, can be to accept the lot, reject the lot, or even, for multiple or sequential sampling schemes, to take another sample and then repeat the decision process'. Sampling, single Sampling inspection in which the decision to accept or to reject a lot is based on the inspection of one sample.
Quality Definitions – Page 89 (Return to Index) Sampling, unit Sequential sampling inspection in which, after each unit is inspected, the decision is made to accept a lot, reject it or to inspect another unit. Sanitizing English translation of seiso, one of the Japanese 5S’s used for workplace organization. Sanitizing (also referred to as shining or sweeping) is the act of cleaning the work area. Dirt is often the root cause of premature equipment wear, safety problems and defects. Satisfier A term used to describe the quality level received by a customer when a product or service meets expectations. SCAMPER SCAMPER stands for a checklist that helps the creative process - substitute, combine, adapt, modify, put (to other uses), eliminate, reverse. Scatter plot or scatter diagram A graphical technique to analyze the relationship between two variables. Two sets of data are plotted on a graph, with the y-axis being used for the variable to be predicted and the x-axis being used for the variable to make the prediction. The graph will show possible relationships (although two variables might appear to be related, they might not be; those who know most about the variables must make that evaluation). One of the 7 Basic Tools of Quality Control. Also see “Scatter Plot Example”. Scedasticity The relationship between the value of input variables and the variation (rather than the mean) of the output. Where variation changes with the input variable (for example, variation increases over time) then the process demonstrates hetero-scedasticity (sequence of random variables having different variances). Where variation is constant the process demonstrates homo-scedasticity (sequence of random variables having a constant variance). Scientific management/approach A term referring to the intent to find and use the best way to perform tasks to improve quality, productivity and efficiency. s chart A type of control chart used to monitor a variables data when samples are collected at regular intervals from a business or industrial process. The s chart plots the mean value for the quality characteristic across all units in the sample, , plus the standard deviation of the quality characteristic across all units in the sample. Also see “Control Chart Examples”.
Quality Definitions – Page 90 (Return to Index) Scorecard An evaluation device, usually in the form of a questionnaire, that specifies the criteria customers will use to rate your business’ performance in satisfying customer requirements. Seiban The name of a Japanese management practice taken from the words sei, which means manufacturing, and ban, which means number. A seiban number is assigned to all parts, materials and purchase orders associated with a particular customer job, project or anything else. This enables a manufacturer to track everything related to a particular product, project or customer, and facilitates setting aside inventory for specific projects or priorities. That makes it an effective practice for project and build-to-order manufacturing. Self-Directed Work Team (SDWT) A type of team structure in which much of the decision making regarding how to handle the team’s activities is controlled by the team members themselves. Sentinel event Healthcare term for any event not consistent with the desired, normal or usual operation of the organization. Also known as an adverse event. Service level agreement A formal agreement between an internal provider and an internal receiver (customer). Setup time The elapsed time from production of the last good product to the production of the first good product; associated with changing the process from one product to another. Seven basic tools of quality control:
• Cause-and-Effect, Fishbone, or Ishikawa diagram • Check Sheet • Control Chart • Histogram • Pareto Chart • Scatter Plot or Scatter Diagram • Stratification (alternately Flow Chart or Run Chart)
Seven wastes See “eight wastes”. Severity (in FMEA) An assessment of how serious the effect of the potential failure mode is on the customer. The customer in this case could be the next operation, subsequent operations, or the end user.
Quality Definitions – Page 91 (Return to Index) Shadow board A tool painted to indicate where tools belong and which tools are missing. An example of visual management or visual control. Shewhart cycle See “plan-do-check-act cycle.” Shift Changes over time - data typically shifts 1.5 sigma levels (a key measure of process capability) between short-term and long-term. Sifting English translation of Japanese seiri, one of the 5S’s used for workplace organization. Sifting involves screening through unnecessary materials and simplifying the work environment. Sifting is separating the essential from the nonessential. Sigma 18th letter of the Greek alphabet. Mathematically understood to represent standard deviation in a normally distributed process. Significant characteristics (in FMEA) Product and process characteristics designated by the customer, including governmental regulatory and safety, and/or selected by the supplier through knowledge of the product and process. Signal to Noise (S/N) ratio An equation that indicates the magnitude of an experimental effect above the effect of experimental error due to chance fluctuations. Simulation The practice of mimicking some or all of the behavior of one system with a different, dissimilar system. A 3-D technique to balance a line. It involves using cardboard, wood and plastic foam to create full-sized equipment mock-ups that can be easily moved to obtain an optimum layout. Simultaneous engineering A way of simultaneously designing products, and the processes for manufacturing those products, through the use of cross functional teams to assure manufacturability and to reduce cycle time.
Quality Definitions – Page 92 (Return to Index) Single-Minute Exchange of Dies (SMED) A series of techniques pioneered by Shigeo Shingo for changeovers of production machinery in less than 10 minutes. The long-term objective is always zero setup, in which changeovers are instantaneous and do not interfere in any way with continuous flow. Setup in a single minute is not required, but used as a reference (see “one-touch exchange of dies,” “internal setup” and “external setup”). Single-piece flow A process in which products proceed, one complete product at a time, through various operations in design, order taking and production without interruptions, backflows or scrap. SIPOC SIPOC is a tool used by Six Sigma process improvement teams to identify all relevant elements (Suppliers, Inputs, Process, Outputs, Customers) of a process improvement project before work begins. Six Sigma Philosophy focuses on defect prevention through the use of statistical tools as opposed to defect detection through inspection. Six Sigma seeks to improve the quality of process output(s) by identifying and removing the causes of defects (errors) and minimizing variability in manufacturing and business processes. It uses a set of quality management methods, including statistical methods, and creates a special infrastructure of people within the organization ("Black Belts", "Green Belts", etc.) who are experts in these methods. Each Six Sigma project carried out within an organization follows a defined sequence of steps and has quantified targets. These targets can be financial (cost reduction or profit increase) or whatever is critical to the customer of that process (cycle time, safety, delivery, etc.). The increase in performance and decrease in process variation lead to defect reduction and improvement in profits, employee morale and quality of products or services. Six Sigma quality is a term generally used to indicate a process is well controlled (±6 sigma from the centerline in a control chart). Six Sigma quality A term generally used to indicate process capability in terms of process spread measured by standard deviations in a normally distributed process. Skewed distribution See “non-normal distribution”. Special causes Variation that is a result of a special circumstance. On a control chart, by definition, special causes always fall outside control limits. Causes of variation that arise because of special circumstances. They are not an inherent part of a process. Special causes are also referred to as assignable causes. Also see “common causes”.
Quality Definitions – Page 93 (Return to Index) Software Quality Assurance (SQA) A systematic approach to evaluating the quality of and adherence to software product standards, processes and procedures. SQA includes ensuring standards and procedures are established and are followed throughout the software acquisition life cycle. Sort English translation of the Japanese word seiri, one of the 5S’s used for workplace organization. Sorting (also referred to as structuring or sifting) involves organizing essential materials. It helps the operator to find materials when needed. Special characteristic Automotive ISO TS 16949 term for key product or process characteristics. Specifications Specifications are engineering requirements for judging the acceptability of a part characteristic. For the production part approval process (PPAP), every feature of the product as identified by engineering specifications must be measured. Actual measurement and test results are required. Specifications should not be confused with control limits which represent "the voice of the process". Spider diagram A visual reporting tool for the performance of a number of indicators. Also known as "radar chart" this tool makes visible the gaps between the current and desired performance. Also see “Spider Diagram Example”. Sponsor The person who supports a team’s plans, activities and outcomes. Stable process A process which is free of assignable causes (in statistical control - a quantitative condition which describes a process that is free of assignable / special causes of variation). Stability The total variation in the measurements obtained with a measurement system (gauge) on the same master or part when measuring a single characteristic over an extended time period. Also known as drift.

Quality Definitions – Page 94 (Return to Index) Stages of team growth Four stages that teams move through as they develop maturity: forming, storming, norming and performing. Also see “FSNP”. Stakeholder Any individual, group or organization that will have a significant impact on or will be significantly impacted by the quality of a specific product or service. Standard The metric, specification, gauge, statement, category, segment, grouping, behavior, event or physical product sample against which the output(s) of a process are compared and declared acceptable or unacceptable. Standard deviation (statistical) A computed measure of variability indicating the spread of the data set around the mean. Parameter used to characterize the “process dispersion”. It shows how much variation there is from the "average" (mean). A low standard deviation indicates that the data points tend to be very close to the mean, whereas high standard deviation indicates that the data are spread out over a large range of values. Standard in-process stock One of the three elements that make up standard work. It is the minimum quantity of parts always on hand for processing during and between sub-processes. It allows workers to do their jobs continuously in a set sequence, repeating the same operation over and over in the same order. Also see “standard work”. Standard Operating Procedures (SOP) Procedures that describe how the process is run and identify certain factors to monitor and maintain; standard procedure for running the process. Or, a written procedure prescribed for repetitive use as a practice, in accordance with agreed upon specifications aimed at obtaining a desired outcome. Standard work A precise description of each work activity, specifying cycle time, takt time, the work sequence of specific tasks and the minimum inventory of parts on hand needed to conduct the activity. All jobs are organized around human motion to create an efficient sequence without waste. Work organized in such a way is called standard(ized) work. The three elements that make up standard work are takt time, working sequence and standard in-process stock.

Quality Definitions – Page 95 (Return to Index) Standard work instructions A lean manufacturing tool that enables operators to observe a manufacturing process with an understanding of how assembly tasks are to be performed. It ensures the quality level is understood and serves as an excellent training aid, enabling replacement or temporary individuals to easily adapt and perform the assembly operation. Standardization When policies and common procedures are used to manage processes throughout the system. Also, English translation of the Japanese word seiketsu, one of the Japanese 5S’s used for workplace organization. Statistical control Is the condition of a process from which all special causes of variation have been eliminated and only common causes remain. Statistical control is evidenced on ,a control chart by the absence of points beyond the control limits and by the absence of any non-random patterns or trends. Statistical Process Control (SPC) The application of statistical methods to the monitoring and control of a process to ensure that it operates at its full potential to produce conforming product. Under SPC, a process behaves predictably to produce as much conforming product as possible with the least possible waste. Key tools in SPC are control charts, a focus on continuous improvement and design of experiments (DOE). Statistical Quality Control (SQC) The application of statistical techniques to control quality. Often used interchangeably with the term “statistical process control”, although statistical quality control includes acceptance sampling, which statistical process control does not. Statistics A field that involves tabulating, depicting and describing data sets; a formalized body of techniques characteristically involving attempts to infer the properties of a large collection of data from inspection of a sample of the collection. Stop the line authority Power given to workers to stop the process when abnormalities occur, allowing them to prevent the defect or variation from being passed along. Strategic planning The process an organization uses to envision its future and develop the appropriate strategies, goals, objectives and action plans.
Quality Definitions – Page 96 (Return to Index) Stratification A process of grouping data according to a common characteristic. See “flow chart” or “run chart”. One of the 7 Basic Tools of Quality Control. Strengths, Weaknesses, Opportunities, Threats (SWOT) analysis A strategic technique used to assess what an organization is facing. Stretch goals Goals and objectives that require employees to achieve more than normally thought possible. Structural variation Variation caused by regular, systematic changes in output, such as seasonal patterns and long-term trends. Sub-grouping A method of organizing (classify, stratify, group, etc.) data from a process to ensure the greatest similarity among the data in each subgroup and the greatest difference among the data in different subgroups. Groups need to be selected rationally, i.e. you have a belief that the groups are different and important. Submission level Refers to the level of evidence required for production part submissions. (Refer to the PPAP manual and/or Local PPAP Addendum) Sub-optimization A condition in which gains made in one activity are offset by losses in another activity or activities that are caused by the same actions that created gains in the first activity. Subsystem A major part of a system which itself has the characteristics of a system, usually consisting of several components. Supermarket The storage locations of parts before they go on to the next operation. Supermarkets are managed by predetermined maximum and minimum inventory levels. Each item in the plant is at a designated location.
Quality Definitions – Page 97 (Return to Index) Supplier Quality Assurance (SQA) Confidence a supplier’s product or service will fulfill its customers’ needs. This confidence is achieved by creating a relationship between the customer and supplier that ensures the product will be fit for use with minimal corrective action and inspection. According to Joseph M. Juran, nine primary activities are needed:
1. Define product and program quality requirements. 2. Evaluate alternative suppliers. 3. Select suppliers. 4. Conduct joint quality planning. 5. Cooperate with the supplier during the execution of the contract. 6. Obtain proof of conformance to requirements. 7. Certify qualified suppliers. 8. Conduct quality improvement programs as required. 9. Create and use supplier quality ratings.
Suppliers Suppliers are defined as providers of production materials, production or service parts, heat treating, plating, painting or other finishing services. Or, a source of materials, service or information input provided to a process. Supply chain The series of suppliers to a given process. Supply Chain Operations Reference (SCOR) A methodology that extends the scope of the value stream, starting with your supplier’s supplier and continuing to your customer’s customer. SURVIVAL for Quality Professional S = Size up the issue on hand. U = Use process knowledge. R = Reach out to the experts. V = Vanquish defensive attitudes. I = Improve on old ideas. V = Value the customer. A = Assess the changes. L = Limit the scope to the problem.
Surveillance The continual monitoring of a process; a type of periodic assessment or audit conducted to determine whether a process continues to perform to a predetermined standard. Survey The act of examining a process or questioning a selected sample of individuals to obtain data about a process, product or service.
Quality Definitions – Page 98 (Return to Index) Sustain The English translation of shitsuke, one of the 5S’s used for workplace organization. Sustaining (also referred to as self-disciplining) is the continuation of sorting, setting in order and sanitizing. It addresses the need to perform the 5S’s on an ongoing and systematic basis. Symptom An observable phenomenon arising from and accompanying a defect. Synectics Developed by W. Gordon (1961), this method uses analogies and metaphors trigger idea generation. This method is based on the fact that the mind is more productive when dealing with a new or foreign environment. the analogous situation takes the individual away from the exact problem at and requires him/her to consider a related problem. System A combination of several components or pieces of equipment integrated to perform a specific function. Or, a group of interdependent processes and people that together perform a common mission. System kaizen Improvement aimed at an entire value stream.
Quality Definitions – Page 99 (Return to Index) Taguchi methods Statistical methods developed by Genichi Taguchi to improve the quality of manufactured goods, and more recently also applied to, engineering, biotechnology, marketing and advertising. The American Supplier Institute’s trademarked term for the quality engineering methodology. In this engineering approach to quality control, Taguchi calls for off-line quality control, on-line quality control and a system of experimental design to improve quality and reduce costs. Takt time “Takt” is German for the word metronome. It synchronizes the pace of the process to match the pace of customer demand. Calculated as available time divided by customer demand. Takt is the heartbeat of a lean system. It is the rate of customer demand. It is the tool to link production to the customer by matching the pace of production to the pace of actual final sales. It defines the rate which material and product flow through the value stream. First, you calculate actual takt times for each product and part (takt time = total time available for production / customer demand, where, customer demand = total production requirement / total available production time). It is used to design assembly and other processes, to assess production conditions, calculate pitch, develop material handling processes, determine problem-response requirements, and so on. To run faster than takt time anywhere in the value stream is overproduction, resulting in excess inventory. To run slower than takt time creates the need for accelerated production, overtime, and expedited shipments. Also see “cycle time”. Tampering Action taken to compensate for variation within the control limits of a stable system; tampering increases rather than decreases variation, as evidenced in the funnel experiment. Task A specific, definable activity to perform an assigned piece of work, often finished within a certain time. Team A group of individuals organized to work together to accomplish a specific objective. Team feasibility commitment A commitment by the Product Quality Planning Team that the design can be manufactured, assembled, tested, packaged, and shipped in sufficient quantity at an acceptable cost, and on schedule. Technical Report (TR) A type of document in the International Organization for Standardization portfolio of deliverables.
Quality Definitions – Page 100 (Return to Index) Technical Specification (TS) A type of document in the International Organization for Standardization portfolio of deliverables. Theory of Constraints (TOC) A lean management philosophy that stresses removal of constraints to increase throughput while decreasing inventory and operating expenses. TOC’s set of tools examines the entire system for continuous improvement. The current reality tree, conflict resolution diagram, future reality tree, prerequisite tree and transition tree are the five tools used in TOC’s ongoing improvement process. Also called constraints management. Also see “The TOC Thinking Processes”. Thought Process Map (TMAP) Project strategy-planning tool. Helps present thoughts and any questions at the start of the project in a structured, visual way with respect to realizing the project goal. It helps identify all information and progress through a DMAIC process. 3P The Production Preparation Process is a tool for creating lean manufacturing environments. It is a highly disciplined, standardized model that results in the development of an improved production process in which low waste levels are achieved at low capital cost. 3-2-1 location or n-2-1 locating scheme 1. 3 locators position part in a primary plane / direction 2. 2 locators then position the part in a secondary direction 3. 1 locator to position part in the tertiary direction One could replace 2 & 3 with 2 round pins (one for a circular hole and other for a slot), pin locates part in two directions (in/out and fore aft), slot locates part in 1-direction (2-way). Throughput The rate the system generates money through sales, or the conversion rate of inventory into shipped product. Throughput time Cycle Time + Queue Time; actual time for a product to move through a production process. Time series (analysis) A sequence of data points, measured typically at successive times spaced at uniform time intervals. Timing plan A plan that lists tasks, assignments, events, and timing required to provide a product that meets customer needs and expectations.
Quality Definitions – Page 101 (Return to Index) TL 9000 A quality management standard for the telecommunications industry based on ISO 9000. Its purpose is to define the requirements for the design, development, production, delivery, installation and maintenance of products and services. Included are cost and performance based measurements that measure reliability and quality performance of the products and services. Tolerance The maximum and minimum limit values a product can have and still meet customer requirements. Tolerance design A technique using Taguchi Methods or Design of Experiments to identify how much each tolerance contributes to the final Quality and Reliability to help the engineer decide which tolerance to improve and which tolerance to relax. Tolerance design increases product / manufacturing cost and should be done when parameter design has not sufficiently reduced variation. Tolerance stacks, tolerance stackups or tolerance stack-ups Terms used to describe the problem-solving process in mechanical engineering of calculating the effects of the accumulated variation that is allowed by specified dimensions and tolerances, including GD&T. Typically these dimensions and tolerances are specified on an engineering drawing. Arithmetic tolerance stackups use the worst-case maximum or minimum values of dimensions and tolerances to calculate the maximum and minimum distance (clearance or interference) between two features or parts. Statistical tolerance stackups evaluate the maximum and minimum values based on the absolute arithmetic calculation combined with some method for establishing likelihood of obtaining the maximum and minimum values, such as Root Sum Square (RSS) or Monte-Carlo methods. Top management commitment Participation of the highest level officials in their organization’s quality improvement efforts. Their participation includes establishing and serving on a quality committee, establishing quality policies and goals, deploying those goals to lower levels of the organization, providing the resources and training lower levels need to achieve the goals, participating in quality improvement teams, reviewing progress organization wide, recognizing those who have performed well and revising the current reward system to reflect the importance of achieving the quality goals. Total Defects per Unit (TDU) The sum of all the DPUs (Defects Per Unit) for all parts in an assembly or all process steps in a process flow diagram.

Quality Definitions – Page 102 (Return to Index) Total productive maintenance (TPM) A series of methods, originally pioneered by Nippondenso (a member of the Toyota group), to ensure every machine in a production process is always able to perform its required tasks so production is never interrupted. Total quality A strategic integrated system for achieving customer satisfaction that involves all managers and employees and uses quantitative methods to continuously improve an organization’s processes. Total Quality Control (TQC) A system that integrates quality development, maintenance and improvement of the parts of an organization. It helps a company economically manufacture its product and deliver its services. Total Quality Management (TQM) A term first used to describe a management approach to quality improvement. Since then, TQM has taken on many meanings. Simply put, it is a management approach to long-term success through customer satisfaction. TQM is based on all members of an organization participating in improving processes, products, services and the culture in which they work. The methods for implementing this approach are found in the teachings of such quality leaders as Philip B. Crosby, W. Edwards Deming, Armand V. Feigenbaum, Kaoru Ishikawa and Joseph M. Juran. Touzen Unnecessary Kaizen Toyota Production System (TPS) The production system developed by Toyota Motor Corp. to provide best quality, lowest cost and shortest lead time through eliminating waste. TPS is based on two pillars: just-in-time and jidohka. TPS is maintained and improved through iterations of standardized work and kaizen. Transaction data The finite data pertaining to a given event occurring in a process. Examples are the data obtained when an individual checks out groceries (the grocery shopping process) and the data obtained from testing a machined component (the final product inspection step of the manufacturing process). Transition Tree (TRT) Step-by-step process from start to finish of a course of action. It shows how specific actions combine with existing reality to achieve new expected effects, and why we expect those actions to achieve the particular outcomes that are required. (Part of the Theory of Constraints Thinking Process). Also see “Transition Tree Example”.
Quality Definitions – Page 103 (Return to Index) Tree diagram A visual representation of the major functions performed by a system which shows logical components and sub-components. A management tool that depicts the hierarchy of tasks and subtasks needed to complete an objective. The finished diagram bears a resemblance to a tree. Also see “Tree Diagram Example”. Trend The graphical representation of a variable’s tendency over time to increase, decrease, or remain unchanged. Trend control chart A control chart in which the deviation of the subgroup average, X-bar, from an expected trend in the process level is used to evaluate the stability of a process. Also see “Trend Control Chart Example”. Trial and error, or trial by error A general method of problem solving, fixing things, or for obtaining knowledge. "Learning doesn't happen from failure itself but rather from analyzing the failure, making a change, and then trying again. TRIZ TRIZ (Teoriya Resheniya Izobreatatelskikh Zadatch), the Russian language acronym for the Theory of Inventive Problem Solving is a product of the cataloguing and analysis of empirical data. A structured methodology which contains an algorithm for isolating the principal technology / engineering conflict which limits or prevents satisfactory performance of a system. The identified conflict is then categorized using established physical laws, principles, or relationships, thereby enabling fundamental solutions to be derived based upon proven (sometimes previously unrelated) technology. t-test A method to assess whether the means of two groups are statistically different from each other. Used to test means or location effects. For example, used to compare the mean output of Line A vs. the mean output of Line B. [Statistical inference tests to compare the quality of different products / processes and compare the performance of different groups.] Type I errors An incorrect decision to reject something (such as a statistical hypothesis or a lot of products) when it is acceptable. Type I error (also known as alpha error) - conclude a difference exists when no difference exists. (for example, you say two machines produce different mean output(s) when they do not.). Type II errors An incorrect decision to accept something when it is unacceptable. Type II error (also known as beta error) - conclude no difference exists when it does. (For example, say two machines produce similar mean output(s) when in fact they do).
Quality Definitions – Page 104 (Return to Index) u-chart A type of control chart used to monitor "count" type data where the sample size is greater than one, typically the average number of nonconformities per unit. The u-chart differs from the c-chart in that it accounts for the possibility that the number or size of inspection units for which nonconformities are to be counted may vary. Also see “Control Chart Examples”. Unit An object for which a measurement or observation can be made; commonly used in the sense of a “unit of product,” the entity of product inspected to determine whether it is defective or non-defective. Upper Control Limit (UCL) Control limits that are calculated from time series process data; they are also referred to as the voice of the process. Upper Spec Limit (USL) Customer supplied specification limits or tolerance for a process output; they are also referred to as the voice of the customer. Uptime See “equipment availability”.
Quality Definitions – Page 105 (Return to Index) Validation The act of confirming a product or service meets the requirements for which it was intended. Validity The ability of a feedback instrument to measure what it was intended to measure; also, the degree to which inferences derived from measurements are meaningful. Value A capability provided to a customer at the right time at an appropriate price, as defined in each case by the voice of the customer. Value-added A term used to describe activities that transform Inputs into a customer (internal or external) usable Outputs. Transforms the form, fit and or function of a product, material, or service as defined by the customer the first time. Also see “non-value added”. Value analysis Analyzing the value stream to identify value added and non-value added activities. Value engineering Analyzing the components and process that create a product, with an emphasis on minimizing costs while maintaining standards required by the customer. Value stream All activities, both value added and non-value added, required to bring a product from raw material state into the hands of the customer, bring a customer requirement from order to delivery and bring a design from concept to launch. Also see “information flow” and “hoshin planning”. Value stream loops Segments of a value stream with boundaries broken into loops to divide future state implementation into manageable pieces. Value stream manager Person responsible for creating a future state map and leading door-to-door implementation of the future state for a particular product family. Makes change happen across departmental and functional boundaries.
Quality Definitions – Page 106 (Return to Index) Value Stream Map (VSM) A visual tool used to document the flow of products or services through a system. A value stream is all of the actions required to change raw materials into a product delivered to the customer. The VSM differentiates the value-adding activities of a system from the non-value-adding ones. Recording the time taken for each activity shows what percentage of valuable time an object or person spends in a system. Any non-value-adding time indicates an opportunity for possible improvement within the system. The VSM shows the process flow from order to delivery and includes - a) information & material flow, b) product throughput & cycle times, c) resources utilized, d) value added times and e) location of significant waste. Also see “Value stream mapping example”. Value stream mapping A pencil and paper tool used in two stages. First, follow a product’s production path from beginning to end and draw a visual representation of every process in the material and information flows. Second, draw a future state map of how value should flow. The most important map is the future state map. Values The fundamental beliefs that drive organizational behavior and decision making. Variables data The quantitative results where measurements are used for analysis. Examples include the diameter of a bearing journal in millimeters, the closing effort of a door in newtons, the concentration of an electrolyte in percent, and the torque of a fastener in newton-meters. Measurement information. Control charts based on variable data include average (X-bar) chart, range (R) chart, and sample standard deviation (s) chart. Variation A change in data, characteristic or function caused by one of four factors: special causes, common causes, tampering or structural variation. VA / VE Value Analysis/Value Engineering. VA / VE is a systematic effort to improve upon cost and/or performance of products (services) either purchased or produced. It examines the materials, processes, information systems, and the flow of materials involved. Verification The act of determining whether products and services conform to specific requirements. Virtual team Remotely situated individuals affiliated with a common organization, purpose or project, who conduct their joint effort via electronic communication.
Quality Definitions – Page 107 (Return to Index) Vision An overarching statement of the way an organization wants to be; an ideal state of being at a future point. Visual control Also known as visual management. Any devices that help operators quickly and accurately gauge production status at a glance. Progress indicators and problem indicators help assemblers see when production is ahead, behind or on schedule. They allow everyone to instantly see the group’s performance and increase the sense of ownership in the area. Examples include temperature gauges, control charts, tool boards, etc. Also see “andon board”, “kanban”, “production board”, “painted floor” and “shadow board”. Vital few, useful many A term Joseph M. Juran used to describe the Pareto principle, which he first defined in 1950. (The principle was used much earlier in economics and inventory control methods.) The principle suggests most effects come from relatively few causes; that is, 80% of the effects come from 20% of the possible causes. The 20% of the possible causes are referred to as the “vital few;” the remaining causes are referred to as the “useful many.” When Juran first defined this principle, he referred to the remaining causes as the “trivial many,” but realizing that no problems are trivial in quality assurance, he changed it to “useful many.” Also see “eighty-twenty (80-20)”. Voice of Customer (VOC) The expressed requirements and expectations of customers relative to products or services, as documented and disseminated to the providing organization’s members. Customer feedback both positive and negative including likes, dislikes, problems and suggestions. Also see “upper spec limit” and “lower spec limit”. Voice of Process (VOP) Natural variability of a process typically characterized by a normal distribution. Statistical data that is feedback to the people in the process to make decisions about the process stability and/or capability as a tool for continuous improvement. Also see “upper control limit” and” lower control limit”. Voluntary standard A standard that imposes no inherent obligation regarding its use.
Quality Definitions – Page 108 (Return to Index) Waiver Written authorization to use or release a quantity of material, components, or stores already manufactured but not conforming to the specified requirements. Warrant Warrant is an industry-standard document required for all newly-tooled or revised products in which the supplier confirms that inspections and tests on production parts show conformance to customer requirements. Waste Anything that adds cost without producing a corresponding benefit. Or, any activity that consumes resources and produces no added value to the product or service a customer receives. Also known as “muda”. Weighted mean or weighted average The sum of the products of each value and its weight, divided by the sum of the weights where weights are non-negative coefficients assigned to each of the values. Weighed voting A way to prioritize a list of issues, ideas or attributes by assigning points to each item based on its relative importance. Wilcoxon Mann-Whitney test Used to test the null hypothesis that two populations have identical distribution functions against the alternative hypothesis that the two distribution functions differ only with respect to location (median), if at all. It does not require the assumption that the differences between the two samples are normally distributed. In many applications, it is used in place of the two sample t-test when the normality assumption is questionable. This test can also be applied when the observations in a sample of data are ranks, that is, ordinal data rather than direct measurements. Work in process Items between machines or equipment waiting to be processed (completed). Work team See “natural team”. Working sequence One of three elements of standard work; refers to the sequence of operations in a single process that leads a floor worker to most efficiently produce quality goods. World-class quality A term used to indicate a standard of excellence: best of the best.
Quality Definitions – Page 109 (Return to Index) x The input(s) to a process (input(s) for individual process steps/tasks are identified using the lower-case “x”). Six Sigma term for variables that are independent, root causes; as opposed to y's, which are dependent output(s) of a process. Six Sigma works on measuring and improving x's, to see subsequent improvement in y's. Also see “y=f(x)”. X-Bar Chart ( ) An “averages” chart, also called the “between” chart because the points represent variation between groups; this control chart examines the average of samples in a subgroup. Also see “Control Chart Examples”. y The output of a process (output(s) of individual process steps/tasks are identified using the lower-case “y”). y = f(x) Function used to describe a process whereby x’s represent all the input(s) to a process (factors) and y represents the output of the process (response). Yamazumi board Cycle time mapping process to identify value-added and non-value added activities. Yamazumi charts A Yamazumi chart is a stacked bar chart that shows the balance of cycle time workloads between a number of operators typically in an assembly line or work cell. The Yamazumi chart can be either for a single product or multi product assembly line. Yamazumi is a Japanese word that literally means to stack up. Shows the planned cycle times for each process. Also see “Yamazumi Chart Example”. Yokaten Across everywhere. Plant related activities and/or countermeasures that are communicated plant wide and with other company affiliates. Zero Defects Proposed by Philip Crosby as part of the book 'Quality is Free', is a business practice which aims to reduce and minimize the number of defects and errors in a process and to do things right the first time. States that if people commit themselves to watching details and avoiding errors, they can move closer to the goal of zero defects.
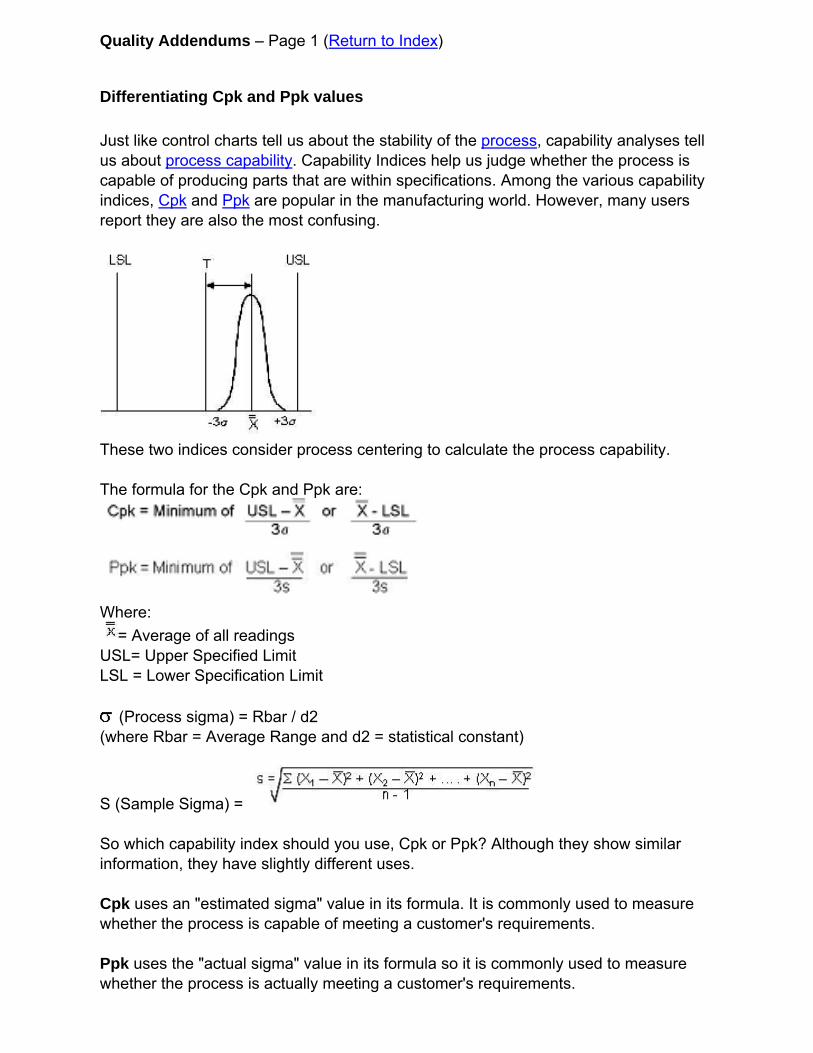
Quality Addendums – Page 1 (Return to Index)
Differentiating Cpk and Ppk values Just like control charts tell us about the stability of the process, capability analyses tell us about process capability. Capability Indices help us judge whether the process is capable of producing parts that are within specifications. Among the various capability indices, Cpk and Ppk are popular in the manufacturing world. However, many users report they are also the most confusing.
These two indices consider process centering to calculate the process capability. The formula for the Cpk and Ppk are:
Where:
= Average of all readings USL= Upper Specified Limit LSL = Lower Specification Limit
(Process sigma) = Rbar / d2 (where Rbar = Average Range and d2 = statistical constant)
S (Sample Sigma) = So which capability index should you use, Cpk or Ppk? Although they show similar information, they have slightly different uses. Cpk uses an "estimated sigma" value in its formula. It is commonly used to measure whether the process is capable of meeting a customer's requirements. Ppk uses the "actual sigma" value in its formula so it is commonly used to measure whether the process is actually meeting a customer's requirements.
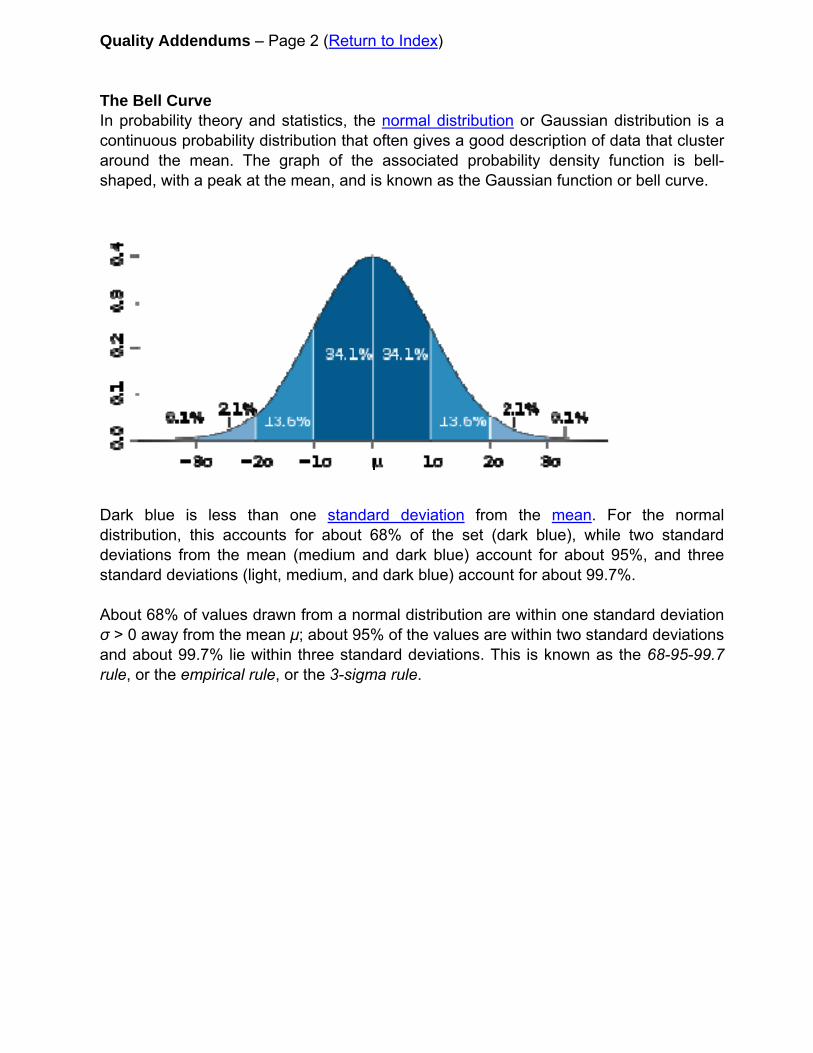
Quality Addendums – Page 2 (Return to Index) The Bell Curve In probability theory and statistics, the normal distribution or Gaussian distribution is a continuous probability distribution that often gives a good description of data that cluster around the mean. The graph of the associated probability density function is bell-shaped, with a peak at the mean, and is known as the Gaussian function or bell curve.
Dark blue is less than one standard deviation from the mean. For the normal distribution, this accounts for about 68% of the set (dark blue), while two standard deviations from the mean (medium and dark blue) account for about 95%, and three standard deviations (light, medium, and dark blue) account for about 99.7%. About 68% of values drawn from a normal distribution are within one standard deviation σ > 0 away from the mean μ; about 95% of the values are within two standard deviations and about 99.7% lie within three standard deviations. This is known as the 68-95-99.7 rule, or the empirical rule, or the 3-sigma rule.
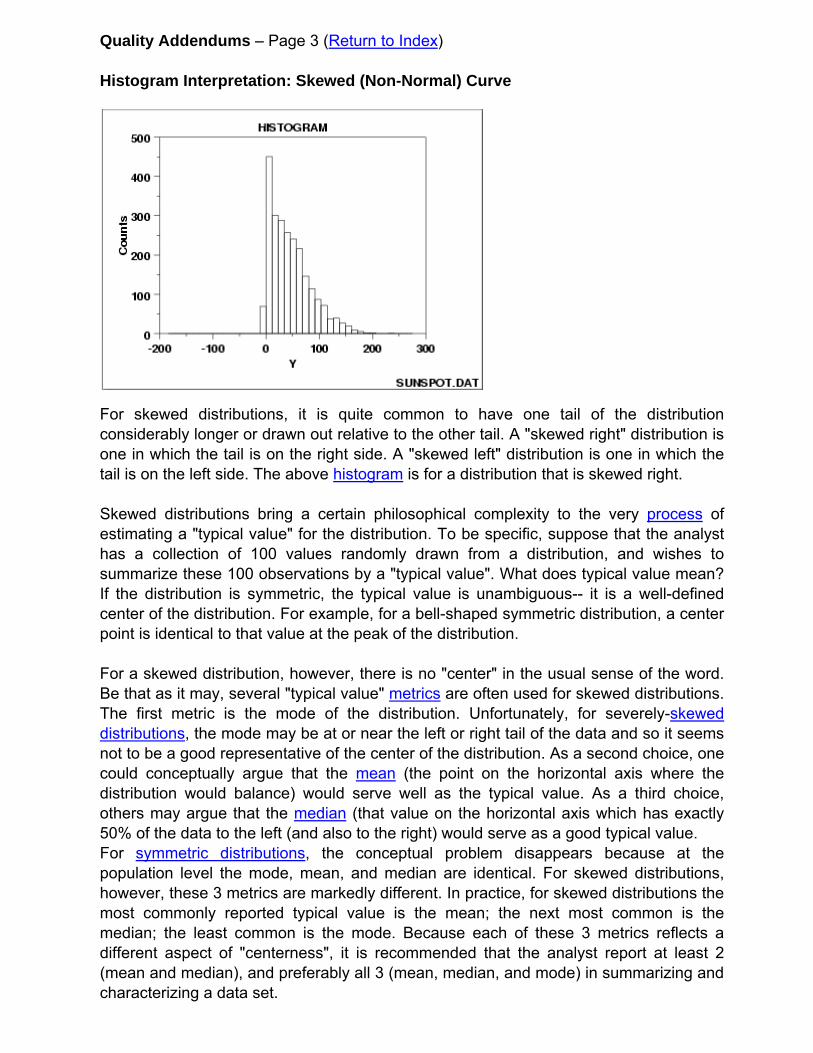
Quality Addendums – Page 3 (Return to Index) Histogram Interpretation: Skewed (Non-Normal) Curve
For skewed distributions, it is quite common to have one tail of the distribution considerably longer or drawn out relative to the other tail. A "skewed right" distribution is one in which the tail is on the right side. A "skewed left" distribution is one in which the tail is on the left side. The above histogram is for a distribution that is skewed right. Skewed distributions bring a certain philosophical complexity to the very process of estimating a "typical value" for the distribution. To be specific, suppose that the analyst has a collection of 100 values randomly drawn from a distribution, and wishes to summarize these 100 observations by a "typical value". What does typical value mean? If the distribution is symmetric, the typical value is unambiguous-- it is a well-defined center of the distribution. For example, for a bell-shaped symmetric distribution, a center point is identical to that value at the peak of the distribution. For a skewed distribution, however, there is no "center" in the usual sense of the word. Be that as it may, several "typical value" metrics are often used for skewed distributions. The first metric is the mode of the distribution. Unfortunately, for severely-skewed distributions, the mode may be at or near the left or right tail of the data and so it seems not to be a good representative of the center of the distribution. As a second choice, one could conceptually argue that the mean (the point on the horizontal axis where the distribution would balance) would serve well as the typical value. As a third choice, others may argue that the median (that value on the horizontal axis which has exactly 50% of the data to the left (and also to the right) would serve as a good typical value. For symmetric distributions, the conceptual problem disappears because at the population level the mode, mean, and median are identical. For skewed distributions, however, these 3 metrics are markedly different. In practice, for skewed distributions the most commonly reported typical value is the mean; the next most common is the median; the least common is the mode. Because each of these 3 metrics reflects a different aspect of "centerness", it is recommended that the analyst report at least 2 (mean and median), and preferably all 3 (mean, median, and mode) in summarizing and characterizing a data set.
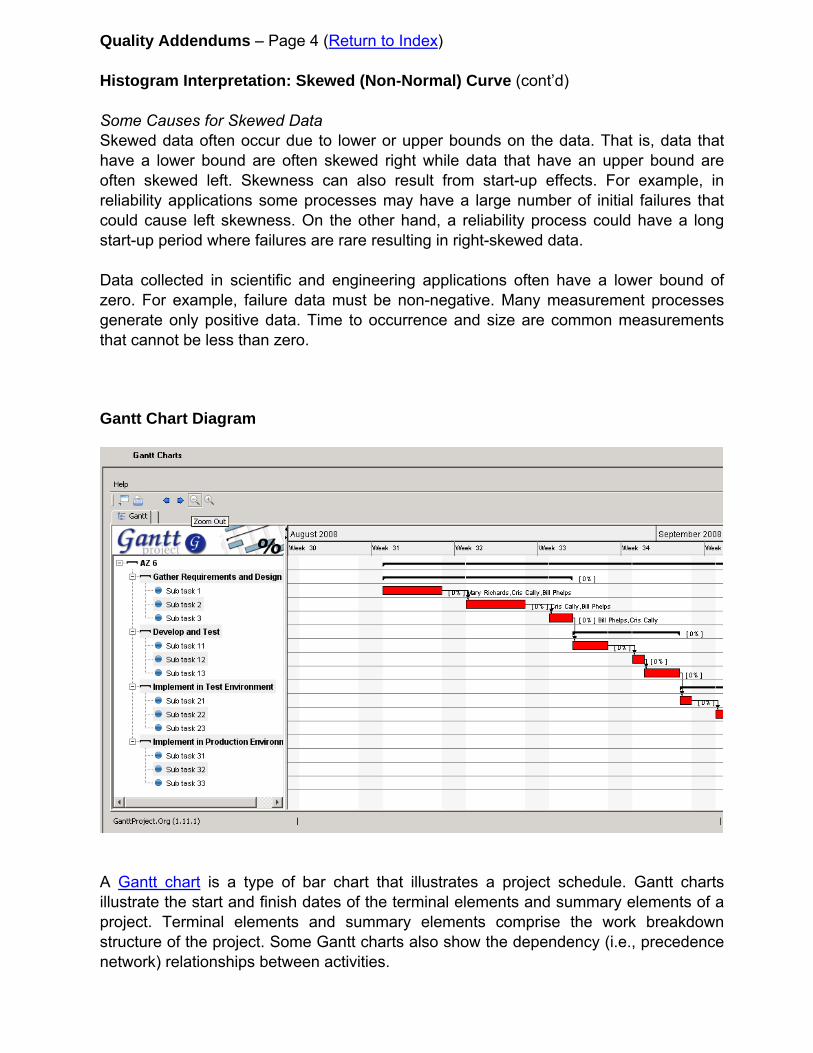
Quality Addendums – Page 4 (Return to Index) Histogram Interpretation: Skewed (Non-Normal) Curve (cont’d) Some Causes for Skewed Data Skewed data often occur due to lower or upper bounds on the data. That is, data that have a lower bound are often skewed right while data that have an upper bound are often skewed left. Skewness can also result from start-up effects. For example, in reliability applications some processes may have a large number of initial failures that could cause left skewness. On the other hand, a reliability process could have a long start-up period where failures are rare resulting in right-skewed data. Data collected in scientific and engineering applications often have a lower bound of zero. For example, failure data must be non-negative. Many measurement processes generate only positive data. Time to occurrence and size are common measurements that cannot be less than zero.
Gantt Chart Diagram
A Gantt chart is a type of bar chart that illustrates a project schedule. Gantt charts illustrate the start and finish dates of the terminal elements and summary elements of a project. Terminal elements and summary elements comprise the work breakdown structure of the project. Some Gantt charts also show the dependency (i.e., precedence network) relationships between activities.
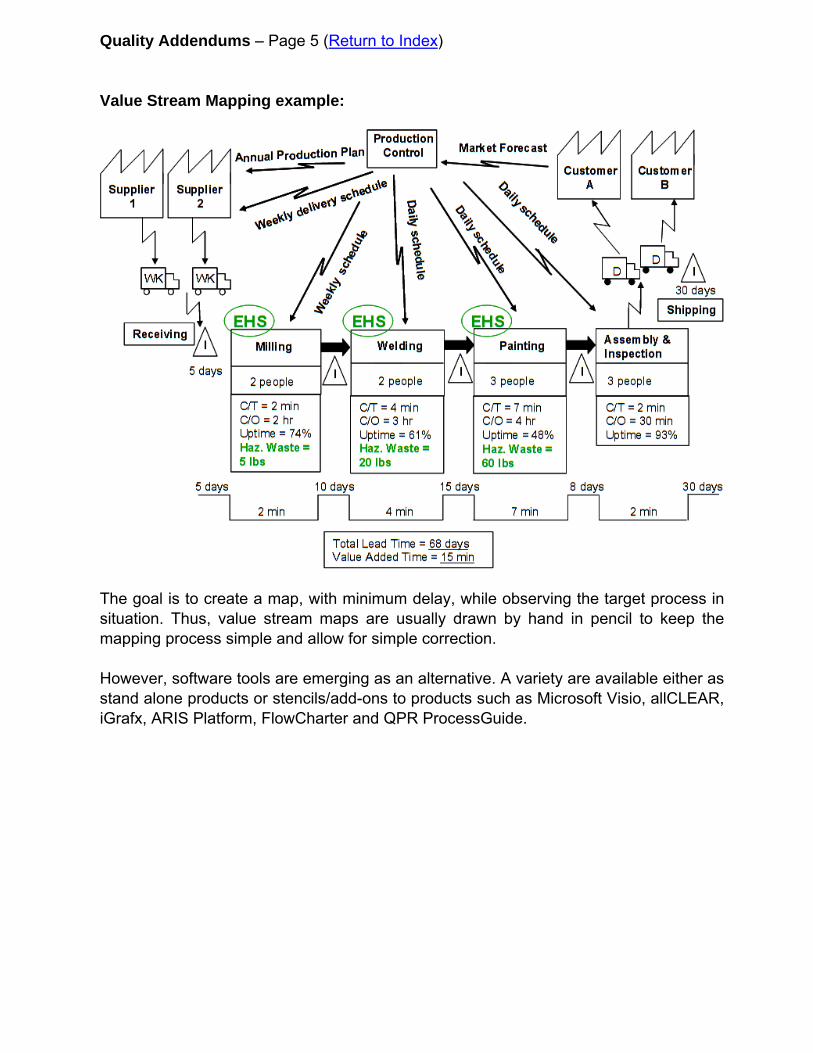
Quality Addendums – Page 5 (Return to Index) Value Stream Mapping example:
The goal is to create a map, with minimum delay, while observing the target process in situation. Thus, value stream maps are usually drawn by hand in pencil to keep the mapping process simple and allow for simple correction. However, software tools are emerging as an alternative. A variety are available either as stand alone products or stencils/add-ons to products such as Microsoft Visio, allCLEAR, iGrafx, ARIS Platform, FlowCharter and QPR ProcessGuide.
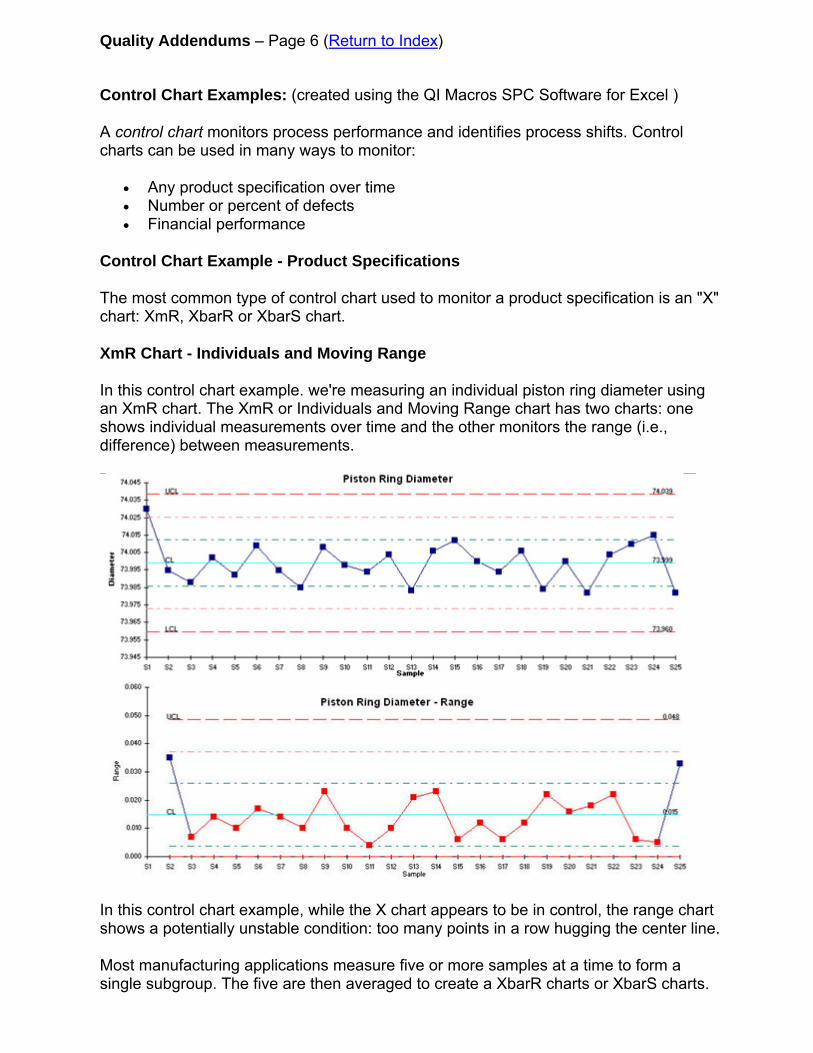
Quality Addendums – Page 6 (Return to Index)
Control Chart Examples: (created using the QI Macros SPC Software for Excel )
A control chart monitors process performance and identifies process shifts. Control charts can be used in many ways to monitor:
• Any product specification over time • Number or percent of defects • Financial performance
Control Chart Example - Product Specifications
The most common type of control chart used to monitor a product specification is an "X" chart: XmR, XbarR or XbarS chart.
XmR Chart - Individuals and Moving Range
In this control chart example. we're measuring an individual piston ring diameter using an XmR chart. The XmR or Individuals and Moving Range chart has two charts: one shows individual measurements over time and the other monitors the range (i.e., difference) between measurements.
In this control chart example, while the X chart appears to be in control, the range chart shows a potentially unstable condition: too many points in a row hugging the center line.
Most manufacturing applications measure five or more samples at a time to form a single subgroup. The five are then averaged to create a XbarR charts or XbarS charts.
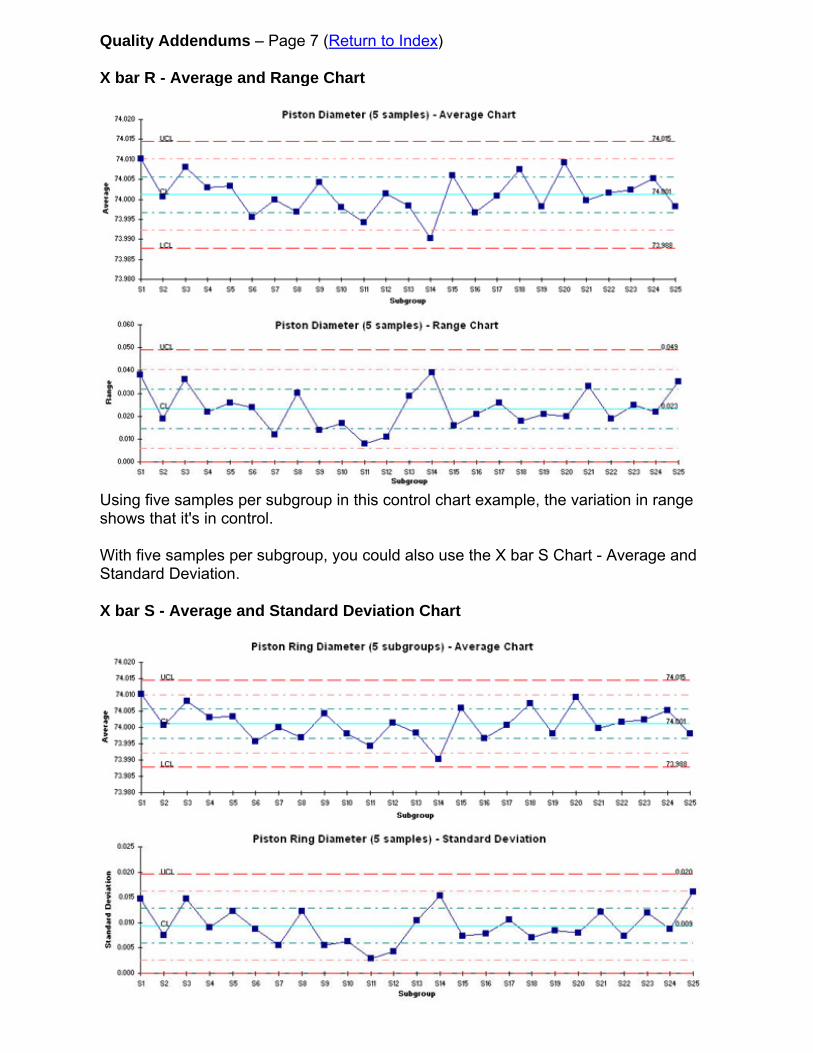
Quality Addendums – Page 7 (Return to Index)
X bar R - Average and Range Chart
Using five samples per subgroup in this control chart example, the variation in range shows that it's in control.
With five samples per subgroup, you could also use the X bar S Chart - Average and Standard Deviation.
X bar S - Average and Standard Deviation Chart
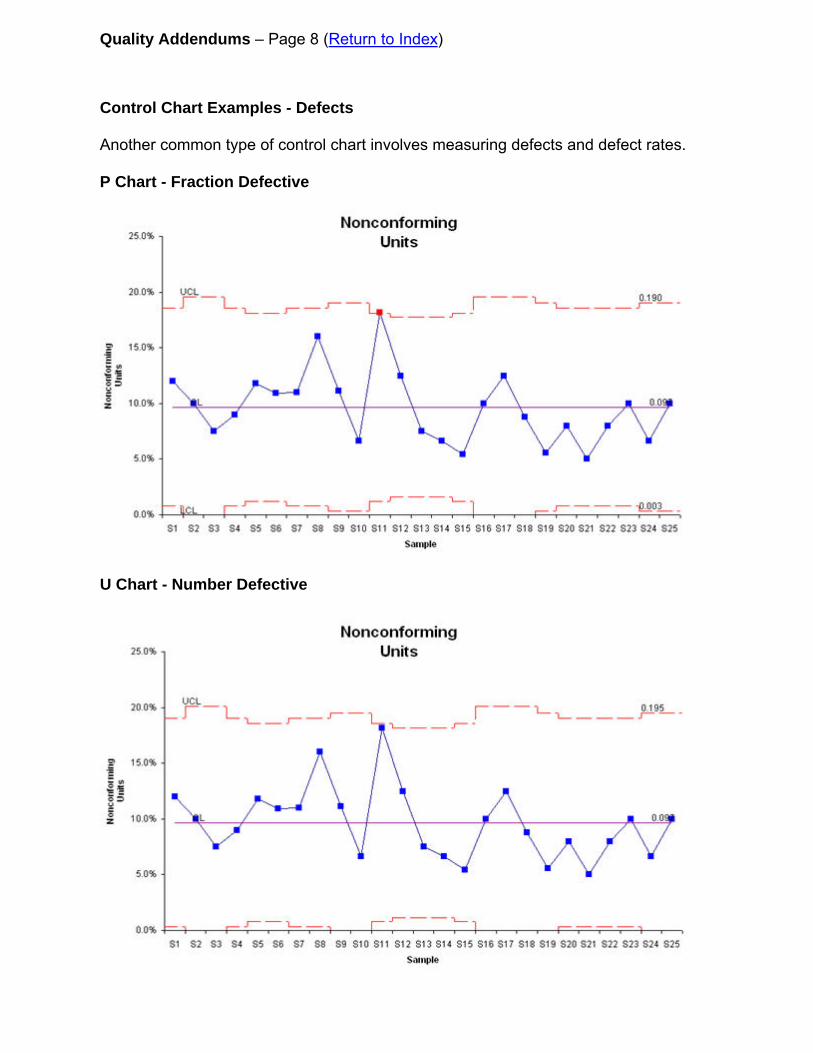
Quality Addendums – Page 8 (Return to Index)
Control Chart Examples - Defects
Another common type of control chart involves measuring defects and defect rates.
P Chart - Fraction Defective
U Chart - Number Defective
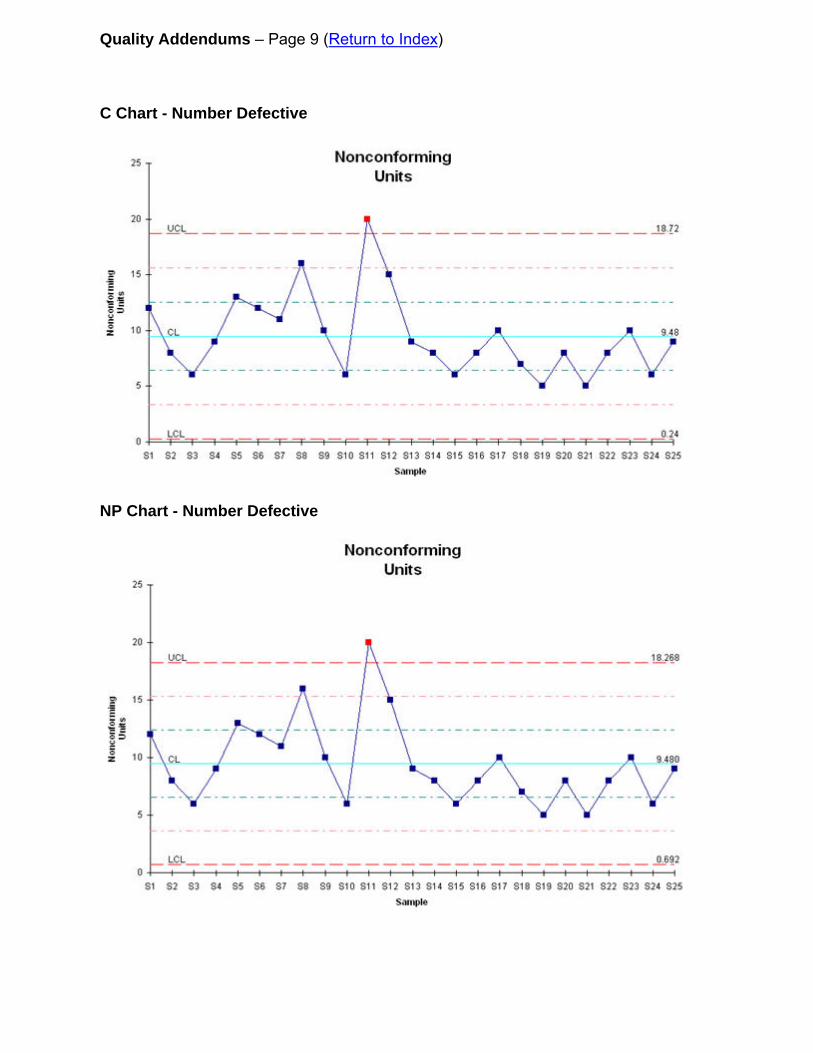
Quality Addendums – Page 9 (Return to Index)
C Chart - Number Defective
NP Chart - Number Defective
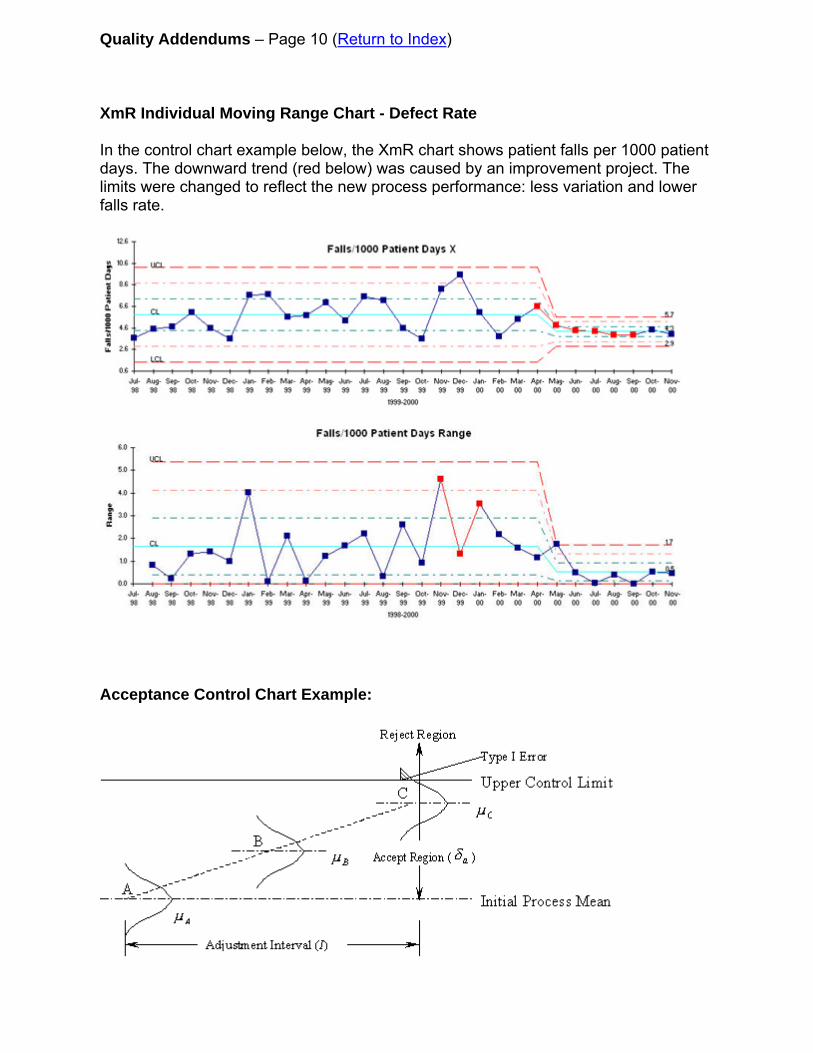
Quality Addendums – Page 10 (Return to Index)
XmR Individual Moving Range Chart - Defect Rate
In the control chart example below, the XmR chart shows patient falls per 1000 patient days. The downward trend (red below) was caused by an improvement project. The limits were changed to reflect the new process performance: less variation and lower falls rate.
Acceptance Control Chart Example:
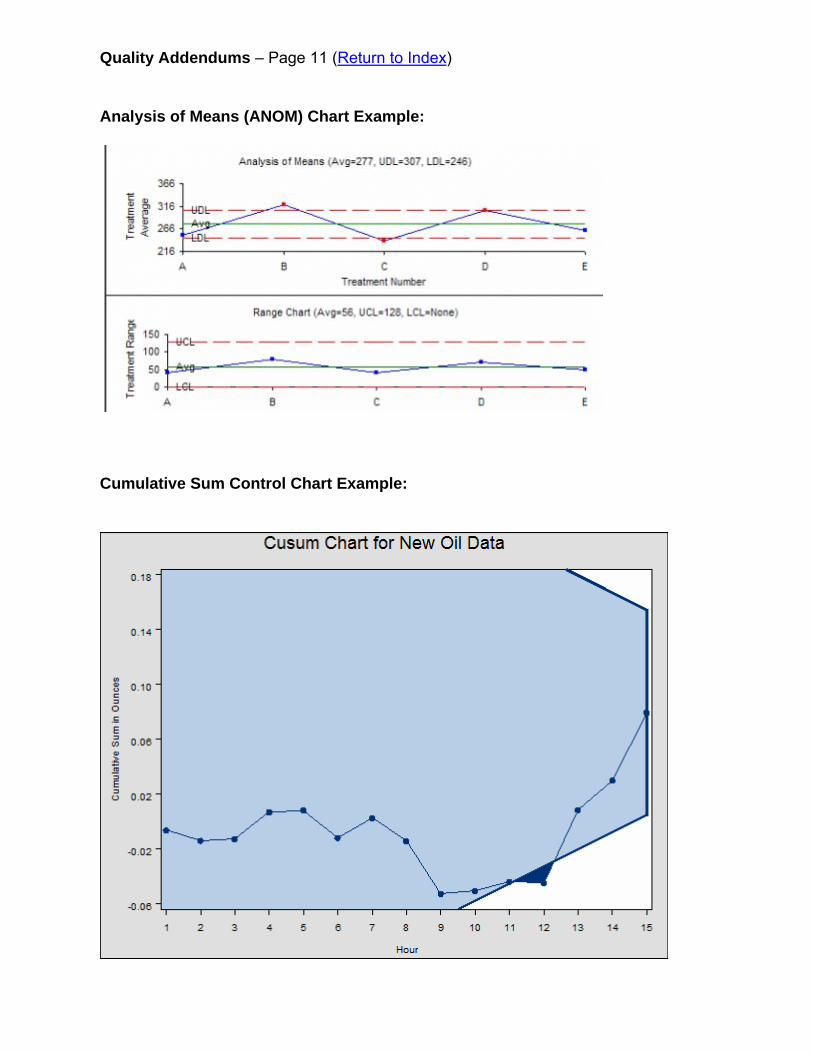
Quality Addendums – Page 11 (Return to Index)
Analysis of Means (ANOM) Chart Example:
Cumulative Sum Control Chart Example:
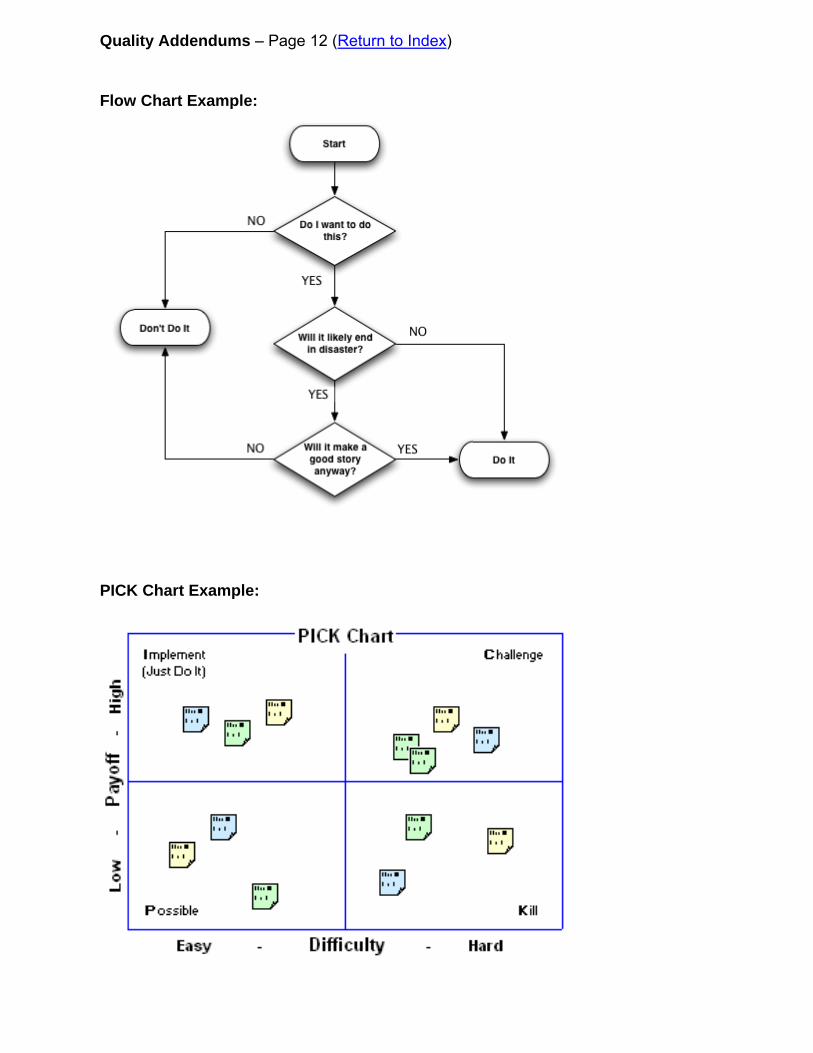
Quality Addendums – Page 12 (Return to Index) Flow Chart Example:
PICK Chart Example:
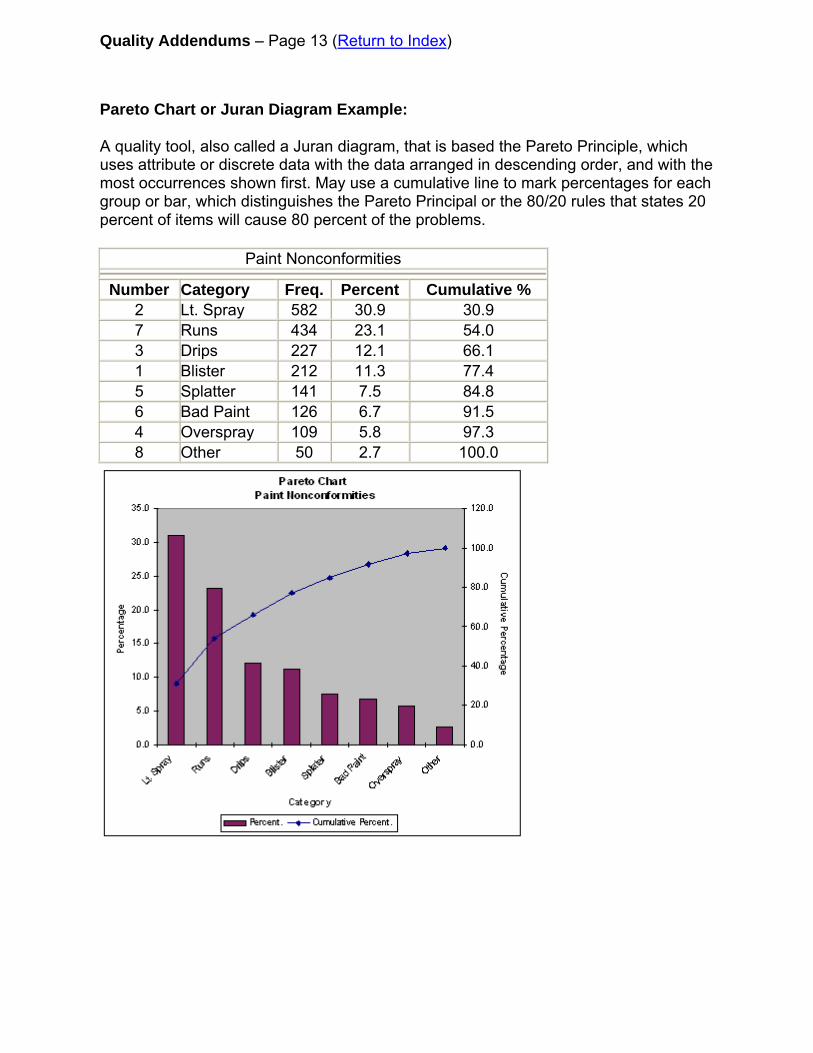
Quality Addendums – Page 13 (Return to Index)
Pareto Chart or Juran Diagram Example:
A quality tool, also called a Juran diagram, that is based the Pareto Principle, which uses attribute or discrete data with the data arranged in descending order, and with the most occurrences shown first. May use a cumulative line to mark percentages for each group or bar, which distinguishes the Pareto Principal or the 80/20 rules that states 20 percent of items will cause 80 percent of the problems.
Paint Nonconformities
Number Category Freq. Percent Cumulative %2 Lt. Spray 582 30.9 30.97 Runs 434 23.1 54.03 Drips 227 12.1 66.11 Blister 212 11.3 77.45 Splatter 141 7.5 84.86 Bad Paint 126 6.7 91.54 Overspray 109 5.8 97.38 Other 50 2.7 100.0
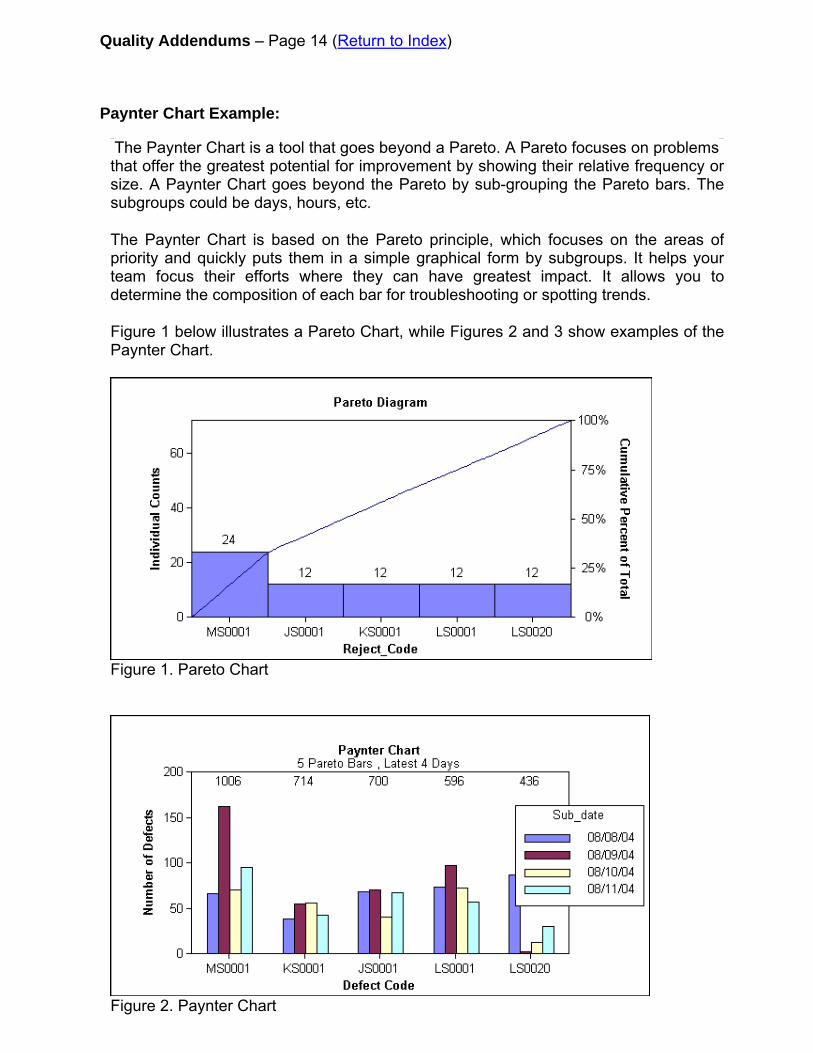
Quality Addendums – Page 14 (Return to Index)
Paynter Chart Example:
The Paynter Chart is a tool that goes beyond a Pareto. A Pareto focuses on problems that offer the greatest potential for improvement by showing their relative frequency orsize. A Paynter Chart goes beyond the Pareto by sub-grouping the Pareto bars. The subgroups could be days, hours, etc.
The Paynter Chart is based on the Pareto principle, which focuses on the areas ofpriority and quickly puts them in a simple graphical form by subgroups. It helps yourteam focus their efforts where they can have greatest impact. It allows you todetermine the composition of each bar for troubleshooting or spotting trends.
Figure 1 below illustrates a Pareto Chart, while Figures 2 and 3 show examples of thePaynter Chart.
Figure 1. Pareto Chart
Figure 2. Paynter Chart

Quality Addendums – Page 15 (Return to Index) Paynter Chart Example: (cont’d)
This Paynter was run by restricting the number of groups to 5 and the number of subgroups to 4. In this case it took the last 4 subgroups to plot.
Notice, also that the number at the top of the group is the total defects for that group, but is not the sum of the subgroups shown.
Figure 3. Paynter Chart
This chart illustrates 5 defect codes with 4 subgroups where the subgroups plotted are those with the largest number of defects for the defect codes plotted. Run Chart Example:
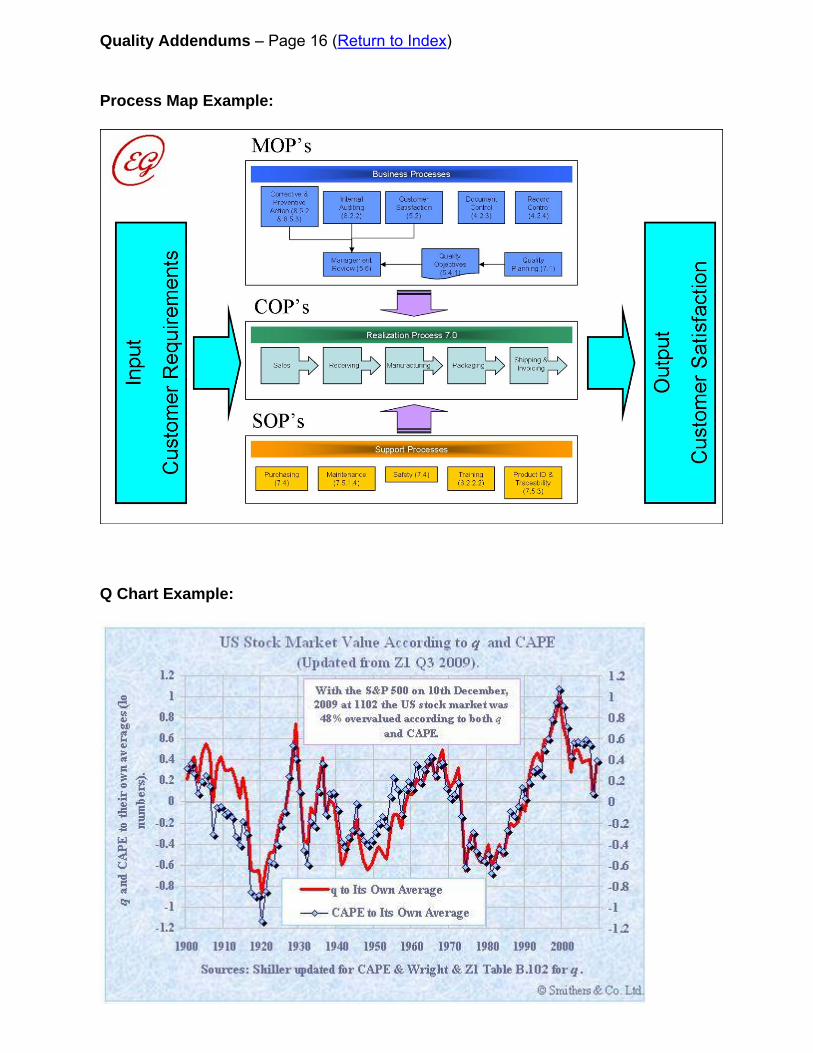
Quality Addendums – Page 16 (Return to Index) Process Map Example:
Q Chart Example:
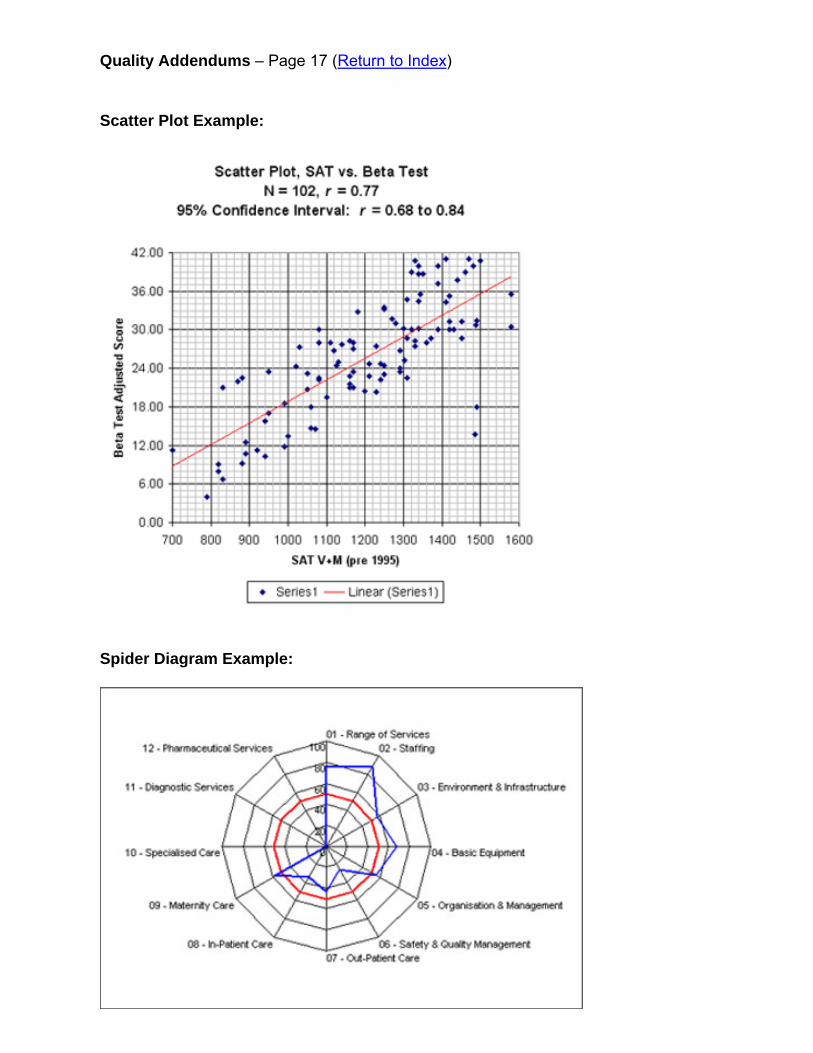
Quality Addendums – Page 17 (Return to Index) Scatter Plot Example:
Spider Diagram Example:
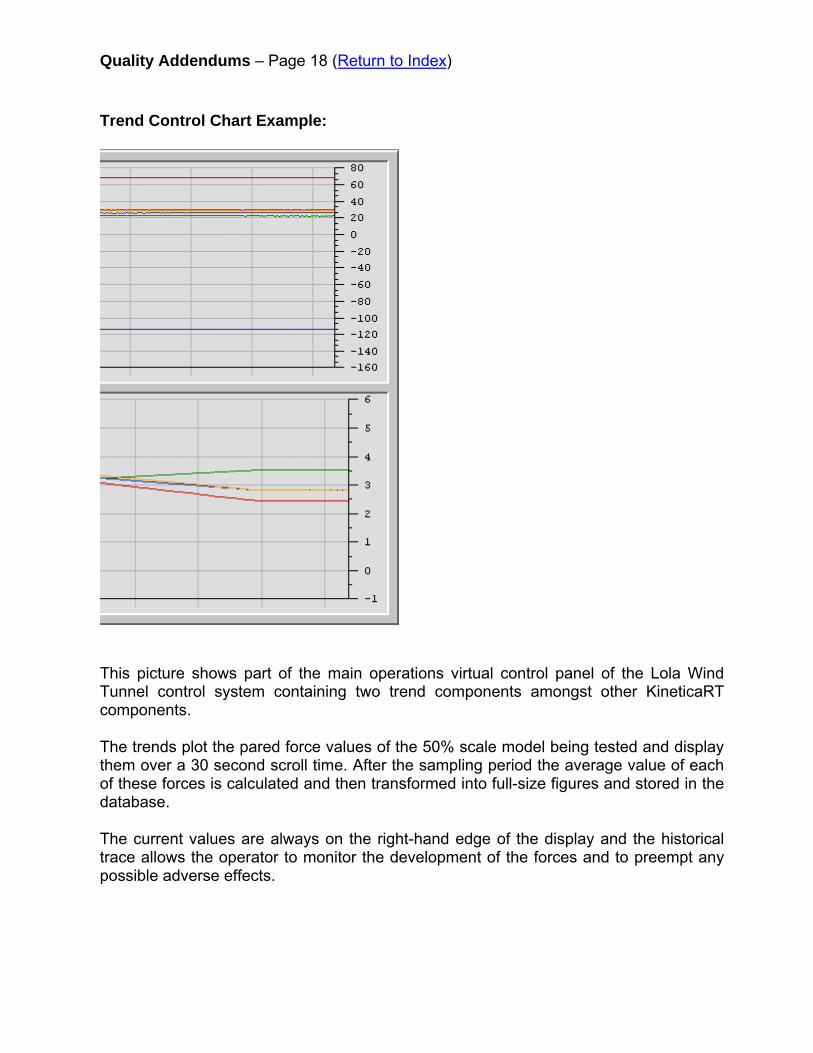
Quality Addendums – Page 18 (Return to Index) Trend Control Chart Example:
This picture shows part of the main operations virtual control panel of the Lola Wind Tunnel control system containing two trend components amongst other KineticaRT components.
The trends plot the pared force values of the 50% scale model being tested and display them over a 30 second scroll time. After the sampling period the average value of each of these forces is calculated and then transformed into full-size figures and stored in the database.
The current values are always on the right-hand edge of the display and the historical trace allows the operator to monitor the development of the forces and to preempt any possible adverse effects.
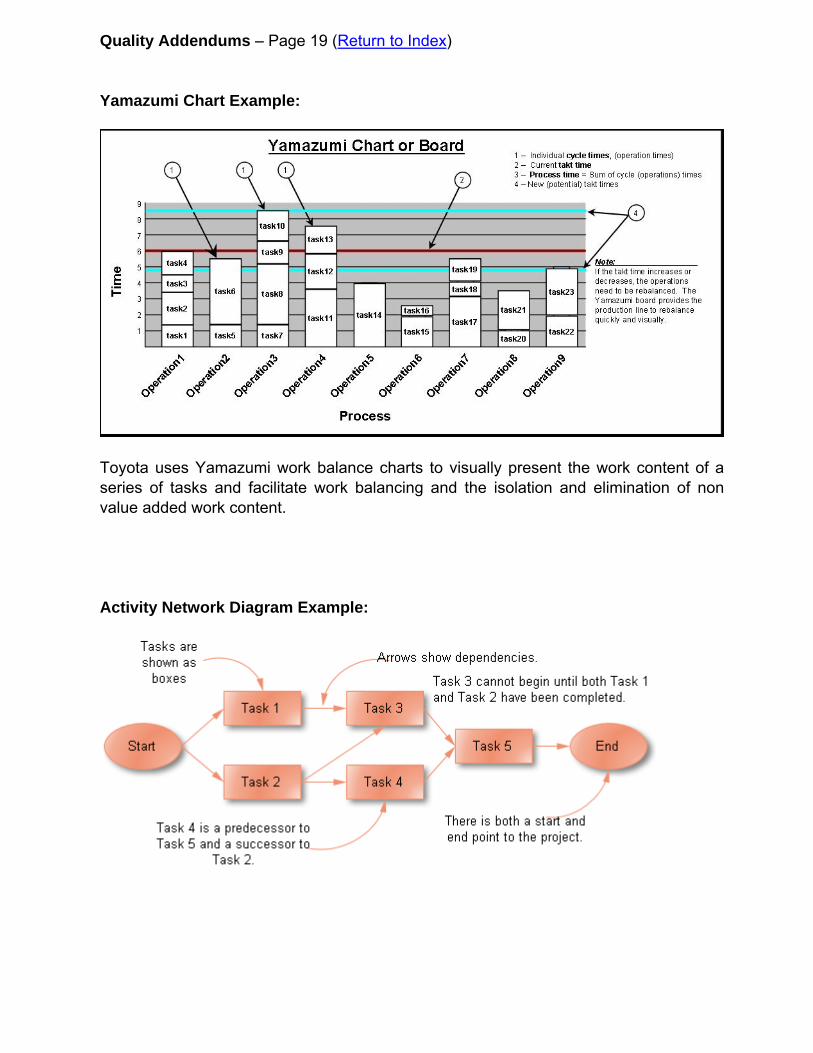
Quality Addendums – Page 19 (Return to Index) Yamazumi Chart Example:
Toyota uses Yamazumi work balance charts to visually present the work content of a series of tasks and facilitate work balancing and the isolation and elimination of non value added work content. Activity Network Diagram Example:
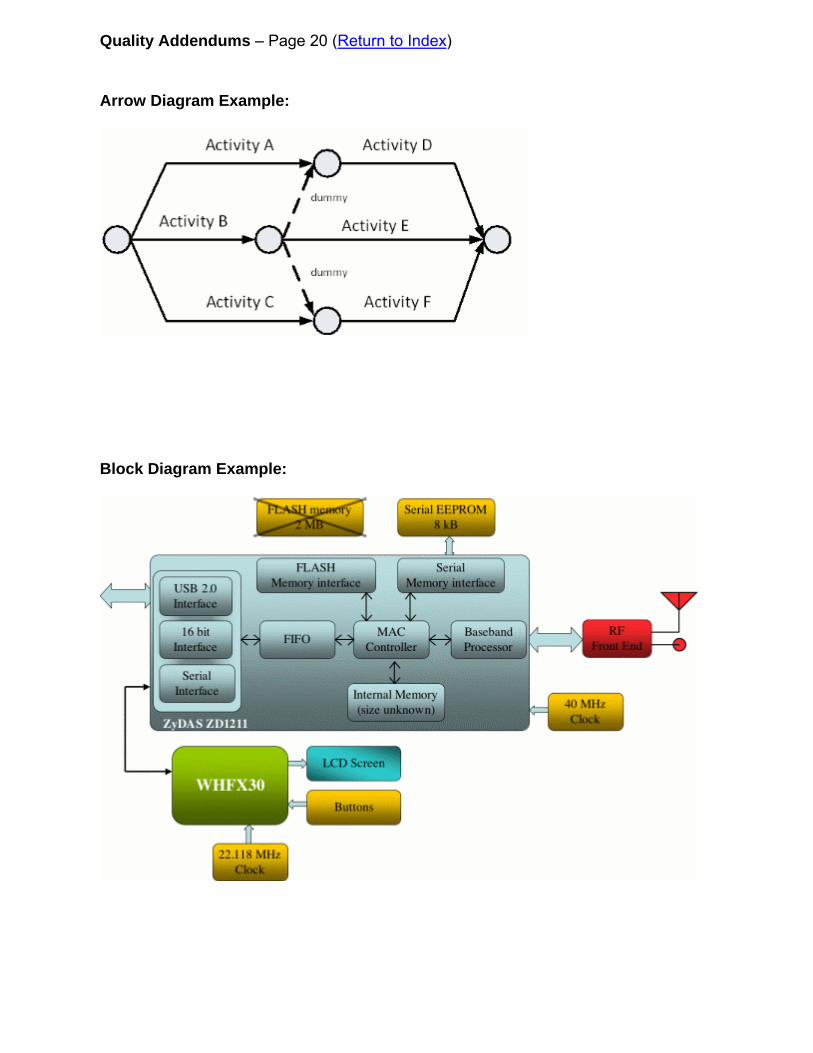
Quality Addendums – Page 20 (Return to Index) Arrow Diagram Example:
Block Diagram Example:
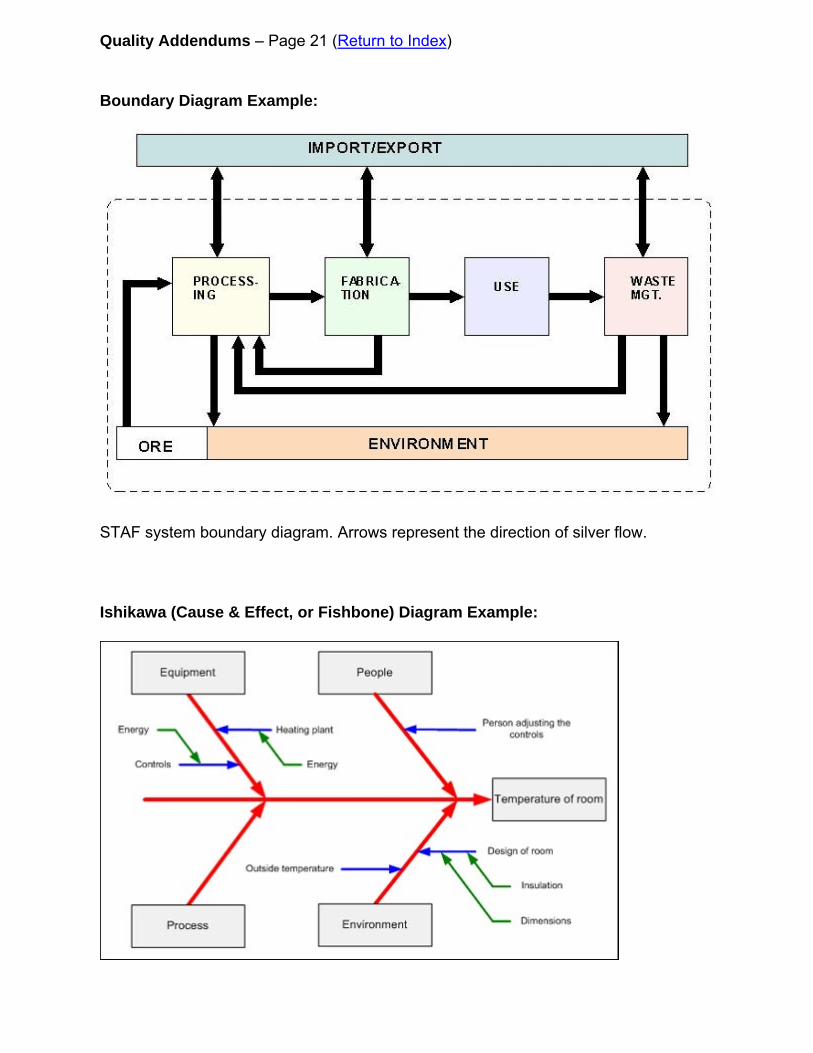
Quality Addendums – Page 21 (Return to Index) Boundary Diagram Example:
TAF system boundary diagram. Arrows represent the direction of silver flow.
hikawa (Cause & Effect, or Fishbone) Diagram Example:
S Is
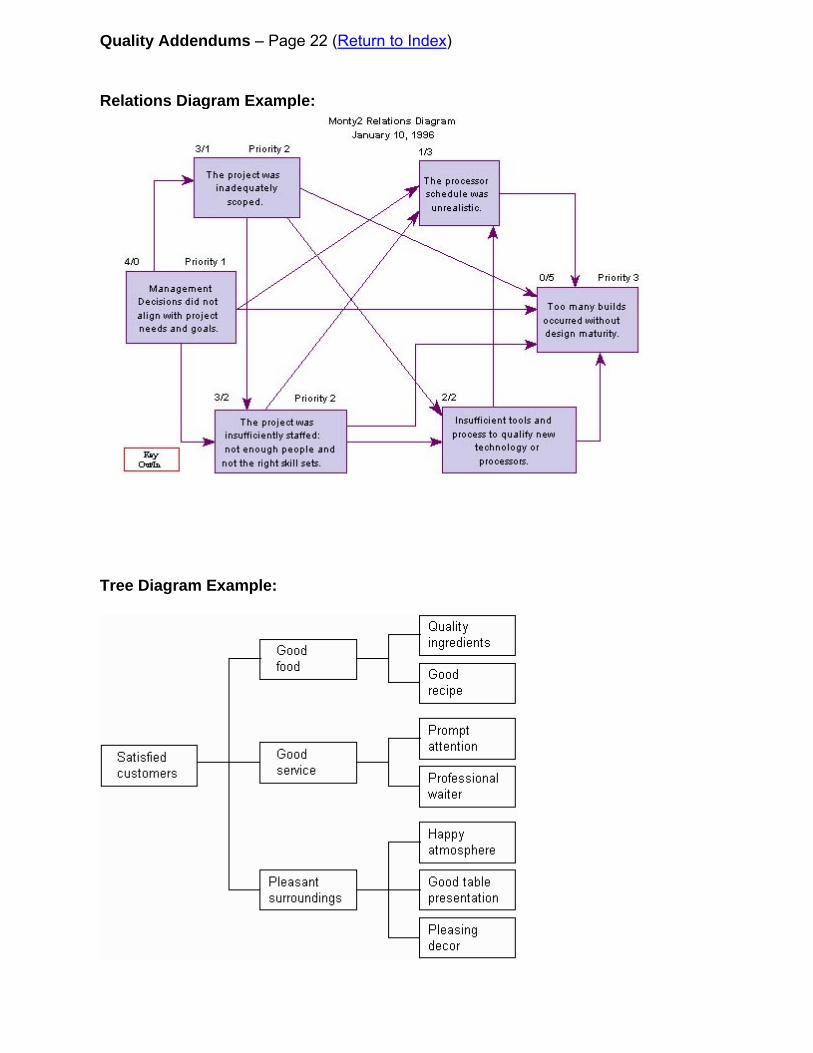
Quality Addendums – Page 22 (Return to Index) Relations Diagram Example:
Tree Diagram Example:
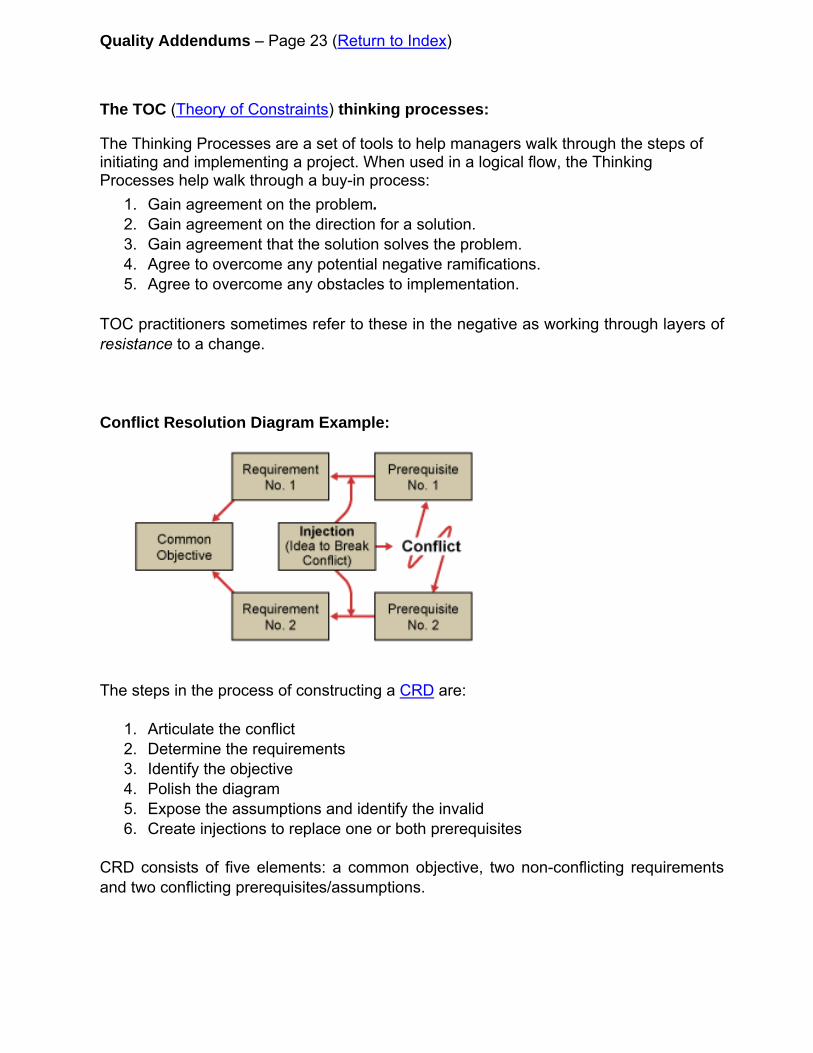
Quality Addendums – Page 23 (Return to Index)
The TOC (Theory of Constraints) thinking processes:
The Thinking Processes are a set of tools to help managers walk through the steps of initiating and implementing a project. When used in a logical flow, the Thinking Processes help walk through a buy-in process:
1. Gain agreement on the problem. 2. Gain agreement on the direction for a solution. 3. Gain agreement that the solution solves the problem. 4. Agree to overcome any potential negative ramifications. 5. Agree to overcome any obstacles to implementation.
TOC practitioners sometimes refer to these in the negative as working through layers of resistance to a change.
Conflict Resolution Diagram Example:
The steps in the process of constructing a CRD are:
1. Articulate the conflict 2. Determine the requirements 3. Identify the objective 4. Polish the diagram 5. Expose the assumptions and identify the invalid 6. Create injections to replace one or both prerequisites
CRD consists of five elements: a common objective, two non-conflicting requirements and two conflicting prerequisites/assumptions.
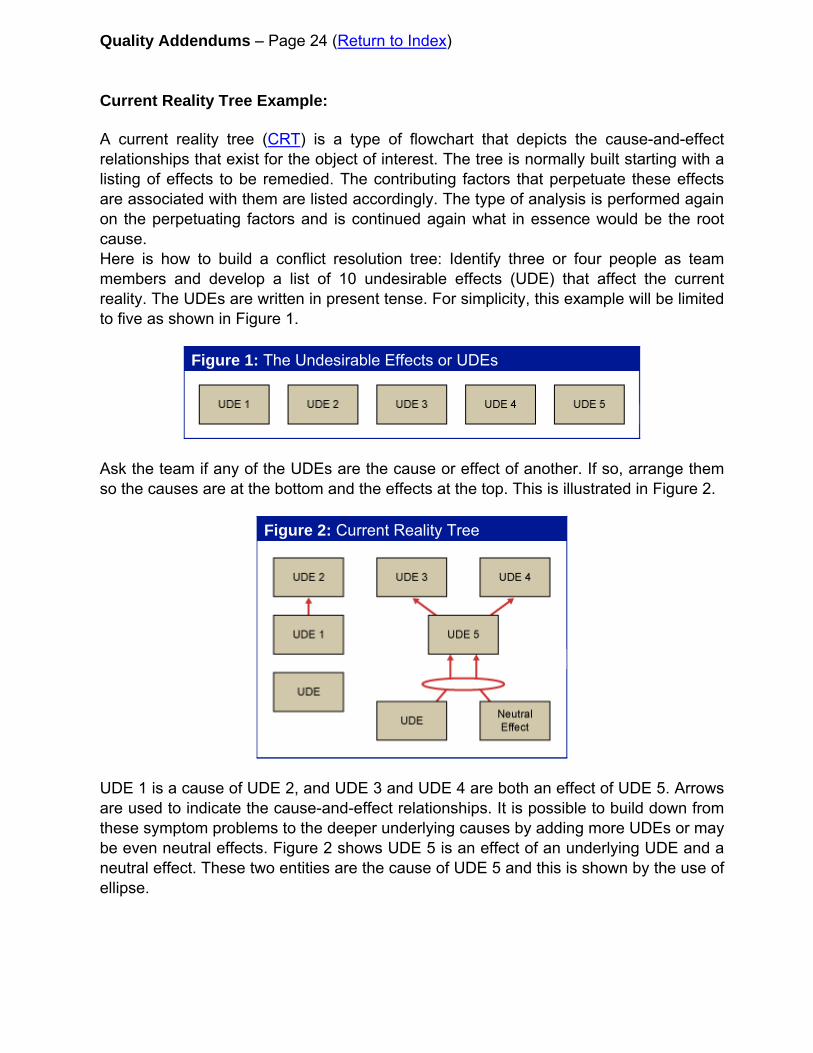
Quality Addendums – Page 24 (Return to Index) Current Reality Tree Example:
A current reality tree (CRT) is a type of flowchart that depicts the cause-and-effect relationships that exist for the object of interest. The tree is normally built starting with a listing of effects to be remedied. The contributing factors that perpetuate these effects are associated with them are listed accordingly. The type of analysis is performed again on the perpetuating factors and is continued again what in essence would be the root cause. Here is how to build a conflict resolution tree: Identify three or four people as team members and develop a list of 10 undesirable effects (UDE) that affect the current reality. The UDEs are written in present tense. For simplicity, this example will be limited to five as shown in Figure 1.
Figure 1: The Undesirable Effects or UDEs
Ask the team if any of the UDEs are the cause or effect of another. If so, arrange them so the causes are at the bottom and the effects at the top. This is illustrated in Figure 2.
Figure 2: Current Reality Tree
UDE 1 is a cause of UDE 2, and UDE 3 and UDE 4 are both an effect of UDE 5. Arrows are used to indicate the cause-and-effect relationships. It is possible to build down from these symptom problems to the deeper underlying causes by adding more UDEs or may be even neutral effects. Figure 2 shows UDE 5 is an effect of an underlying UDE and a neutral effect. These two entities are the cause of UDE 5 and this is shown by the use of ellipse.
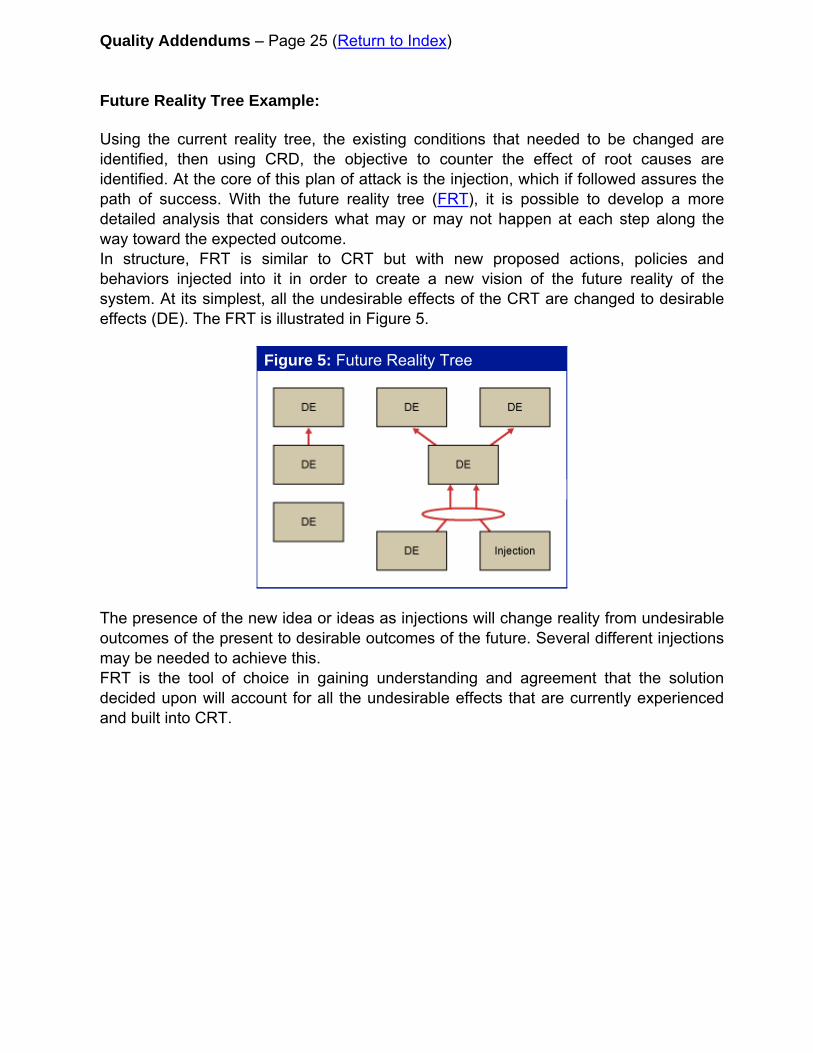
Quality Addendums – Page 25 (Return to Index) Future Reality Tree Example:
Using the current reality tree, the existing conditions that needed to be changed are identified, then using CRD, the objective to counter the effect of root causes are identified. At the core of this plan of attack is the injection, which if followed assures the path of success. With the future reality tree (FRT), it is possible to develop a more detailed analysis that considers what may or may not happen at each step along the way toward the expected outcome. In structure, FRT is similar to CRT but with new proposed actions, policies and behaviors injected into it in order to create a new vision of the future reality of the system. At its simplest, all the undesirable effects of the CRT are changed to desirable effects (DE). The FRT is illustrated in Figure 5.
Figure 5: Future Reality Tree
The presence of the new idea or ideas as injections will change reality from undesirable outcomes of the present to desirable outcomes of the future. Several different injections may be needed to achieve this. FRT is the tool of choice in gaining understanding and agreement that the solution decided upon will account for all the undesirable effects that are currently experienced and built into CRT.
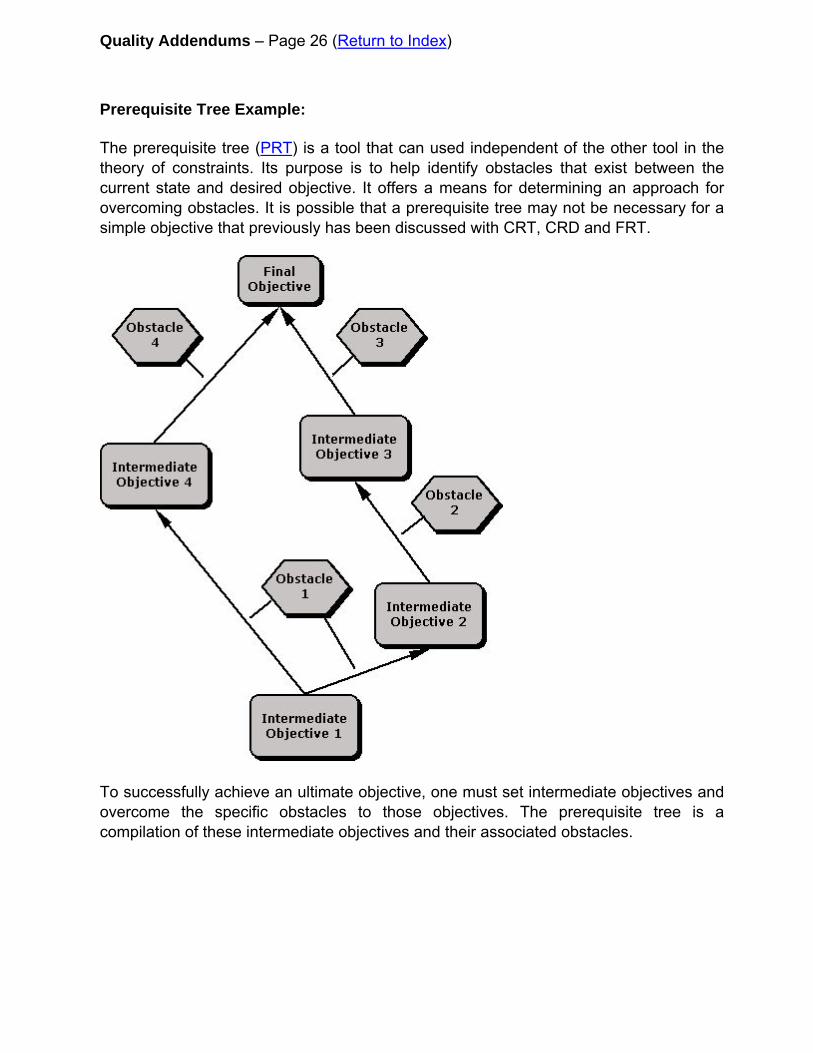
Quality Addendums – Page 26 (Return to Index)
Prerequisite Tree Example:
The prerequisite tree (PRT) is a tool that can used independent of the other tool in the theory of constraints. Its purpose is to help identify obstacles that exist between the current state and desired objective. It offers a means for determining an approach for overcoming obstacles. It is possible that a prerequisite tree may not be necessary for a simple objective that previously has been discussed with CRT, CRD and FRT.
To successfully achieve an ultimate objective, one must set intermediate objectives and overcome the specific obstacles to those objectives. The prerequisite tree is a compilation of these intermediate objectives and their associated obstacles.
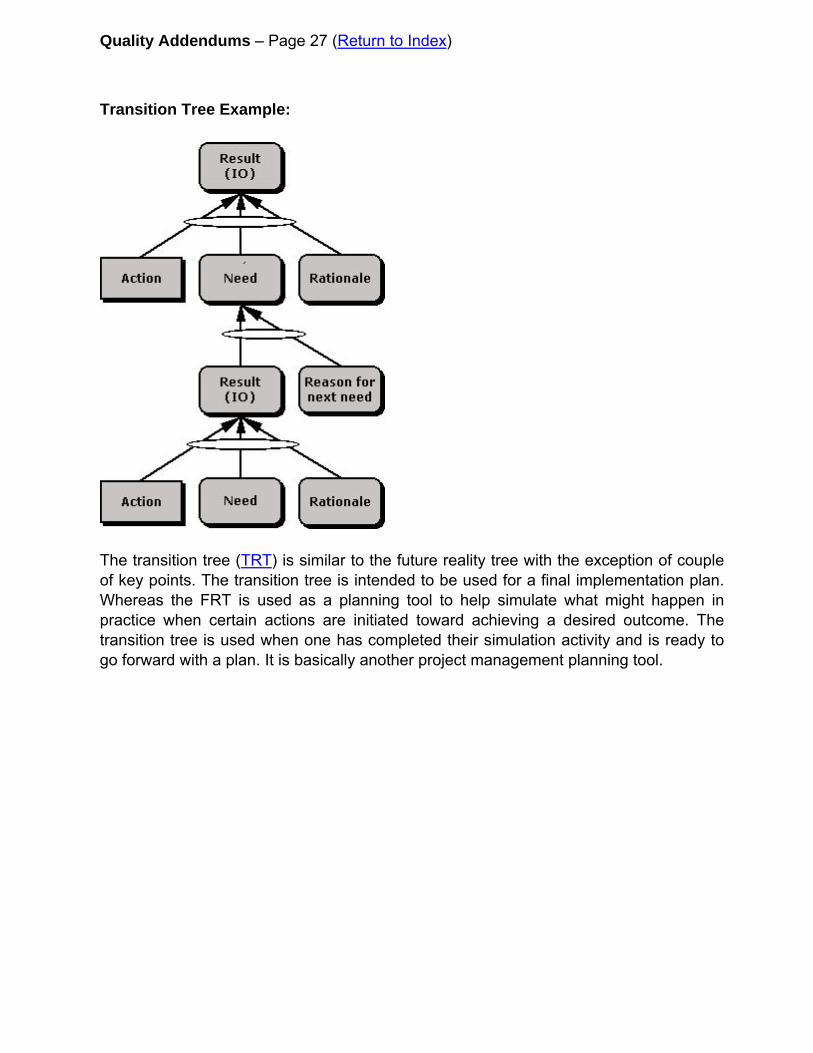
Quality Addendums – Page 27 (Return to Index)
Transition Tree Example:
The transition tree (TRT) is similar to the future reality tree with the exception of couple of key points. The transition tree is intended to be used for a final implementation plan. Whereas the FRT is used as a planning tool to help simulate what might happen in practice when certain actions are initiated toward achieving a desired outcome. The transition tree is used when one has completed their simulation activity and is ready to go forward with a plan. It is basically another project management planning tool.
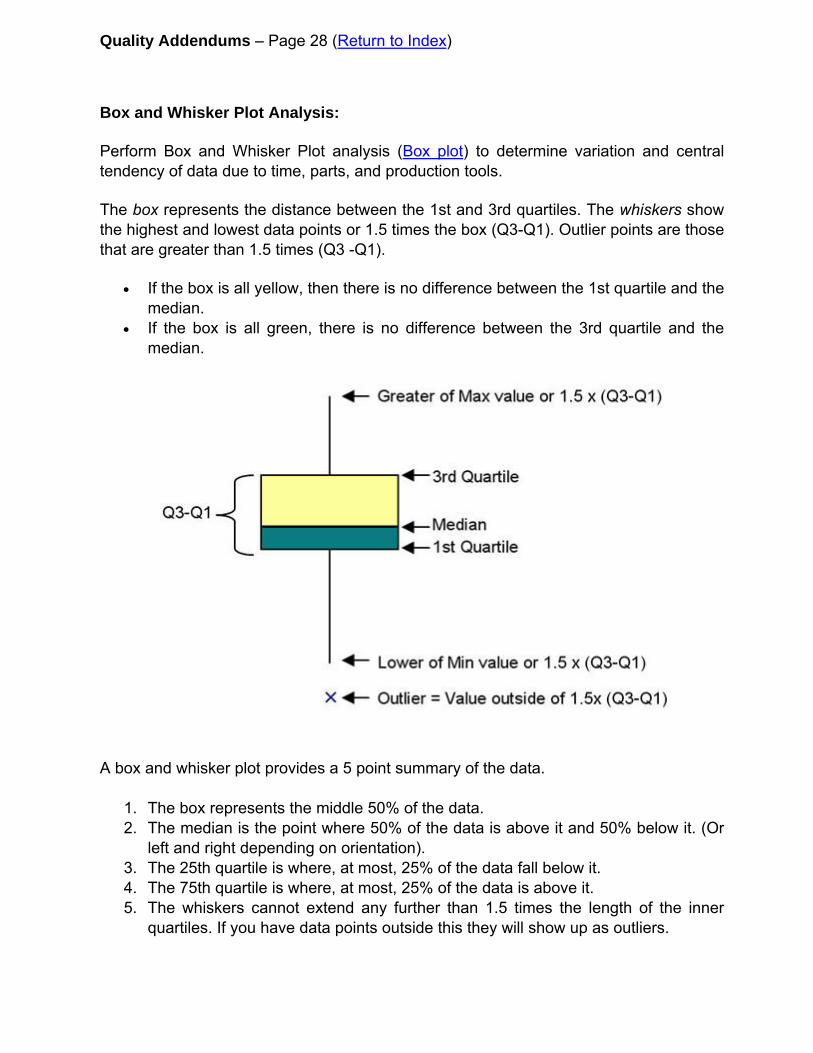
Quality Addendums – Page 28 (Return to Index)
Box and Whisker Plot Analysis:
Perform Box and Whisker Plot analysis (Box plot) to determine variation and central tendency of data due to time, parts, and production tools.
The box represents the distance between the 1st and 3rd quartiles. The whiskers show the highest and lowest data points or 1.5 times the box (Q3-Q1). Outlier points are those that are greater than 1.5 times (Q3 -Q1).
• If the box is all yellow, then there is no difference between the 1st quartile and the median.
• If the box is all green, there is no difference between the 3rd quartile and the median.
A box and whisker plot provides a 5 point summary of the data.
1. The box represents the middle 50% of the data. 2. The median is the point where 50% of the data is above it and 50% below it. (Or
left and right depending on orientation). 3. The 25th quartile is where, at most, 25% of the data fall below it. 4. The 75th quartile is where, at most, 25% of the data is above it. 5. The whiskers cannot extend any further than 1.5 times the length of the inner
quartiles. If you have data points outside this they will show up as outliers.
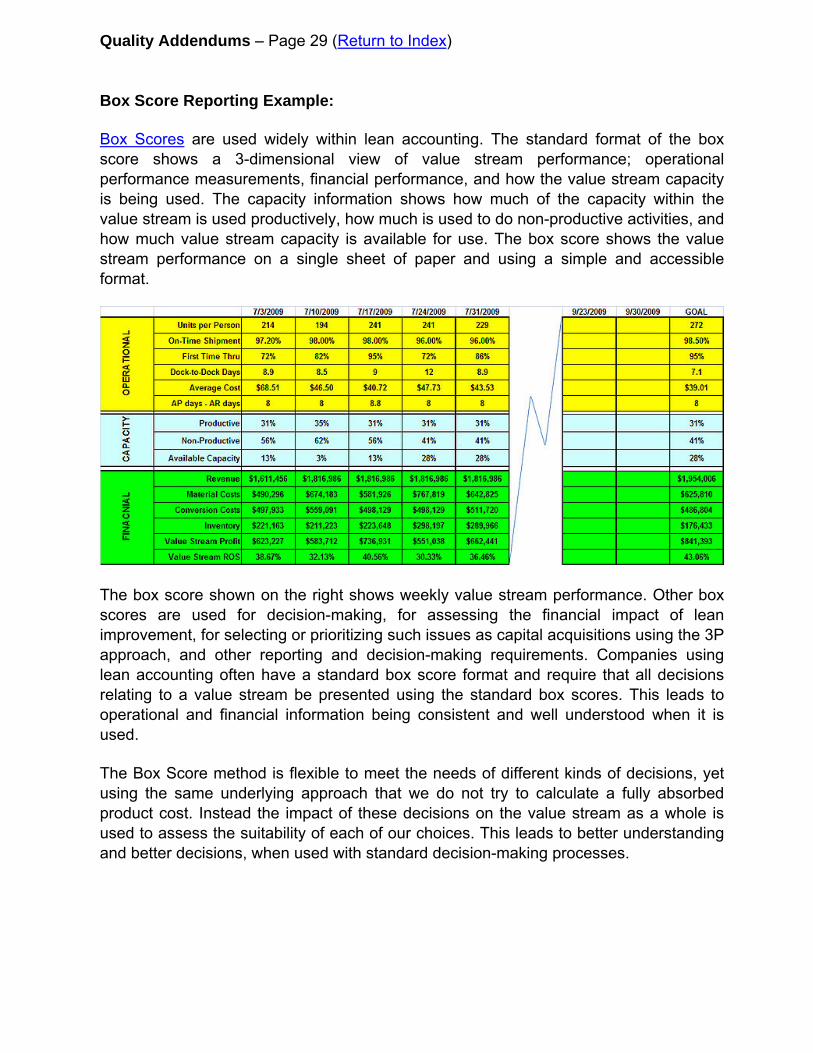
Quality Addendums – Page 29 (Return to Index)
Box Score Reporting Example:
Box Scores are used widely within lean accounting. The standard format of the box score shows a 3-dimensional view of value stream performance; operational performance measurements, financial performance, and how the value stream capacity is being used. The capacity information shows how much of the capacity within the value stream is used productively, how much is used to do non-productive activities, and how much value stream capacity is available for use. The box score shows the value stream performance on a single sheet of paper and using a simple and accessible format.
The box score shown on the right shows weekly value stream performance. Other box scores are used for decision-making, for assessing the financial impact of lean improvement, for selecting or prioritizing such issues as capital acquisitions using the 3P approach, and other reporting and decision-making requirements. Companies using lean accounting often have a standard box score format and require that all decisions relating to a value stream be presented using the standard box scores. This leads to operational and financial information being consistent and well understood when it is used.
The Box Score method is flexible to meet the needs of different kinds of decisions, yet using the same underlying approach that we do not try to calculate a fully absorbed product cost. Instead the impact of these decisions on the value stream as a whole is used to assess the suitability of each of our choices. This leads to better understanding and better decisions, when used with standard decision-making processes.
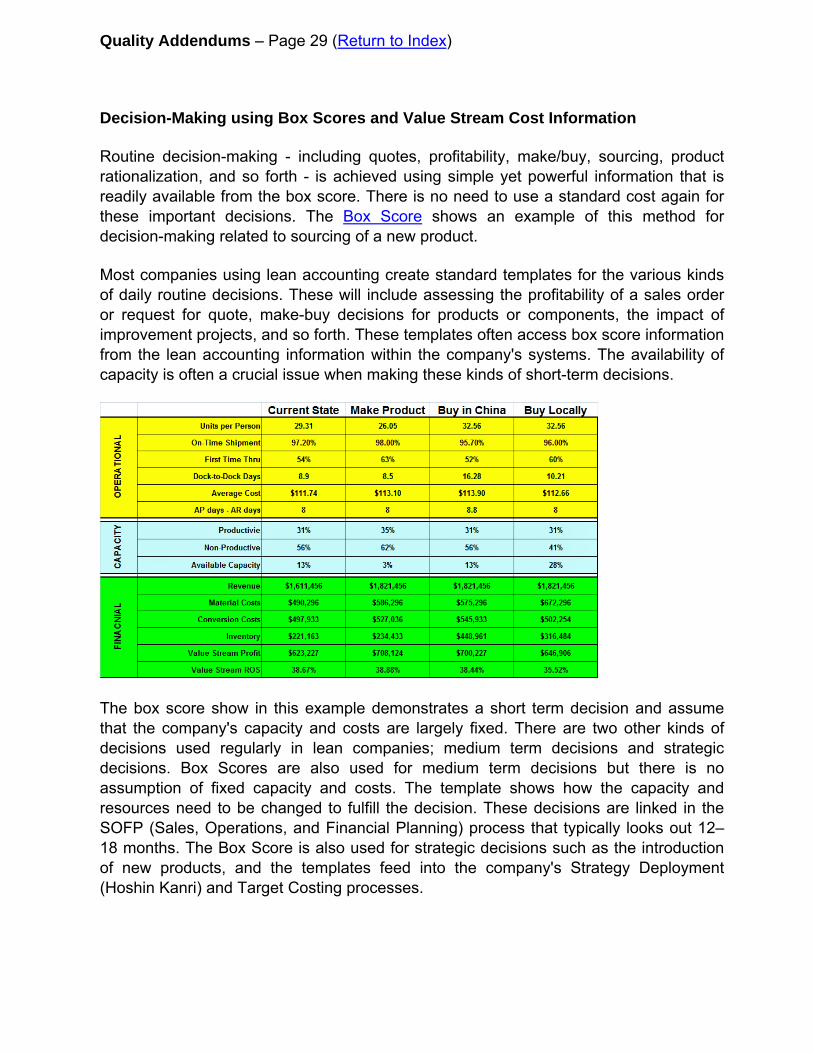
Quality Addendums – Page 29 (Return to Index)
Decision-Making using Box Scores and Value Stream Cost Information
Routine decision-making - including quotes, profitability, make/buy, sourcing, product rationalization, and so forth - is achieved using simple yet powerful information that is readily available from the box score. There is no need to use a standard cost again for these important decisions. The Box Score shows an example of this method for decision-making related to sourcing of a new product.
Most companies using lean accounting create standard templates for the various kinds of daily routine decisions. These will include assessing the profitability of a sales order or request for quote, make-buy decisions for products or components, the impact of improvement projects, and so forth. These templates often access box score information from the lean accounting information within the company's systems. The availability of capacity is often a crucial issue when making these kinds of short-term decisions.
The box score show in this example demonstrates a short term decision and assume that the company's capacity and costs are largely fixed. There are two other kinds of decisions used regularly in lean companies; medium term decisions and strategic decisions. Box Scores are also used for medium term decisions but there is no assumption of fixed capacity and costs. The template shows how the capacity and resources need to be changed to fulfill the decision. These decisions are linked in the SOFP (Sales, Operations, and Financial Planning) process that typically looks out 12–18 months. The Box Score is also used for strategic decisions such as the introduction of new products, and the templates feed into the company's Strategy Deployment (Hoshin Kanri) and Target Costing processes.
People in Quality Biographies – Page 1 (Return to Index)
Yoji Akao (赤尾 洋二 Akao Yōji, born 1928) is a Japanese planning specialist recognized as the developer of Hoshin Kanri (a strategic planning methodology). With the late Shigeru Mizuno, he developed Quality Function Deployment (a group decision making technique). Akao and Mizuno also co-founded the Quality Function Deployment Institute: a non-profit organization dedicated to dissemination and advancement of QFD. Akao received a Ph.D. in 1964 from the Tokyo Institute of Technology Howard Malcolm "Mac" Baldrige (October 4, 1922 – July 25, 1987) was the 26th United States Secretary of Commerce. He was the son of H. Malcolm Baldrige, a Congressman from Nebraska, and the brother of Letitia Baldrige. Malcolm Baldrige was nominated to be Secretary of Commerce by President-elect Ronald Reagan on December 11, 1980, and confirmed by the United States Senate on January 22, 1981. During his tenure, Baldrige played a major role in developing and carrying out Administration trade policy. He took the lead in resolving difficulties in technology transfers with China and India. Baldrige held the first Cabinet-level talks with the Soviet Union in seven years which paved the way for increased access for U.S. firms to the Soviet market. He was highly regarded by the world's most preeminent leaders. Baldrige was a proponent of quality management as a key to this country's prosperity and long-term strength. He took a personal interest in the legislation that became the Quality Improvement Act of 1987 and helped draft one of the early versions. In recognition of his contributions, Congress named the annual award (Malcolm Baldrige National Quality Award) for product quality in his honor. Norman Bodek is an author and the President of PCS Press, started Productivity Inc. and Press in 1979 and since 1999 has focused on Toyota's second pillar "Respect for People, employee-development and employee-empowerment. Bodek has published books and training materials and also led conferences and seminars on Total Production System - Lean, Total Productive Maintenance, Kaizen Blitz, 5S (sometimes known as 6-S), Poka-Yoke, Cell Design, Kanban, SMED, CEDAC, Visual Factory, and Lean Accounting. Over the course of 30 years, Bodek traveled to Japan 75 times, visiting over 350 plants, and published over 400 Japanese management books in the English language. He has met and studied the teachings of Deming, Juran, Crosby, and Ishikawa, and published the works of Akao, Ohno, and Shingo just to name a few.
People in Quality Biographies – Page 2 (Return to Index)
Philip Bayard "Phil" Crosby, (Wheeling, June 18, 1926 - Winter Park, August 18, 2001) was a businessman and author who contributed to management theory and quality management practices. Crosby initiated the Zero Defects program at the Martin Company Orlando, Florida, plant. As the quality control manager of the Pershing missile program, Crosby was credited with a 25 percent reduction in the overall rejection rate and a 30 percent reduction in scrap costs. Dr. W. Edwards Deming - (October 14, 1900 – December 20, 1993) was an American statistician, professor, author, lecturer, and consultant. Deming is widely credited with improving production in the United States during the Cold War, although he is perhaps best known for his work in Japan. There, from 1950 onward he taught top management how to improve design (and thus service), product quality, testing and sales (the last through global markets) through various methods, including the application of statistical methods. Dr. W. Edwards Deming is considered by many to be the father of modern quality control. Deming made a significant contribution to Japan's later reputation for innovative high-quality products and its economic power. He is regarded as having had more impact upon Japanese manufacturing and business than any other individual not of Japanese heritage. Despite being considered something of a hero in Japan, he was only just beginning to win widespread recognition in the U.S. at the time of his death.
Dr. Armand V. Feigenbaum (born 1922) is an American quality control expert and businessman. He devised the concept of Total Quality Control, later known as Total Quality Management (TQM). Feigenbaum received a bachelor's degree from Union College, and his master's degree and Ph.D. from MIT. He was Director of Manufacturing Operations at General Electric (1958-1968), and is now President and CEO of General Systems Company of Pittsfield, Massachusetts, an engineering firm that designs and installs operational systems. Feigenbaum wrote several books and served as President of the American Society for Quality (1961-1963).
People in Quality Biographies – Page 3 (Return to Index)
Sir Francis Galton FRS (16 February 1822 – 17 January 1911), cousin of Sir Douglas Galton, half-cousin of Charles Darwin, was an English Victorian polymath, anthropologist, eugenicist, tropical explorer, geographer, inventor, meteorologist, proto-geneticist, psychometrician, and statistician. He was knighted in 1909. Galton had a prolific intellect, and produced over 340 papers and books throughout his lifetime. He also created the statistical concept of correlation and widely promoted regression toward the mean. He was the first to apply statistical methods to the study of human differences and inheritance of intelligence, and introduced the use of questionnaires and surveys for collecting data on human communities, which he needed for genealogical and biographical works and for his anthropometric studies. He was a pioneer in eugenics, coining the very term itself and the phrase "nature versus nurture." As an investigator of the human mind, he founded psychometrics (the science of measuring mental faculties) and differential psychology. He devised a method for classifying fingerprints that proved useful in forensic science. As the initiator of scientific meteorology, he devised the first weather map, proposed a theory of anticyclones, and was the first to establish a complete record of short-term climatic phenomena on a European scale. He also invented the Galton Whistle for testing differential hearing ability. Henry Laurence Gantt, A.B., M.E. (1861 - 23 November 1919) was an American mechanical engineer and management consultant who is most famous for developing the Gantt chart in the 1910s. These Gantt charts were employed on major infrastructure projects including the Hoover Dam and Interstate highway system and continue to be an important tool in project management. William J. J. Gordon (September 9, 1919 – June 30, 2003) was an inventor and psychologist. He is recognized as the creator of a problem solving approach called synectics, which he developed while working in the Invention Design Group of Arthur D. Little. Masaaki Imai (born 1930, in Tokyo) is a consultant in the field of quality management. Known as the “Lean Guru” and the father of Continuous Improvement (CI) Masaaki Imai has been a pioneer and leader in spreading the KAIZEN philosophy all over the world. Mr. Imai’s ground breaking book, “Kaizen: The Key to Japan’s Competitive Success” was an instant global best seller, firmly embedding the word Kaizen in the corporate lexicon. It was the first book (1986) to introduce the ‘LEAN’ philosophy to the world, four years before the book “The Machine That Changed The World: The Story of Lean Production”. His firsthand account is based on his close associations and travels with such legendary giants as Shoichiro Toyoda and Taichi Ohno and reveals the secrets behind the success of Toyota and other Japanese companies.
People in Quality Biographies – Page 4 (Return to Index)
Kaoru Ishikawa (石川馨 Ishikawa Kaoru) (1915-1989) was a Japanese university professor and influential quality management innovator best known in North America for the Ishikawa diagram or cause and effect diagram (also known as fishbone diagram) that is used in the analysis of industrial process. Born in Tokyo, the oldest of the eight sons of Ichiro Ishikawa. In 1939 he graduated University of Tokyo with an engineering degree in applied chemistry. His first job was as a naval technical officer (1939-1941) then moved on to work at the Nissan Liquid Fuel Company until 1947. Ishikawa would now start his career as an associate professor at the University of Tokyo. He then undertook the Presidency of the Musashi Institute of Technology in 1978. In 1949, Ishikawa joined the Japanese Union of Scientists and Engineers (JUSE) quality control research group. After World War II Japan looked to transform its industrial sector, which in North America was then still perceived as a producer of cheap wind-up toys and poor quality cameras. It was his skill at mobilizing large groups of people towards a specific common goal that was largely responsible for Japan's quality-improvement initiatives. He translated, integrated and expanded the management concepts of W. Edwards Deming and Joseph M. Juran into the Japanese system. Carl Gustav Jung (26 July 1875 – 6 June 1961) was a Swiss psychiatrist, an influential thinker and the founder of analytical psychology (also known as Jungian psychology). Jung's approach to psychology has been influential in the field of depth psychology and in countercultural movements across the globe. Jung is considered as the first modern psychologist to state that the human psyche is "by nature religious" and to explore it in depth. He emphasized understanding the psyche through exploring the worlds of dreams, art, mythology, religion and philosophy. Though not the first to analyze dreams, he has become perhaps the most well known pioneer in the field of dream analysis. Although he was a theoretical psychologist and practicing clinician, much of his life's work was spent exploring other areas, including Eastern and Western philosophy, alchemy, astrology, sociology, as well as literature and the arts. Jung emphasized the importance of balance and harmony. He cautioned that modern people rely too heavily on natural science and logical positivism and would benefit from integrating spirituality and appreciation of unconscious realms. He considered the process of individuation necessary for a person to become whole. This is a psychological process of integrating the conscious with the unconscious while still maintaining conscious autonomy. Individuation was the central concept of analytical psychology. A popular psychometric instrument, the Myers-Briggs Type Indicator (MBTI), has been principally developed from Jung's theories.
People in Quality Biographies – Page 5 (Return to Index) Dr. Joseph M. Juran - (December 24, 1904 – February 28, 2008) first began developing a philosophy of quality in 1926 when he started working for the quality inspections division at Western Electric. He theorized that the field really depended on human factors, especially the work of managers, and that quality problems should be solved systemically. Juran first became well known in the quality field in the US as the editor of the Quality Control Handbook (1951) and later for his paper introducing the quality trilogy - planning, control and improvement. He developed the Pareto principle, named after the Italian economist Vilfredo Pareto, which observes that 80% of the problems in management arise from 20% of causes.
Noriaki Kano (狩野紀昭 Kanō Noriaki, pronounced [kano noriaki]) is an educator, lecturer, writer and consultant in the field of quality management. He is the developer of a customer satisfaction model (now known as the Kano model) whose simple ranking scheme distinguishes between essential and differentiating attributes related to concepts of customer quality. He is a professor emeritus of the Tokyo University of Science. In the late 1970s and early 1980s Kano and his colleagues laid the foundation for a new approach to modeling customer satisfaction. Kano challenged the conventional beliefs that improving each attribute of a company's product or service will lead to increased customer satisfaction. Kano believed that not all attributes of product or service performance are equal in the eyes of the customer, and that some attributes create higher levels of customer loyalty than others. George Michael Low, born George Wilhelm Low (June 10, 1926 – July 17, 1984) was a NASA administrator and 14th President of Rensselaer Polytechnic Institute. He was born near Vienna, Austria to Artur and Gertrude Burger Low, small business people in Austria. With the German occupation of Austria in 1938, four years after Artur Low's death, his family emigrated to the United States. In 1943, Low graduated from Forest Hills High School, Forest Hills, New York, and entered Rensselaer Polytechnic Institute (RPI), where he joined the Delta Phi fraternity. His education was interrupted by the war and from 1944 to 1946, in which he served in the U.S. Army. While doing so, he became a naturalized American citizen, and legally changed his name to George Michael Low. Retiring from NASA in 1976, he became president of RPI, a position he still held at his death. On July 16, 1984, the White House announced that Low had been awarded the President’s Medal of Freedom for his contributions to education and the nation’s space program. He died of cancer on the following day. The New York State Center for Industrial Innovation was renamed the George M. Low Center for Industrial Innovation by RPI ("Rensselaer," as of 1996) shortly after his death.
People in Quality Biographies – Page 6 (Return to Index) Taiichi Ohno (大野 耐一 Ohno Taiichi, February 29, 1912 - May 28, 1990) was a prominent Japanese businessman. He is considered to be the father of the Toyota Production System, which became Lean Manufacturing in the U.S.. He wrote several books about the system, the most popular of which is Toyota Production System: Beyond Large-Scale Production. Born in Dalian, China, and a graduate of the Nagoya Technical High School (Japan), he was an employee first of the Toyoda family's Toyoda Spinning, then moved to the motor company in 1943, and gradually rose through the ranks to become an executive. In what is considered to be a slight, possibly because he spoke publicly about the production system, he was denied the normal executive track and was sent instead to consult with suppliers in his later career. Ohno's principles influenced areas outside of manufacturing, and have been extended into the service arena. For example, the field of sales process engineering has shown how the concept of Just In Time (JIT) can improve sales, marketing, and customer service processes. Vilfredo Federico Damaso Pareto (15 July 1848 – 19 August 1923), born Wilfried Fritz Pareto, was an Italian industrialist, sociologist, economist, and philosopher. He made several important contributions to economics, particularly in the study of income distribution and in the analysis of individuals' choices. "His legacy as an economist was profound. Partly because of him, the field evolved from a branch of social philosophy as practiced by Adam Smith into a data intensive field of scientific research and mathematical equations. His books look more like modern economics than most other texts of that day: tables of statistics from across the world and ages, rows of integral signs and equations, intricate charts and graphs." He introduced the concept of Pareto efficiency and helped develop the field of microeconomics. He also was the first to discover that income follows a Pareto distribution, which is a power law probability distribution. The pareto principle was named after him and built on observations of his such as that 80% of the land in Italy was owned by 20% of the population. He also contributed to the fields of sociology and mathematics. J.D. Power III (born James David Power on May 30, 1931 in Worcester, Massachusetts) is the founder of the marketing firm J. D. Power and Associates. Following graduation from College of the Holy Cross in 1953, Power served four years as a line officer aboard a Coast Guard icebreaker in the Arctic and Antarctic. He subsequently earned an MBA from the Wharton School of the University of Pennsylvania in Finance. He joined Ford Motor Company as a financial analyst and later worked for Marplan as a marketing research consultant for General Motors Corporation’s Buick and GMC truck and coach divisions. Prior to launching J.D. Power and Associates in 1968, Power worked as a marketing research executive for J.I. Case Company, a construction and farm equipment manufacturer, and was director of corporate planning for McCulloch Corporation, a Los Angeles-based engine manufacturer.
People in Quality Biographies – Page 7 (Return to Index) Thomas L. Saaty (born 1926 in Mosul, Iraq) is an American mathematician who is a Distinguished University Professor at the University of Pittsburgh, where he teaches in the Joseph M. Katz Graduate School of Business. He is the inventor, architect, and primary theoretician of the Analytic Hierarchy Process, a decision-making framework used for large-scale, multiparty, multi-criteria decision analysis, and of the Analytic Network Process, its generalization to decisions with dependence and feedback. Prior to coming to the University of Pittsburgh, Dr. Saaty was professor of statistics and operations research at the Wharton School of the University of Pennsylvania (1969-79). Prior to that, he spent fifteen years working for U.S. government agencies and for companies doing government-sponsored research. His employers at that time included the Operations Evaluation Group of MIT at the Pentagon, the Office of Naval Research, and the Arms Control and Disarmament Agency at the U.S. State Department. Dr. Saaty has made contributions in the fields of operations research (parametric linear programming, epidemics and the spread of biological agents, queuing theory, and behavioral mathematics as it relates to operations), arms control and disarmament, and urban design. He has written more than 30 books and 300 papers on mathematics, operations research, and decision making. Their subjects include graph theory and its applications, nonlinear mathematics, analytical planning, and game theory and conflict resolution. Walter Andrew Shewhart - (pronounced like "shoe-heart", March 18, 1891 - March 11, 1967) was an American physicist, engineer and statistician, sometimes known as the father of statistical quality control. Born in New Canton, Illinois to Anton and Esta Barney Shewhart, he attended the University of Illinois before being awarded his doctorate in physics from the University of California, Berkeley in 1917.
People in Quality Biographies – Page 8 (Return to Index) Shigeo Shingo (新郷 重夫 Shingō Shigeo, 1909-1990), born in Saga City, Japan, was a Japanese industrial engineer who distinguished himself as one of the world’s leading experts on manufacturing practices and the Toyota Production System. Shingo is known far more in the West than in Japan, as a result of his meeting Norman Bodek, an American entrepreneur and founder of Productivity Inc in the USA. In 1981 Bodek had travelled to Japan to learn about the Toyota Production System, and came across books by Shingo, who as an external consultant had been teaching Industrial Engineering courses at Toyota since 1955. Shingo had written his Study of The Toyota Production System in Japanese and had it translated, very poorly, into English in 1980. Norman Bodek took as many copies of this book as he could to the USA and arranged to translate Shingo's other books into English, eventually having his original study re-translated. Bodek also brought Shingo to lecture in the USA and developed one of the first Western lean manufacturing consultancy practices with Shingo's support. The myth prevails that Shingo invented the Toyota Production System but he did document the system and added two words to the Japanese and English languages—Poka-yoke (mistake-proofing, not 'fool-proofing', which Shingo rejected as a term) and single-minute exchange of dies (SMED). In 1988, Utah State University recognized Dr. Shingo for his lifetime accomplishments and created the Shingo Prize that recognizes world-class, lean organizations and operational excellence. Shingo's influence extended into fields outside of manufacturing. For example, his concepts of SMED, mistake-proofing, and "zero quality control" (eliminating the need for inspection of results) have all been applied in the field of sales process engineering Genichi Taguchi - (田口玄一 Taguchi Gen'ichi) (born January 1, 1924, in Tokamachi, Japan) is an engineer and statistician. From the 1950s onwards, Taguchi developed a methodology for applying statistics to improve the quality of manufactured goods. Taguchi methods have been controversial among some conventional Western statisticians, but others have accepted many of the concepts introduced by him as valid extensions to the body of knowledge.
Bibliography - Page 1 (Return to Index)
1. ANSI/ISO/ASQC A3534-1, 1993, Statistics Vocabulary and Symbols - Part 1: Probability and Statistical Terms, Milwaukee, WI: American Society for Quality Control.
2. ANSI/ISO/ASQC A3534-2, Statistics - Vocabulary and Symbols - Part 2: Statistical Quality Control, Milwaukee, WI: American Society for Quality Control.
3. ANSI/ISO/ASQC A8402, 1994, Quality Management and Quality Assurance -
Vocabulary, Milwaukee, WI: American Society for Quality Control.
4. Kendall, M.G., and Buckland, W.R. Dictionary of Statistical Terms. (2nd ed.) New York: Hafner Publishing Company, 1960.
5. United States Department of Defense, Mil-Std.-721B, 25 August 1966, Definitions
of Effectiveness Terms for Reliability, Maintainability, Human Factors, and Safety, Washington, DC: United States Government Printing Office, 1966.
6. TQM engineering handbook, D. H. Stamatis, 1997 Marcel Dekker
7. Institute of Industrial Engineers - http://www.iienet.org/Details.aspx?id=2510
8. American Society for Quality - http://www.asq.org/glossary/z.html
9. The Quality Portal - http://thequalityportal.com/q_acronmy.htm
10. Operations Management and Quality Management, J. Grout, Campbell School of
Business, Berry College 1995,1998 - http://facultyweb.berry.edu/jgrout/
11. The Business Dictionary - http://www.businessdictionary.com/
12. Wikipedia online encyclopedia - http://en.wikipedia.org/
13. Data Net Quality Systems - http://www.winspc.com/datanet-quality-systems/support--resources/spc-101-differentiating-between-cpk-and-ppk-values.html
14. Adept Scientific - http://www.adeptscience.co.uk/products/qands/analyst/cpkanddpmo.html
15. SBTI online - http://sbtionline.com/glossary-of-terms/
16. Six Sigma Quality Resource for Achieving Six Sigma Results - http://www.isixsigma.com/index.php?option=com_glossary