Embed Size (px)
Citation preview

Ta’Shona Griffin, Patrick Hastings & Rachel Wagner

1
Table of Contents
Executive Summary……………………………………………………………………………………...p. 2 Introduction……………………………………………………………………………………………….…p. 3 Background…………………………………………………………………………………………………..p. 4 The Digital Divide Issue…………………….…………………………………………………….p. 4 Eliminate the Digital Divide Grant Program …………………………………………p. 4 Eliminate the Digital Divide Advisory Committee……………………………………p. 5 Project Design and Method…………………………………………………………………………..p. 6 Selection of Participants…………………………………………………………………………p. 6 Interview and Survey Process…………………………………………………………………p. 6 Considerations and Constraints……………………………………………………………..p. 7 Results and Analysis…………………………………………………………………………………….p. 8 Chicago (Cook County)………..…………………………………………………………………p. 9 Springfield (Sangamon County)…………………………………………………………….p. 11 Peoria (Peoria County)………………………………………………………………………….p. 12 Aurora/Naperville…………………………………………………………………………………p. 14 Rockford (Winnebago County)……………………………………………………………..p. 15 St. Louis Metropolitan Area………………………………………………………………….p. 16 Downstate, Rural Areas………………………………………..……………………………..p. 17 Analysis………………………………………………………………………………………………………p. 19 Interview Trends…………………………………………………………………………………..p. 19 Survey Trends……………………………………………………………………………………….p. 21

2
Recommendations………………………………………………………………………………………p. 24 Enhancing Grant Criteria………………………………………………………………………p. 24 Collaboration…………………………………………………………………….………………….p. 25 Communication…………………………………………………………………………………….p. 25 Conclusion………………………………………………………………………………………………….p. 26 Appendix I………………………………………………………………………………..………………..p. 28 Appendix II…………………………………………………………………………………..…………….p. 33 Appendix III……………………………………………………………………………………………..…p. 35 Appendix IV……………………………………………………………………………………………..…p. 37 Appendix V……………………………………………………………………………………………..….p. 39 References……………….…………………………………………………………………………………p. 53

3
Executive Summary
In August 2014, the Smart Chicago Collaborative, in conjunction with the Illinois Department of Commerce & Economic Opportunity and the Eliminate the Digital Divide Advisory Committee, enlisted the University of Illinois -‐ Chicago MPA Capstone team for a project on the Eliminate the Digital Divide Grant Program.
The main goal of the project was to enable the Advisory Committee to make recommendations on how to increase synergy between grant recipients, the State, and the greater workforce development community. Additionally, the report was to provide all grant recipients with a framework for enhancing their own technology training programs through best practices, opportunities for collaboration, and maximizing use of funds received.
Specifically, the Capstone team was asked to:
• Collect and analyze data on Computer Technology Center (CTC) programs through interviews with program managers.
• Collect and analyze data on program successes through surveys with program participants.
• Report on trends amongst grant recipients, program components and program participants.
• Recommend methods to maximize use of DCEO technology grants, and to increase connections with grant recipients.
Through telephone interviews with 15 grant recipients throughout Illinois, the Capstone team assessed funding sources, methods of communication, program monitoring, performance measurement and best practices. Additionally, survey responses from 135 program participants provided information on technology comfort levels, skills learned, and technology use levels.
As a result of our analysis, the Capstone team finds three main recommendations for increasing success, efficiency and collaboration for recipients of the Digital Divide grant. They are to:
• Provide certification to participants upon successful completion of CTC classes.

4
• Increase information sharing and program ‘advertising’ between local-‐area CTCs. • Create a system-‐wide listserv with periodic updates on technology trends,
innovation among CTCs, and opportunities for organizations to showcase their successes.

5
Introduction
The Illinois Department of Commerce and Economic Opportunity’s (DCEO) Eliminate the Digital Divide grant program has provided funds for technology training programs throughout the state since 2008, but has little knowledge of each program’s successes in increasing meaningful use of technology. This has created an environment with little collaboration between organizations, as well as between organizations and the larger workforce development community.
As the DCEO strives “to provide a foundation for the economic prosperity of all Illinoisans,” more information on grant recipients and their contributions to workforce development is needed and would greatly benefit the agency’s goals (DCEO, 2014). The Smart Chicago Collaborative, in conjunction with the DCEO and the Eliminate the Digital Divide Advisory Committee (EDDAC), enlisted the UIC MPA Capstone team to:
• Collect and analyze data on Computer Technology Center (CTC) programs through interviews with program managers.
• Collect and analyze data on program successes through surveys with program participants.
• Report on trends amongst grant recipients, program components and program participants.
• Recommend methods to maximize use of DCEO technology grants, and to increase connections with grant recipients.
The Smart Chicago Collaborative is a civic organization devoted to improving the lives of Chicago residents through the use of technology. Similarly, the Eliminate the Digital Divide Advisory Committee guides the DCEO in establishing criteria and procedures for identifying recipients of grants under the Digital Divide Elimination Act. Both groups focus on bridging the gap between citizens and technology – the Digital Divide – through increased access and understanding of these tools.
Creating a report and recommendations on Digital Divide grant recipients will enable the EDDAC to make recommendations on how to increase synergy between CTCs, the State, and workforce development. It will also provide all grant recipients with a framework for enhancing their own technology training programs through best

6
practices, opportunities for collaboration, and information on additional funding sources.
Background
In order to present the full picture of this project’s process and progress, some additional information about the grant program is needed, as well as some information about the greater issue they intend to address with their work. This includes information on the Digital Divide, the DCEO grant program, and the Advisory Committee.
The Digital Divide Issue
Through technology like computers, the Internet and smartphones, individuals now have an opportunity to voice opinions, obtain information, and create content better than ever before. Although these developments in technology have enhanced many aspects of society and the economy, it hasn’t done so for all members of our communities. For many individuals, access to technology like the Internet is blocked by the costs associated with owning a computer or smartphone, as well as the regular cost of connecting devices to web services. For others, who might not have learned technology skills on the job or in school, access is obstructed by little availability of training and less practice and comfort using technology.
These issues are the heart of the concept of a digital divide. The term digital divide refers to the perceived gap between those who do have and do not have physical access to a computer and Internet connection. Increasingly, though, the digital divide issue is more of a division in “the additional resources that allow people to use technology well,” as the costs associated with ownership have gone down (Warschauer, 2004, p. 6). Most frequently, these are issues of digital education and literacy (ibid).
7
As explained in Digital Divide: Civic Engagement, Information Poverty, and the Internet, the digital divide is a multi-‐layered matter. For Illinois communities, we are most concerned with the “social divide” between those that are digitally rich with information and those who are not, and the “democratic divide” between those who use their digital resources to engage in public life and those who do not (Norris, 2001, p. 4).
Efforts to eradicate the digital divide should consider not only efforts to increase physical access to technology, but also training on ways to use it. Providing the resource, increasing familiarity with it, and demonstrating its practicality are all crucial activities when attempting to bridge the digital divide, both socially and democratically.
Eliminate the Digital Divide Grant Program
In Illinois, the Department of Commerce and Economic Opportunity has been working to bridge the digital divide since 2000. As the agency tasked with providing resources for the 21st century economy, the DCEO recognizes that a many occupations in the state require computer literacy. As a result, they have established the Eliminate the Digital Divide grant program for increasing computer literacy.
The mission of the Eliminate the Digital Divide grant program is to provide access to technology like computers, as well as related training, to individuals in disadvantaged communities. This includes access to career services and training from a technological perspective, such as online job postings and software classes. In addition, some facilities have assistive technology and services for disabled and/or handicapped clients to eliminate any physical barriers to access.
The program funds Community Technology Centers (CTCs) to serve residents of eligible, low-‐income communities, up to $75,000. Eligible grant recipients include public and private nonprofit or for profit educational organizations, libraries, park districts, state and local educational agencies, public hospitals, and higher education institutions. The grant awarded to each CTC should be used to support computer literacy training programs, and can be used to plan, establish, administer, or expand their centers.
The ultimate goal of the program is to strengthen communities, enable job opportunities, and support innovation and entrepreneurship of individuals within the state of Illinois. In order to accomplish this, information on workforce development

8
from the larger Department is considered, as well as information on technology from experts outside of the DCEO.
Eliminate the Digital Divide Advisory Committee
One way that the Eliminate the Digital Divide Grant program stays current with technology and technological requirements in the workplace is through expert guidance from the Eliminate the Digital Divide Advisory Committee. The EDDAC has seven members, one appointed by the Governor, four by the leaders of the Illinois General Assembly, and two by the Director of the Department of Commerce & Economic Opportunity.
The Committee’s main goal is to help the grant program establish criteria for selecting grant recipients and for the programs they administer. Additionally, the Committee seeks to establish coordination among grant recipients to increase effectiveness of programs as well as increase funding opportunities. Through bi-‐monthly meetings that are open to the public, the Committee makes recommendations for the grant program on the above topics.
Project Design and Method With many different types of organizations receiving the Eliminate the Digital Divide grant throughout the state, it was important to incorporate a variety of perspectives into the report. Because of this, the Capstone team selected telephone interview and internet survey methods to learn about how programs were funded, monitored, and assessed, as well as whether they gave participants skills that are useful in the workplace. The following sections will address the process by which organizations were selected for inclusion, as well as the methods of data collection, types of questions asked, and an assessment of how we went about our data collection.
9
Selection of Participants
In selecting the organizations to target, we began with a complete list of grant recipients for the 2015 Illinois fiscal year, as well as a map of the geographic disbursal of these organizations throughout the state (see Appendix I). From this list and map, as well as our understanding of the Advisory Committee’s goals, we developed a set of criteria for selecting organizations for analysis. Other factors that were considered in selection include the number of interviews to complete in a limited timeframe, the ability to compare organizations based on characteristics, and the representativeness of the organizations as a whole. For comparison and representativeness, geographic location, amount of money awarded, and type of organization were all considered.
The resulting list was 22 organizations, ranging from Chicago and the metropolitan area to Aurora/Naperville, Rockford, Peoria, Springfield, the St. Louis metropolitan area, as well as rural areas of the state. Additionally, chosen organizations varied in type, from libraries and other public entities to nonprofits, such as religious institutions and community centers. For the full list of organizations targeted, please see Appendix II.
Interview and Survey Process
To obtain information on programs and the use of grant funds, the Capstone team conducted telephone interviews with the selected organizations in November 2014. Of the 22 contacted in this period, 15 were responsive and completed interviews for the report (68.2% response rate). Responses were recorded for each individual organization through an online form, in a summarized format.
The interview questions for these organizations can be categorized into five areas of importance for enhanced collaboration between parties. The full list of interview questions may be found in Appendix III, but briefly, the categories are:
1. Funding and Sources of Funding. This includes other sources of funds for technology programs or the organization and how Digital Divide grant money is spent.

10
2. Methods of Communication. These questions address communication with the public and with other organizations (if applicable).
3. Program Monitoring. This category covers program components, number of participants, and activities performed.
4. Performance Measurement. This set concerns measures of effectiveness and achievement, and how program changes are decided and implemented.
5. Lessons Learned. As programs evolve, best practices are important to share as a tool for effectiveness.
For the survey component, all interviews concluded with a request to send out the survey link to individuals that had completed a technology training program at the organization. Due to initial hesitation from organizations about providing lists of participant email addresses to the Capstone team, program managers were given the link to disburse to their mailing lists instead. While we do not know the number of individuals that were sent a link to complete our survey, we had 133 complete responses.
Survey questions were designed to learn about how effective technology training programs are in increasing technology understanding and use. The survey component of our data collection focused on some indicators of program success, as well as participant attitudes about technology. The general categories for the survey questions are:
1. Comfort Levels and Attitudes. 2. Skills Learned. 3. Program Communication. 4. Work Skills Developed 5. Computer Usage and Activity Levels.
The survey used a combination of scaled opinion questions, categorical questions, and short answer questions to cover the above categories.
Considerations and Constraints
Our decision to use interviews and surveys stems mainly from the resource constraints we faced from the beginning of the project. With a fixed period of time (September through November) and a limited amount of time available from each participant in the project, these methods were the easiest to administer and analyze.

11
From the interview method, we obtained rich, qualitative data, as well as data that could be codified and analyzed. This was good for making new discoveries about what works well in each program area, as well as presenting figures for comparison between each CTC. With the survey, much of the data obtained provided information on technology use and attitudes. In addition to that, the short answer section provided reasoning and anecdotes to fill out our analysis and give it more meaning.
Each method also worked well with the groups we queried. Program coordinators generally have interest in the outcome of this report and can explain their programs well, while participants have less interest in our project goals, as they have already used these services. Thus, participants are less willing to spend much time to help us, and are more apt to fill out a short survey rather than a longer interview.
While these benefits attracted us to the methods used and ultimately helped us select them, we do recognize their drawbacks. For us, the process of completing the interviews could be time consuming, if we needed to transcribe, summarize or codify any of the data in order to use it. We did address this somewhat by using an online survey tool for both interview and survey, which combined the information into reports for organizational and analysis purposes. We are also aware of the potential for low response rates, particularly with regard to the survey. As mentioned previously, program participants do not have very much interest in a program they have already completed, and their willingness to answer a survey could be low as a result.
Additionally, the use of an online survey, given to program participants that have an email address introduces a selection bias into our results. Individuals that participate in a technology training program that have a valid email address, and that respond to an online survey, are already more likely to be satisfied with the program than non-‐respondents. Because our choice of survey method filters out program participants that have not continued regular use of the Internet or email, our analysis is inherently biased towards satisfaction in and success of CTC programs. Nevertheless, our analysis does show areas of strength and weakness within technology training programs and across them.
Results and Analysis
12
This section will breakdown responses to our interviews as well as surveys, in order to recognize trends and make recommendations for the program. During the selection process for grant recipient interviews, one of the main methods of selection was by location. Each area of the state has different economic conditions, from unemployment rates to major industries and skills required. Additionally, each area has different demographic makeup, both of which contribute to different needs for Computer Technology Centers and programs.
In order to be as effective as possible, CTCs in various geographic areas should have programs tailored to their specific economy. Since many of the CTCs that fall in a certain region also fall within the same county, we will be using the county information of unemployment, demographics, major industry, and economic trends in order to analyze CTC program components. We decided to use the county information because it is the smallest area that has multiple CTCs, along easily obtainable economic and demographic information.
For the downstate/rural centers the information for the area that they are located was used, a general breakdown of the overall CTC presence in these areas will also be given. This will show the number and types of centers that are in a given area compared with the statistical information for that area. To help facilitate this breakdown a map of all the CTCs that received the grant for 2014 was created using Google Maps.
The interviews were broken down into five main sections -‐ funding, communication, programs, performance measures, and best practices -‐ in order to get all the information needed to meet the objectives of the project.
Similar analysis could not be completed for surveys, based on location. This is due to a lack of responses from different organizations. Most responses came from the Chicago and Aurora areas, and would not necessarily represent the opinions of CTC program participants statewide. Instead, survey responses were coded and analyzed via SPSS for trends and other information about program participation.
The following results section will detail the information gathered during interviews. Next, a discussion of interview trends will follow. Finally, the participant surveys will be discussed through response trends and anecdotal information.

13
Interview Results & Location Analysis
Chicago (Cook County)
For the Chicagoland area, the information for Cook County was used for the analysis. This area makes up Chicago and its near suburbs, which has the largest concentration of community technology centers in the state, with about 57 organizations. 44 of these organizations are non-‐profits, ten are libraries, and one is a school district. Of these organizations, eight were targeted for interviews and surveys. These eight consisted of five non-‐profits and three libraries. Of the eight centers that were contacted initially, five completed the interview. The programs offered varied slightly but all of them did focus on workforce development. Two of the organizations focused more on literacy issues such as English, computer, and ESL. One of the libraries even offers Wii bowling tournaments as a way of keeping a fun, interactive atmosphere.
Funding
All of the organizations in this area are fairly new to this grant, with three years being the longest any of them have received it. There is a broad range of other funding coming into these organizations such as grants from multiple sources including private foundations, and workforce partnerships. The money from the digital divide grant is consistent across the board with it mainly going to purchase new computers, software, and teachers/instructors salaries.
Program Monitoring and Communication
Regarding staying up to date with technological change, some organizations look to what their funders want to see as a guide for incorporating content into their programs. Others have a technology specialist that stays up to date with trends and can make plans for implementing new technologies. One of the libraries follows the EDGE initiative as a way to stay current with technology training. The EDGE initiative is a tool that assesses an organization’s public technology services and says whether that organization is meeting the needs of the community is it in (libraryedge.org).
In order to get their word out to the community about programs, many send out newsletters, both on paper and electronically, use social media, as well as community partners. Some, like the Association House of Chicago, also have local partnerships to

14
spread the word about programs. They have recently partnered with their local alderman to promote their activities and to refer community members to their programs.
When asked about further affiliations or collaboration between organizations, both libraries stated that they did not have those outside connections, while all the non-‐profits did. Non-‐profit affiliations ranged from violence prevention groups to workforce partnerships and staffing companies, to a community college.
Performance Measurement
All of the centers in this area track the activity level of their clients whether it is for classes or just for the open lab hours. One of the libraries charges one dollar an hour if the person is a non-‐resident to use their computers, which can be a good way to bring in extra funding for these centers. This also serves as a way to track use of computers, by requiring all patrons to check in before having access. Almost all of the organizations keep track of the performance of both their programs and their clients, with the exception of one of the libraries who claims that there is no way to track performance.
Best Practices/Changes
With the exception of one of the libraries, all of the centers are constantly changing their programs in order to stay efficient. The changes range from adjusting their assessment tools and enrollment process all the way to class sizes and offerings. Some of the best practices from this area are that hands-‐on teaching is the best method and that tailoring classes to meet the needs of the clients helps, so the content does not scare them away.
***
With Cook County’s unemployment rate at 6.7% as of August 2014, it matches the rest of the state’s unemployment rate. It also has the largest population density out of all the other major areas in Illinois. Cook County, which contains Chicago and its surrounding areas, has a population of 5.24 million, according to the U.S. Census Bureau. That is almost 40% of the Illinois population in a single area of Illinois.
Based on population and number of CTC organizations in this area, there are about 90,000 people for every CTC in this area. Even though it looks like a lot of attention is being given to the Chicago area over the rest of the state, it is actually a
15
median figure in terms of people per center. Cook County also has significantly higher poverty rates at 16.4% compared to the rest of Illinois, which is at 13.7%. With the population that can have the most benefit from these centers being the people that are in poverty, this area has a strong need for these centers.
Cook County has a wide range of employment opportunities. The two largest fields of occupation in Cook County are management, business, finance at 15.52% and sales, office, administrative support at 25.03%, according to bestplaces.net. In order to succeed, both of these fields require the knowledge of computers and software common in administrative work.
Chicago is also undergoing a technology boom that has the potential for creating jobs. The problem with this surge of employment opportunities is that the businesses hiring are concentrated in wealthier neighborhoods and are looking for employees with skills in technology. There is little connectivity to potential applicants outside the immediate area, and many do not know about the job availability, or that they might qualify for these positions. The key to getting into these positions starts with the basic understanding of how to use computers and necessary programs, and how these skills can be applied in the workplace.
Springfield (Sangamon County)
Although the two CTC’s that were interviewed from this area actually fall within Springfield’s boundaries, information on the larger Sangamon County will be used when to discuss employment and poverty trends. County information will be used because it is likely that individuals who are visiting these centers are not just from Springfield, but also the surrounding communities that are contained within Sangamon County. This makes it important to catch a wider perspective on the conditions of the areas that surround the Springfield area. That is particularly true when there are a limited number of CTC operating in the area, as is the case here.
There are three CTCs in this area, which are all non-‐profit organizations. Two were selected for interviews and only one was able to complete it. The organization that did do the interview is focused on literacy skills for the people of Springfield.

16
Funding
This is the first year for this center to receive this grant and receives a lot of its other funding through adult and family literacy grants from the Secretary of State. They also do some fundraising and receive volunteer help to help with resume writing and job searches.
Program Monitoring and Communication
The technology program for this center is based on getting people up to a level of technology understanding where they can take the GED test, which is now only available online. They communicate through flyers, satellite programs at school, and people are referred to the center when they could not pass the GED in the Springfield area. They collaborate with the other center that was reached out to for an interview in this area and currently have 130 volunteers in the program.
Performance Measurement
This organization measures the client’s performance by asking them a series of basic computer questions. They also see if their clients can navigate the GED program online and if they can then they have reached the organization’s goals.
Best Practices/Changes
Since the start of the technology program at this center, they changed to using a website called digitalliteracyassessment.org for those who have never used a computer before. The best practices for this organization are hands-‐on learning. Also working towards a goal and getting some kind of certificate gives the clients a sense of accomplishment.
***
Sangamon County has an estimated population of 199,145 in 2013, which puts the population to CTC ratio at about 66,000. The unemployment rate was 6.5% as of August 2014 according to the Bureau of Labor Statistics. This is a little better than the state’s average of 6.7%.
According to the Sangamon County’s website, the largest area employer is government, which is not surprising considering that Springfield is the Illinois state

17
capital. Most government jobs do require the use of computers and other technology. Most government jobs also disperse their applications online, which makes it crucial for people to be informed on the use of Internet. According to the organization interviewed, there is a large literacy issue in this area. This prevents people from going online to apply for job let alone being viable candidates because of little computer skills. The work of CTCs in increasing familiarity with basic Internet components will go a long way in Sangamon County to provide equal opportunities for employment in its largest work field.
Peoria (Peoria County)
Peoria County, which contains the city of Peoria, is located southwest of Chicago and sits along the Illinois River. Again, county information was used because it targets a larger area that is likely served by the community technology centers in the actual city. Of the seven CTCs in the Peoria area, three were chosen for interviews in which all completed. The seven centers in this area consist of two non-‐profits, two school districts, and three libraries. Two of the libraries and one of the non-‐profits were chosen for interviews. The programs of these organizations vary between the libraries and the non-‐profit. The non-‐profit does more employment, general education, and counseling programs, whereas the libraries focus solely on computer training.
Funding
The two libraries are new to this grant while the non-‐profit has received it six times. There was a general consensus of what the money goes into though, such as the buying of new computers, paying staff, upgrades, and software. The libraries receive additional funding through taxes, donations, other grants and fees and fines. The non-‐profit receives much of its funding through United Way, as well as other state and Federal grants. Two of the centers do not receive any other grants related to the Digital Divide grant, while one receives components of other grants to improve employability skills.
Program Monitoring and Communication

18
The programs in this area are fairly large in terms of number of clients per month. The non-‐profit has about 57 clients per month and one of the libraries has 650 clients per month. These organizations are tracking their clients through sign in sheets when they enter open lab hours and keep attendance for their classes. One of the libraries follows the EDGE initiative and the other has a technology plan that is updated annually. The non-‐profit states that it just keeps up with trends and tries to update its computers as funding comes in.
In order to get the word out about organizational activities, the non-‐profit has partnerships to take referrals and hands out flyers. The libraries use a wide variety of ways to promote their services, such as social media, library website, radio, and print press advertisements. They also call and email their clients to let them know of upcoming classes.
Performance Measurement
All three of these organizations assess their client’s progress before and after using their services. They do so by either giving them a test or keeping a portfolio of all the work that they have completed, in order to know what they still need to work on. They also monitor the attendance rates of their classes and open hours to determine overall usage.
Best Practices/Changes
All of these organizations have made changes since starting their technology programs. The changes include: modifying the classes to cover certain skill sets instead of general classes; offering more advanced and specialty classes; and using a multitude of advertising in order to bring in clients. The best practices for these organizations are all very similar to each other. They all believe that larger classes are hard to establish. With smaller groups, more people get one-‐on-‐one training, which works the best. Also, online self-‐paced modules seem to be very effective at teaching computers skills, particularly with individuals who do not have the same schedule every week and who can’t attend classes on a regular basis.
***
The US Census Bureau estimates the Peoria Metropolitan Areas population at 379,186, as of 2012. That would make the population to CTC ratio about 54,168 people per CTC for this area. The poverty rate in the Peoria County area is about 3% higher than

19
the rest of Illinois and the unemployment rate of Peoria County is at 7.7%. This data shows that there is a need for CTCs in this area, since both numbers are worse than the state’s average. The CTCs in this area offered multiple types of programs but did talk about offering more advanced training. This could be what people in the area are seeking out in order to be competitive in the workforce.
The major employment areas within Peoria County are education and health services at 32.7%, trade, transportation, and utilities at 32.1%, and manufacturing at 26.5% (bls.gov). Particularly with education and health services, many daily tasks make use of computers and specialized software to track patient and student records. This could be an opportunity to train on these specialty programs, and increasing overall technology comfort levels would only help when employees are trained on new systems.
Aurora/Naperville
Aurora and Naperville are cities that fall on the southwest outskirts of the Chicago land area. The cities border each other and are both fairly large in population. Since both cities have adequate data about them available and the fact the each one falls within the borders of multiple counties, we will just use the city data for our analysis.
We targeted two of the four organizations that fall within this area, which are both non-‐profits. Only one of the organizations could be reached to complete the interview. The center that completed the survey is from the Aurora area and has programs that focus on education, economic and workforce development, health and quality of life, and racial justice.
Funding
The non-‐profit from this area has received the Digital Divide grant over seven years. It also receives a municipal grant, a community block grant, and a corporate grant. All the additional grants are related to technology and job skills. Almost 80% of their funding is based off of grants with the rest coming from contributions and

20
miscellaneous fundraising. The money from the Digital Divide grant goes into instructor salaries and training, computer equipment, and software.
Program Monitoring and Communication
This CTC employs a computer technician that stays up to date with technology trends and make recommendations for the agency and the computer classes. 30% of this center’s services are geared toward technology training and they serve about 135 clients a month. In order to communicate with the community, they use social media, e-‐newsletters and pass out flyers about their services. They also partner with the local community college to refer clients back and forth depending on the client’s needs.
Performance Measurement
This center tracks both the performance of their classes and the clients. The clients take a computer post-‐test and need to achieve at least a 60% completion to pass the course.
Best Practices/Changes
With the large amount of clients being served this center, has had to add a new server to handle to increase capacity. The organization states that it is best to offer beginning, intermediate, and advanced classes to meet all their clients need. This is likely because they are a larger organization, with client’s consistent needs at each of these levels.
***
Aurora and Naperville are two of the largest cities in Illinois with a combined population at 344,827, as of 2013, according to the US Census Bureau. They also have unemployment rates of 5.8% and 5.1% as of August 2014, which are both lower than the state’s average.
The economy of Aurora and Naperville is spread across the board. In Aurora, the two major occupation fields are sales, office, administrative support and production, transportation, and material moving. Naperville’s largest occupation fields are management, business, finance and sales, office, and administrative support (bestplaces.net).

21
All of these industries require the knowledge of computers not only to be proficient at the job but also to apply to the jobs in the first place. The CTC interviewed in this area offers programs and technology classes that ranged from beginner to advanced classes, and given the varied industries present, this is beneficial in helping at all position levels. Again, in today’s technology driven world, the best way for an individual to stay competitive is being educated on the basics of technology.
Rockford (Winnebago County)
Although Rockford is one of the larger cities within Illinois, we still decided to use the county information to get a better understanding of the larger Rockford area. This specific area has only one CTC receiving the Digital Divide Grant with the closest CTCs being in Dixon and Woodstock (each about 35-‐40 miles away). This organization interviewed within Rockford is a non-‐profit that focuses on workforce training and youth computer classes.
Funding
This CTC has received the grant nine times and receives 90% of its funding from other grants, which are mainly for workforce development activities. The Digital Divide grant money goes into updating the equipment, as well as salaries, advertisement, and supplies.
Program Monitoring and Communication
Their programs are centered on job training and youth computer classes. They offer six-‐week classes that serve about 60-‐70 adults a month and 300-‐400 children. The center stays up to date on technology by purchasing new computers and keeping their software updated as their funds allow.
Performance Measurement
Attendance is taken for all the classes and there is a sign-‐in sheet to track who is coming and how often. In monitoring program success, the organization has participants take a pre and post-‐test. This helps not only see how far clients have come, but also to

22
see what skills they need and if their classes are actually successful at conveying the intended information.
Best Practices/Changes
The biggest change that this center made was the addition of more intermediate level programs. They say that the demand for more advanced training is increasing as clients go through the beginner courses, and as a result, they have expanded offerings. They also say that the key to success for their clients is hands-‐on training.
***
Winnebago County had an estimated population of 290,666, as of 2013, according to the US Census Bureau. That makes a ratio of 290,666 people to one CTC. This is an area that is in need of more centers based off of this statistic alone. It also has an unemployment rate of 9.6% as of August 2014, which is almost 3% higher than the states average. The poverty rate for Winnebago is at 17%, which is much higher than the state’s rate at 13.7%. This statistic shows that there is a lower income class that could be in need of basic computer training.
The two largest industries in Winnebago are educational services, health care, and social assistance at 22.8% and manufacturing at 22% (bestplaces.net). The largest employers in the area are Rockford School District 205 and Rock Health System. With an area that is as large as it is and with a high unemployment rate, it is an area that needs more CTCs or an increase of funding to existing ones for program expansion.
St. Louis Metropolitan Area
Since St. Louis is actually a city of Missouri and our focus is on CTCs within the State of Illinois, the St. Clair County information will be used for the analysis. There are nine CTCs in this region -‐ three libraries, three non-‐profits, and three schools. The two centers that were selected for interviews are both non-‐profits, but only one could interview could be completed. The programs offered by the CTC that was interviewed involve many subjects -‐ college readiness, teen employment, technology training, trauma therapy, tutoring, hot meals, and life skills development.

23
Funding
This organization has received the grant a total of nine times. Their other funding comes mostly from individuals, corporations and foundations, and churches. They receive no other grants relating to employment or technology.
Program Monitoring and Communication
The program for this CTC serves about 480 people per month. They have volunteers from Best Buy and St. Louis-‐based corporations to teach mobile app development. They are in a partnership with Intel’s Computer Clubhouse Village, which centers on creative technologies such as graphic design, animation, and digital photography. For this organization, best methods of communication are through flyers in the community and program information in their monthly newsletter.
Performance Measurement
This organization uses a program called KidTrax that tracks participation, outcomes, and life change. For the adults they use the Technology Training Record, provided by the Department of Commerce and Economic Opportunity.
Best Practices/Changes
The CTC began offering adult literacy and GED classes to meet the needs of the people they were serving. The technology training was not beneficial without a GED and was impossible without literacy. The best practice that they maintain is home visits to clients, in order to keep them attending programs and using their services. Once they do get clients to return more frequently, they have found large improvements in commitment to the programs, and that 70% of clients secure employment.
***
In order to do capture the population of the area where all the St. Louis area organizations fall, the data for the St. Louis Metropolitan east region will be used. The population of this area is about 700,00, as of 2010, according to the US Census Bureau. This puts the population to CTC ratio at about 77,000. The unemployment rate for this area is 6.6% as of August 2014, which is similar to the states average. This area has an adequate amount of CTCs based upon the number of centers and the unemployment rate for this region.

24
Downstate, Rural Areas
Many of the Community Technology Centers that were located in Southern Illinois and did not have another center within close proximity, and thus were all considered part of the downstate/rural area for analysis. Since they are so spread out the county information that contained the CTCs interviewed was used. There are nine CTCs in this area that covers a large portion of southern Illinois. Three are libraries, four are non-‐profits, one is a school district, and one is a municipality. Four CTCs were targeted for interviews and two responded. Of the two organizations, one is a non-‐profit and the other is a school district. The programs offered by the non-‐profit are job skills training, resume writing, various computer programs, budgeting, homework help for children and the parents, and an afterschool program. The school offers the technology program and a pre-‐k program.
Funding
Both of these organizations are first year recipients of the Digital Divide grant. The school receives a grant for a pre-‐k program but no other grants that relate to technology or employment. The non-‐profit receives funding for a youth employment program that develops job skills for 16-‐24 year olds. The grant money from the Digital Divide goes to instructor salaries, purchasing equipment, software updates, and the non-‐profit even used some to help construct their technology center.
Program Monitoring and Communication
The school has forty participants a month whereas the non-‐profit serves 20 to 50 clients a month. The centers stay up to date by attending conferences, through contact with other schools, regular software updates, and changes to their programs based on demand. To communicate with the public they use the newspaper, Facebook, and news agencies. The non-‐profit hosts the local chamber of commerce meetings in order to get its work out in the community, work with the businesses to hire its client, and understand the type of skills that are desired by employers. The non-‐profit also has a listserv set up to stay in contact with all of their clients.
Performance Measurement

25
Neither one of these organizations has any assessment process in place. The non-‐profit states that it will begin to track progress in January by giving and pre and post-‐test to all of its clients that use their services.
Best Practices/Changes
The school has not made any changes since starting their technology center. The non-‐profit has tailored its offering from general computer knowledge to more skills-‐based classes. Both said that hands on training work the best for their clients. The non-‐profit also states the group setting brought more people together and increased participation.
***
Saline County, which contains the library that was interviewed, has an estimated population of 24,939 as of 2013 and has an unemployment rate of 8.5% according to the Bureau of Labor Statistics. 18.6% of the population is below the poverty level which is 5% higher that the states rate. The largest industries in this county are educational services, health care, and social services at 27.4% and retail trade at 12.4%.
Ford County contains the school district that was interviewed, has an estimated population of 13,832 as of 2013. The unemployment rate of Ford County is 6.9% as of August 2014, which is similar to the state’s rate. The poverty rate is 9.9%, which is much better than Illinois rate at 13.7%. The major industries in this area are educational services, health care, and social assistance at 24.8% and manufacturing at 13.5% (bestplaces.net).
Trends Analysis
Interview Trends
The interview results brought out a few notable trends throughout the state. With some areas having only one interview completed, it was difficult to determine trends in each areas, though some conclusions were drawn based upon responses and the statistical information. Major trends that stood out relate to program offerings, including the differences between libraries and non-‐profits, what the money from the grant was used for, and best practices. The programs offered by all the CTCs vary

26
greatly, but all center on education. Whether it was from the technology training programs or job skills development, all the way down to literacy classes, these centers focus on getting their clients to a level where they can sustain employment.
One of the biggest trends that the interviews brought out was the difference in programs between the libraries and non-‐profits. The libraries keep a more rigid technology based learning program. Their classes seem to focus on specific computer skills and open hours for people to use the computers. In contrast, the non-‐profit programs are heavily based on employment.
For example, many centers have found a strong need for literacy training, and are able to step back and determine the basic skills needed. This is where their programming begins, in order to meet client’s needs. There was also a lot more resume writing programs and GED classes, since the GED test is now online and obtaining employment has become increasingly digitized. One organization interviewed certifies people in Microsoft Word and Excel, which they can put on their resumes.
The libraries do have an advantage, however, as there are typically a greater number of people using their programs. This could be because people tend to feel welcome in a library and understand what services they provide. Individuals are more likely to stop in and use the computers where they then learn about computers class offerings.
The general consensus with program expenditures was very similar across the organizations. Every center uses the money to buy computers, pay staff salaries, and to update software. Many also use the money to help advertise their services. With technology being a constantly evolving sector, a lot of grant money also goes into replacing old equipment and software.
One center stated that they were looking into using open access software such as Google docs in order to free up some of the grant money. Another stated that they are staring to use computer based tutorials and computer based teaching programs that the clients can do on their own time and at their own pace. This would also free up some in instructor salary money if the results were still positive. One CTC has even used the grant money to help construct the room that is used for their computer area.
These costs for equipment and other capital needs leads to the belief that organizations that are new to the grant will have a high cost to participant ratio since a

27
lot of their money may be going into developing their resources before they can efficiently educate a high number of people. Once they have an established program, with proper promotion, the cost ratios will likely look better.
All of the CTC’s had input as to their best practice, some overlapping and some unique responses. The most common best practice across the state was the use of hands-‐on training. Many centers stated that this was the way most people preferred to learn.
Many also believe that the class sizes should stay small so that there is a lot of one-‐on-‐one instruction. The small class size also allows for the instructor to get a good idea of where the class’s skill levels are at from the start. This allows them to adjust the curriculum to fit the needs of the class. A few centers said that having class curriculum that the clients feel is way over their heads discourages them and they do not come back.

28
Communication, in multiple ways, is another key factor in the success of these programs. Whether it is communicating to the public about the services they provide, communicating with their current clients, or communicating with outside partners, it all has to be done. The most common ways that these centers got their word out to the public was by social media, flyers, newsletters, and through referrals. Libraries seemed to take a more online approach to communicating such as social media and websites, whereas non-‐profits used flyers and community canvasing more often.
Another key concept to the client success was to keep in contact with them while they are enrolled in the classes. A few organizations stated that it was crucial to keep calling and even do house visits in order to make sure people keep attending classes. One organization also utilized an email list of all the people who have been in the program to let them know about upcoming events and classes.
46%
7%
27%
13%
7%
Best / Most Efficient Way to Train
Hands On -‐ Umlize Sonware Directly
Promote Parmcipamon and Class Unity
Mulmple Levels of Program that Can Be Tailored
One on One -‐ Promote Selfesteem
Small Group

29
The last communication tactic we saw was done through partnerships and outside agencies. Many of the non-‐profits have partnerships that helped by referring their own clients and participants to the technology training classes. This allows organizations to not only promote their services to different people but also to stay updated with program demands.
For example, one organization hosts the local Chamber of Commerce monthly meetings. This allows for the center to know what the employers of that area are looking for and direct their programs to meet those skills. The center can then make referrals to the businesses for the people in the program to hire and take referrals from the businesses that want their applicants trained in a certain area of computers.
Survey Trends
The surveys for program participants were developed to get a better understanding of where the participants were coming from. It also gave further perspective on how well the CTC were doing at teaching technology, outside of our interviews. The surveys reflect only a small portion of the CTCs contacted, even though there were 133 surveys returned.
These surveys depict what the participants of the training programs feel about technology and whether they benefited from the programs. A full listing of response frequencies can be found in Appendix V. Notable trends from survey responses show the participant comfort levels with technology, outlook on employment, and whether they have changes in the way they use technology.
The interview process brought out the fact that some organizations changed from general computer classes to more skills based classes. This reflects what the surveys questions on comfort levels with computers and Internet brought out. Respondents generally had a high comfort level with computers with 54% saying they felt very comfortable and 22% saying somewhat comfortable.
With overall computer comfort levels high, it could give an explanation as to why some organizations had to transition to a skills-‐based training. These people already have general knowledge of computers, yet they do not have knowledge on specific

30
programs. Respondents also had a high comfort level with using the Internet. The surveys also show that there is a large increase in understanding of technology after going through a program.
One of the main goals of the Digital Divide grant program is to help people attain employment with the new technology skills they learn going through these programs. This area of the survey focused on questions about whether more opportunities have opened up and if they have actually received employment as a result of the skills acquired.
1%
5%
27%
67%
Class Increased Understanding of Technology
Strongly Disagree
Somewhat Disagree
Neither Agree/Disagree
Somewhat Agree
Strongly Agree

31
The results show that a large percentage of people feel that more opportunities are available to them. However, the numbers of those that stated they have received employment are not as high. They also show that people have changed the way they are looking for employment, whether it is for different types of job or just filling out applications with different skill sets listed.
Another trend that came out in the surveys was the way technology use has changed from participating in these classes. Almost 85% of the people said that they are using computers more frequently since being in the program and that they see the use of computers as being more important in their lives. This shows that these programs are helping to get people into using technology as an important tool in leading a successful life.
1%
1%
13%
16%
69%
Opened More OpportuniYes For Employment
Strongly Disagree
Somewhat Disagree
Neither Agree/Disagree
Somewhat Agree
Strongly Agree
32
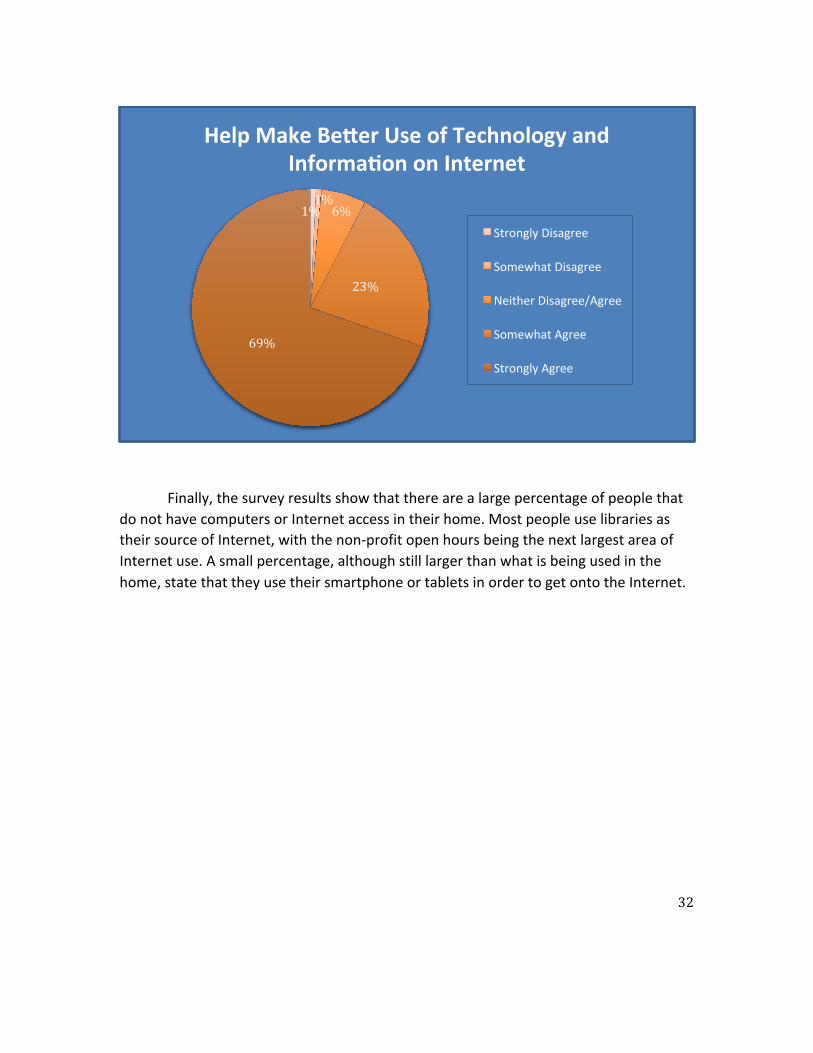
Finally, the survey results show that there are a large percentage of people that do not have computers or Internet access in their home. Most people use libraries as their source of Internet, with the non-‐profit open hours being the next largest area of Internet use. A small percentage, although still larger than what is being used in the home, state that they use their smartphone or tablets in order to get onto the Internet.
1% 1%
6%
23%
69%
Help Make Be\er Use of Technology and InformaYon on Internet
Strongly Disagree
Somewhat Disagree
Neither Disagree/Agree
Somewhat Agree
Strongly Agree

33
Recommendations While many of the organizations do a good job at bringing people in and getting them involved in using technology, some recommendations can be made to increase efficiency within these organizations. Recommendations were identified from interview and survey results and analysis, with focus on the original project themes. Even with a few of the centers unable to be reached, enough information came from the interviews to recognize trends and create recommendations. They follow with enhancing program criteria, coordinating operations, and overall better contact amongst grantees.
Enhancing Grant Criteria
The most important part of this grant program is not only to give people in Illinois the opportunity to use computers and get on the Internet, but to help them learn the importance of and how to be proficient with technology. That is why we recommend enhancing the criteria for receiving the grant, to incorporate some kind of acknowledgement of achievement within their programs. We believe this to be beneficial to the people using the training programs, based on trends among organizations interviewed. Some CTCs noted that they give their clients awards upon completion of training, one even stated that they give certifications out that state participants are proficient in specifics programs, like Microsoft Word or Excel.
With this, we recommend that the grant criteria be changed to require an organization provide some certificate or acknowledgment of classes completed. Either as an overall requisite or as an additional award allotment, the use of certificates of completion would instill a sense of accomplishment in participants, as some CTCs noted with similar program elements. If implemented as an additional set of funds, the award could go out to at least one organization in each of the major areas of the state, as a test for the success of the certificates in each regional setting. Additionally, notifying all organizations of those that have these certificate programs would allow participants that want some proof of the class a referral to the nearest CTC that has them.
We would also recommend that these certificate programs be standardized statewide, to remain consistent in the ‘value’ of the certificate of completion. With standardization in accordance with necessary skills learned, there is also an opportunity for the State of Illinois to ‘back’ the certificates. Having this credibility from the state

34
could allow participants to use them in the job market, as proof of skills as acknowledged by a larger authority.
Following this recommendation, another change to the criteria would be to have standardized classes across the board. From the interviews almost all organizations have made changes to their programs since first receiving the grant. They go through a period of trial and error before they figure out what works. This leads to inefficiency at the start that could be curbed if the organization was given guidelines as to how their training programs should be set up.
Collaboration
Stemming from the last point, it is crucial that the centers near each other collaborate with one another to share best practices, refer clients, and know what programs are being offered. This would be need to happen in order for the previous recommendation to really be beneficial. One of the most important collaborations that we see with this program is between the non-‐profits and the libraries. Since these organizations often have different approaches to the technology programs, they have the ability to ‘feed’ off of each other to achieve greater outcomes.
Generally, the libraries interviewed had a large amount of people using their services, but their programs center mainly around the basic use of technology. This includes computer and Internet operation, as well as use of open computer labs. In contrast, non-‐profit organizations had a strong employment undertone to their programs. Non-‐profits largely help their clients receive and retain employment, with activities such as software training, resume building, and G.E.D. prep.
As survey responses indicate the two most frequent ways individuals learn about training programs are through previous visits to the organization and referrals, increasing the amount of information about organizational activities at other organizations should increase use of services area-‐wide. Specifically, providing information about other area programs during the technology training classes, or as a flyer on the desktop background of open lab computers will target individuals specifically seeking out these activities.
Ideally, non-‐profits would make referrals to libraries so clients can take advantage of their open hours and individualized resources. In turn, the libraries could post and provide information to patrons about further technology and workforce
35
training at local non-‐profit CTCs. Not only would this help increase overall use of services, it would provide clients with opportunities to advance their skills or utilize them more frequently.
Communication
The last recommendation for increasing efficiency among organizations relates to communication between CTCs, the grant program, and the larger DCEO. The Capstone team recommends the development of a system of contact statewide (and perhaps regionally), whereby the Advisory Committee or other agency or program representatives could maintain. The easiest and most efficient way to reach all of the grantees would be through an email list such as listserv. Email addresses are already obtained via the grant application process, and could easily be used for program communication.
The Committee (or relevant program representative) could use this to send out program information, trends, and best practices to organizations across the state. It could even be a two-‐way system, meaning the organizations could contact the Committee through the email list, if they have questions or information to share. This could be an opportunity to solicit information about each organization’s programs, for use in updates to the greater CTC community.
Organizations could also be contacted based on geographical regions, and the listserv could be used to foster regional CTC communities. As we previously noted the differences in economic conditions across Illinois, developing regional communications would help strengthen the ties between specific workforce trends in the area and CTC program offerings. If needed, the DCEO would also be able to target specific areas with relevant information about other workforce development opportunities there. This would help facilitate collaboration between organizations that are located in close proximity for our recommendations for information sharing as well.
Conclusion In Conclusion, by honing in on the various organizational objectives that the Illinois Department of Commerce and Economy Opportunity, Advisory Committee, and the Smart Chicago Collaborative have to help eliminate the digital divide, we were able to analyze some of the state’s Community Technology Centers. By focusing on the

36
Eliminate the Digital Divide grant recipients, we were able to analyze their programs through surveys and interviews, identify trends, and discover ways in which these CTCs could maximize their grant awards.
The Digital Divide is a multifaceted issue, and we identified ways in which the technology centers could improve CTC efforts to assist the communities they serve. It is financially detrimental to some members of society if they do not acquire technological skills. Many employers require some level of technology skills in order to qualify for a position. This, in turn, shows what an invaluable asset Community Technological Centers are in helping those who would not normally have the opportunity for advancing their knowledge of technology.
By choosing organizations that are representative of the greater grant recipients, we were able to discern trends among the programs and the types of technological subject matter they taught through interviews and surveys. This in turn led us to findings and recommendations that are conducive to the program’s success. These interviews allowed us to create a dialect with organizations to enhance or understanding of their purposes. Each organization has the capability to provide for the needs of citizens in their areas; catering to their clientele will enrich the programs that each Community Technology Center has.
Of our findings it should be noted that the Edge Initiative could be a reliable avenue for Community Technologies Centers to gauge their technology services. In addition, since we found libraries often did not collaborate with other CTCs, we recommend that they start bridging the gap, while the grant program could promote more collaboration. Due to the fact a large number of Community Technology Centers reported to us that hands-‐on interactions works best for the clients, they can be given the opportunity to decide what an adequate staff to student ratio is. This could then be adjusted, over time, for the numerous variables that might arise. Furthermore, the grant recipients that were surveyed all focused on education, one even offering a literacy program by use of grant funds. Next, we believe that a more in-‐depth investigation can be done on the quality of knowledge gained from non-‐profit organizations as compared to libraries.
Generally, we found that most centers used the grants for the same types of expenditures, which can be used to compare the organizations. Theoretically the same cost and items used should bring about the same result. The key factor we found was hands on training using the technology. Also small class size, and exceptional communication was essential to programs success rates.
37
The recommendations presented are a necessity to help the participants advance into and with a more technological future. We believe that criteria to receive the grant should exist, as having comprehensive guidelines will allow for a more objective comparison of programs. The recipients should also be more responsible for giving data to the Digital Divide Advisory Committee via the Illinois Department of Economy and Commerce.
During the interview process we noticed that there was some overlap in types of programs. That is where a increased collaboration and conversation about what is being done at each organization would be beneficial. The system could assist in the future program functions for many CTCs. A listserv or email group would be a helpful and logical first step. Continuing that idea, there could potentially be a network of document or information sharing for all the locations to use while participating in the program.
With the guidance of the Digital Divide Advisory Committee and the Department of Commerce and Economy and Opportunity, we know that these programs can and do good work in their communities. However, many still require further steps in order to reach their full potential, and would benefit substantially from our suggestions. Doing so would allow participants to accomplish professional goals and attain knowledge, while Community Technology Centers provide a more efficient, outstanding public service.

38
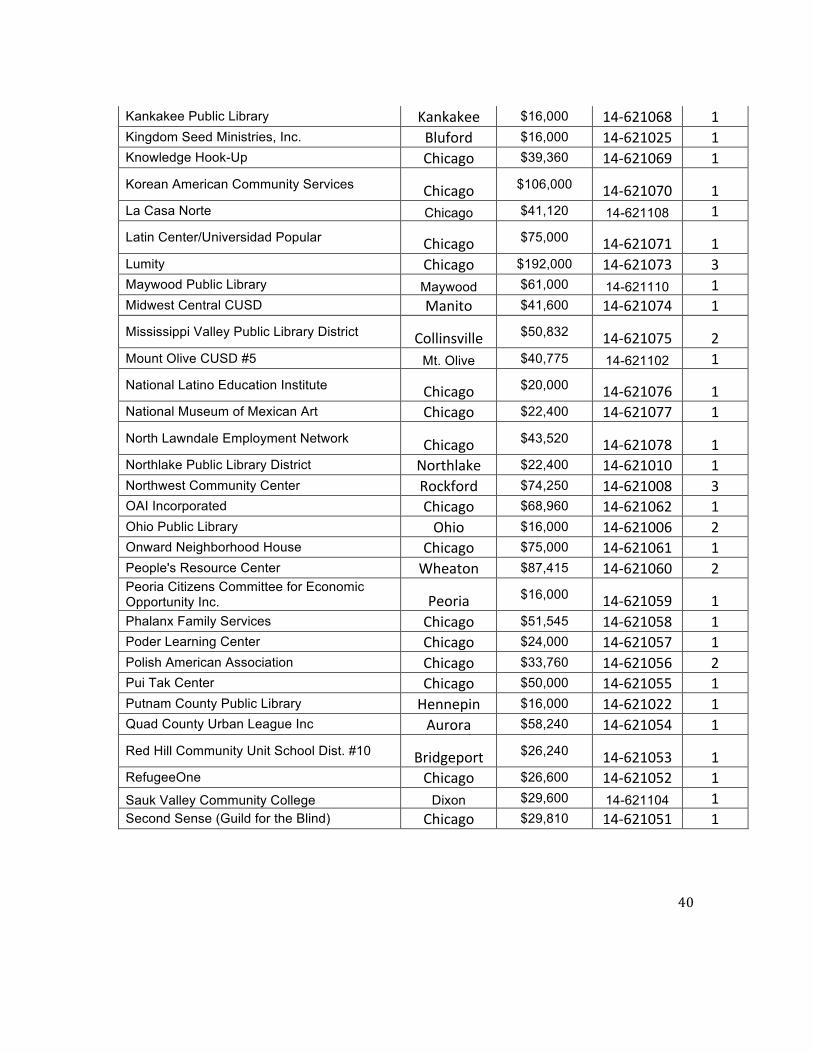
Appendix l Current list of grantees
APPLICANT City
Funding GRANT
Number of CTCs
A Safe Haven Chicago $25,667 14-‐621002 1
African American Christian Foundation Oak Park $16,000 14-‐621079 1
Albany Park Community Center, Inc Chicago $75,000 14-‐621080 1 Alsip Merionette Park Library Alsip $16,000 14-‐621081 1 Anna Bixby Women's Center Harrisburg $16,000 14-‐621082 1 Association House of Chicago Chicago $48,800 14-‐621083 1
Aunt Martha's Youth Services Center, Inc Olympia Fields
$16,000 14-‐621084 1
Beloved Community Family Services, Inc. Chicago $16,000 14-‐621024 1
Bethalto Public Library district/village of Bethalto/Bethalto Seniors Bethalto
$75,000 14-‐621085 5
Bethel New Life Chicago $32,000 14-‐621086 1 Black Hawk College Moline $85,338 14-‐621001 3 Boys and Girls Clubs of Chicago General Robert E. Wood Chicago $26,880 14-621107 1 Breakthrough Urban Ministries Chicago $28,800 14-‐621087 1 Broadview Public Library District Broadview $14,243 14-‐621013 1 Cahokia Public Library Cahokia $21,370 14-‐621003 1
Casa Central Social Services Corporation Chicago $75,000 14-‐621088 1 Catholic Charities of the Archdiocese of Chicago Chicago $45,782 14-‐621089 2 Center on Halsted Chicago $31,360 14-‐621090 1
Centralia Regional Library District Centralia $44,150 14-‐621091 1
Chicago Heights Free Library Chicago Heights
$52,000 14-‐621015 1
Chicago Ridge Public Library Chicago Ridge
$65,215 14-‐621014 1

39
Chinese American Service League Chicago $64,000 14-‐621092 1
Christian Activity Center Inc East St. Louis
$38,400 14-‐621093 1
Colona District Public Librarly Colona $16,000 14-‐621029 1 Community College District #536 Godfrey $75,000 14-‐621094 8 Corazon Community Services Cicero $28,000 14-‐621017 2 Creve Coeur Creve Coeur $16,000 14-‐621018 1
East St. Louis Community College East St. Louis
$21,120 14-‐621096 1
Eldorado Memorial Public Library District Eldorado $28,417 14-‐621007 1 Enlace Chicago Chicago $20,800 14-‐621097 1 Erie Neighborhood House Chicago $89,440 14-‐621098 2
Ethiopian Community Association of Chicago Chicago $17,600 14-‐621099 1
Evergreen Park Public Library Evergreen Park
$63,987 14-‐621100 1
Fishes & Loaves Outreach Ministries Springfield $16,000 14-‐621028 2 Fountaindale Public Library District Bolingbrook $64,000 14-‐621021 1
Frank Bertetti Benld Public Library Benld $16,000 14-‐621009 1
Frida Kahlo Community Organization Chicago $20,480 14-‐621023 2
Hanul Family Alliance Mt. Prospect
$16,000 14-‐621101 1
Harvey School District #152 Harvey $16,000 14-‐621016 1 Howard Area Community Center (HACC) Chicago $32,000 14-‐621050 1 Illinois Migrant Council Chicago $25,600 14-‐621044 1 IMPACT Family Center Chicago $29,600 14-621103 1
Industrial Council of Nearwest Chicago Chicago $40,800 14-‐621063 1 Institute for Latino Progress Chicago $51,200 14-‐621064 1 Jane Addams Resource Corporation Chicago $29,700 14-‐621065 1 Jewish Vocational Service and Employment Center Chicago $54,400 14-‐621066 3 John Wood Community College Quincy $22,950 14-‐621067 1
40
Kankakee Public Library Kankakee $16,000 14-‐621068 1 Kingdom Seed Ministries, Inc. Bluford $16,000 14-‐621025 1 Knowledge Hook-Up Chicago $39,360 14-‐621069 1
Korean American Community Services Chicago $106,000 14-‐621070 1 La Casa Norte Chicago $41,120 14-621108 1 Latin Center/Universidad Popular Chicago $75,000 14-‐621071 1 Lumity Chicago $192,000 14-‐621073 3 Maywood Public Library Maywood $61,000 14-621110 1 Midwest Central CUSD Manito $41,600 14-‐621074 1
Mississippi Valley Public Library District Collinsville $50,832 14-‐621075 2 Mount Olive CUSD #5 Mt. Olive $40,775 14-621102 1 National Latino Education Institute Chicago $20,000 14-‐621076 1 National Museum of Mexican Art Chicago $22,400 14-‐621077 1
North Lawndale Employment Network Chicago $43,520 14-‐621078 1 Northlake Public Library District Northlake $22,400 14-‐621010 1 Northwest Community Center Rockford $74,250 14-‐621008 3 OAI Incorporated Chicago $68,960 14-‐621062 1 Ohio Public Library Ohio $16,000 14-‐621006 2 Onward Neighborhood House Chicago $75,000 14-‐621061 1 People's Resource Center Wheaton $87,415 14-‐621060 2 Peoria Citizens Committee for Economic Opportunity Inc. Peoria $16,000 14-‐621059 1 Phalanx Family Services Chicago $51,545 14-‐621058 1 Poder Learning Center Chicago $24,000 14-‐621057 1 Polish American Association Chicago $33,760 14-‐621056 2 Pui Tak Center Chicago $50,000 14-‐621055 1 Putnam County Public Library Hennepin $16,000 14-‐621022 1 Quad County Urban League Inc Aurora $58,240 14-‐621054 1
Red Hill Community Unit School Dist. #10 Bridgeport $26,240 14-‐621053 1 RefugeeOne Chicago $26,600 14-‐621052 1 Sauk Valley Community College Dixon $29,600 14-621104 1 Second Sense (Guild for the Blind) Chicago $29,810 14-‐621051 1

41
Southland Health Care Forum Chicago Heights
$75,000 14-‐621030 1
Southtown Youth Programs Center (Southtown Family Center) Mt. Vernon $49,600 14-‐621031 1
Spanish Coalition for Housing Chicago
$16,000 14-‐621032 1
Spoon River College Canton $63,800 14-‐621033 2 Springfield Urban League Springfield $26,400 14-‐621034 1 Steger-South Chicago Heights Library Steger $16,000 14-‐621035 1 Streator Public Library Streator $16,000 14-‐621027 1
TEC Services Consulting, Inc. Naperville $68,800 14-‐621026 3 The Cara Program Chicago $46,518 14-‐621037 2 The Jackson Initiative Mounds $75,000 14-‐621005 3 Tower of Refuge Springfield $24,000 14-621109 1 Tri-County Urban League, Inc Peoria $20,480 14-‐621038 1 Tri-Point CUSD #61 Kempton $20,800 14-‐621040 1 UMMA Urban Muslim Minority Alliance Waukegan $24,160 14-‐621041 1 United Cerebral Palsy of Illinois Prairieland Joliet $16,000 14-‐621042 1 University of IL at Urbana-Champaign Champaign $108,000 14-‐621043 9
Urban League of Metropolitan St. Louis Inc Fairview Heights
$16,000 14-‐621045 1
Village of Pulaski Pulaksi $16,000 14-‐621020 1
Village of South Holland - Public Library South Holland
$72,570 14-‐621046 1
Vision of Restoration Maywood $62,875 14-‐621047 1 Waukegan Public Library Waukegan $75,000 14-‐621048 1
Wodstock Public Library Woodstock $16,000 14-‐621049 1 Wood Dale Public Library District Wood Dale $23,550 14-‐621039 1 Youth Job Center of Evanston Evanston $16,000 14-‐621011 1 Youth Service Project Chicago $21,600 14-621105 1 Total dollars: $4,197,679 Total CTCs: 151

42

43
Appendix l Continued Map of grantee with unemployment rate

44

45
Appendix ll Grantees Targeted Chicago Area
• Association House of Chicago o Amount Awarded: $48,800 o Interviewed
• Industrial Council of Nearwest Chicago o Amount Awarded: $40,800
• Universidad Popular o Amount Awarded: $75,000 o Interviewed
• Chicago Ridge Public Library o Amount Awarded: $65,215 o Interviewed
• Phalanx Family Services o Amount Awarded: $51,545 o Interviewed
• Impact Family Center o Amount Awarded: $29,600
• Waukegan Public Library o Amount Awarded: o Interviewed
• Fountain Dale Public Library o Amount Awarded: $64,000
Aurora/Naperville
• Quad County Urban League o Award Amount: $58,240 o Interviewed
• TEC Services Consulting

46
o Award Amount: $68,800 o Interviewed
Rockford
• Northwest Community Center o Award Amount: $74,250 o Interviewed
Peoria
• Tri-‐County Urban League o Amount Awarded: $20,480 o Interviewed
• Creve Coeur Public Library o Amount Awarded: $16,000 o Interviewed
• Streator Public Library o Amount Awarded: $16,000 o Interviewed
Springfield
• Fishes and Loaves Outreach Ministries o Amount Awarded: $16,000-‐ o Interviewed
• Springfield Urban League o Amount Awarded: $26,400
St. Louis Metro
• Christian Activity Center o Amount Awarded: $38400 o Interviewed
• Urban League of Metro St. Louis o Amount Awarded: $16,000

47
Downstate Rural
• Eldorado Public Library District o Amount Awarded: $28416
• The Jackson Initiative o Interviewed o Amount Awarded: $75,000
• Red Hill Community Unit District No. 10 o Interviewed o Amount Awarded: $26,240
• Kempton School o Amount Awarded: $20,800

48
Appendix lll Interview Questions
1. What do you do at this organization? Responsibilities/Tasks.
2. What types of programs or training are offered through your organization?
3. What types of programs or training are offered through your organization?
4. How many times have you received the grant? Total?
5. Does your organization receive any other grants that relate to the digital divide or an improvement in job skills?
6. What are other funding sources for the organization as a whole?
7. Can you give me a quick breakdown of what the DCEO grant money actually goes
into? Is it to pay staff or the purchasing of computers and other technology? How many classes and/or students does this grant facilitate in your program?
8. How does your organization stay up to date with technology change? Are there
any current plans for your organization to update technology or change programming to stay current?
9. What are your methods of communication for these programs? Are there some
methods of communication you find most effective? Method you use the most?
10. Do you currently have affiliation or contact with any other technology or employment related organizations? In what ways?
11. What is the average amount of people served monthly?
12. Do you monitor or distinguish activity levels of clients?
13. If organization does more than tech training, what percentage is tech related?
14. Does your organization currently assess performance of your programs offered?

49
15. Does your organization assess performance of the clients you serve? Any metrics
on how their outcome is? Do you have data on successes?
16. Since the start of the program what changes or adjustments have been made based on clients and results? What are the improvements made?
17. In your opinion, what is the best/most efficient way to train people on
technology? Best practices developed?

50
Appendix lV Survey Questions
• How comfortable are you in using computers?
• How comfortable are you in using the Internet?
• Please select the type of technology program in which you participated, or are currently enrolled.
• Please select any skills or software that you learned while at this training center.
• Why did you decide to take this class?
• How did you learn about this program?
• Was program offered at a convenient time?
• If No, when would be the most convenient time?
• Does this center have programs for further technology training?
• If this center did provide further training, how likely would you continue with
additional classes/training?
• What kinds of classes would be most beneficial?
• Please indicate whether you agree with the following statements: • Attending a training class or open access time has increased my
understanding of technology. • This training program has helped me make better use of technology and
information found on the Internet. • The training program has opened up more opportunities for
employment.

51
• Please provide any additional feedback on the benefits or drawbacks of this program.
• If you are currently employed, have the skills from this training course helped in
getting a job or in your current workplace?
• If yes, which skills helped and where did they help?
• If you are not currently employed, has this training course changed the types of jobs you apply for, the way you apply for jobs, or the skills you list on your resume?
• If yes, in what area?
• Do you use computers more frequently than before the program?
• Do you use computers for different things than before the program?
• If yes, where has your activity increased?
• Would you say the importance of computers in your life changed since
completing the program?
• If yes, please explain how.

52
Appendix V Survey Frequency Tables
Computer Comfort Level
Frequency Percent Valid Percent
Cumulative
Percent
Valid Very
Uncomfortable 5 3.8 3.8 3.8
Somewhat
Uncomfortable 10 7.5 7.5 11.3
Neutral 16 12.0 12.0 23.3
Somewhat
Comfortable 30 22.6 22.6 45.9
Very Comfortable 72 54.1 54.1 100.0
Total 133 100.0 100.0
Internet Comfort Level
Frequency Percent Valid Percent
Cumulative
Percent
Valid Very Uncomfortable 5 3.8 3.8 3.8
Somewhat
Uncomfortable 12 9.0 9.0 12.8
Neutral 16 12.0 12.0 24.8
Somewhat
Comfortable 25 18.8 18.8 43.6
Very Comfortable 75 56.4 56.4 100.0
Total 133 100.0 100.0

53
How did you hear about class?
Frequency Percent
Valid
Percent
Cumulative
Percent
Valid No Response 1 .8 .8 .8
Other 6 4.5 4.5 5.3
Referral 28 21.1 21.1 26.3
Website/Flyer 15 11.3 11.3 37.6
Previous Visit 83 62.4 62.4 100.0
Total 133 100.0 100.0
How likely to continue training?
Frequency Percent
Valid
Percent
Cumulative
Percent
Valid Don’t Know 4 3.0 3.0 3.0
Very Unlikely 1 .8 .8 3.8
Neutral 5 3.8 3.8 7.6
Somewhat Likely 26 19.5 19.7 27.3
Very Likely 96 72.2 72.7 100.0
Total 132 99.2 100.0 Missing System 1 .8
Total 133 100.0
Technology Training Class has Increased Understanding of Technology
Frequency Percent
Valid
Percent
Cumulative
Percent
Strongly Disagree .0 .0 .0 .0
Valid Somewhat Disagree 1 .8 .8 .8

54
Neither Agree/Disagree 6 4.5 4.5 5.3
Somewhat Agree 36 27.1 27.3 32.6
Strongly Agree 89 66.9 67.4 100.0
Total 132 99.2 100.0 Missing System 1 .8
Total 133 100.0
Training Helped Make Better Use of Technology and Information on Internet
Frequency Percent
Valid
Percent
Cumulative
Percent
Valid Strongly Disagree 1 .8 .8 .8
Somewhat Disagree 1 .8 .8 1.5
Neither Agree/Disagree 8 6.0 6.1 7.6
Somewhat Agree 30 22.6 22.7 30.3
Strongly Agree 92 69.2 69.7 100.0
Total 132 99.2 100.0 Missing System 1 .8
Total 133 100.0
Training has opened more opportunities for employment
Frequency Percent
Valid
Percent
Cumulative
Percent
Valid Strongly Disagree 1 .8 .8 .8
Somewhat Disagree 1 .8 .8 1.5
Neither Agree/Disagree 17 12.8 12.9 14.4
Somewhat Agree 21 15.8 15.9 30.3
Strongly Agree 92 69.2 69.7 100.0
Total 132 99.2 100.0 Missing System 1 .8
Total 133 100.0

55
If currently employed, has skill helped in getting a job or in workplace?
Frequency Percent Valid Percent
Cumulative
Percent
Valid Not Sure 21 15.8 15.9 15.9
No 40 30.1 30.3 46.2
Yes 71 53.4 53.8 100.0
Total 132 99.2 100.0 Missing System 1 .8
Total 133 100.0
If not currently employed, has skill changed types of jobs or skills you list?
Frequency Percent Valid Percent
Cumulative
Percent
Valid Not Sure 21 15.8 20.2 20.2
No 15 11.3 14.4 34.6
Yes 68 51.1 65.4 100.0
Total 104 78.2 100.0 Missing System 29 21.8
Total 133 100.0
Do you use computers more frequently than before the program?
Frequency Percent Valid Percent
Cumulative
Percent
Valid No 20 15.0 15.3 15.3
Yes 111 83.5 84.7 100.0
Total 131 98.5 100.0 Missing System 2 1.5
Total 133 100.0
Do you use computers for different things than before the program?

56
Frequency Percent Valid Percent
Cumulative
Percent
Valid No 18 13.5 13.7 13.7
Yes 113 85.0 86.3 100.0
Total 131 98.5 100.0 Missing System 2 1.5
Total 133 100.0
Would you say the importance of computers has changed since program?
Frequency Percent
Valid
Percent
Cumulative
Percent
Valid No Response 2 1.5 1.5 1.5
Decreased 1 .8 .8 2.3
Stayed the Same 15 11.3 11.3 13.5
Increased 115 86.5 86.5 100.0
Total 133 100.0 100.0
How long do you spend per week on the internet AT HOME?
Frequency Percent Valid Percent
Cumulative
Percent
Valid No Response 2 1.5 1.5 1.5
None 84 63.2 63.2 64.7
1-3 hours 25 18.8 18.8 83.5
3-6 hours 16 12.0 12.0 95.5
6-10 hours 2 1.5 1.5 97.0
10+ hours 4 3.0 3.0 100.0
Total 133 100.0 100.0
How long do you spend per week on the internet AT A LIBRARY?

57
Frequency Percent Valid Percent
Cumulative
Percent
Valid No Response 2 1.5 1.5 1.5
1-3 hours 114 85.7 85.7 87.2
3-6 hours 15 11.3 11.3 98.5
6-10 hours 2 1.5 1.5 100.0
Total 133 100.0 100.0
How long do you spend per week on the internet AT A CTC?
Frequency Percent Valid Percent
Cumulative
Percent
Valid No Response 3 2.3 2.3 2.3
None 11 8.3 8.3 10.5
1-3 hours 74 55.6 55.6 66.2
3-6 hours 25 18.8 18.8 85.0
6-10 hours 7 5.3 5.3 90.2
10+ hours 13 9.8 9.8 100.0
Total 133 100.0 100.0
How long do you spend per week on the internet ON SMARTPHONE/TABLET?
Frequency Percent Valid Percent
Cumulative
Percent
Valid None 48 36.1 36.6 36.6
1-3 hours 49 36.8 37.4 74.0
3-6 hours 22 16.5 16.8 90.8
6-10 hours 5 3.8 3.8 94.7

58
10+ hours 7 5.3 5.3 100.0
Total 131 98.5 100.0 Missing No Response 2 1.5
Total 133 100.0
Open Answer Responses Why did you decide to take this class? General Interest in Computer Skills
1. To learn about computers so i won't mess nothing up on mines 2. To learn how to use a computer 3. To do the Microsoft Courses 4. To learn about the Microsoft Courses 5. to learn more about how to do stuff on computers 6. because i don't really know how to use computers 7. Just come in to print and check my email, they taught me how to do things in my
email 8. to learn about computer applications 9. to learn how to type and using messaging services 10. learn more about computers 11. to learn how to operate a computer 12. To learn about computer. 13. Because i ended up getting a virus on my computer so i started going to the lab
to learn more to prevent myself from paying lots of money to get it fixed 14. To improve my computer skills 15. to learn shortcuts and ways to navigate my email 16. To be able to get up to date on the new age on tech 17. to gain more knowledge about computers 18. To learn to use a computer 19. to enhance my computer skills 20. neededtolearnmore 21. I took this training because I'm not computer savvy. 22. I wanted to learn how to communicate through email.

59
23. To learn how to use the computer. 24. to learn more about computers and to feel at ease while using. 25. To improve my computer literacy 26. because, I wanted to learn more about computer,s 27. To learn more about computers. 28. I wanted to learn more about MOS 2010 29. so i can be better at assessing my computer skills 30. To get a better fell of how computers work so that I can compete my digital
literacy courses 31. Because I wanted to learn how to type. 32. For a better termanoloy of the computer system 33. To learn more about the computer system and how to do programming. 34. To learn new skills 35. For literacy help 36. For awareness 37. For unerstanding 38. Typing 39. to up date my computer skills 40. to learn computer skills and to be able to different things on the computer 41. I want to be computer literate also learn Microsoft word power points also how
to do schedules send emails 42. To get more skill in learning computers 43. so I can learn how to work on computers and do different things with it 44. To learn more about computers and email 45. compter skills 46. Because I'm interested in the computer classes. 47. The number one reason I took the class was, it's free. Being realistic, I have a lap
top and I wanted to learn the right way to operate it.
Special Use
1. Because I'm legally blind and can't see that much but i neve really usd a computer and they can make it big enough for me to see it
2. To apply for the CHA Waitlist 3. CHA Waitlist Application

60
4. So i can find a house 5. CHA Waitlist 6. To put my written book on file.
General Use
1. Was asked by a friend 2. I Don't take any classes 3. To possible teach my children one day 4. I did not take a class 5. I came in to get something printed but the staff was good people 6. Because it's free skills, don't know why everyone don't take advantage of this 7. To take advantage of all the free opportunities. 8. i went there to utilize the computer
Jobs and Education
1. It was helpful to get a job. 2. I came in to learn how to do my resume. 3. I'm currently job hunting. 4. To build my skills 5. To help me with learning the computer to better assist me with job searches and
the application process. 6. Because I needed to advance my skills for a higher position with in my job. 7. To go online to look for a job 8. To compose resumes and cover letters for the various job positions that I am
applying for 9. To add skills to my resume 10. I came in to use a fax machine but they didn't have one but instead they just
scanned my resume and put it on my email, i didn't know you could do that 11. I start coming in to find a job and then i started learning other things in the
process 12. To look for a job, then i found out that they help you look for jobs too and help
you with resumes and stuff so i come in every other day now 13. to look for a job 14. To apply my skills toward future and better positions 15. to add to resume

61
16. To gain skills so can get a better job 17. To learn more about computers and try to find a job 18. To improve my skills at work 19. I came to do job apps, then found out they taught classes and had a GED class
too 20. I know how to use computers i just go to fill out job applications and check my
email 21. I just come to look for jobs and check email 22. I just come here to learn how to get to websites so i can fill out job applications 23. to fill out job applications 24. My boss Mr. Dave Hicks suggested that I take this class in order to sharpen my
skills for the job for which I am currently employed at the Northwest Community Center of Rockford, IL
25. To better myself with my career and for myself and my children's future in having a better career and in my sucess with my accomplishment
26. To obtain a G.E.D. certificate and to learn social skills. 27. To gain the skills to prepare for the g.e.d test and also to have basic computer
skills. 28. becasuse the G.E.D TEST IS ON THE COMPUTER
What kinds of classes would be most beneficial?