Embed Size (px)
Citation preview
Message Tracing and Debugging in WSO2 Enterprise Service Bus
Presenters :❖ Rajith Vitharana Senior Software Engineer, WSO2❖ Nuwan Pallewela Software Engineer, WSO2
Agenda
● About ESB 5.0.0 release● Mediation Debugging with ESB
○ How to connect debugger with server○ Demonstrate debugger capabilities○ Main features○ Behaviour○ How to debug different tenants
● Message Tracing with ESB● Q & A
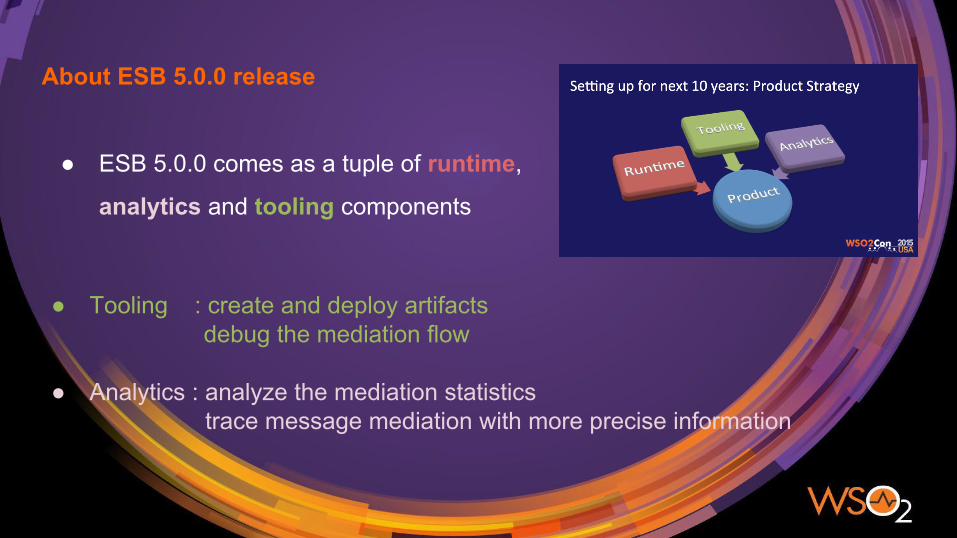
About ESB 5.0.0 release
● ESB 5.0.0 comes as a tuple of runtime,
analytics and tooling components
● Tooling : create and deploy artifacts debug the mediation flow
● Analytics : analyze the mediation statistics trace message mediation with more precise information

Mediation debugging with ESB
Requirements to perform debugging
● WSO2 ESB v5.0.0 and ESB Tooling v5.0.0 needed
● Need to establish a connection between server and tool
How to connect debugger with server
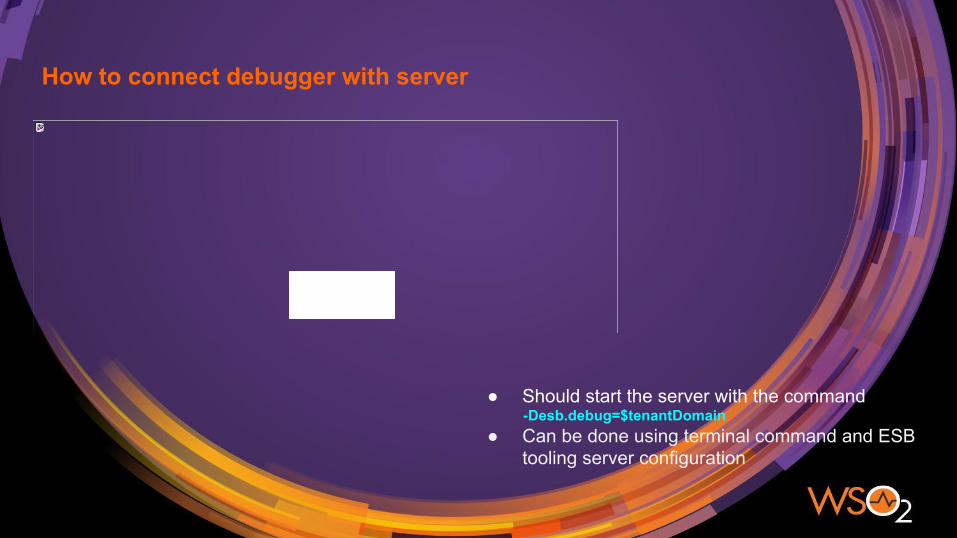
● Should start the server with the command -Desb.debug=$tenantDomain
● Can be done using terminal command and ESB tooling server configuration

How to connect debugger with server
● Server startup will suspend and listening to configured ports● Ports were defined in
[esb_home]/repository/conf/synapse.properties
How to connect debugger with server
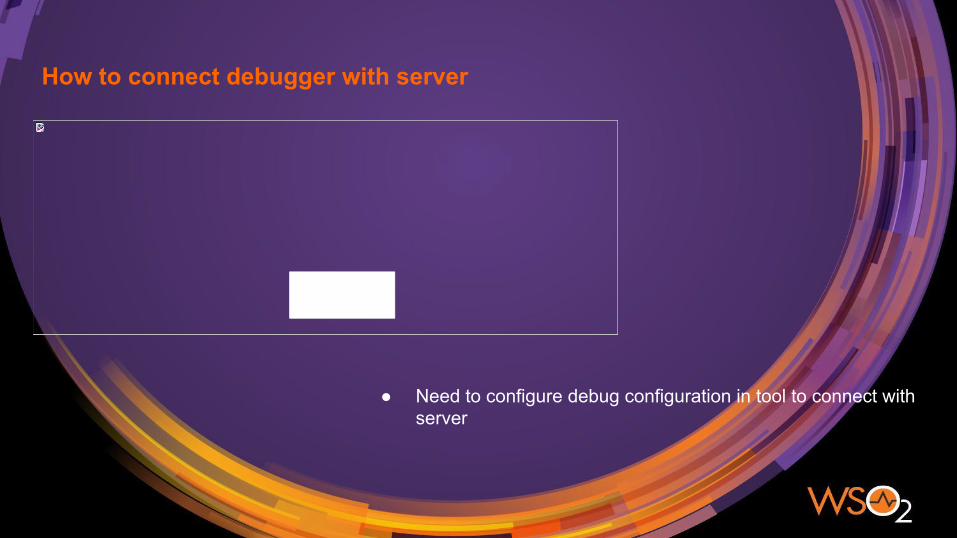
● Need to configure debug configuration in tool to connect with server
How to connect debugger with server
● Connect with server to enable debugging● Time out value is 60 seconds

How to connect debugger with server
● Server will resume the startup after successful connection or timeout
Diagram of Use Case to Demonstrate Mediation Debugging
Features of Mediation Debugger
● Can mark breakpoints and skippoints
● Can view the Message Envelope and runtime properties
● Can manage runtime properties○ Inject new properties○ Modify property values○ Clear property values
Behaviour of Mediation Debugger
● Debug points need to be resend when a deployment happens in server
● Debugger works as a single threaded application
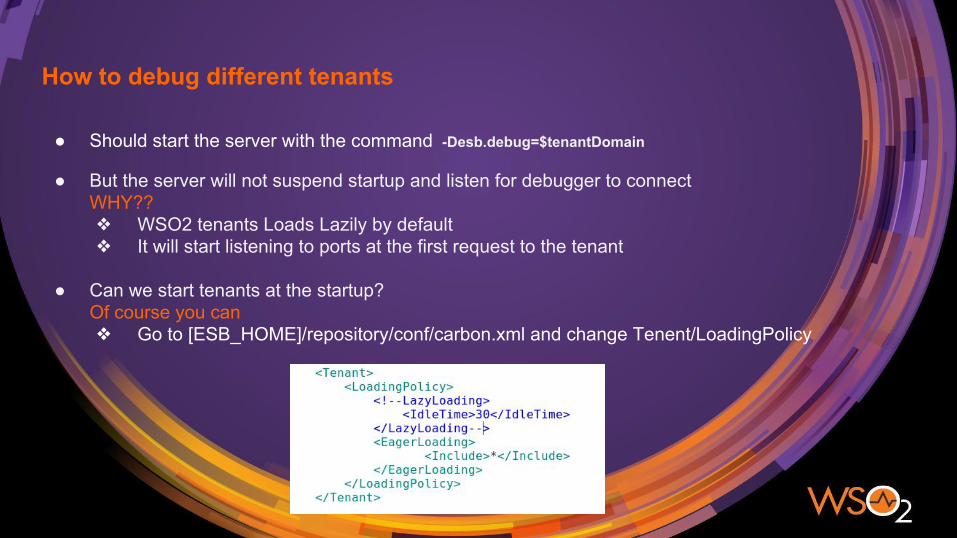
How to debug different tenants
● Should start the server with the command -Desb.debug=$tenantDomain
● But the server will not suspend startup and listen for debugger to connectWHY??❖ WSO2 tenants Loads Lazily by default❖ It will start listening to ports at the first request to the tenant
● Can we start tenants at the startup?Of course you can❖ Go to [ESB_HOME]/repository/conf/carbon.xml and change Tenent/LoadingPolicy
Message Tracing with ESB
ESB Analytics
What does it mean by ESB analytics?● Mediation statistics● Mediation Tracing
Mediation statistics
collection of statistical data relevant for a message flow● Time spent on each mediator● Time spent by each message● Fault count of a single message-flow
What is message tracing?
Message Tracing refers to recording of message status at each point of message flow.
● Message payload at a mediator (before, after)● Message Context Properties (before, after)● Message Transport-scope Properties (before,after)
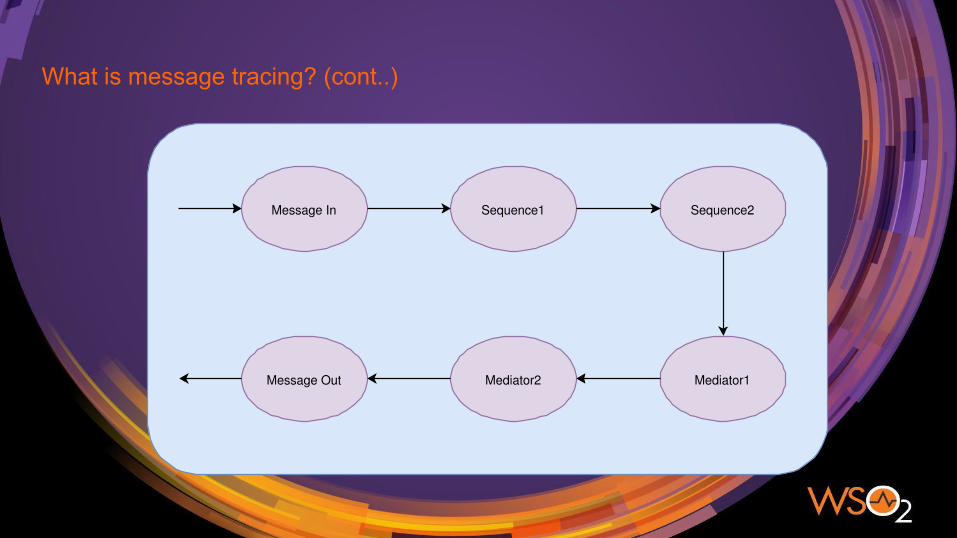
What is message tracing? (cont..)
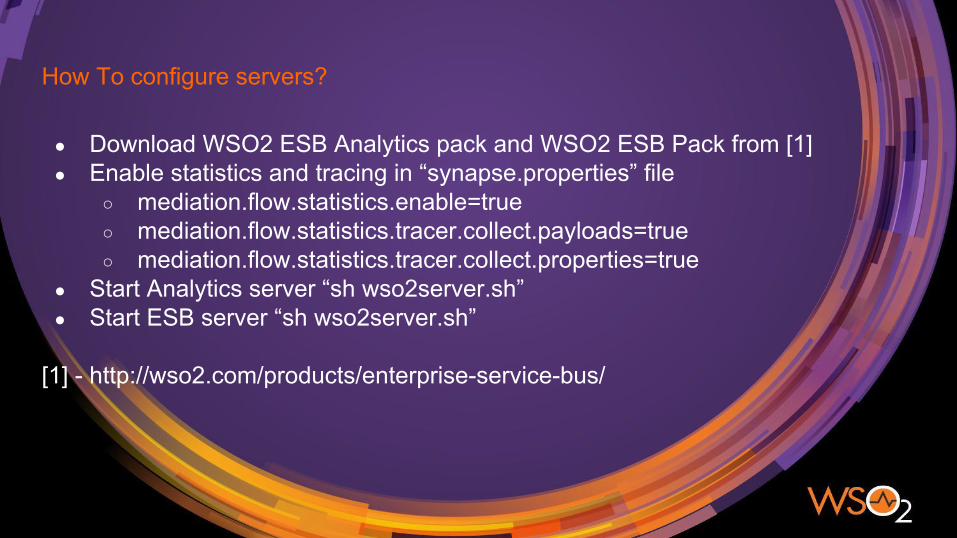
How To configure servers?
● Download WSO2 ESB Analytics pack and WSO2 ESB Pack from [1]● Enable statistics and tracing in “synapse.properties” file
○ mediation.flow.statistics.enable=true○ mediation.flow.statistics.tracer.collect.payloads=true○ mediation.flow.statistics.tracer.collect.properties=true
● Start Analytics server “sh wso2server.sh”● Start ESB server “sh wso2server.sh”
[1] - http://wso2.com/products/enterprise-service-bus/
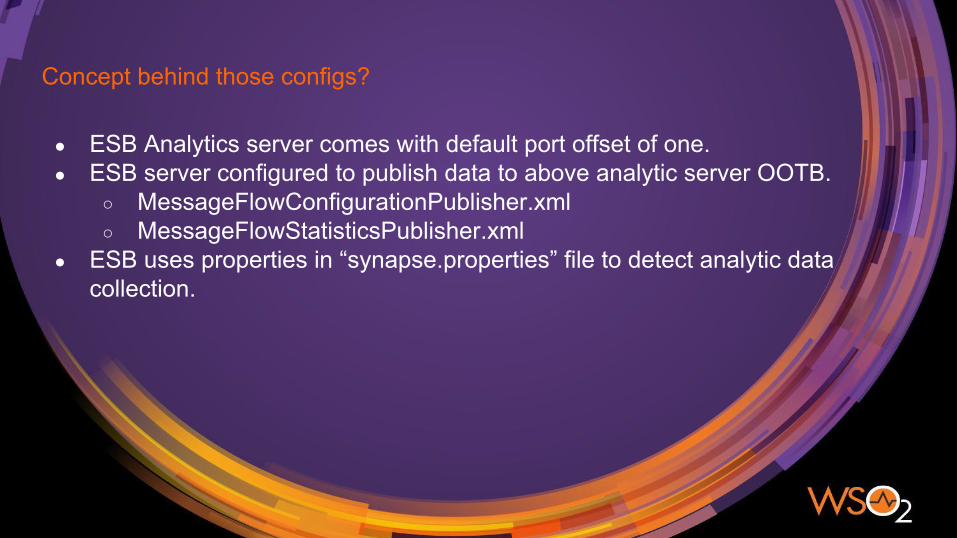
Concept behind those configs?
● ESB Analytics server comes with default port offset of one.● ESB server configured to publish data to above analytic server OOTB.
○ MessageFlowConfigurationPublisher.xml○ MessageFlowStatisticsPublisher.xml
● ESB uses properties in “synapse.properties” file to detect analytic data collection.
Next step
● Connect ESB Tooling product with ESB server○ Add ESB server as a remote server to Developer studio
● Create ESB project
Creating artifacts
We are going to use below scenario for this demonstration.● Invoke ESB proxy with stock Symbol and order Quantity.● Proxy will invoke the back end with that symbol to get a simple quote.● Generate response to send to front end.● Invoke back end with place order request for the symbol with given quantity.● Respond to the client with earlier created response.
Make sure to enable stat and tracing in ESB artifacts before deploying

Demo
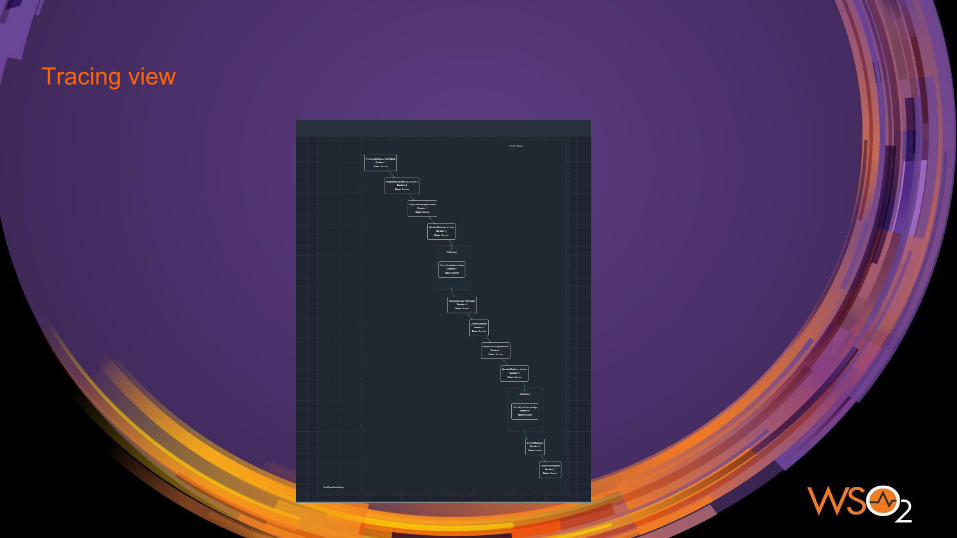
Tracing view
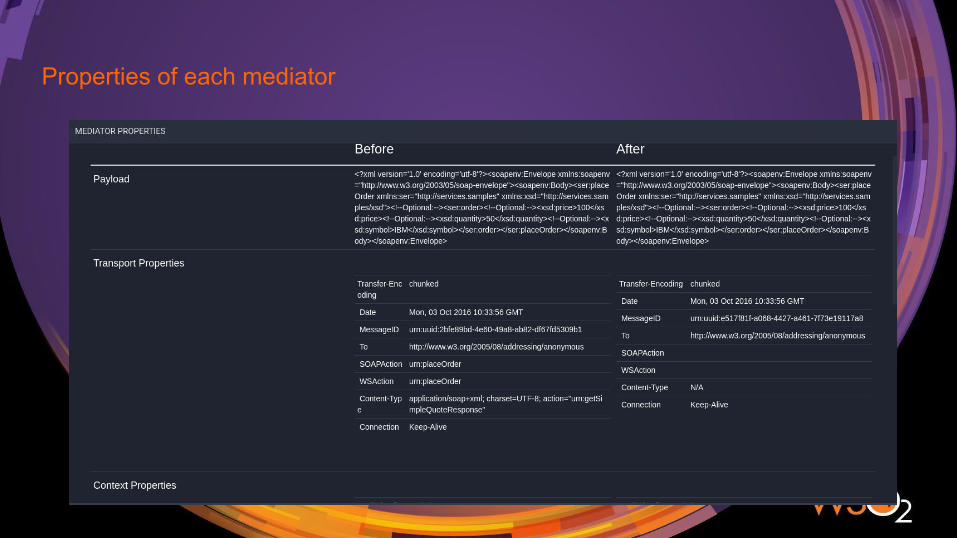
Properties of each mediator
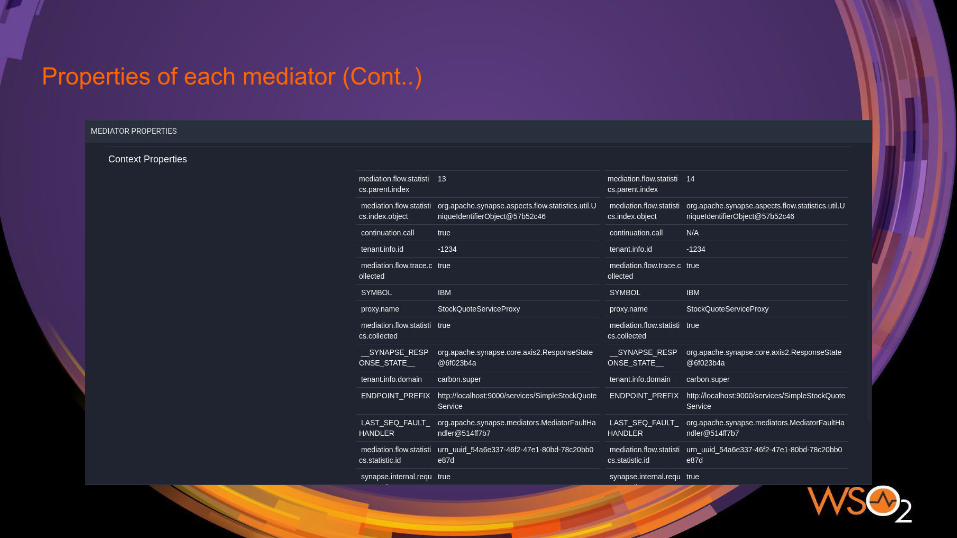
Properties of each mediator (Cont..)
Questions?

Thank You !


![Прокачиваем свою производительность [Debugging, Tracing and Profiling... yourself!]](https://img.pdfslide.net/doc/110x75/55a1702b1a28abf9668b4576/-debugging-tracing-and-profiling-yourself.jpg)