Embed Size (px)
Citation preview

Where Flow Charts Don’t Go:
© 2015 WhiteHat Security, Inc.
Jeremiah GrossmanFounderWhiteHat Security, Inc.Twitter: @jeremiahg
An Examination of Web Application Security Process Management

© 2015 WhiteHat Security, Inc.
Jeremiah Grossman15 years of Application SecurityBrazilian Jiu-Jitsu Black Belt

© 2015 WhiteHat Security, Inc.
WhiteHat Security
We help secure the Web by finding application vulnerabilities, in the source code all the way through to production, and help companies get them fixed, before the bad guys exploit them.
Founded: 2001Headquarters: Santa Clara, CAEmployees: 300+

© 2015 WhiteHat Security, Inc.
Metric DefinitionsAverage time time to fix:
Average # of days to fix a vulnerability.
Remediation Rate:
# of closed vulnerabilities divided by # of open vulnerabilities.
Days Open:
Average# of days a vulnerability has been open.
Vulnerability Class Likelihood:
# of sites that have at least one open vulnerability in a given class over the total number of active sites.
Window of Exposure:
# of days a site had at least one serious vulnerability open over the analysis period.
Serious Vulnerability: Vulnerability with a severity of 3 or greater as defined by WhiteHat’s Vulnerability Classification System.

© 2015 WhiteHat Security, Inc.
Vulnerability Likelihood and Windows of Exposure

© 2015 WhiteHat Security, Inc.
Vulnerability Likelihood

© 2015 WhiteHat Security, Inc.
• Likelihood of Insufficient Transport Layer Protection has increased in recent years (70% likelihood in 2014)
• Content Spoofing, XSS and Fingerprinting has declined in recent years– Content Spoofing (38% in
2010 to 26% in 2014)– Cross-site scripting (55%
in 2010 to 47% in 2014)– Fingerprinting (23% in
2012 to 5% in 2014)
Vulnerability Likelihood

© 2015 WhiteHat Security, Inc.
• A large % of websites are always vulnerable
• 60% of all Retail are always vulnerable
• 52% of all Healthcare and Social Assistance sites are always vulnerable
• 38% of all Information Technology websites are always vulnerable
• 39% of all Finance and Insurance websites are always vulnerable
Windows of Exposure Analysis
Finance and Insurance
Health Care and Social Assistance
Information Retail Trade
39%52%
38%
60%
14%
10%
11%
9%11%
12%
14%
10%18%11%
16%
11%17% 14%
22%11%
Always VulnerableFrequently Vulnerable 271-364 days a yearRegularly Vulnerable 151-270 days a year

© 2015 WhiteHat Security, Inc.
Maturity Metrics Analysis

© 2015 WhiteHat Security, Inc.
• The analysis is based on 118 responses on a survey sent to security professionals to measure maturity models of application security programs at various organizations.
• The responses obtained in the survey are correlated with the data available in Sentinel to get deeper insights. Statistics pulled from Sentinel are for 2014 timeframe.
Sentinel Customer Survey Overview
Active Customers: ~700Fortune 500: 63
Commercial Banks7 of the Top 18
Largest Banks10 of the Top 50
Software6 of the Top 16
Consumer Financial Services4 of the Top 8

© 2015 WhiteHat Security, Inc.
• 24% of the survey respondents have experienced a data or system breach
• Those who have experienced a data or system breach have higher average # of open vulnerabilities than those who haven’t experienced a breach. (20 vs. 26)
• Those who have experienced a breach have lower remediation rate than those who haven’t experienced a breach.
(42% vs. 39%)
Have organizations website(s) experienced a data or system breach resulting from an app layer vulnerability?
All
Finance and Insurance
Information
Retail Trade
Health Care and Social Assistance
76%
83%
80%
50%
0%
24%
17%
20%
50%
100%
NoYes

© 2015 WhiteHat Security, Inc.
• 56% of all respondents did not have any part of the organization held accountable in case of data or system breach.
If an organization experiences a website(s) data or system breach, which part of the organization is held accountable and what is it’s performance?
Board
of D
irect
ors
Exec
utive
Man
agem
ent
Softw
are
Devel
opm
ent
Secu
rity
Depar
tmen
t0%
5%
10%
15%
20%
25%
30%
35%
9%
29% 28% 30%

© 2015 WhiteHat Security, Inc.
If an organization experiences a website(s) data or system breach, which part of the organization is held accountable and what is it’s performance?
0
15
30
10 10 17 25
Average Number of Vulns Open
0200400
386 364 341 299
Average Time Open (Days)
95110125
129 119 108 114
Average Time to Fix (Days)
34%
38%
42%
46%
44% 43%37%
43%
Remediation Rate

© 2015 WhiteHat Security, Inc.
• 15% of the respondents cite Compliance as the primary reason for resolving website vulnerabilities
• 6% of the respondents cite Corporate Policy as the primary reason for resolving website vulnerabilities
• 35% of the respondents cite Risk Reduction as the primary reason for resolving website vulnerabilities
• 19% of the respondents cite Customer or Partner Demand as the primary reason for resolving website vulnerabilities
• 25% of the respondents cite other reasons for resolving website vulnerabilities
Please rank your organization’s drivers for resolving website vulnerabilities. 1 lowest priority, 5 highest.
15%
6%
35%
19%25%
Primary driver for resolving website vulnerabilities
% o
f re
spo
nd
en
ts

© 2015 WhiteHat Security, Inc.
Please rank your organization’s drivers for resolving website vulnerabilities. 1 the lowest priority, 5 the highest.
0
15
30
14 21 28 2810
Average # of vulnerabilities
Primary reasons for resolving web site vulnerabilities
0100200300400500600
266 290 283
525355
Average Time Open (Days)
Primary reasons for resolving web site vulnerabilities
0
100
200
132 86 78163 150
Average Time to Fix (Days)
Primary reasons for resolving web site vulnerabilities
0%20%40%60%
55%21% 40% 50% 33%
Average Remediation Rate
Primary reasons for resolving web site vulnerabilities

© 2015 WhiteHat Security, Inc.
• % of respondents for frequency of automatic static analysis:
• Daily: 13%• With each major release:
32% • Never: 13%
• # of open vulns for frequency of automatic static analysis:
• Daily: 6• With each major release: 32 • Never: 17
How frequent do you perform automated static analysis during the code review process?
Finance and Insurance
Information
Retail Trade
Health Care and Social Assistance
All
0% 20% 40% 60% 80% 100%
DailyMonthlyNeverOther (please spec-ify)PlannedQuarterlyWeeklyWith each re-lease or ma-jor update
Daily
Never
Weekly
0 10 20 30 40 50 60
All
Health Care and Social Assistance
Retail Trade
Information
Finance and Insurance

© 2015 WhiteHat Security, Inc.
• Avg time open for frequency of automatic static analysis:
• Daily: 369 days• Each major release: 273
days • Never: 394 days
• Remediation rate for frequency of automatic static analysis:
• Daily: 39%• Each major release: 38%• Never: 45%
How frequent do you perform automated static analysis during the code review process?
Daily
Never
Quarterly
With each release or major update
0 100200300400500600700
Average Time Open at different frequencies of Automated Static Analysis
All
Health Care and Social Assistance
Retail Trade
Information
Finance and In-surance
Daily
Monthly
Never
Quarterly
Weekly
With each release or major update
All
0% 20% 40% 60% 80% 100%
Average remediation rate at different frequencies of Automated Static Analysis
All
Health Care and Social Assistance
Retail Trade
Information
Finance and In-surance

© 2015 WhiteHat Security, Inc.
• Time to fix for frequency of automatic static analysis:
• Daily: 74 days• Each major
release: 117 days• Never: 125 days
How frequent do you perform automated static analysis during the code review process?
Daily
Monthly
Never
Other (please specify)
Quarterly
Weekly
With each release or major update
0 100 200 300 400 500
Average Time to fix at different frequencies of Au-tomated Static Analysis
All
Health Care and Social Assis-tance
Retail Trade
Information
Finance and Insurance

© 2014 WhiteHat Security, Inc. 19
• % of respondents for frequency of adversarial testing:
Each major release: 32%Quarterly: 11%Never: 21%
• # of open vulns for frequency of adversarial testing:
Each major release: 15Quarterly: 14Never: 34
How frequently does the QA team go beyond functional testing to perform basic adversarial tests (probing of simple edge cases and boundary conditions) example: What happens when you enter the wrong password over and over?
Finance and Insurance
Information
Retail Trade
Health Care and Social Assistance
All
0% 50% 100%
Frequency of Adversarial Testing by Industry
DailyMonthlyNeverOther (please spec-ify)PlannedQuarterlyWeeklyWith each release or major update
Daily
Never
Planned
Weekly
0 10 20 30 40 50 60
Average # of vulns at different frequencies of adversarial testing
AllHealth Care and Social AssistanceRetail TradeInformationFinance and In-surance

© 2014 WhiteHat Security, Inc. 20
• Avg time open for frequency of adversarial testing:
Each major release: 322 daysQuarterly: 375 daysNever: 254 days
• Remediation rate for frequency of adversarial testing:
Each major release: 41%Quarterly: 40%Never: 25%
How frequently does the QA team go beyond functional testing to perform basic adversarial tests (probing of simple edge cases and boundary conditions) example: What happens when you enter the wrong password over and over?
DailyMonthly
NeverOther (please specify)
PlannedQuarterly
WeeklyWith each release or major update
(blank)
0 200 400 600 800
Average Time Open at different fre-quencies of adversarial testing
AllHealth Care and Social AssistanceRetail TradeInformationFinance and In-surance
Daily
Never
Planned
Weekly
0% 20% 40% 60% 80%
Average remediation rate at different frequencies of adversarial testing
AllHealth Care and Social AssistanceRetail TradeInformationFinance and In-surance

© 2014 WhiteHat Security, Inc. 21
• Time to fix for frequency of adversarial testing:
Each major release: 124 daysQuarterly: 85 daysNever: 102 days
How frequently does the QA team go beyond functional testing to perform basic adversarial tests (probing of simple edge cases and boundary conditions) example: What happens when you enter the wrong password over and over?
Daily
Never
Planned
Weekly
0 50 100
150
200
250
Average Time to fix at differ-ent frequencies of adversarial
testing
AllHealth Care and Social AssistanceRetail TradeInformationFinance and Insurance

© 2014 WhiteHat Security, Inc. 22
• % of respondents for frequency of pen-testing:
Annually: 21% Quarterly: 26% Never: 26%
• # of open vulns for frequency of pen-testing:
Annually: 12Quarterly: 40Never: 25
How frequently do you use external penetration testers to find problems?
Finance and In-surance
Information
Retail Trade
Health Care and Social Assistance
All
0% 20% 40% 60% 80% 100%120%
Frequency of Penetration Testing by Industry
AnnuallyDailyMonthlyNeverOther (please spec-ify)PlannedQuarterlyWeeklyWith each release or major update
Annually
Monthly
Planned
Weekly
0 10 20 30 40 50 60
Average # of vulns at different frequencies of penetration testing
All
Health Care and Social Assistance
Retail Trade
Information
Finance and In-surance

© 2014 WhiteHat Security, Inc. 23
• Avg time open for frequency of penetration testing:
Annually: 282 daysQuarterly: 273 daysNever: 393 days
• Remediation rate for frequency of penetration testing:
Annually: 49%Quarterly: 44%Never: 34%
How frequently do you use external penetration testers to find problems?
AnnuallyDaily
MonthlyNever
Other (please specify)Planned
QuarterlyWeekly
0 100 200 300 400 500 600 700
Average Time Open at different frequencies of penetration testing
Grand TotalHealth Care and Social Assis-tanceRetail TradeInformationFinance and Insurance
AnnuallyDaily
MonthlyNever
Other (please specify)Planned
QuarterlyWeekly
With each release or major update
0%20%
40%60%
80%
Average remediation rate at different fre-quencies of penetration testing
Grand TotalHealth Care and Social AssistanceRetail TradeInformationFinance and Insurance

© 2014 WhiteHat Security, Inc. 24
• Time to fix for frequency of penetration testing:
Annually: 140 daysQuarterly: 102 daysNever: 128 days
How frequently do you use external penetration testers to find problems?
Annually
Monthly
Other (please specify)
Quarterly
With each release or
major update
0 100 200 300
Average Time to fix at different frequencies of penetration test-
ing
Grand TotalHealth Care and Social AssistanceRetail TradeInformationFinance and Insurance

© 2014 WhiteHat Security, Inc. 25
• % of respondents for frequency of operation monitoring feedback:
Daily: 17% With each major release: 17% Never: 9%
• # of open vulns for frequency of operation monitoring feedback:
Daily: 40With each major release: 23Never: 10
How often does your organization use defects identified through operations monitoring fed back to development and used to change developer behavior?
Finance and Insurance
Information
Retail Trade
Health Care and Social Assistance
All
0%50%
100%150%
Frequency of Operations Monitoring Feedback by Industry
Annually DailyMonthly NeverOther (please specify) PlannedQuarterly WeeklyWith each release or major update
Annually
Never
Quarterly
0 10 20 30 40 50 60
Average # of vulns at different fre-quencies of Operations Monitoring
Feedback AllHealth Care and Social AssistanceRetail TradeInformationFinance and In-surance

© 2014 WhiteHat Security, Inc. 26
• Avg time open for frequency of operation monitoring feedback:
Daily: 270 daysWith each major release: 353 daysNever: 243 days
• Remediation rate for frequency of operation monitoring feedback:
Daily: 32%With each major release: 48%Never: 34%
How often does your organization use defects identified through operations monitoring fed back to development and used to change developer behavior?
AnnuallyDaily
MonthlyNever
Other (please specify)Planned
QuarterlyWeekly
With each release or major update
0 200 400 600 800
Average Time Open at different frequencies of Operations Monitor-
ing Feedback Health Care and Social AssistanceRetail TradeInformationFinance and In-surance
Annually
Never
Quarterly
0% 10% 20% 30% 40% 50% 60% 70%
Average remediation rate at different frequencies of Operations Monitoring
Feedback Health Care and Social AssistanceRetail TradeInformationFinance and Insurance
© 2014 WhiteHat Security, Inc. 27
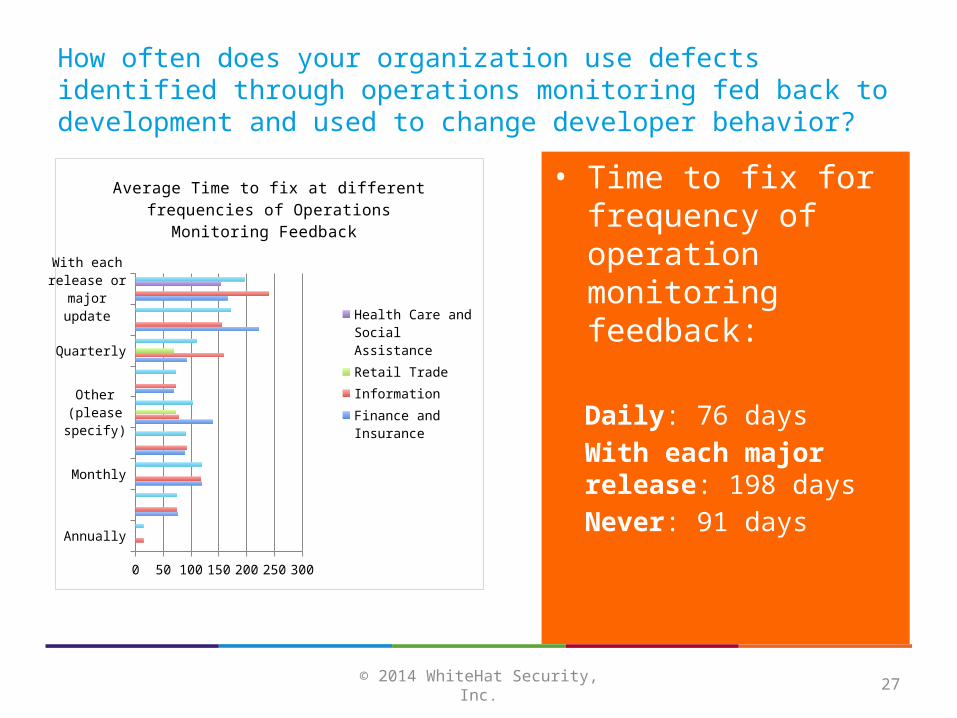
• Time to fix for frequency of operation monitoring feedback:
Daily: 76 daysWith each major release: 198 daysNever: 91 days
How often does your organization use defects identified through operations monitoring fed back to development and used to change developer behavior?
Annually
Monthly
Other (please specify)
Quarterly
With each release or
major update
0 50 100 150 200 250 300
Average Time to fix at different fre-quencies of Operations Monitoring
Feedback
Health Care and Social AssistanceRetail TradeInformationFinance and In-surance

© 2014 WhiteHat Security, Inc. 28
• % of respondents for frequency of ad hoc code reviews:
Never: 21% Planned: 15% With each major release: 15%
• # of open vulns for frequency of ad hoc code reviews:
Never: 41 Planned: 10 With each major release: 13
How frequently does your organization perform ad hoc code reviews of high risk applications in an opportunistic fashion?
Finance and InsuranceInformationRetail Trade
Health Care and Social AssistanceAll
Frequency of Adhoc Code Review by Industry
Annually Daily MonthlyNever Other (please
specify)Planned
Quarterly Weekly With each release or major update
Annually
Never
Quarterly
0 50 100
Average # of vulns at different frequencies of Adhoc code review
All Health Care and Social Assistance
Retail Trade InformationFinance and Insurance

© 2014 WhiteHat Security, Inc. 29
• Avg time open for frequency of ad hoc code reviews:
Never: 309 daysPlanned: 264 daysWith each major release: 278 days
• Remediation rate for frequency of ad hoc code reviews:
Never: 43%Planned: 39%With each major release: 37%
How frequently does your organization perform ad hoc code reviews of high risk applications in an opportunistic fashion?
AnnuallyDaily
MonthlyNever
Other (please specify)Planned
QuarterlyWeekly
With each release or major update
0 100200300400500600
Average Time Open at different fre-quencies of adhoc code review
Health Care and Social AssistanceRetail TradeInformationFinance and In-surance
AnnuallyDaily
MonthlyNever
Other (please specify)Planned
QuarterlyWeekly
With each release or major update
0 0.10.20.30.40.50.60.7
Average remediation rate at different frequencies of adhoc code review
Health Care and Social AssistanceRetail TradeInformationFinance and In-surance

© 2014 WhiteHat Security, Inc. 30
• Time to fix for frequency of ad hoc code reviews:
Never: 147 days Planned: 90 daysWith each major release: 102 days
How frequently does your organization perform ad hoc code reviews of high risk applications in an opportunistic fashion?
Annually
Monthly
Other (please specify)
Quarterly
With each release or
major update
0 20 40 60 80 100
120
140
160
180
Average Time to fix at dif-ferent frequencies of adhoc
code review
Health Care and Social Assistance
Retail Trade
Information
Finance and Insurance

© 2014 WhiteHat Security, Inc. 31
• % of respondents for frequency of security review sharing:
Monthly: 13%With each major release: 28%Never: 19%
• # of open vulns for frequency of security review sharing:
Monthly: 13With each major release: 29Never: 18
How frequently does your organization share results from security reviews with the QA department?
Finance and In-surance
Retail Trade
All
0%50%
100%150%
Frequency of Security Result Sharing by Industry
Daily MonthlyNever Other (please specify)Planned QuarterlyWeekly With each release or major
update
Daily
Never
Planned
Weekly
0 10 20 30 40 50 60
Average # of vulns at different frequencies of Security Result Sharing
AllHealth Care and Social AssistanceRetail TradeInformationFinance and In-surance

© 2014 WhiteHat Security, Inc. 32
• Avg time open for frequency of security review sharing:
Monthly: 282 daysWith each major release: 393 daysNever: 258 days
• Remediation rate for frequency of security review sharing:
Monthly: 49%With each major release: 37%Never: 27%
How frequently does your organization share results from security reviews with the QA department?
Daily
Monthly
Never
Other (please specify)
Planned
Quarterly
Weekly
With each release or major update
0 200 400 600 800
All
Health Care and Social Assis-tance
Retail Trade
Information
Finance and Insurance
Daily
Monthly
Never
Other (please specify)
Planned
Quarterly
Weekly
With each release or major updateAll
Health Care and Social Assistance
Retail Trade
Information
Finance and In-surance

© 2014 WhiteHat Security, Inc. 33
• Time to fix for frequency of security review sharing:
Monthly: 107 daysWith each major release: 162 daysNever: 83 days
How frequently does your organization share results from security reviews with the QA department?
Daily
Monthly
Never
Other (please specify)
Planned
Quarterly
Weekly
With each release or major update
0 50 100 150 200
Average Time to fix at different frequencies of Security Result Shar-
ing
AllHealth Care and Social AssistanceRetail TradeInformationFinance and Insurance

Questions?
© 2015 WhiteHat Security, Inc.
Jeremiah GrossmanFounderWhiteHat Security, Inc.Twitter: @jeremiahg
Thank you!