Embed Size (px)
Citation preview

An Introduction to the WSO2 Analytics Platform
Srinath Perera VP Research WSO2, Apache Member (@srinath_perera) [email protected]
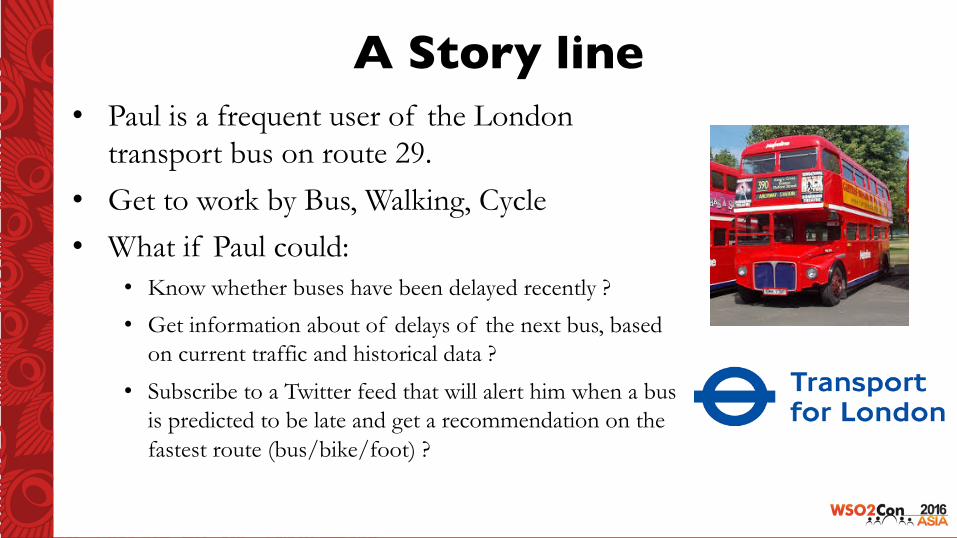
A Story line• Paul is a frequent user of the London
transport bus on route 29.
• Get to work by Bus, Walking, Cycle • What if Paul could:
• Know whether buses have been delayed recently ?
• Get information about of delays of the next bus, based on current traffic and historical data ?
• Subscribe to a Twitter feed that will alert him when a bus is predicted to be late and get a recommendation on the fastest route (bus/bike/foot) ?

Paul gets �Peace of Mind & �the best Solution �
4
SP
EE
D
TRA
CK
ING
5
OP
ER
ATIO
NA
L M
AN
AG
ER
D
AS
HB
OA
RD
2 Engineers built this in two weeks

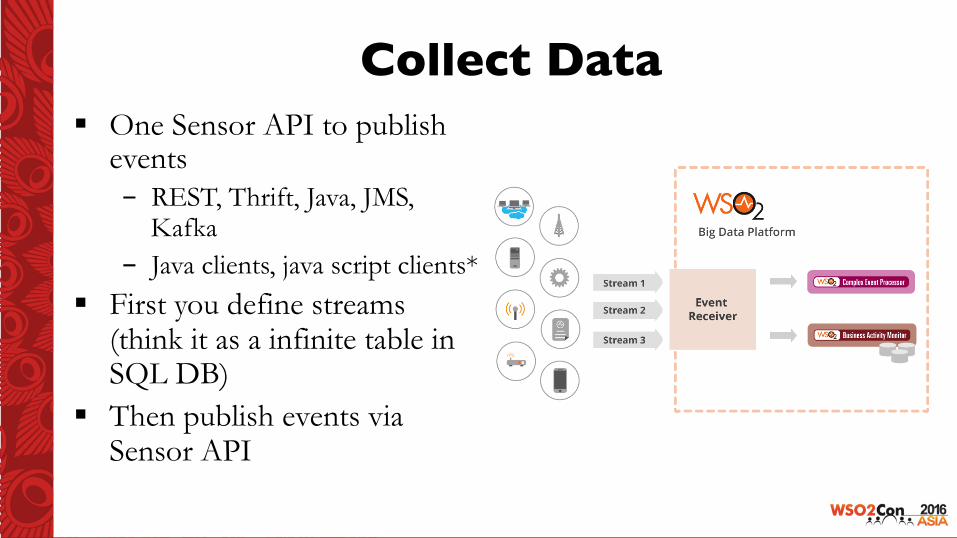
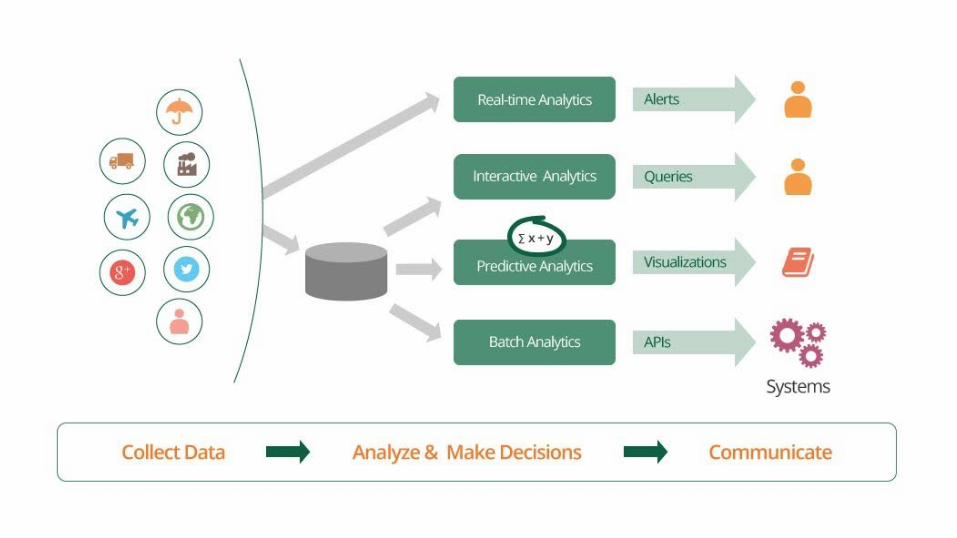
Collect Data§ One Sensor API to publish
events - REST, Thrift, Java, JMS,
Kafka - Java clients, java script clients*
§ First you define streams (think it as a infinite table in SQL DB)
§ Then publish events via Sensor API
“Publish once, process anyway you like”
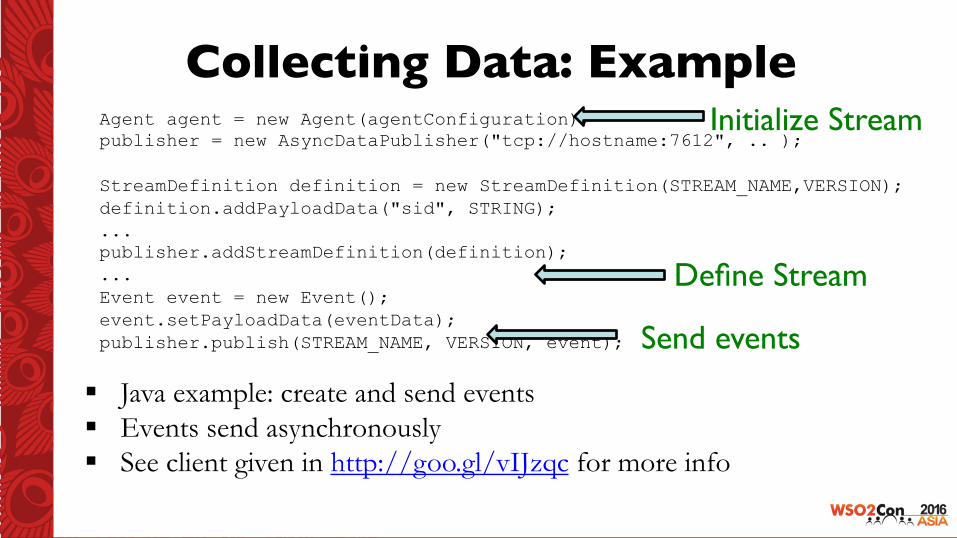
Collecting Data: Example
§ Java example: create and send events § Events send asynchronously § See client given in http://goo.gl/vIJzqc for more info
Agent agent = new Agent(agentConfiguration); publisher = new AsyncDataPublisher("tcp://hostname:7612", .. ); StreamDefinition definition = new StreamDefinition(STREAM_NAME,VERSION); definition.addPayloadData("sid", STRING); ... publisher.addStreamDefinition(definition); ... Event event = new Event(); event.setPayloadData(eventData); publisher.publish(STREAM_NAME, VERSION, event);
Send events
Define Stream
Initialize Stream
Data Collection Examples
• Collect data from inbuilt agents in WSO2 products, Tomcat etc.
• Collecting your log data via log stash • Collecting JVM and JMX stats via agent • Ingesting data from message queues
such as JMS or Kafka • Pulling data from a RSS feed, or
scraping a web page • Write a custom agent to collect data
from your system and push it to DAS
Photocredith+p://www.torange.us/CClicense
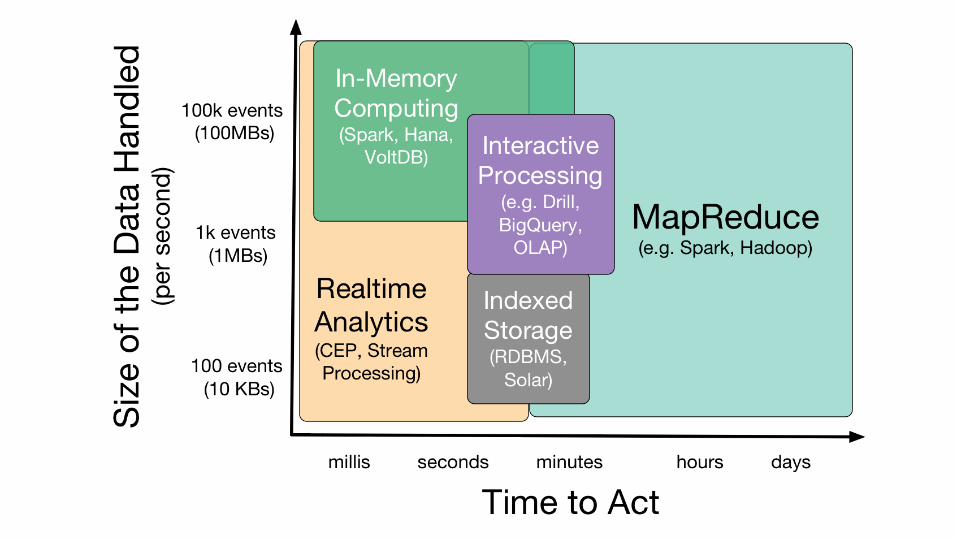
Analysis: Batch Analytics• Batch analytics reads data from a disk ( or some other
storage) and process them record by record • “MapReduce” is most widely used technology for batch
analytics – Apache Hadoop – Apache Spark 30X faster and much more flexible
• Analytics (Min, Max, average, correlation, histograms, might join or group data in many ways)
• Key Performance indicators (KPIs) – E.g. Profit per square feet for retail
• Presented as a Dashboard
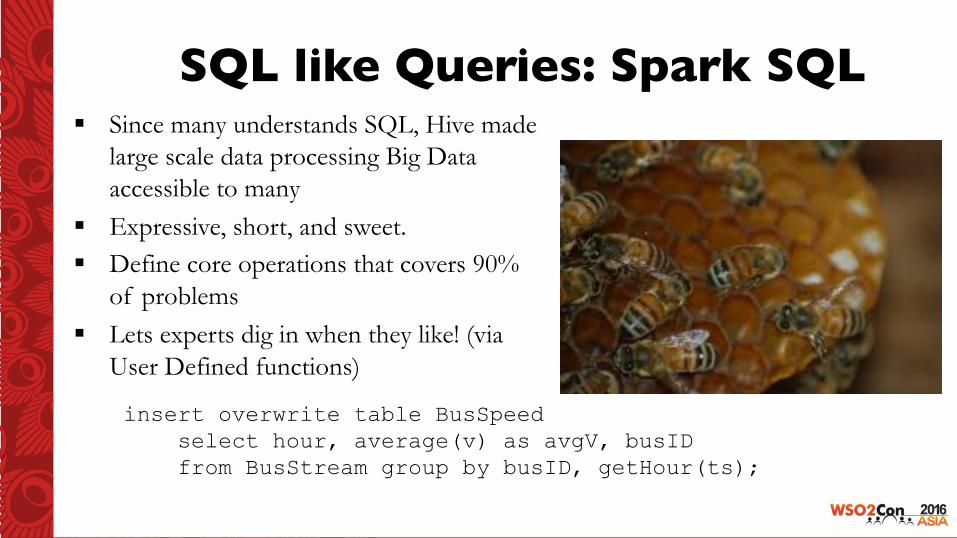
SQL like Queries: Spark SQL§ Since many understands SQL, Hive made
large scale data processing Big Data accessible to many
§ Expressive, short, and sweet. § Define core operations that covers 90%
of problems § Lets experts dig in when they like! (via
User Defined functions)
insert overwrite table BusSpeed select hour, average(v) as avgV, busID from BusStream group by busID, getHour(ts);
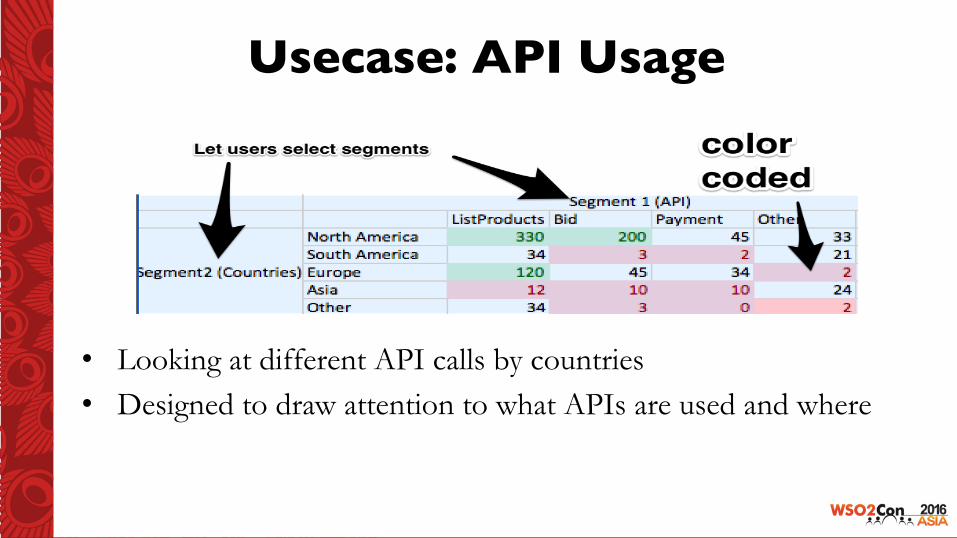
Usecase: API Usage
• Looking at different API calls by countries • Designed to draw attention to what APIs are used and where
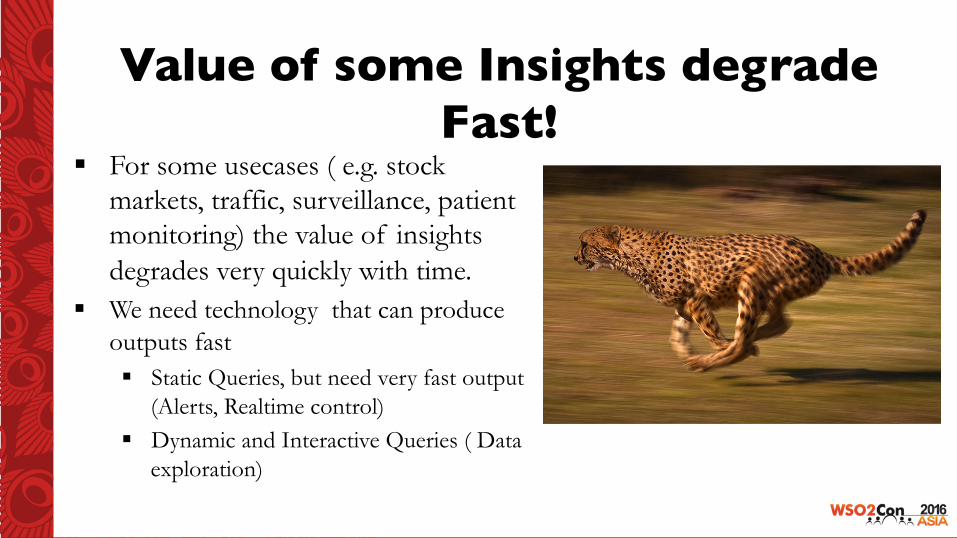
Value of some Insights degrade Fast!
§ For some usecases ( e.g. stock markets, traffic, surveillance, patient monitoring) the value of insights degrades very quickly with time.
§ We need technology that can produce outputs fast § Static Queries, but need very fast output
(Alerts, Realtime control) § Dynamic and Interactive Queries ( Data
exploration)
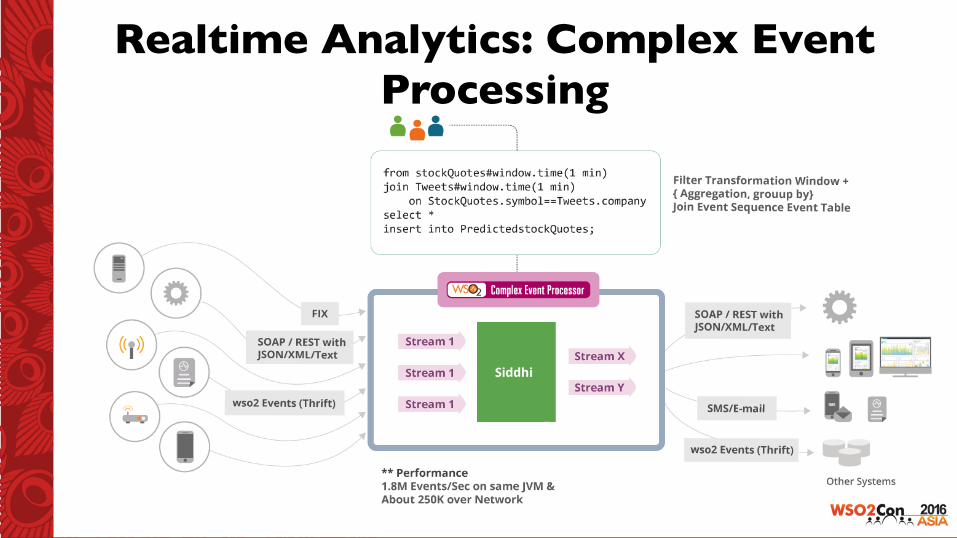
Realtime Analytics: Complex Event Processing
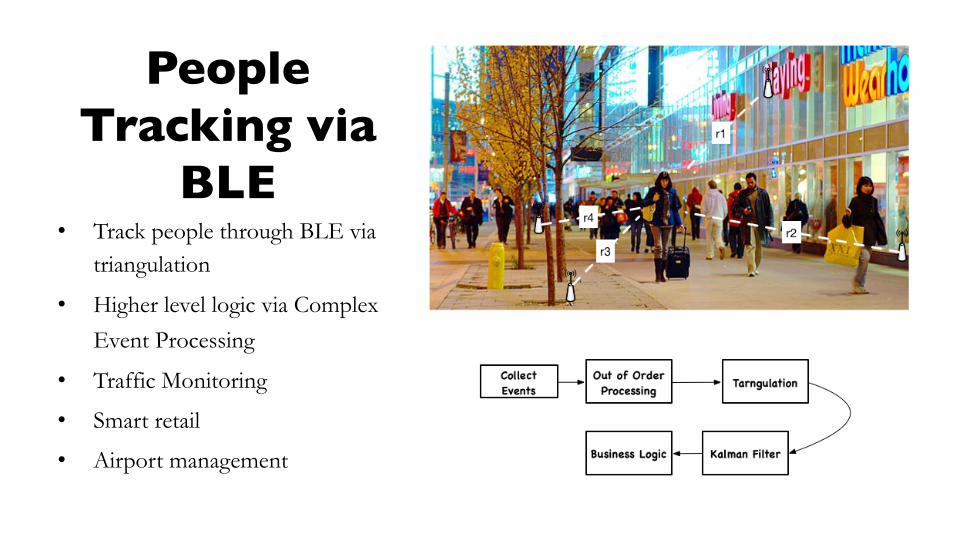
People Tracking via
BLE• Track people through BLE via
triangulation
• Higher level logic via Complex
Event Processing
• Traffic Monitoring
• Smart retail
• Airport management
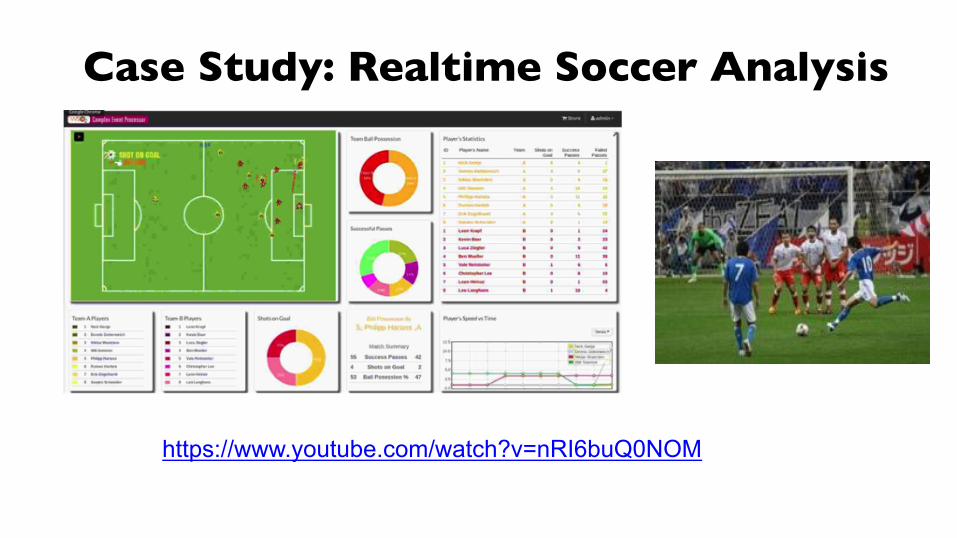
Case Study: Realtime Soccer Analysis
Watch at: https://www.youtube.com/watch?v=nRI6buQ0NOM
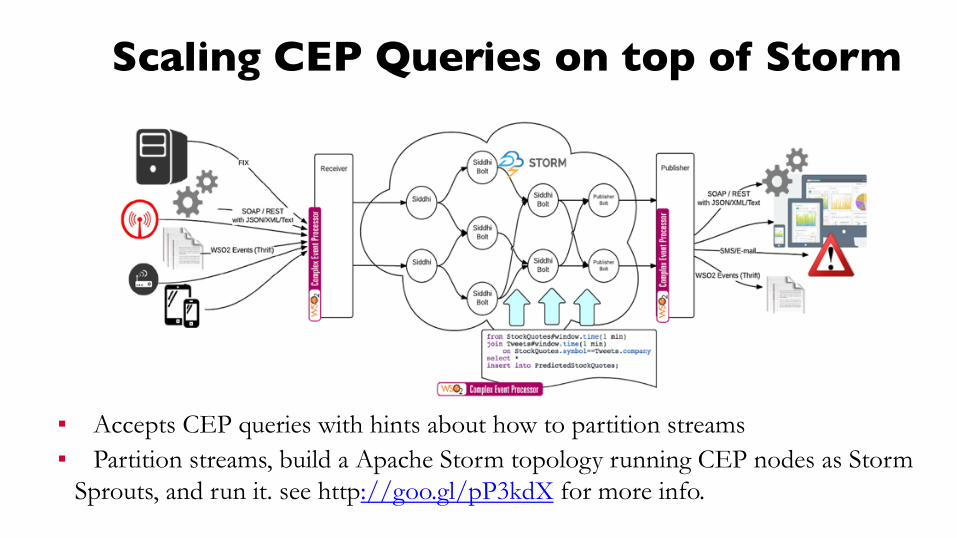
Scaling CEP Queries on top of Storm
▪ Accepts CEP queries with hints about how to partition streams ▪ Partition streams, build a Apache Storm topology running CEP nodes as Storm
Sprouts, and run it. see http://goo.gl/pP3kdX for more info.
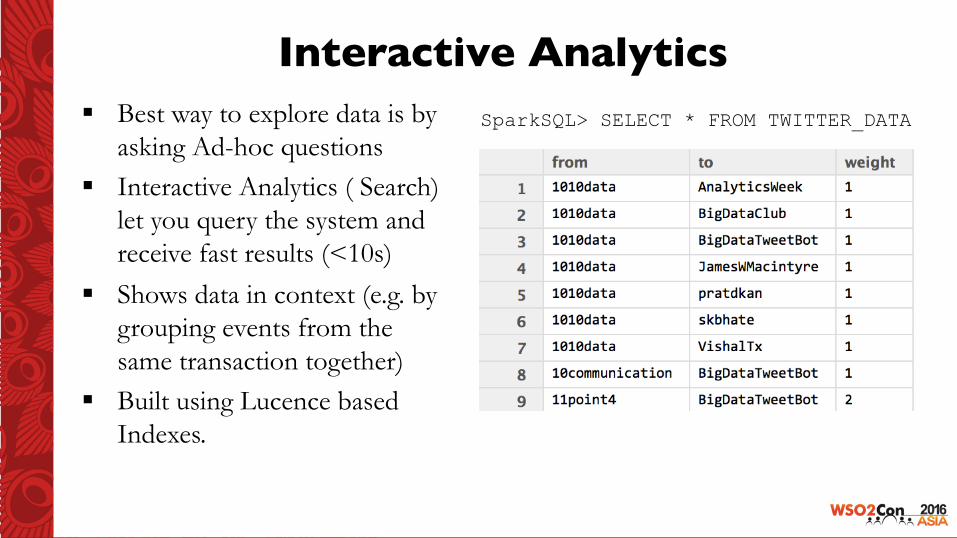
Interactive Analytics§ Best way to explore data is by
asking Ad-hoc questions § Interactive Analytics ( Search)
let you query the system and receive fast results (<10s)
§ Shows data in context (e.g. by grouping events from the same transaction together)
§ Built using Lucence based Indexes.
SparkSQL> SELECT * FROM TWITTER_DATA
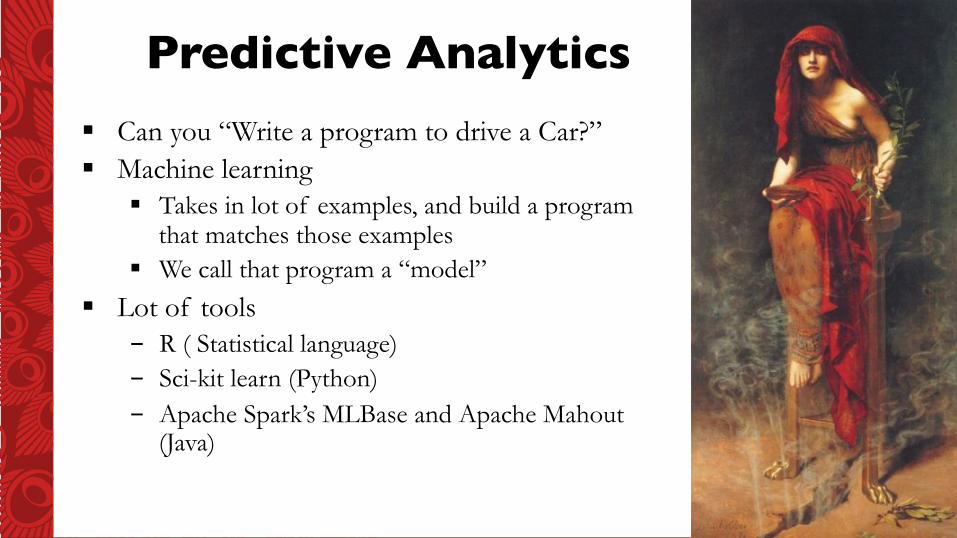
Predictive Analytics§ Can you “Write a program to drive a Car?” § Machine learning
§ Takes in lot of examples, and build a program that matches those examples
§ We call that program a “model” § Lot of tools
- R ( Statistical language) - Sci-kit learn (Python) - Apache Spark’s MLBase and Apache Mahout
(Java)
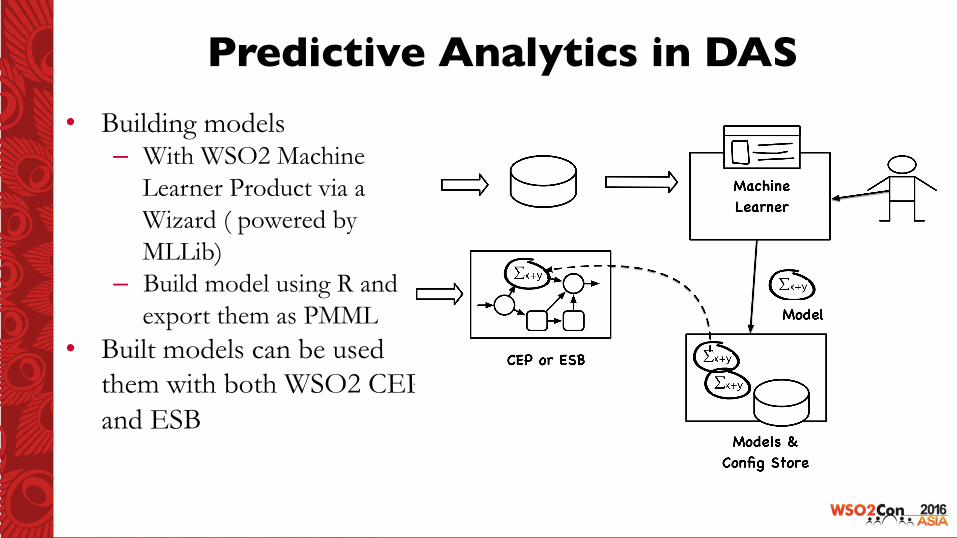
Predictive Analytics in DAS• Building models
– With WSO2 Machine Learner Product via a Wizard ( powered by MLLib)
– Build model using R and export them as PMML
• Built models can be used them with both WSO2 CEP and ESB
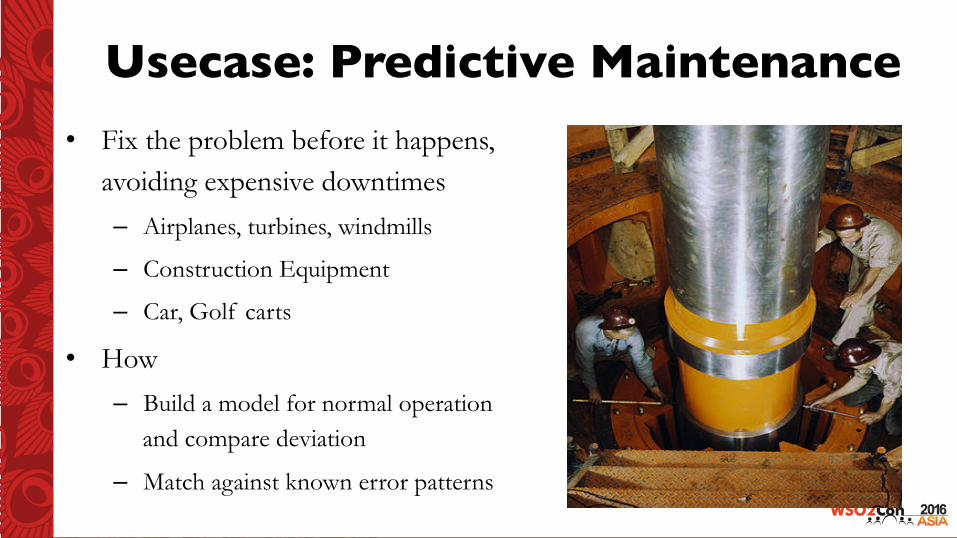
Usecase: Predictive Maintenance• Fix the problem before it happens,
avoiding expensive downtimes
– Airplanes, turbines, windmills
– Construction Equipment
– Car, Golf carts
• How
– Build a model for normal operation and compare deviation
– Match against known error patterns
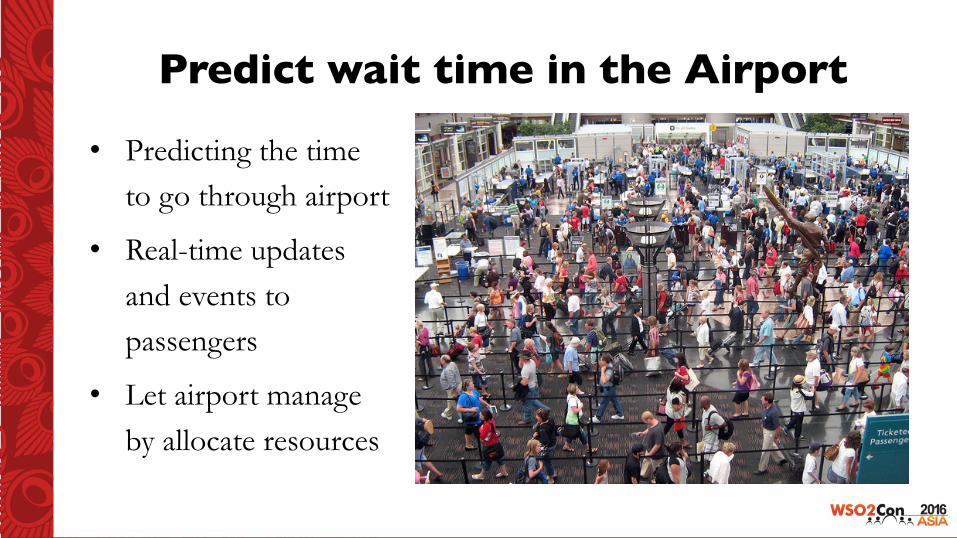
Predict wait time in the Airport
• Predicting the time to go through airport
• Real-time updates and events to passengers
• Let airport manage by allocate resources
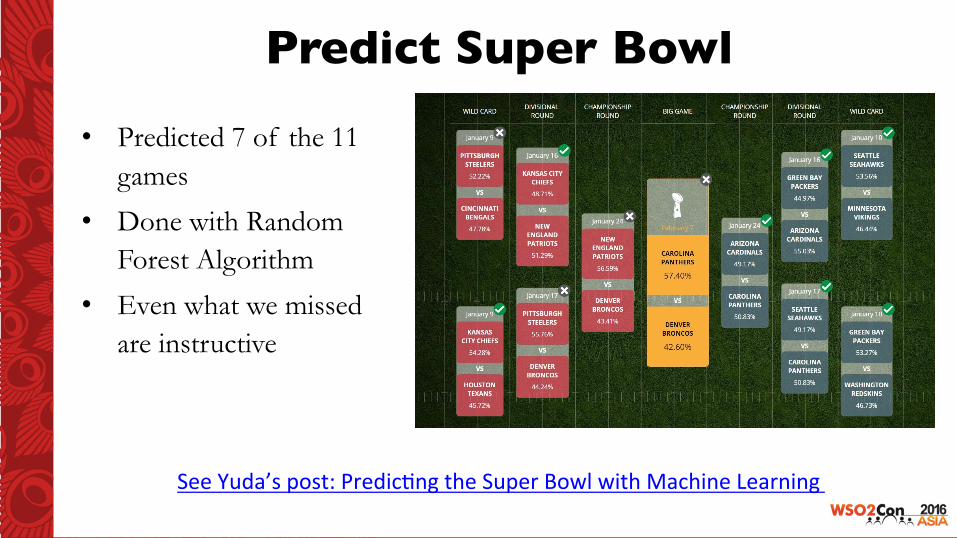
Predict Super Bowl
• Predicted 7 of the 11 games
• Done with Random Forest Algorithm
• Even what we missed are instructive
SeeYuda’spost:Predic;ngtheSuperBowlwithMachineLearning
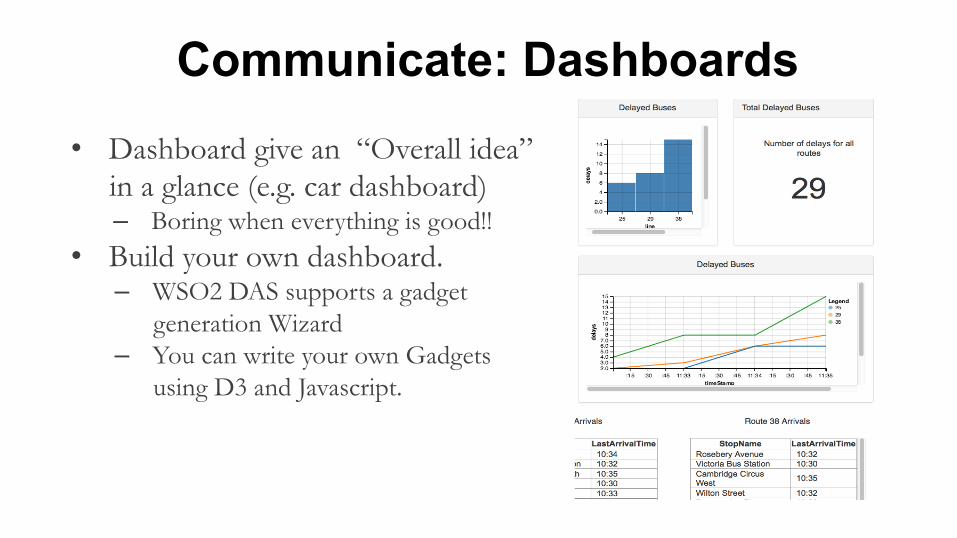
Communicate: Dashboards • Dashboard give an “Overall idea”
in a glance (e.g. car dashboard) – Boring when everything is good!!
• Build your own dashboard. – WSO2 DAS supports a gadget
generation Wizard – You can write your own Gadgets
using D3 and Javascript.
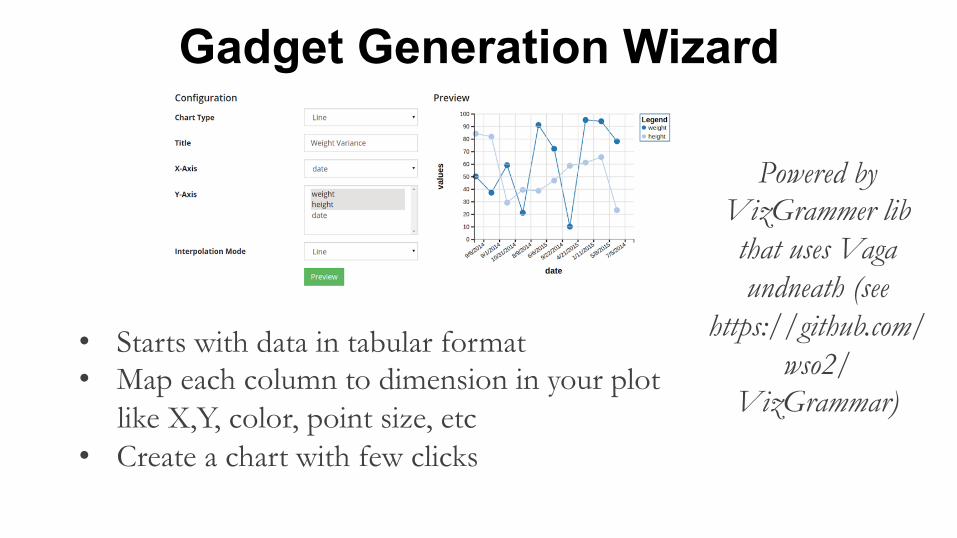
Gadget Generation Wizard
• Starts with data in tabular format • Map each column to dimension in your plot
like X,Y, color, point size, etc • Create a chart with few clicks
Powered by VizGrammer lib that uses Vaga undneath (see
https://github.com/wso2/
VizGrammar)
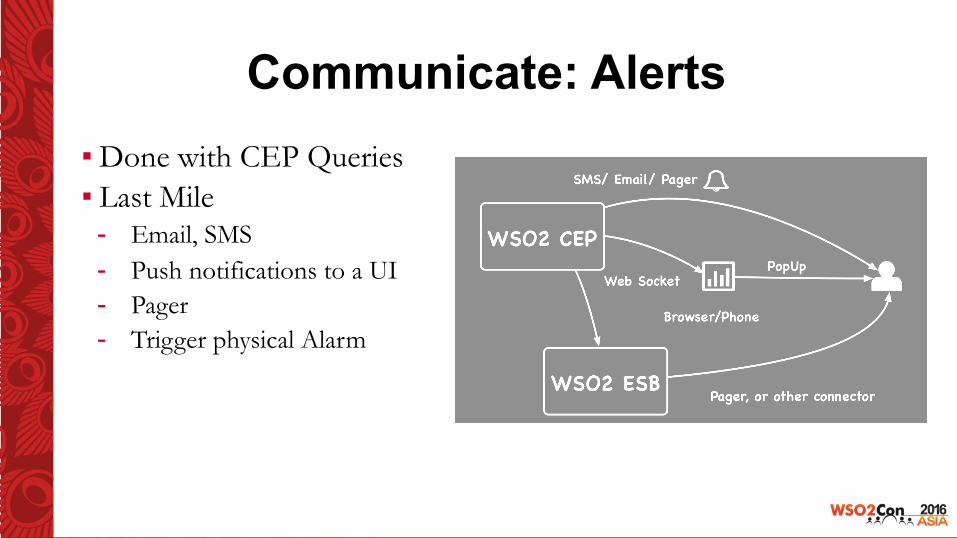
Communicate: Alerts ▪ Done with CEP Queries ▪ Last Mile
- Email, SMS - Push notifications to a UI - Pager - Trigger physical Alarm
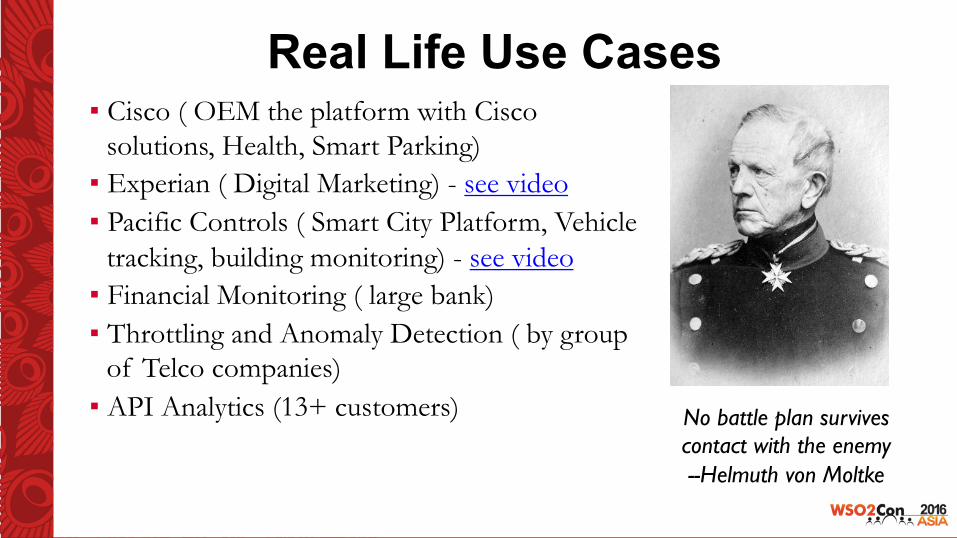
Real Life Use Cases ▪ Cisco ( OEM the platform with Cisco
solutions, Health, Smart Parking) ▪ Experian ( Digital Marketing) - see video ▪ Pacific Controls ( Smart City Platform, Vehicle
tracking, building monitoring) - see video ▪ Financial Monitoring ( large bank) ▪ Throttling and Anomaly Detection ( by group
of Telco companies) ▪ API Analytics (13+ customers) No battle plan survives
contact with the enemy--Helmuth von Moltke
Key Differentiators • Open Source, under Apache 2 license
• Publish data once, analyze it anyway you like experience.
• Flexible packaging or as a scalable cluster
• Rich, extensible, SQL-like configuration language • Compact, easy to learn syntax addressing complex
requirements, such as time windows, patterns, sequences which would be complex to develop in a programming language such as Java.
• Rich set of data connectors, which can be easily extended •Events only need to be published once from applications to the platform, and can be consumed b
y batch or real time pipeline. • Performance on single node satisfies 90% of use cases • Part of the overall WSO2 platform
31

Thank You


![[WSO2Con EU 2017] Open Interoperability of WSO2 Analytics Platform](https://img.pdfslide.net/doc/110x75/5a64907a7f8b9a27568b6891/wso2con-eu-2017-open-interoperability-of-wso2-analytics-platform.jpg)