Embed Size (px)
Citation preview

© 2016 Daramic, LLC. ALL RIGHTS RESERVED
Innovations in Enhanced Flooded Lead-Acid Batteries
J. KEVIN WHEAR
VP Technology
© 2016 Daramic, LLC. ALL RIGHTS RESERVED 2
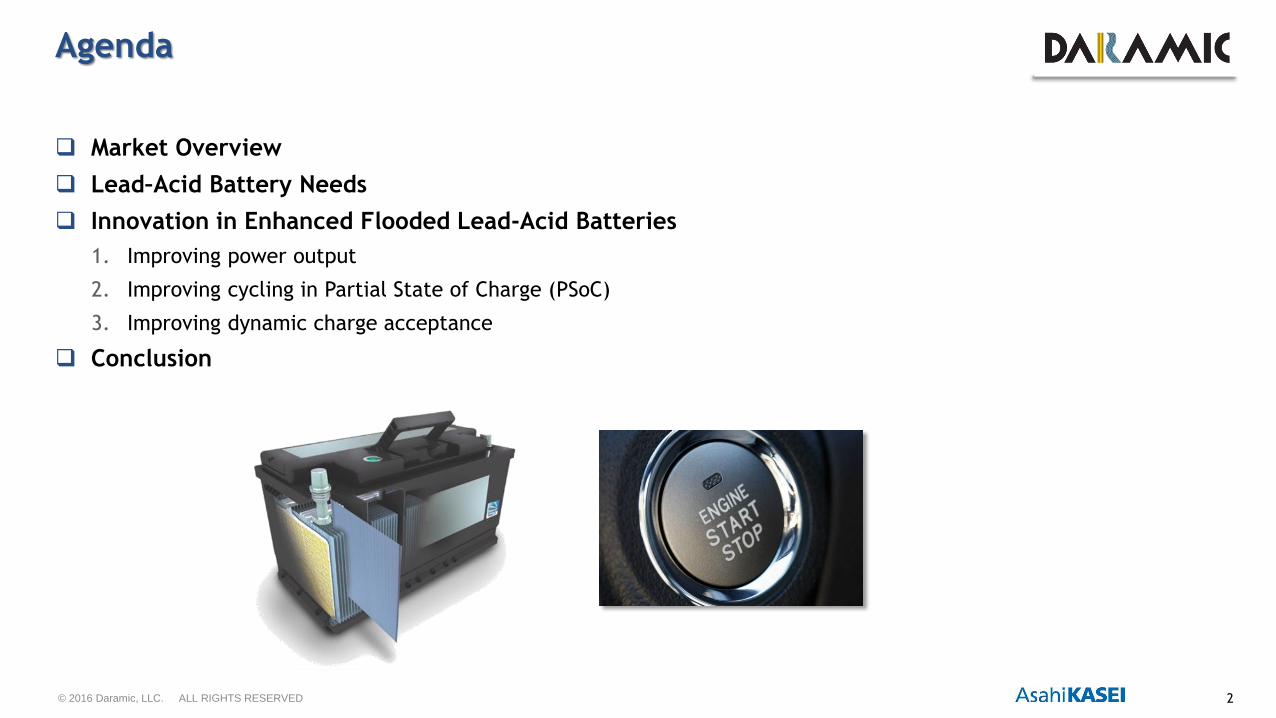
Agenda
Market Overview
Lead–Acid Battery Needs
Innovation in Enhanced Flooded Lead-Acid Batteries
1. Improving power output
2. Improving cycling in Partial State of Charge (PSoC)
3. Improving dynamic charge acceptance
Conclusion
© 2016 Daramic, LLC. ALL RIGHTS RESERVED 3
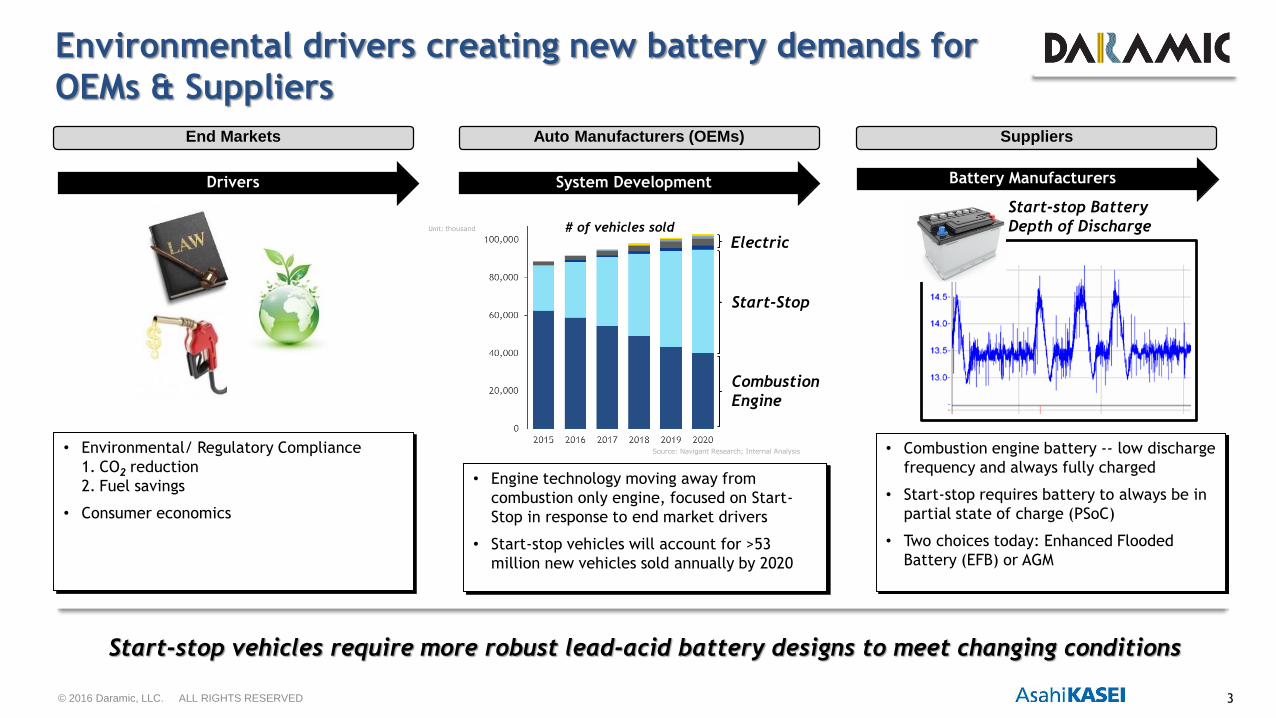
Drivers
Environmental drivers creating new battery demands for
OEMs & Suppliers
Start-stop vehicles require more robust lead-acid battery designs to meet changing conditions
• Environmental/ Regulatory Compliance
1. CO2 reduction
2. Fuel savings
• Consumer economics
• Engine technology moving away from
combustion only engine, focused on Start-
Stop in response to end market drivers
• Start-stop vehicles will account for >53
million new vehicles sold annually by 2020
Battery Manufacturers
• Combustion engine battery -- low discharge
frequency and always fully charged
• Start-stop requires battery to always be in
partial state of charge (PSoC)
• Two choices today: Enhanced Flooded
Battery (EFB) or AGM
Start-stop Battery
Depth of Discharge
End Markets Auto Manufacturers (OEMs)
Source: Navigant Research; Internal Analysis
Electric
Start-Stop
Combustion
Engine
# of vehicles sold
System Development
Unit: thousand
Suppliers
© 2016 Daramic, LLC. ALL RIGHTS RESERVED 4
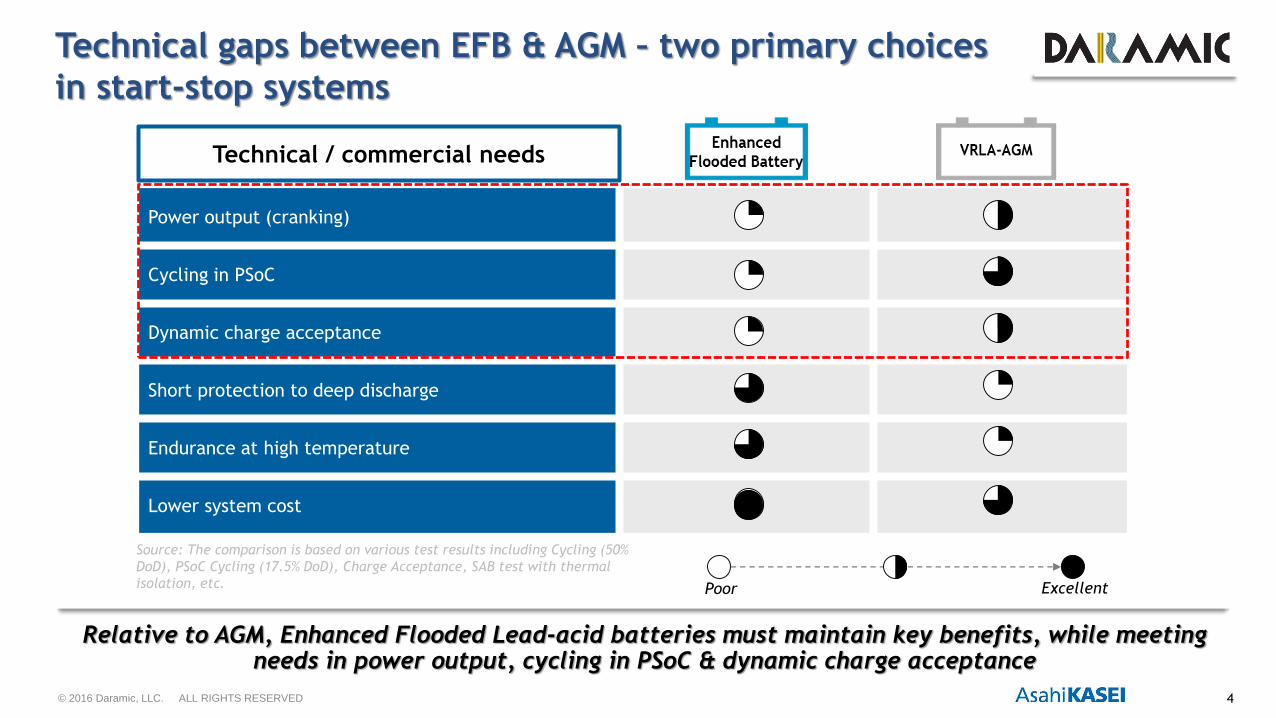
Technical gaps between EFB & AGM – two primary choices
in start-stop systems
Relative to AGM, Enhanced Flooded Lead-acid batteries must maintain key benefits, while meeting needs in power output, cycling in PSoC & dynamic charge acceptance
Technical / commercial needs
Power output (cranking)
Cycling in PSoC
Dynamic charge acceptance
Short protection to deep discharge
Endurance at high temperature
Lower system cost
Poor Excellent
Source: The comparison is based on various test results including Cycling (50%
DoD), PSoC Cycling (17.5% DoD), Charge Acceptance, SAB test with thermal
isolation, etc.
© 2016 Daramic, LLC. ALL RIGHTS RESERVED 5
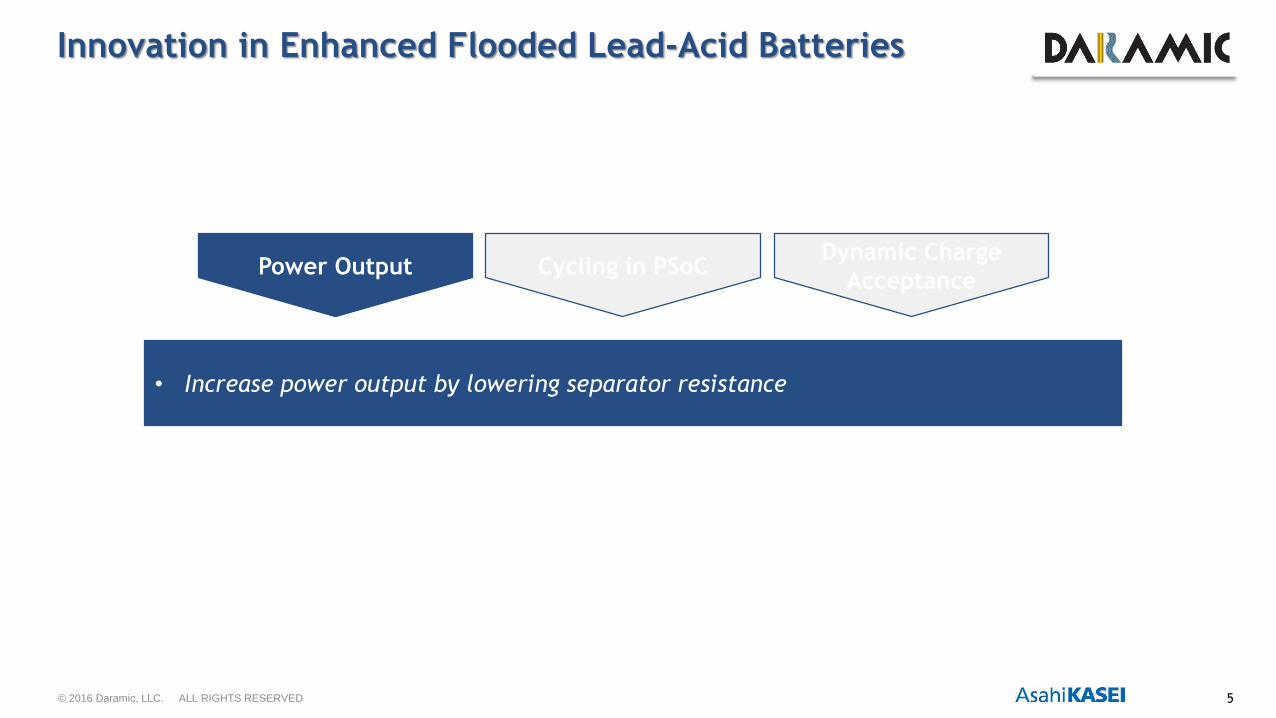
Innovation in Enhanced Flooded Lead-Acid Batteries
Power Output Cycling in PSoCDynamic Charge
Acceptance
• Increase power output by lowering separator resistance
© 2016 Daramic, LLC. ALL RIGHTS RESERVED 6
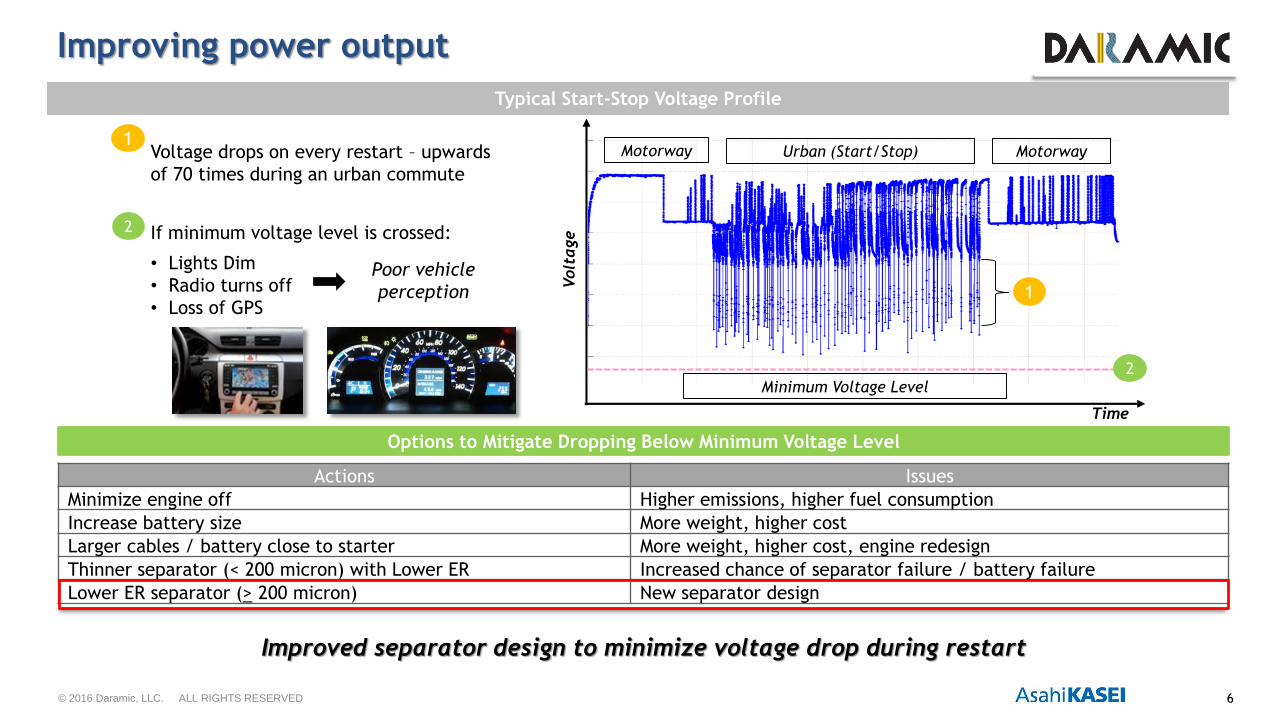
Improving power output
Improved separator design to minimize voltage drop during restart
Voltage drops on every restart – upwards
of 70 times during an urban commute
If minimum voltage level is crossed:
• Lights Dim
• Radio turns off
• Loss of GPS
Poor vehicle
perception
Actions Issues
Minimize engine off Higher emissions, higher fuel consumption
Increase battery size More weight, higher cost
Larger cables / battery close to starter More weight, higher cost, engine redesign
Thinner separator (< 200 micron) with Lower ER Increased chance of separator failure / battery failure
Lower ER separator (> 200 micron) New separator design
Volt
age
Time
Motorway Urban (Start/Stop)
Minimum Voltage Level
Motorway
1
Typical Start-Stop Voltage Profile
Options to Mitigate Dropping Below Minimum Voltage Level
2
1
2
© 2016 Daramic, LLC. ALL RIGHTS RESERVED 7
Improving power output
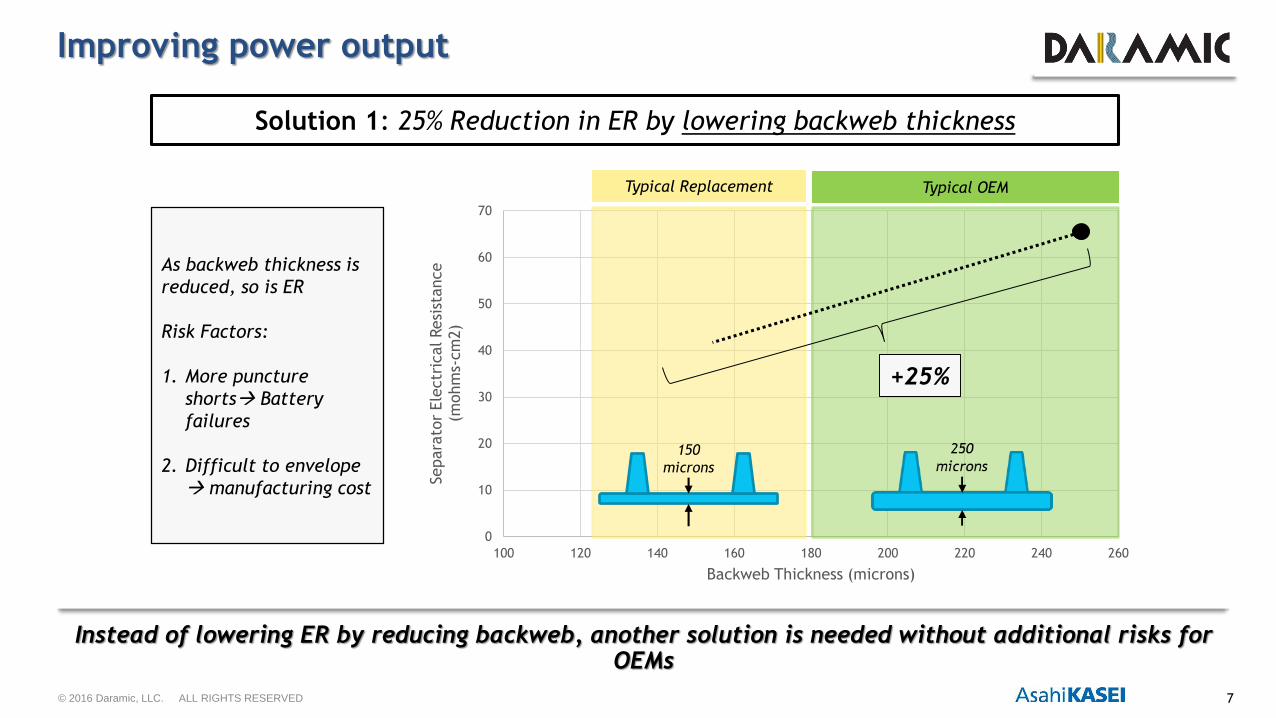
Instead of lowering ER by reducing backweb, another solution is needed without additional risks for OEMs
0
10
20
30
40
50
60
70
100 120 140 160 180 200 220 240 260
Separa
tor
Ele
ctr
ical Resi
stance
(mohm
s-cm
2)
Backweb Thickness (microns)
Solution 1: 25% Reduction in ER by lowering backweb thickness
As backweb thickness is
reduced, so is ER
Risk Factors:
1. More puncture
shorts Battery
failures
2. Difficult to envelope
manufacturing cost
Typical Replacement Typical OEM
+25%
150
microns
© 2016 Daramic, LLC. ALL RIGHTS RESERVED 8
0
10
20
30
40
50
60
70
100 120 140 160 180 200 220 240 260
Separa
tor
Ele
ctr
ical Resi
stance
(mohm
s-cm
2)
Backweb Thickness (microns)
Improving power output
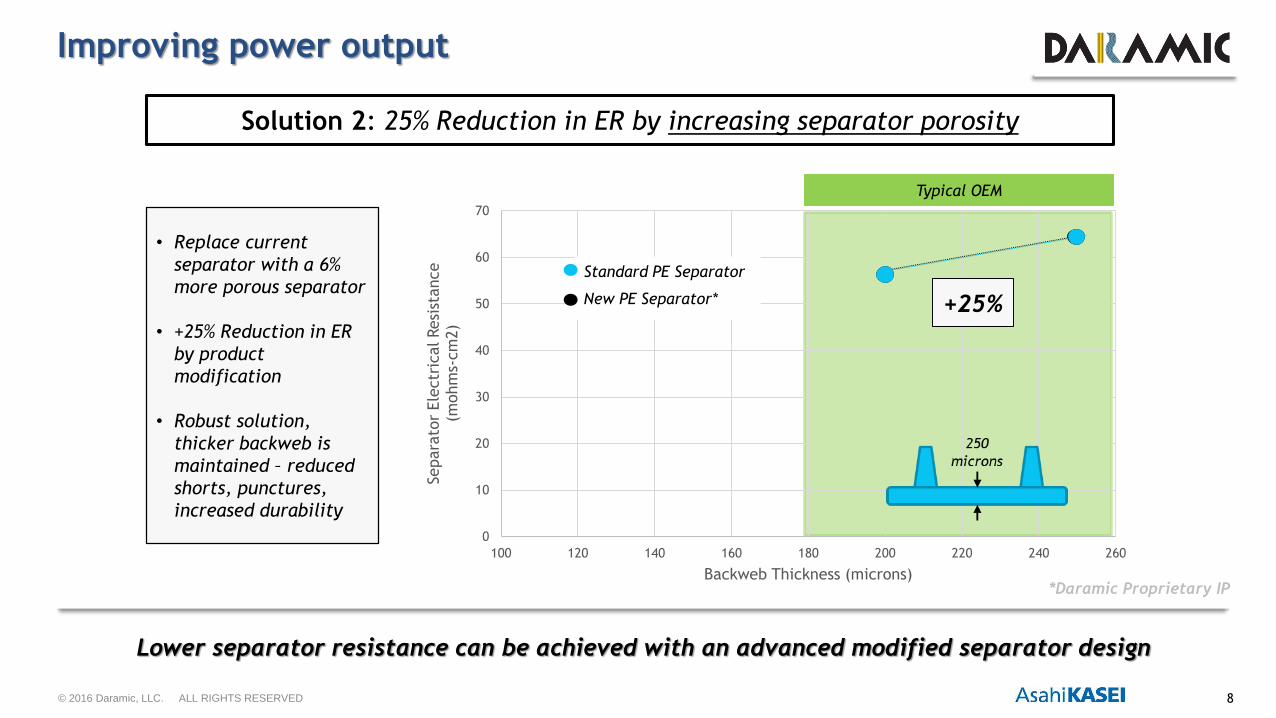
Lower separator resistance can be achieved with an advanced modified separator design
+25%
Standard PE Separator
New PE Separator*
Solution 2: 25% Reduction in ER by increasing separator porosity
• Replace current
separator with a 6%
more porous separator
• +25% Reduction in ER
by product
modification
• Robust solution,
thicker backweb is
maintained – reduced
shorts, punctures,
increased durability
Typical OEM
*Daramic Proprietary IP
© 2016 Daramic, LLC. ALL RIGHTS RESERVED 9
New PE Separator with Lower ER
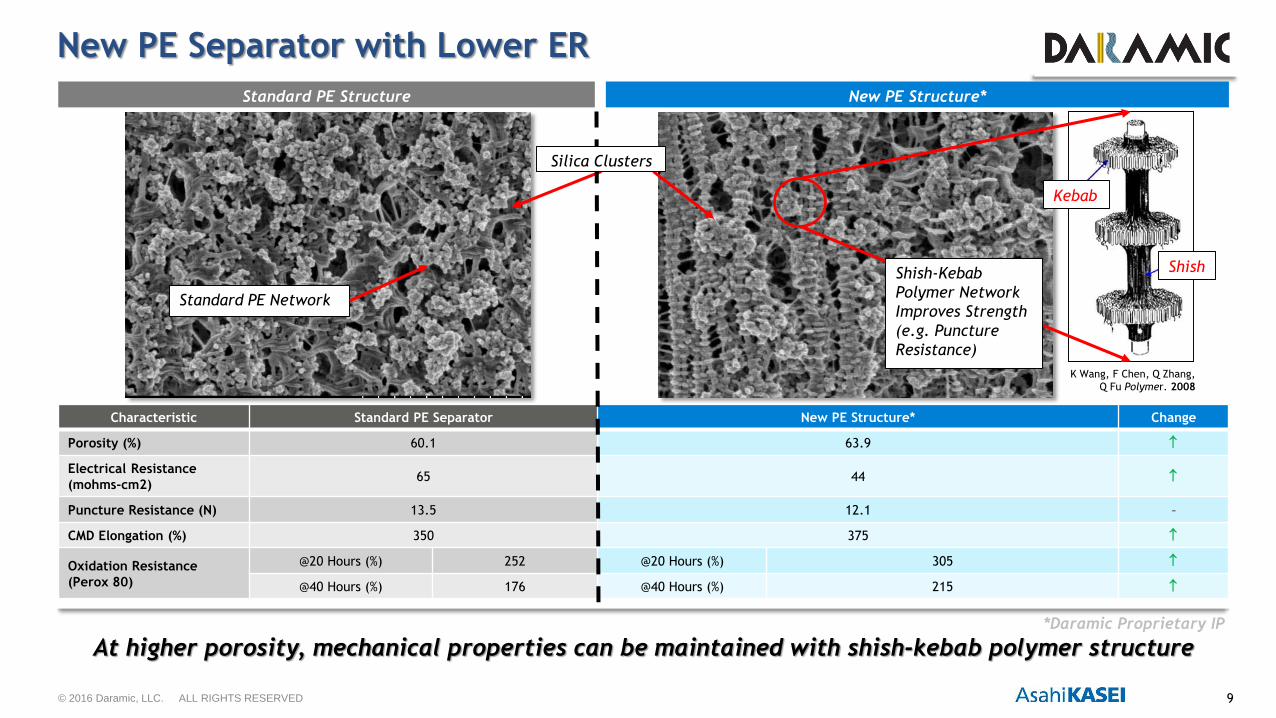
At higher porosity, mechanical properties can be maintained with shish-kebab polymer structure
K Wang, F Chen, Q Zhang,
Q Fu Polymer. 2008
New PE Structure*
Characteristic Standard PE Separator New PE Structure* Change
Porosity (%) 60.1 63.9
Electrical Resistance
(mohms-cm2)65 44
Puncture Resistance (N) 13.5 12.1 -
CMD Elongation (%) 350 375
Oxidation Resistance
(Perox 80)
@20 Hours (%) 252 @20 Hours (%) 305
@40 Hours (%) 176 @40 Hours (%) 215
Standard PE Network
Standard PE Structure
Shish-Kebab
Polymer Network
Improves Strength
(e.g. Puncture
Resistance)
Silica Clusters
Kebab
Shish
*Daramic Proprietary IP
© 2016 Daramic, LLC. ALL RIGHTS RESERVED 10
Cold start battery test results with various separators
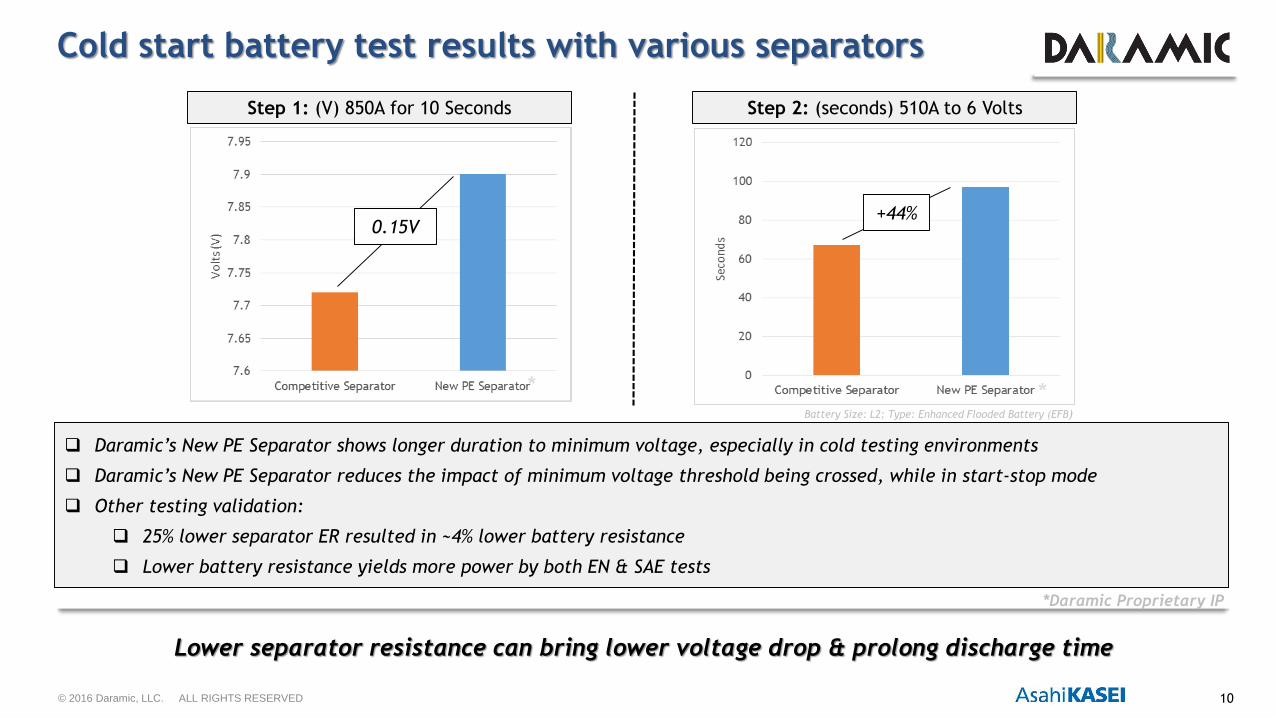
Lower separator resistance can bring lower voltage drop & prolong discharge time
Battery Size: L2; Type: Enhanced Flooded Battery (EFB)
Step 1: (V) 850A for 10 Seconds
0.15V+44%
Daramic’s New PE Separator shows longer duration to minimum voltage, especially in cold testing environments
Daramic’s New PE Separator reduces the impact of minimum voltage threshold being crossed, while in start-stop mode
Other testing validation:
25% lower separator ER resulted in ~4% lower battery resistance
Lower battery resistance yields more power by both EN & SAE tests
Step 2: (seconds) 510A to 6 Volts
*Daramic Proprietary IP
**
© 2016 Daramic, LLC. ALL RIGHTS RESERVED 11
Power Output Cycling in PSoCDynamic Charge
Acceptance
• Modified Separator to prevent acid stratification and improve cycling
Innovation in Enhanced Flooded Lead-Acid Batteries
© 2016 Daramic, LLC. ALL RIGHTS RESERVED 12
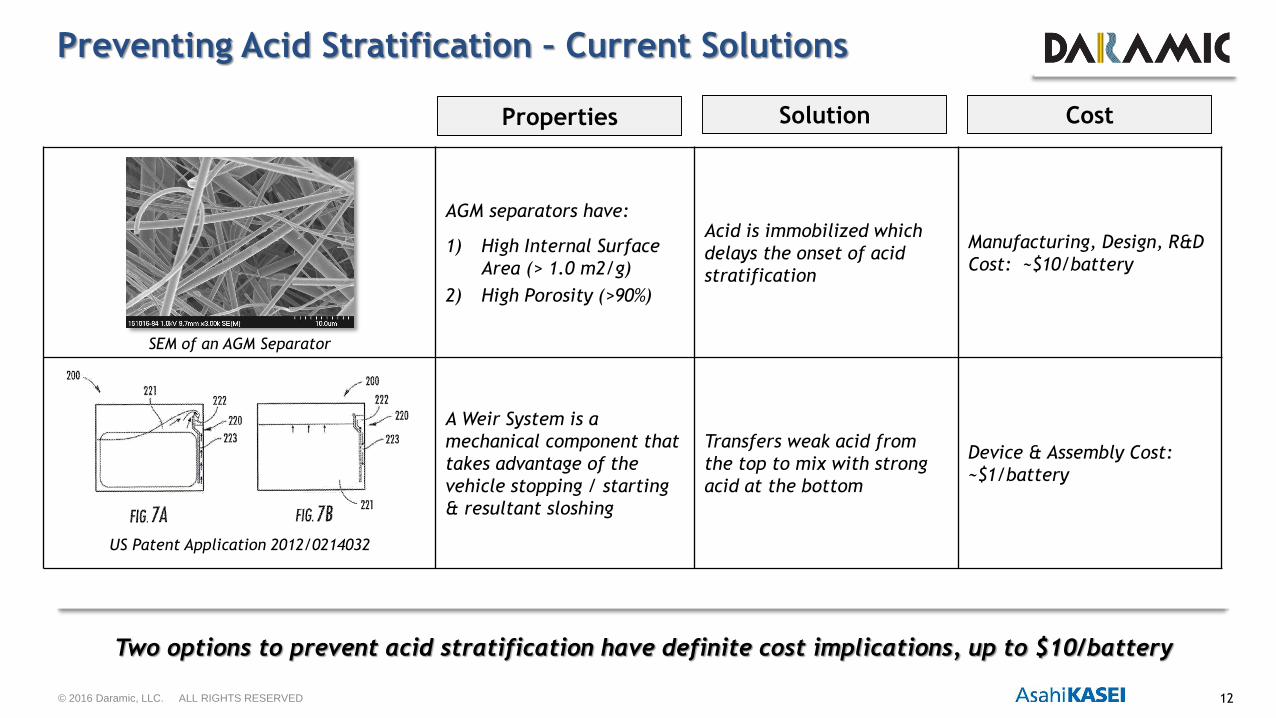
Preventing Acid Stratification – Current Solutions
Two options to prevent acid stratification have definite cost implications, up to $10/battery
AGM separators have:
1) High Internal Surface
Area (> 1.0 m2/g)
2) High Porosity (>90%)
Acid is immobilized which
delays the onset of acid
stratification
Manufacturing, Design, R&D
Cost: ~$10/battery
A Weir System is a
mechanical component that
takes advantage of the
vehicle stopping / starting
& resultant sloshing
Transfers weak acid from
the top to mix with strong
acid at the bottom
Device & Assembly Cost:
~$1/battery
SEM of an AGM Separator
US Patent Application 2012/0214032
CostSolutionProperties
© 2016 Daramic, LLC. ALL RIGHTS RESERVED 13
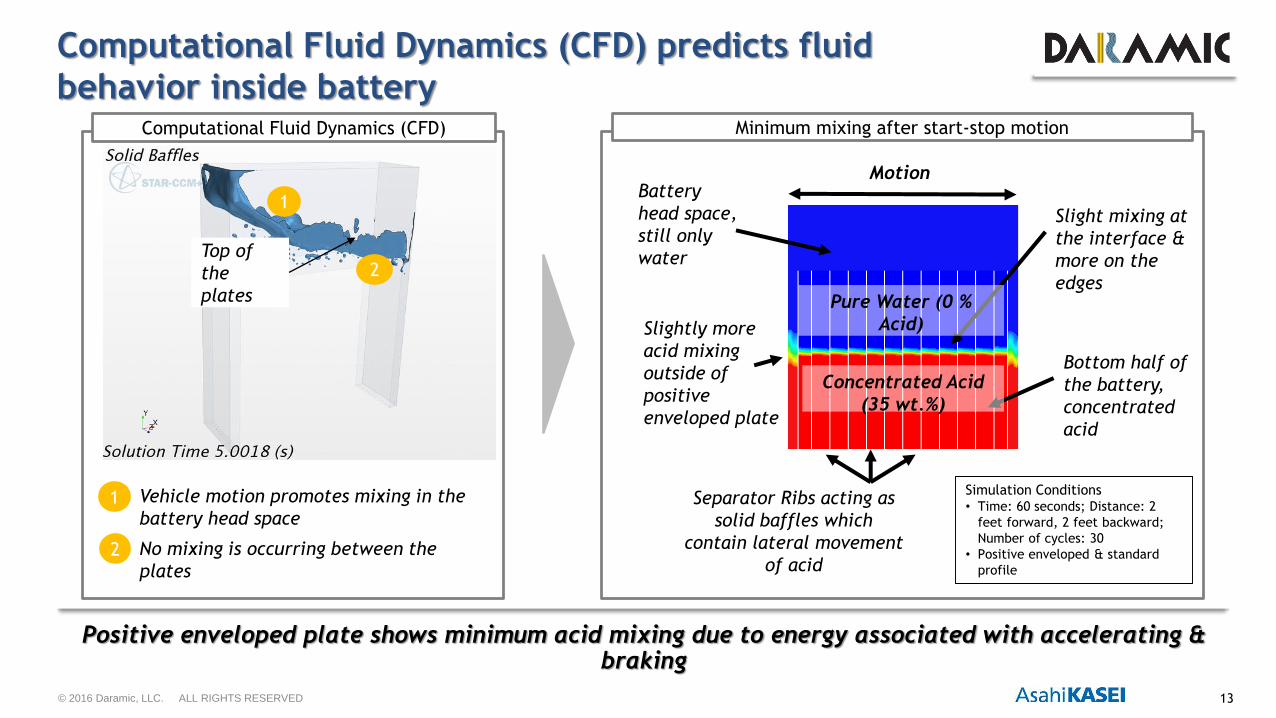
Computational Fluid Dynamics (CFD) predicts fluid
behavior inside battery
Positive enveloped plate shows minimum acid mixing due to energy associated with accelerating & braking
Simulation Conditions• Time: 60 seconds; Distance: 2
feet forward, 2 feet backward;
Number of cycles: 30
• Positive enveloped & standard
profile
Battery
head space,
still only
water
Separator Ribs acting as
solid baffles which
contain lateral movement
of acid
Bottom half of
the battery,
concentrated
acid
Slight mixing at
the interface &
more on the
edges
Slightly more
acid mixing
outside of
positive
enveloped plate
Concentrated Acid
(35 wt.%)
Pure Water (0 %
Acid)
Motion
1. Vehicle motion promotes mixing in the
battery head space
2. No mixing is occurring between the
plates
1
2Top of
the
plates
Minimum mixing after start-stop motion Computational Fluid Dynamics (CFD)
1
2
© 2016 Daramic, LLC. ALL RIGHTS RESERVED 14
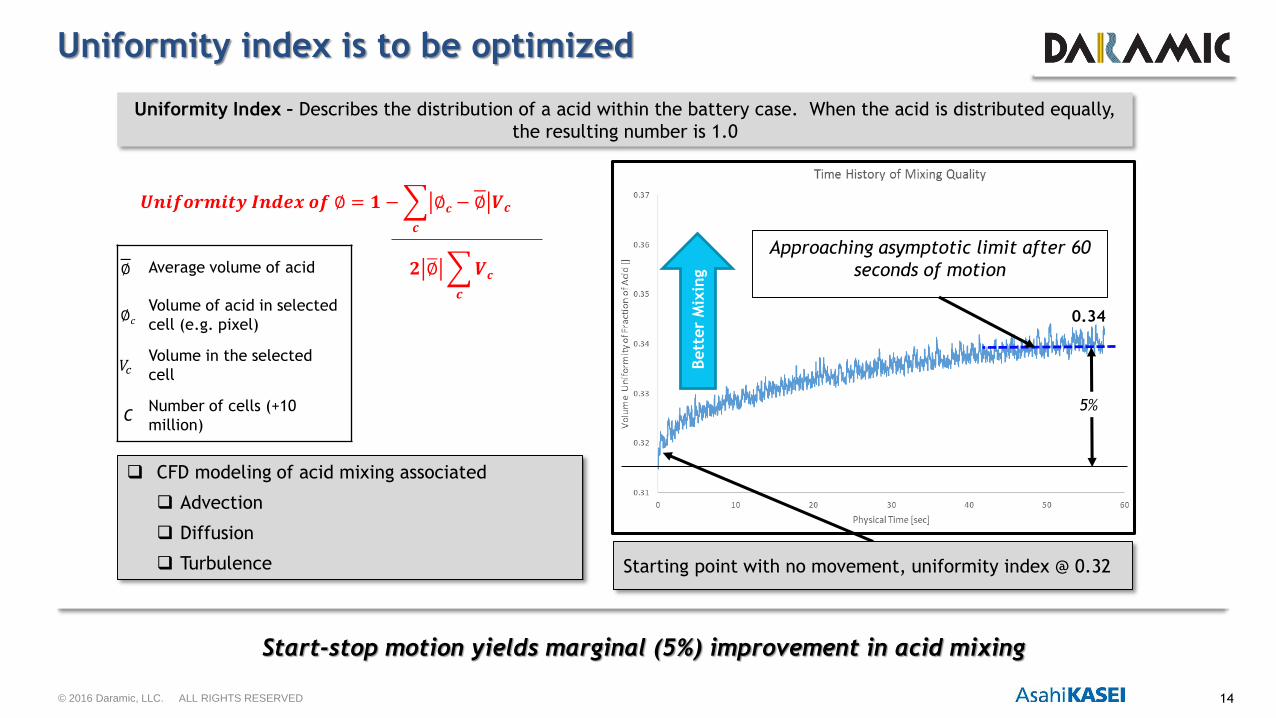
Uniformity index is to be optimized
Start-stop motion yields marginal (5%) improvement in acid mixing
Uniformity Index – Describes the distribution of a acid within the battery case. When the acid is distributed equally,
the resulting number is 1.0
CFD modeling of acid mixing associated
Advection
Diffusion
Turbulence
𝑼𝒏𝒊𝒇𝒐𝒓𝒎𝒊𝒕𝒚 𝑰𝒏𝒅𝒆𝒙 𝒐𝒇 ∅ = 𝟏 −
𝒄
∅𝒄− ∅ 𝑽𝒄
𝟐 ∅
𝒄
𝑽𝒄
0.34
Bett
er
Mix
ing
5%
Approaching asymptotic limit after 60
seconds of motion∅ Average volume of acid
∅𝑐Volume of acid in selected
cell (e.g. pixel)
𝑉𝑐Volume in the selected
cell
CNumber of cells (+10
million)
Starting point with no movement, uniformity index @ 0.32
© 2016 Daramic, LLC. ALL RIGHTS RESERVED 15
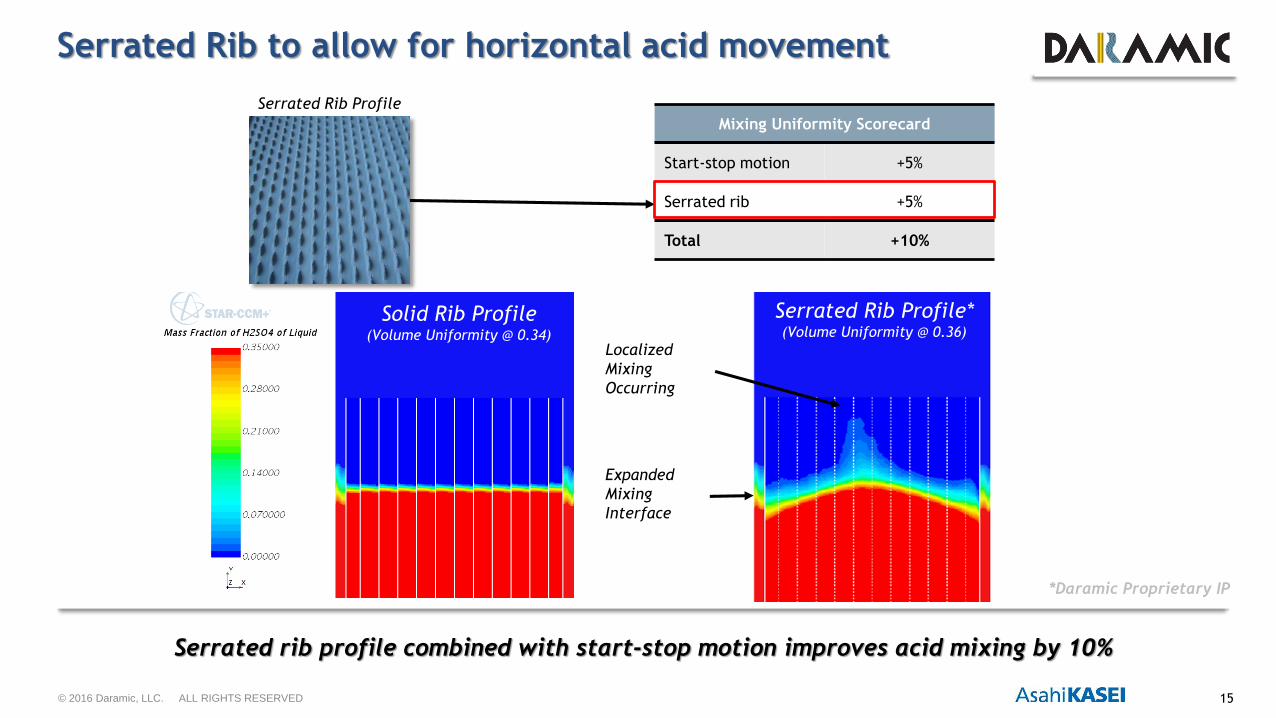
Serrated Rib to allow for horizontal acid movement
Serrated rib profile combined with start-stop motion improves acid mixing by 10%
Solid Rib Profile(Volume Uniformity @ 0.34)
Serrated Rib Profile*(Volume Uniformity @ 0.36)
Expanded
Mixing
Interface
Localized
Mixing
Occurring
Serrated Rib Profile
Mixing Uniformity Scorecard
Start-stop motion +5%
Serrated rib +5%
Total +10%
*Daramic Proprietary IP
© 2016 Daramic, LLC. ALL RIGHTS RESERVED 16
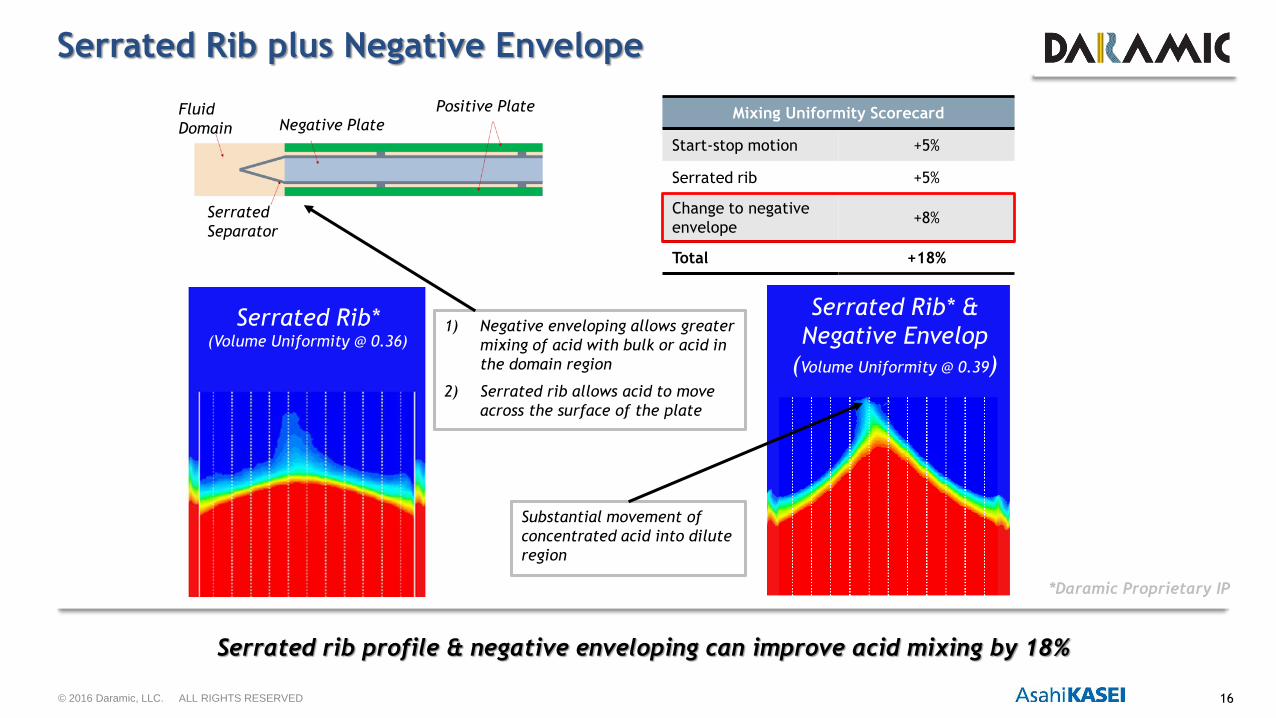
Serrated Rib plus Negative Envelope
Serrated rib profile & negative enveloping can improve acid mixing by 18%
Serrated Rib*(Volume Uniformity @ 0.36)
Serrated Rib* &
Negative Envelop
(Volume Uniformity @ 0.39)
1) Negative enveloping allows greater
mixing of acid with bulk or acid in
the domain region
2) Serrated rib allows acid to move
across the surface of the plate
Substantial movement of
concentrated acid into dilute
region
Mixing Uniformity Scorecard
Start-stop motion +5%
Serrated rib +5%
Change to negative
envelope+8%
Total +18%
Positive PlateNegative Plate
Fluid
Domain
Serrated
Separator
*Daramic Proprietary IP
© 2016 Daramic, LLC. ALL RIGHTS RESERVED 17
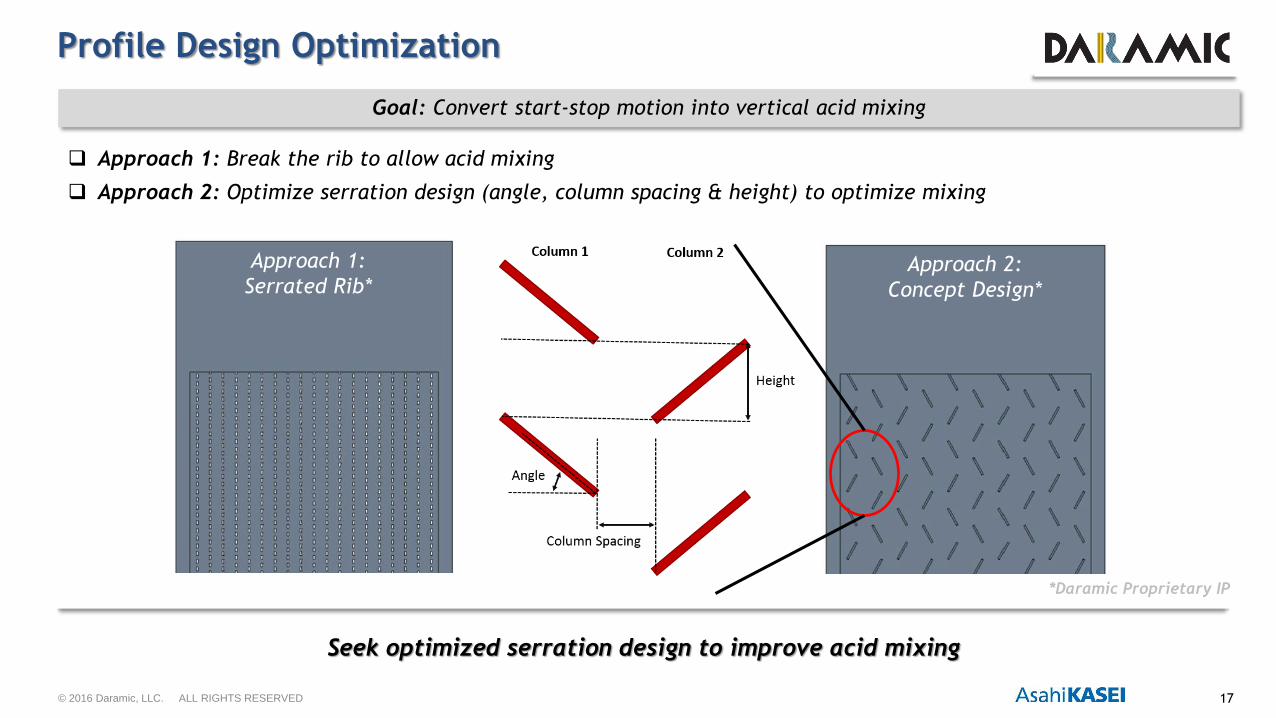
Profile Design Optimization
Seek optimized serration design to improve acid mixing
Approach 1: Break the rib to allow acid mixing
Approach 2: Optimize serration design (angle, column spacing & height) to optimize mixing
Approach 1:
Serrated Rib* Approach 2:
Concept Design*
Goal: Convert start-stop motion into vertical acid mixing
*Daramic Proprietary IP
© 2016 Daramic, LLC. ALL RIGHTS RESERVED 18
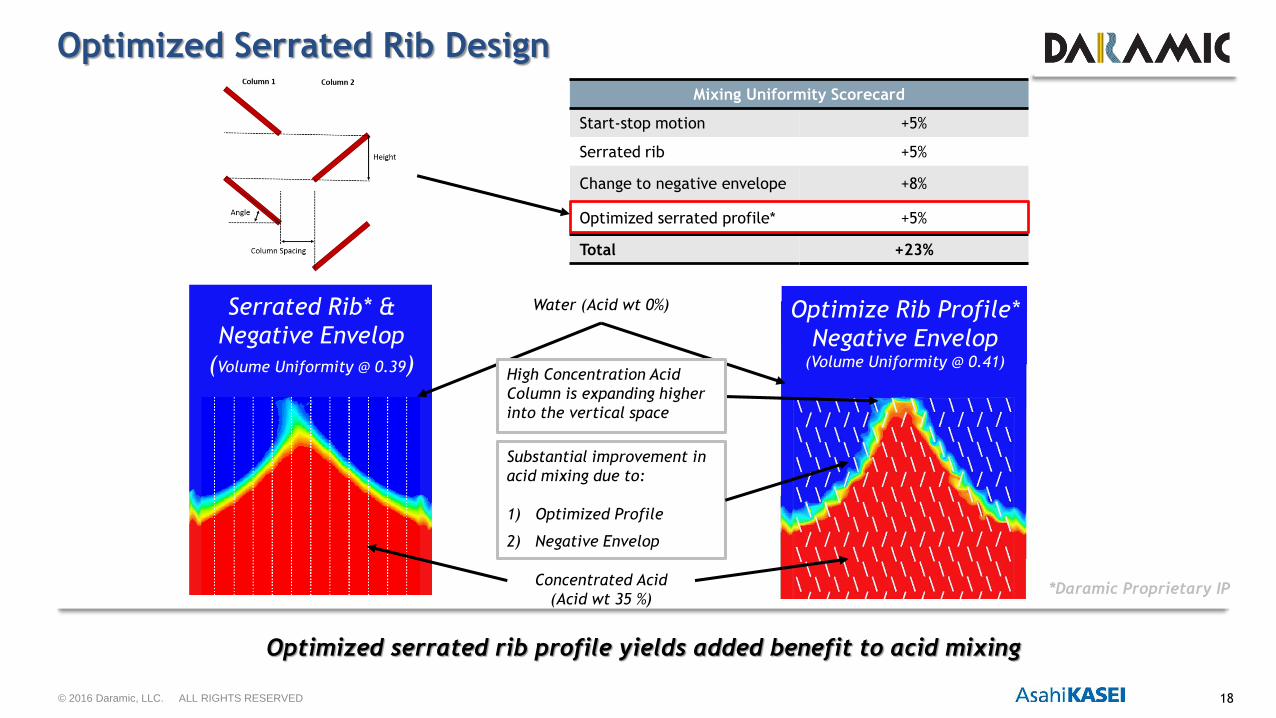
Optimized Serrated Rib Design
Optimized serrated rib profile yields added benefit to acid mixing
Serrated Rib* &
Negative Envelop
(Volume Uniformity @ 0.39)
Optimize Rib Profile*
Negative Envelop(Volume Uniformity @ 0.41)
Mixing Uniformity Scorecard
Start-stop motion +5%
Serrated rib +5%
Change to negative envelope +8%
Optimized serrated profile* +5%
Total +23%
Substantial improvement in
acid mixing due to:
1) Optimized Profile
2) Negative Envelop
Water (Acid wt 0%)
High Concentration Acid
Column is expanding higher
into the vertical space
*Daramic Proprietary IPConcentrated Acid
(Acid wt 35 %)
© 2016 Daramic, LLC. ALL RIGHTS RESERVED 19
Bett
er
Mix
ing
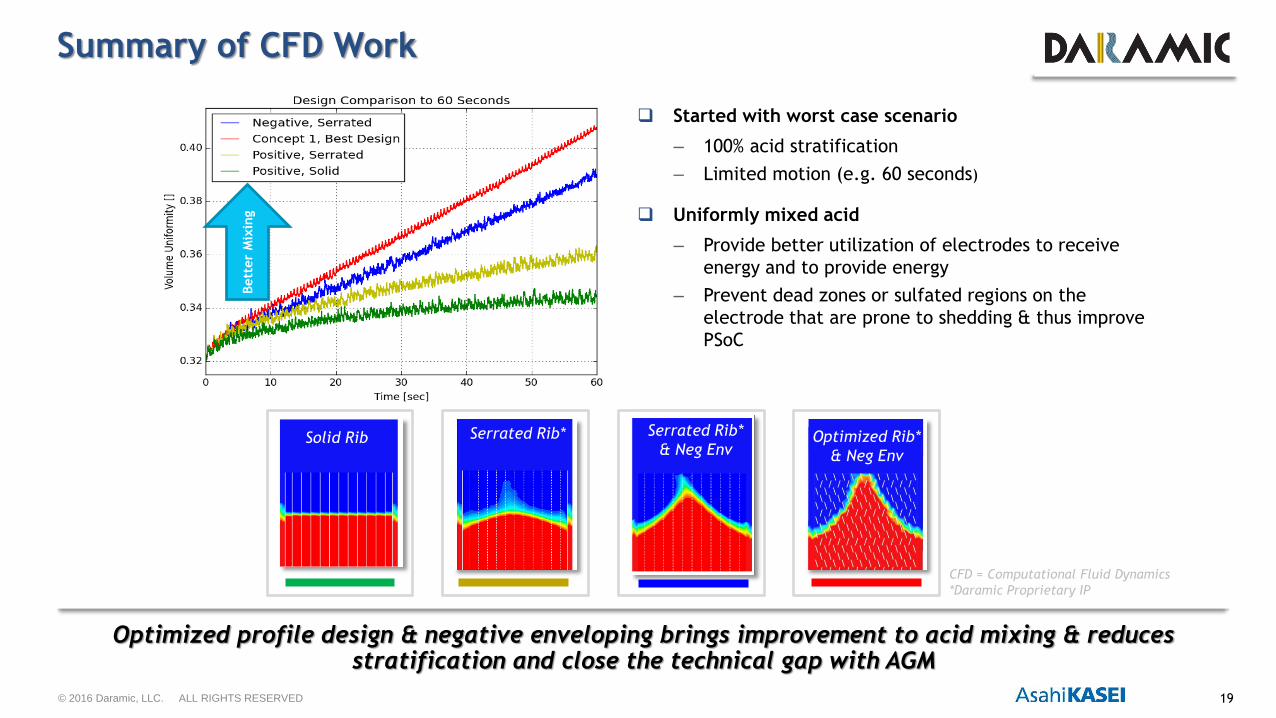
Summary of CFD Work
Optimized profile design & negative enveloping brings improvement to acid mixing & reduces stratification and close the technical gap with AGM
Started with worst case scenario
– 100% acid stratification
– Limited motion (e.g. 60 seconds)
Uniformly mixed acid
– Provide better utilization of electrodes to receive
energy and to provide energy
– Prevent dead zones or sulfated regions on the
electrode that are prone to shedding & thus improve
PSoC
Solid Rib Serrated Rib* Serrated Rib*
& Neg EnvOptimized Rib*
& Neg Env
CFD = Computational Fluid Dynamics
*Daramic Proprietary IP
© 2016 Daramic, LLC. ALL RIGHTS RESERVED 20
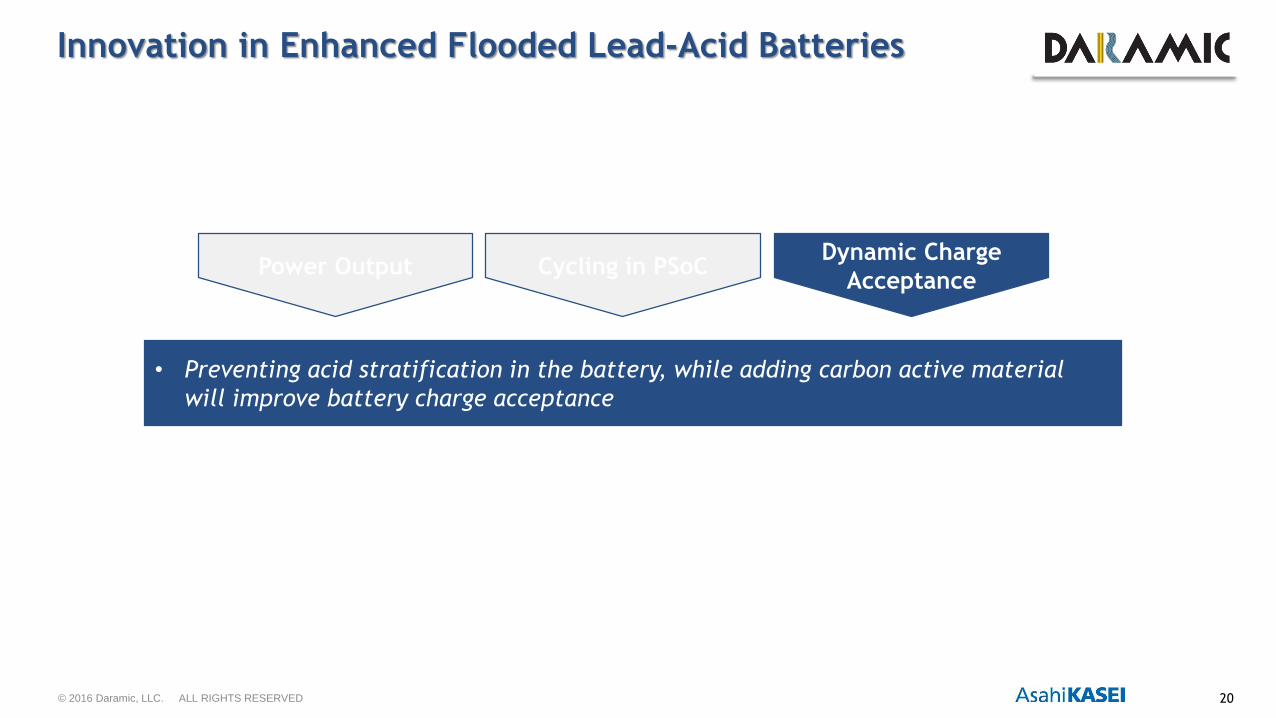
Power Output Cycling in PSoCDynamic Charge
Acceptance
• Preventing acid stratification in the battery, while adding carbon active material
will improve battery charge acceptance
Innovation in Enhanced Flooded Lead-Acid Batteries
© 2016 Daramic, LLC. ALL RIGHTS RESERVED 21
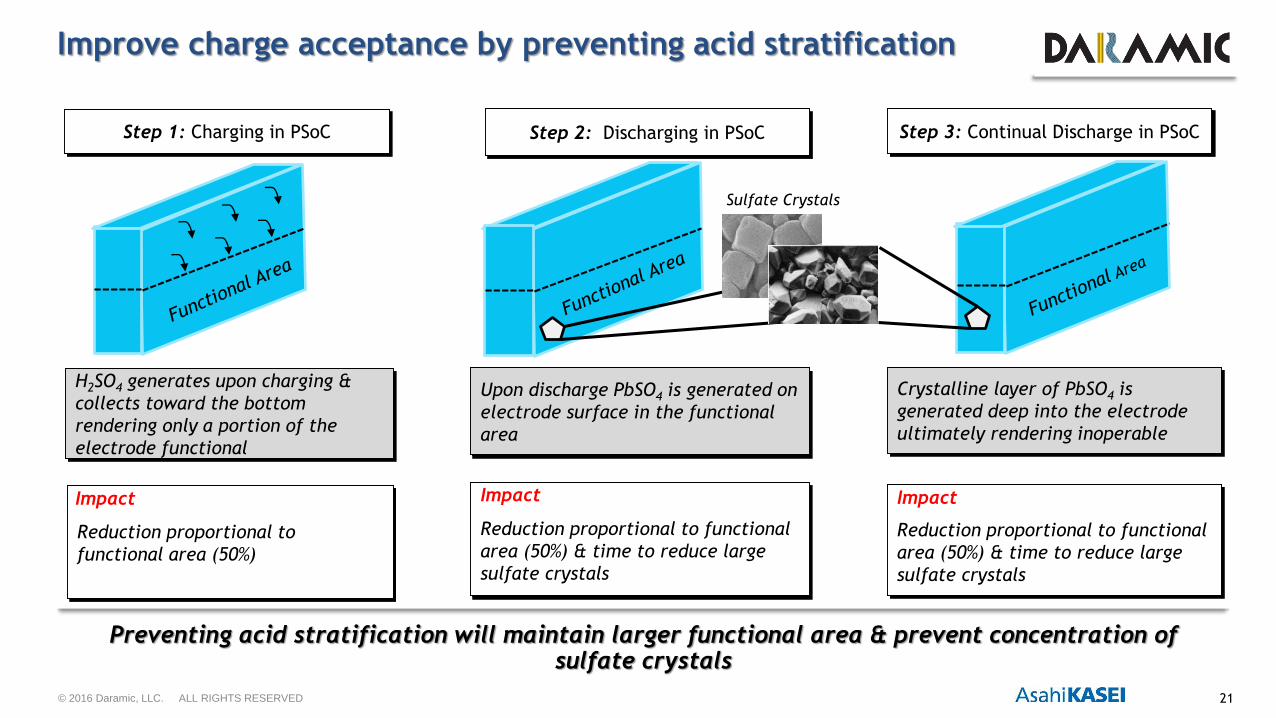
Improve charge acceptance by preventing acid stratification
Preventing acid stratification will maintain larger functional area & prevent concentration of sulfate crystals
Step 1: Charging in PSoC
H2SO4 generates upon charging &
collects toward the bottom
rendering only a portion of the
electrode functional
Upon discharge PbSO4 is generated on
electrode surface in the functional
area
Crystalline layer of PbSO4 is
generated deep into the electrode
ultimately rendering inoperable
Reduction proportional to
functional area (50%)
Reduction proportional to functional
area (50%) & time to reduce large
sulfate crystals
Impact Impact
Sulfate Crystals
Step 2: Discharging in PSoC Step 3: Continual Discharge in PSoC
Reduction proportional to functional
area (50%) & time to reduce large
sulfate crystals
Impact
© 2016 Daramic, LLC. ALL RIGHTS RESERVED 22
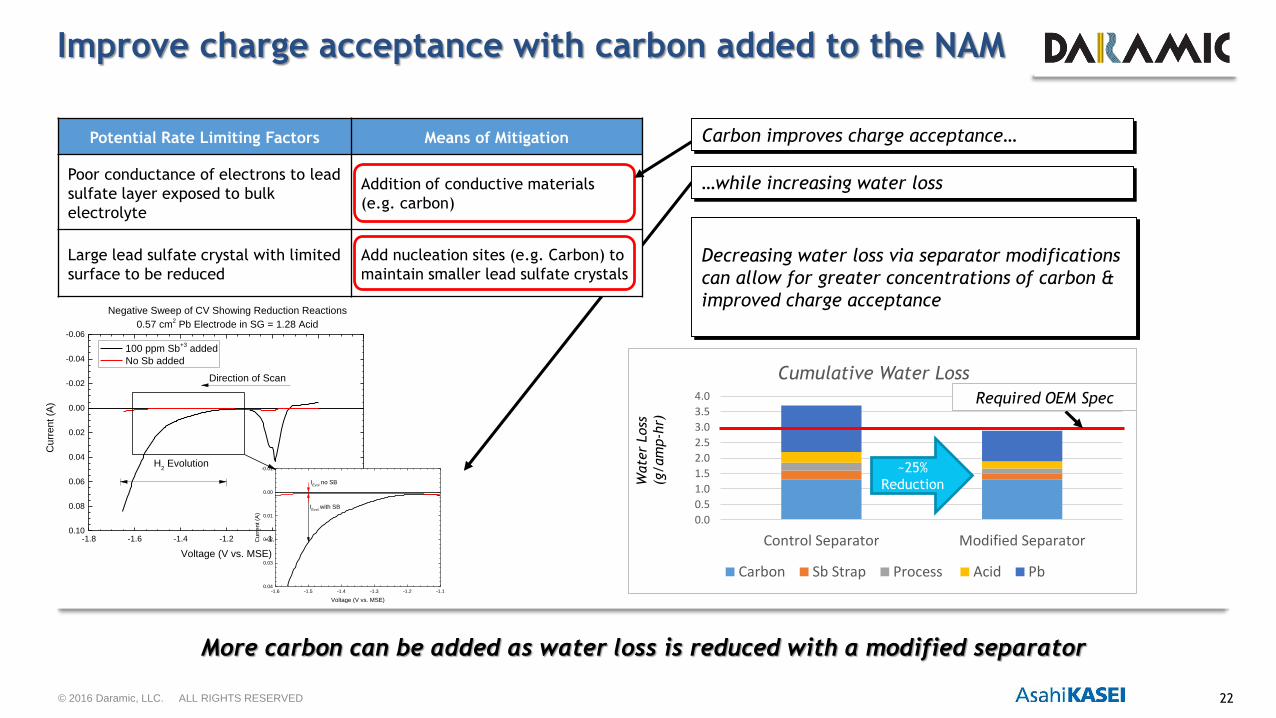
0.0
0.5
1.0
1.5
2.0
2.5
3.0
3.5
4.0
Control Separator Modified Separator
Cumulative Water Loss
Carbon Sb Strap Process Acid Pb
Improve charge acceptance with carbon added to the NAM
More carbon can be added as water loss is reduced with a modified separator
Potential Rate Limiting Factors Means of Mitigation
Poor conductance of electrons to lead
sulfate layer exposed to bulk
electrolyte
Addition of conductive materials
(e.g. carbon)
Large lead sulfate crystal with limited
surface to be reduced
Add nucleation sites (e.g. Carbon) to
maintain smaller lead sulfate crystals
-1.8 -1.6 -1.4 -1.2 -1.0 -0.8 -0.60.10
0.08
0.06
0.04
0.02
0.00
-0.02
-0.04
-0.06
Direction of Scan
Curr
ent
(A)
Voltage (V vs. MSE)
100 ppm Sb+3
added
No Sb added
Negative Sweep of CV Showing Reduction Reactions
0.57 cm2 Pb Electrode in SG = 1.28 Acid
H2 Evolution
-1.6 -1.5 -1.4 -1.3 -1.2 -1.10.04
0.03
0.02
0.01
0.00
-0.01
IEvol
with SB
Cu
rre
nt (A
)
Voltage (V vs. MSE)
IEvol
no SB
Carbon improves charge acceptance…
…while increasing water loss
Decreasing water loss via separator modifications
can allow for greater concentrations of carbon &
improved charge acceptance
Required OEM Spec
Wate
r Loss
(g/am
p-h
r)
~25%
Reduction
© 2016 Daramic, LLC. ALL RIGHTS RESERVED 23
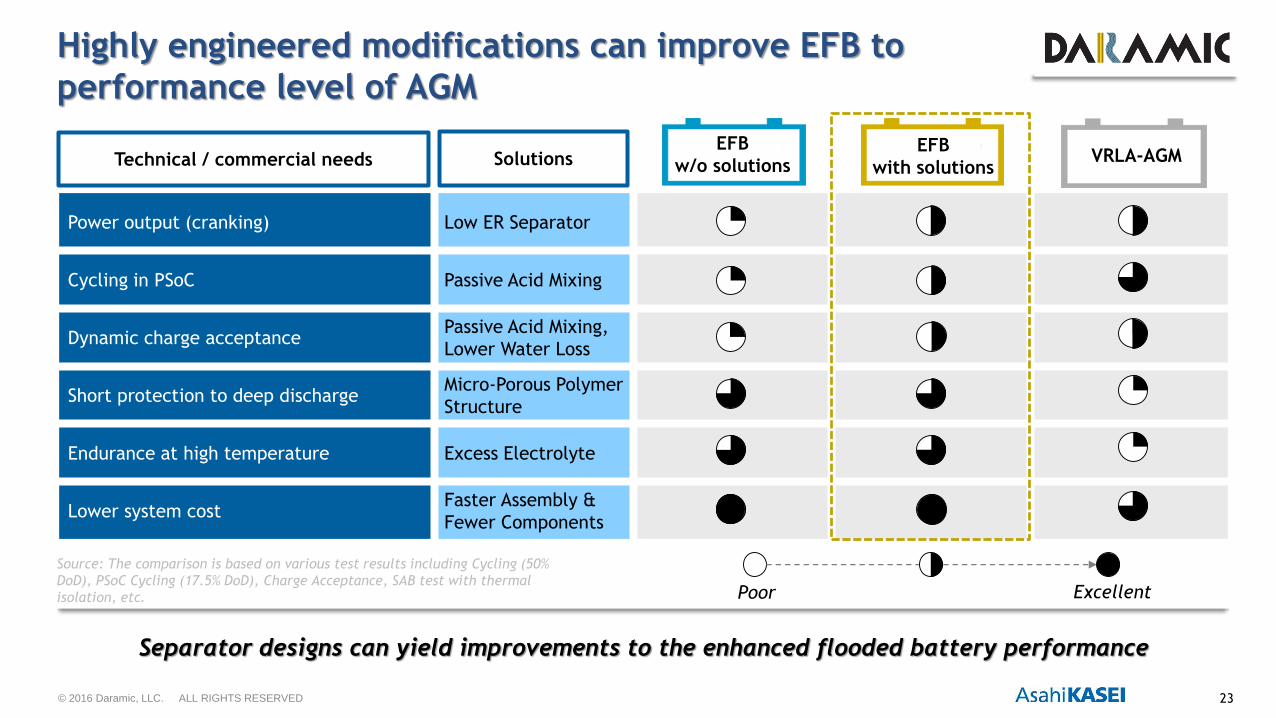
Highly engineered modifications can improve EFB to
performance level of AGM
Separator designs can yield improvements to the enhanced flooded battery performance
Technical / commercial needs
Power output (cranking) Low ER Separator
Cycling in PSoC Passive Acid Mixing
Dynamic charge acceptancePassive Acid Mixing,
Lower Water Loss
Short protection to deep dischargeMicro-Porous Polymer
Structure
Endurance at high temperature Excess Electrolyte
Lower system costFaster Assembly &
Fewer Components
Poor Excellent
Source: The comparison is based on various test results including Cycling (50%
DoD), PSoC Cycling (17.5% DoD), Charge Acceptance, SAB test with thermal
isolation, etc.
Solutions VRLA-AGMEFB
w/o solutionsEFB
with solutions
© 2016 Daramic, LLC. ALL RIGHTS RESERVED 24
Thank you!