Embed Size (px)
Citation preview
Service Catalog ReportingStep Your Metrics Up A Gear
Barclay Rae, Global Head of ServicesBrian Hendry, Service Development Manager
2
Agenda
Service Catalog – what is it?
Making the most of metrics
Benefits of metrics
Top tips for metrics
Summary of webcast series
Questions and feedback
3
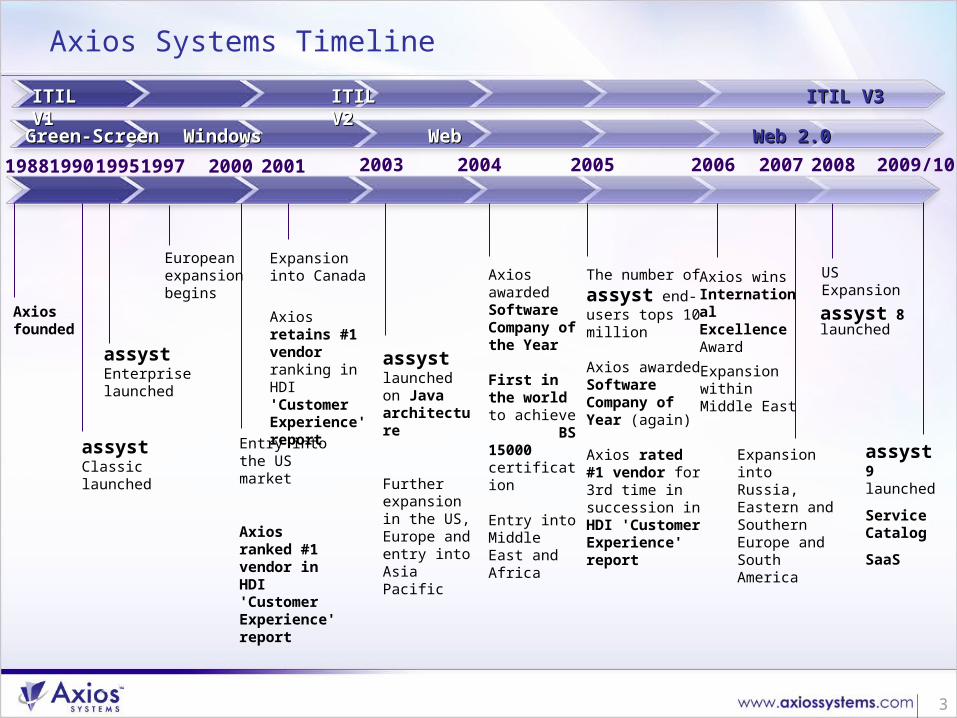
WindowsWindows WebWeb Web 2.0Web 2.0Green-ScreenGreen-Screen
Axios founded
assyst Classic launched
assyst Enterprise launched
Entry into the US market
Axios ranked #1 vendor in HDI 'Customer Experience' report
Expansion into Canada
Axios retains #1 vendor ranking in HDI 'Customer Experience' report
assyst launched on Java architecture
Further expansion in the US, Europe and entry into Asia Pacific
Axios awarded Software Company of the Year
First in the world to achieve BS 15000 certification
Entry into Middle East and Africa
The number of
assyst end-users tops 10 million
Axios awarded Software Company of Year (again)
Axios rated #1 vendor for 3rd time in succession in HDI 'Customer Experience' report
Expansion into Russia, Eastern and Southern Europe and South America
Axios wins International ExcellenceAward
Expansion withinMiddle East
ITIL V1ITIL V1 ITIL V3ITIL V3ITIL V2ITIL V2
Axios Systems Timeline
assyst 8 launched
US Expansion
European expansion begins
assyst 9 launched
Service Catalog
SaaS
1988 2005199019951997 20002001 2003 2004 2006 20072008 2009/10
Service Catalog – what is it?
5
6
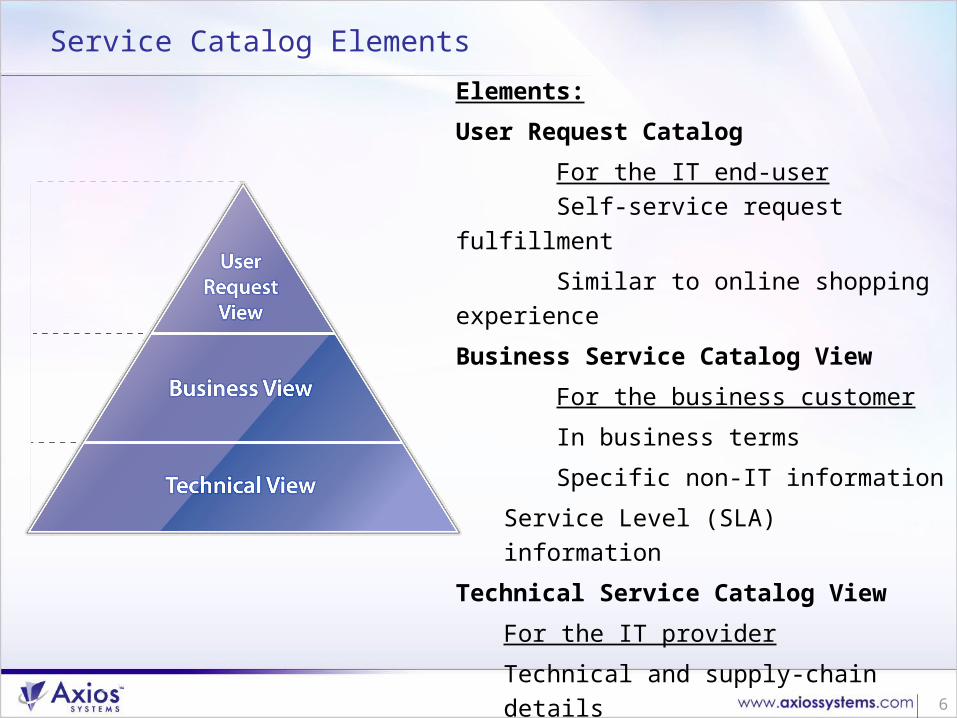
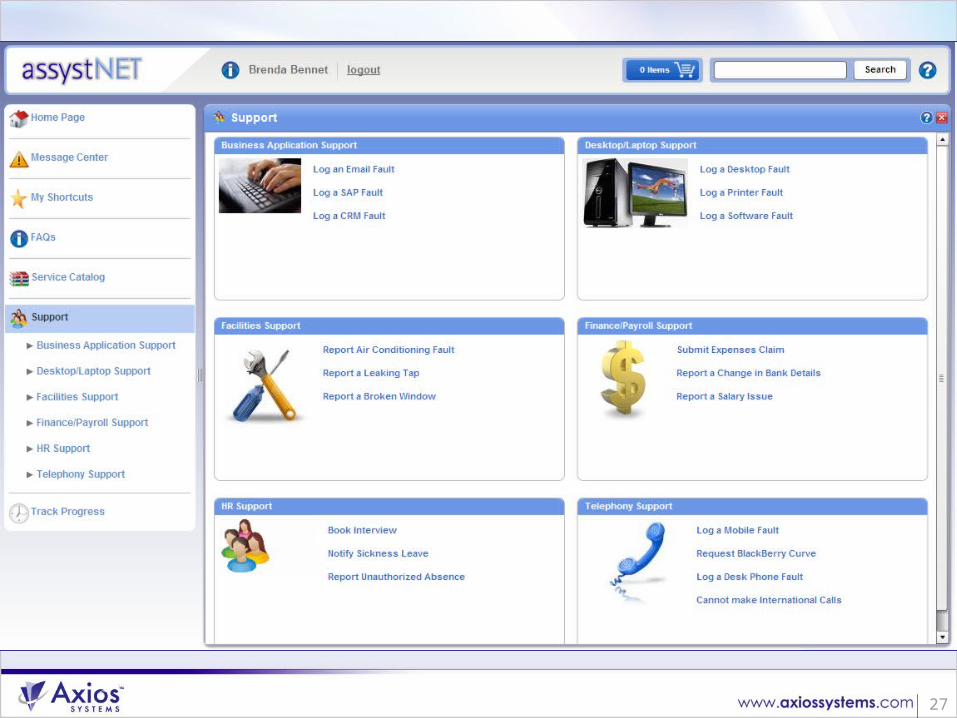
Service Catalog Elements
Elements:
User Request Catalog
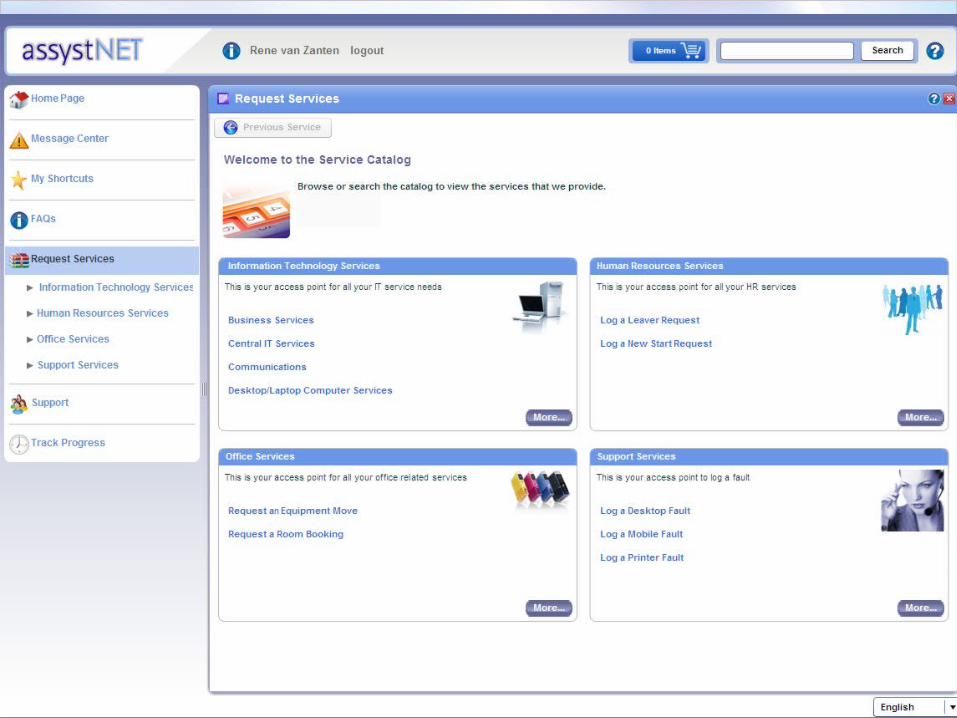
For the IT end-user Self-service request fulfillment
Similar to online shopping experience
Business Service Catalog View
For the business customer
In business terms
Specific non-IT information
Service Level (SLA) information
Technical Service Catalog View
For the IT provider
Technical and supply-chain details
Component level service data
OLA and UC information
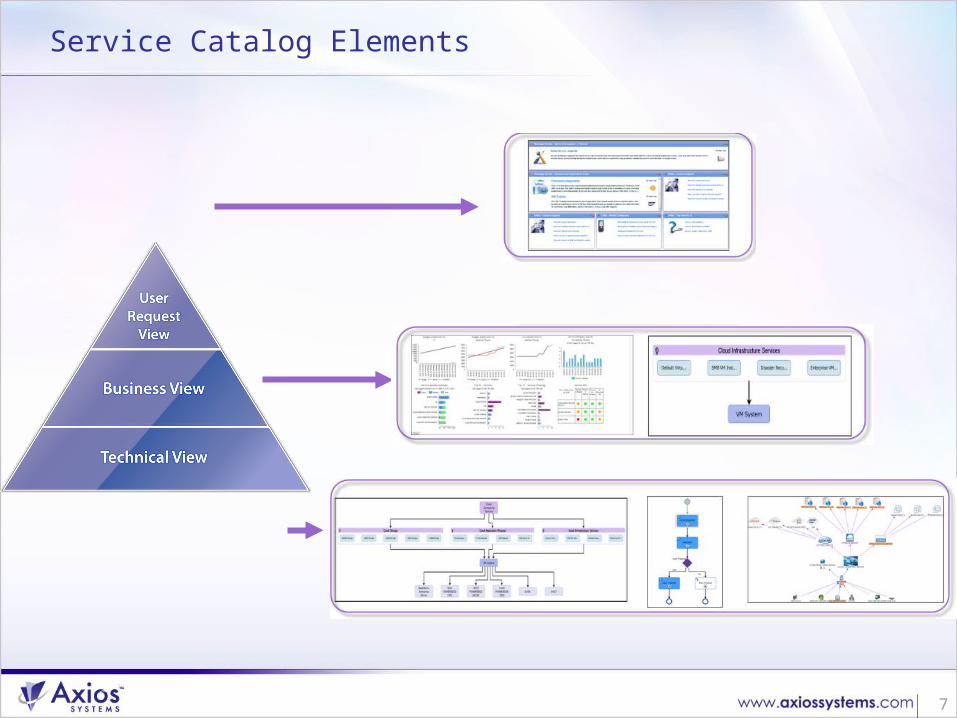
7
Service Catalog Elements
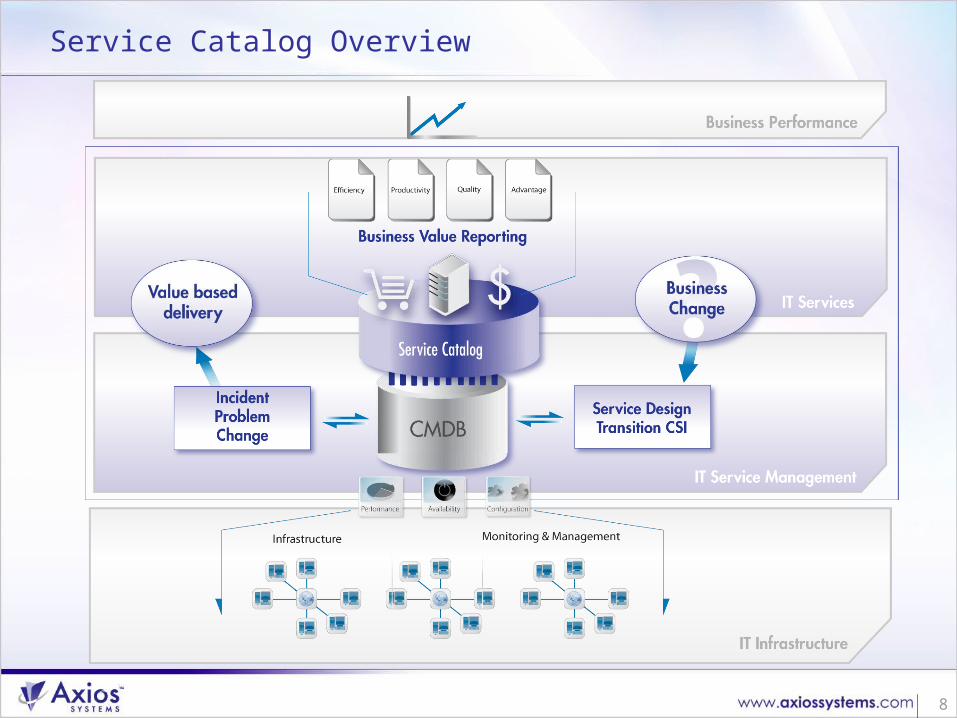
8
Service Catalog Overview
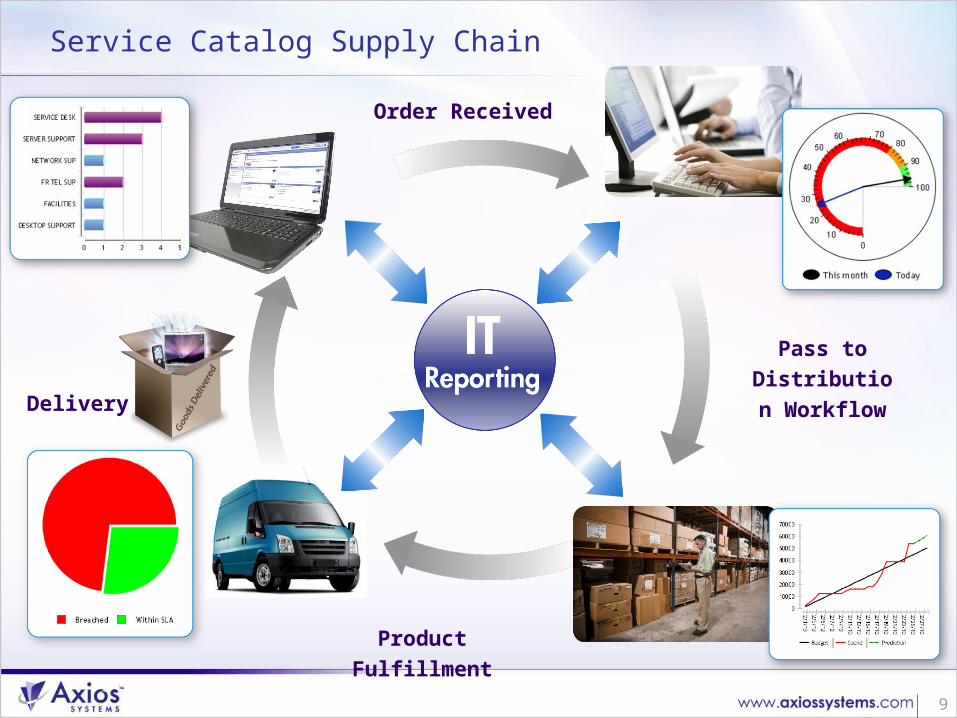
9
Delivery
Order Received
Product Fulfillment
Pass to Distribution Workflow
Service Catalog Supply Chain
Making the most of metrics
11
Why Have Metrics?
Without metrics, organizations would have to operate on gut instinct/feelings
A decision based on an inaccurate conclusion can be costly
Time wasted is money wasted. In this era of tight resources, our organizations cannot afford to waste either
By monitoring a few key business metrics, organizations can gauge their business results and can improve them
12
What Do We Need To Ensure Meaningful Metrics?
Everyone is aware of the saying “garbage in, garbage out”
Producing good quality metrics will be difficult without having accurate, appropriate and up-to-date data to report on
IT needs to ensure that they are storing the correct data and adequately maintaining it
This data is the lifeblood of good metrics
13
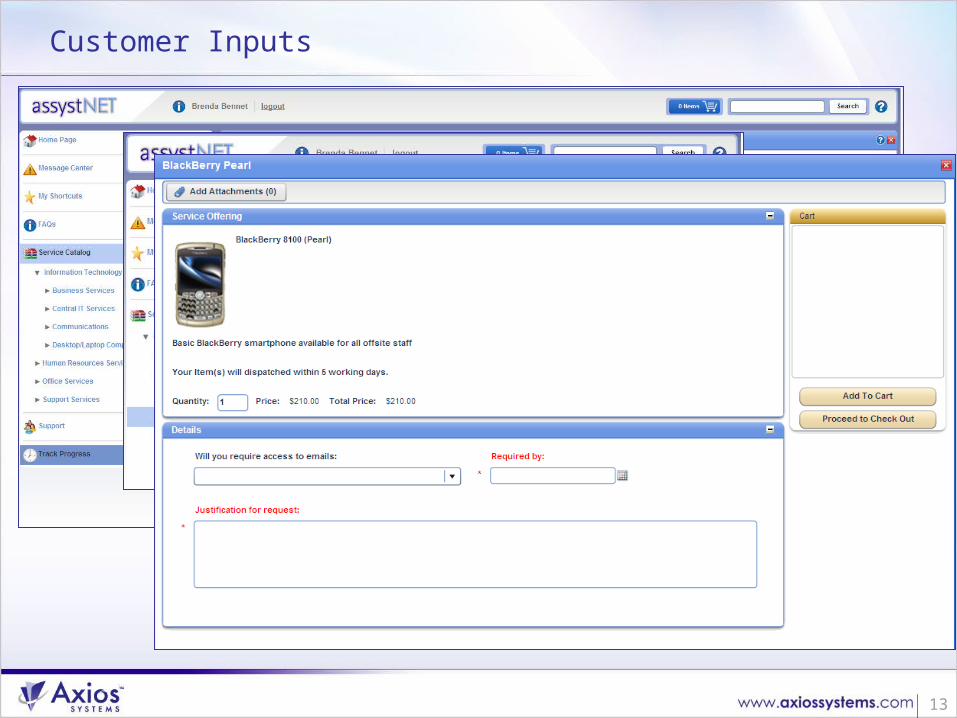
Customer Inputs
14
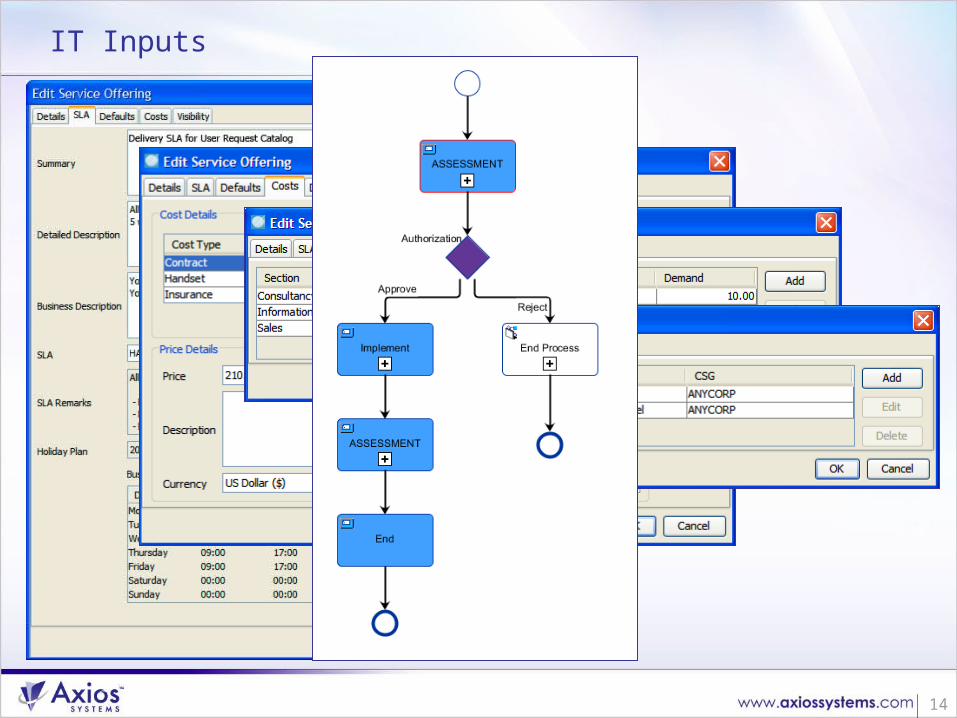
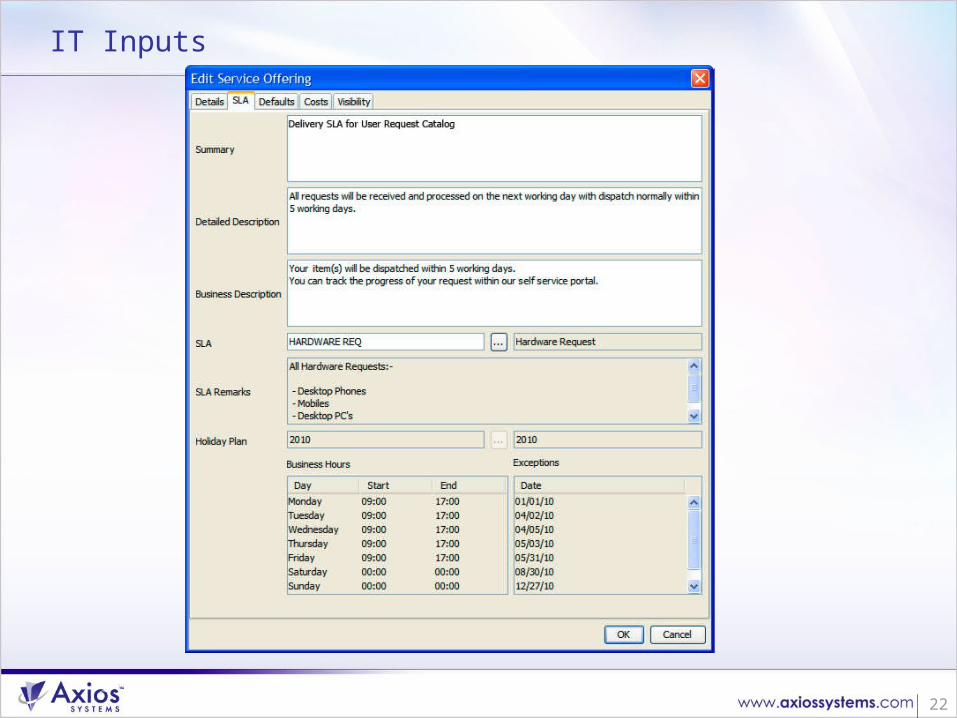
IT Inputs
Typical types of reports
16
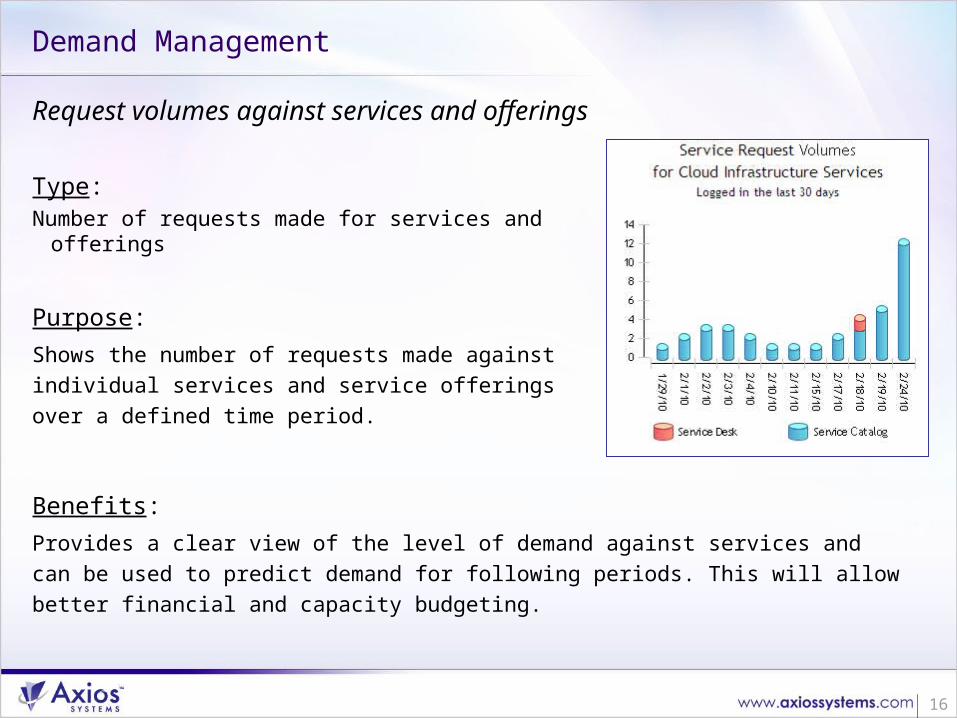
Demand Management
Request volumes against services and offerings
Purpose:
Shows the number of requests made against individual services and service offerings over a defined time period.
Type:Number of requests made for services and offerings
Benefits:
Provides a clear view of the level of demand against services and can be used to predict demand for following periods. This will allow better financial and capacity budgeting.
17
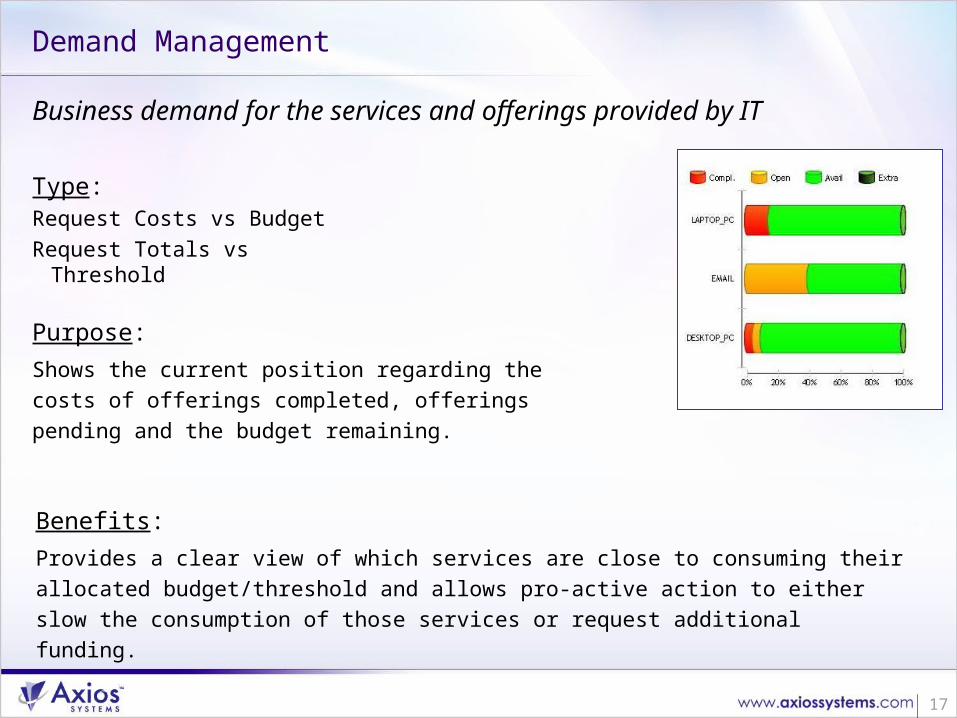
Demand Management
Business demand for the services and offerings provided by IT
Purpose:
Shows the current position regarding the costs of offerings completed, offerings pending and the budget remaining.
Type:Request Costs vs BudgetRequest Totals vs Threshold
Benefits:
Provides a clear view of which services are close to consuming their allocated budget/threshold and allows pro-active action to either slow the consumption of those services or request additional funding.
.
18
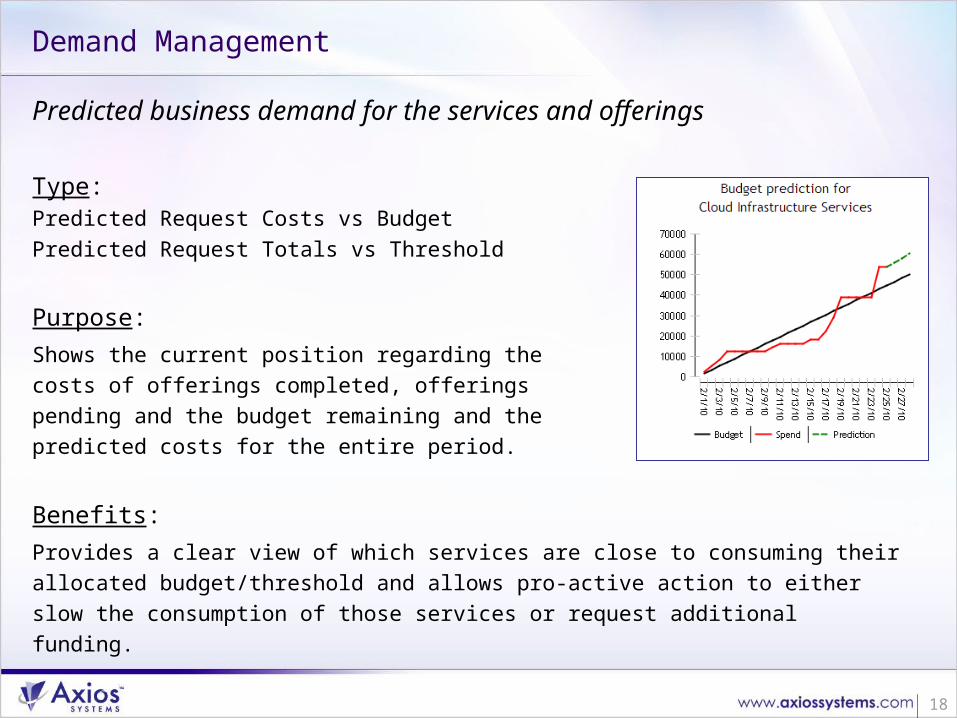
Demand Management
Predicted business demand for the services and offerings
Purpose:
Shows the current position regarding the costs of offerings completed, offerings pending and the budget remaining and the predicted costs for the entire period.
Type:Predicted Request Costs vs BudgetPredicted Request Totals vs Threshold
Benefits:
Provides a clear view of which services are close to consuming their allocated budget/threshold and allows pro-active action to either slow the consumption of those services or request additional funding.
19
Demand Management - Outcomes
Optimize service design to suit demand
Adjust allocation of resources and scheduling to meet demands
Ability to approve suitable incentives to influence demand
Ability to accurately approve investments in additional capacity, new services or changes to services
20
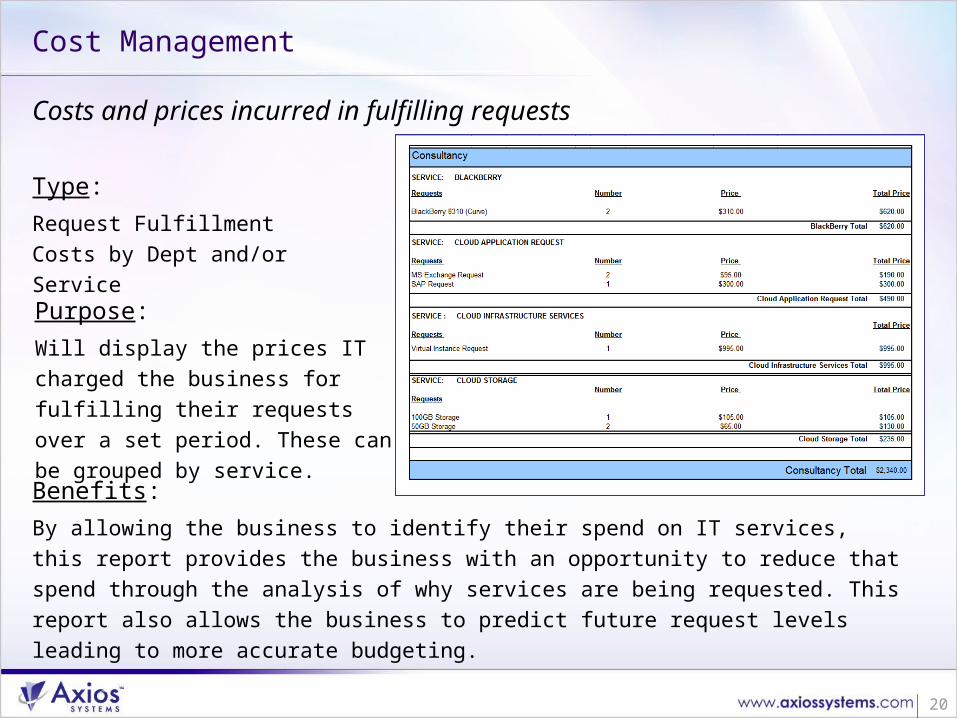
Cost Management
Costs and prices incurred in fulfilling requests
Purpose:
Will display the prices IT charged the business for fulfilling their requests over a set period. These can be grouped by service.
Type:
Request Fulfillment Costs by Dept and/or Service
Benefits:
By allowing the business to identify their spend on IT services, this report provides the business with an opportunity to reduce that spend through the analysis of why services are being requested. This report also allows the business to predict future request levels leading to more accurate budgeting.
21
Cost Management - Outcomes
Ability to identify which services cost most to provide
Allow IT to demonstrate the value they are generating through the services they provide
Allow departmental managers to see exactly where they are spending their budget
Give departmental managers the opportunity to rationalize the services they need and reduce costs
22
IT Inputs
23
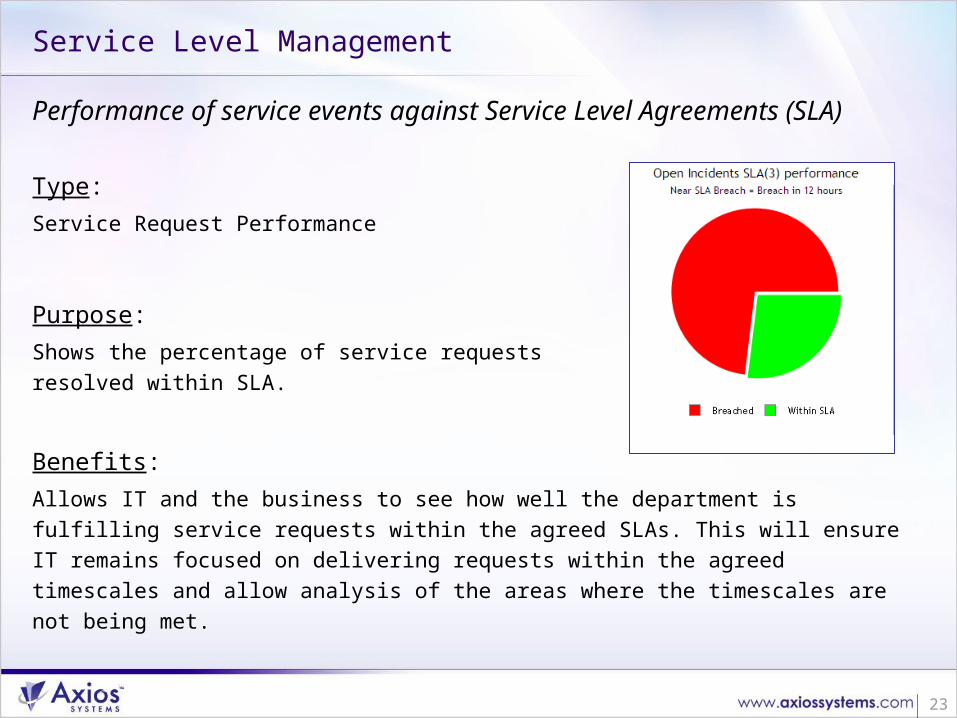
Service Level Management
Performance of service events against Service Level Agreements (SLA)
Purpose:
Shows the percentage of service requests resolved within SLA.
Type:
Service Request Performance
Benefits:
Allows IT and the business to see how well the department is fulfilling service requests within the agreed SLAs. This will ensure IT remains focused on delivering requests within the agreed timescales and allow analysis of the areas where the timescales are not being met.
24
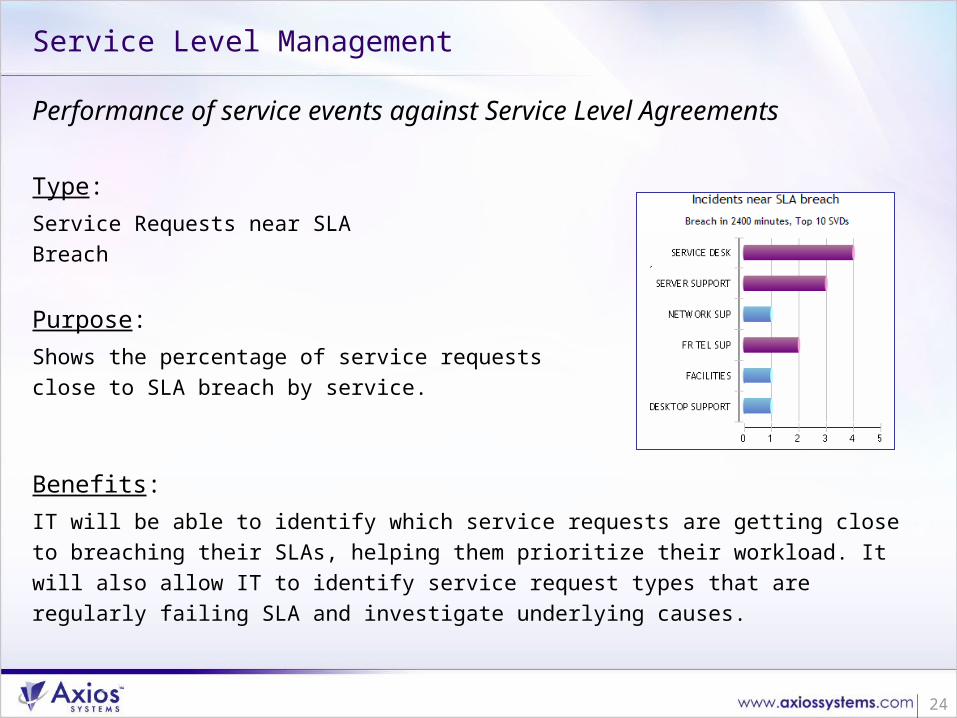
Service Level Management
Purpose:
Shows the percentage of service requests close to SLA breach by service.
Type:
Service Requests near SLA Breach
Performance of service events against Service Level Agreements
Benefits:
IT will be able to identify which service requests are getting close to breaching their SLAs, helping them prioritize their workload. It will also allow IT to identify service request types that are regularly failing SLA and investigate underlying causes.
25
SLA - Outcomes
Identify which requests breach their SLAs
Ability to identify why those requests are breaching SLAs
Provide solutions to those issues
Improve delivery of requests and increase customer satisfaction
26
27
28
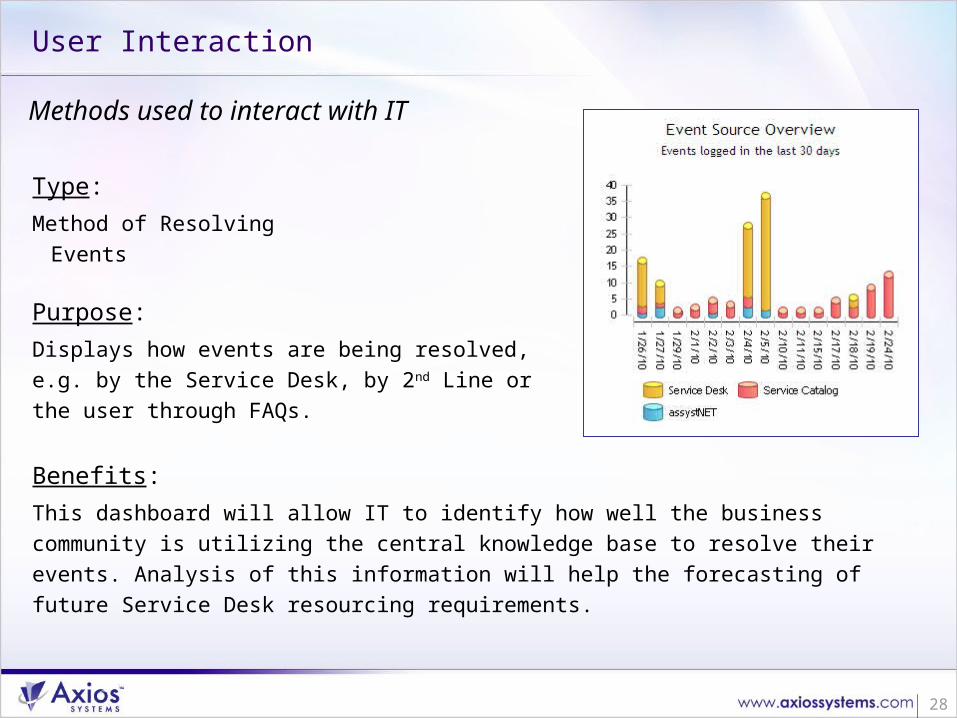
User Interaction
Methods used to interact with IT
Purpose:
Displays how events are being resolved, e.g. by the Service Desk, by 2nd Line or the user through FAQs.
Type:
Method of Resolving Events
Benefits:
This dashboard will allow IT to identify how well the business community is utilizing the central knowledge base to resolve their events. Analysis of this information will help the forecasting of future Service Desk resourcing requirements.
29
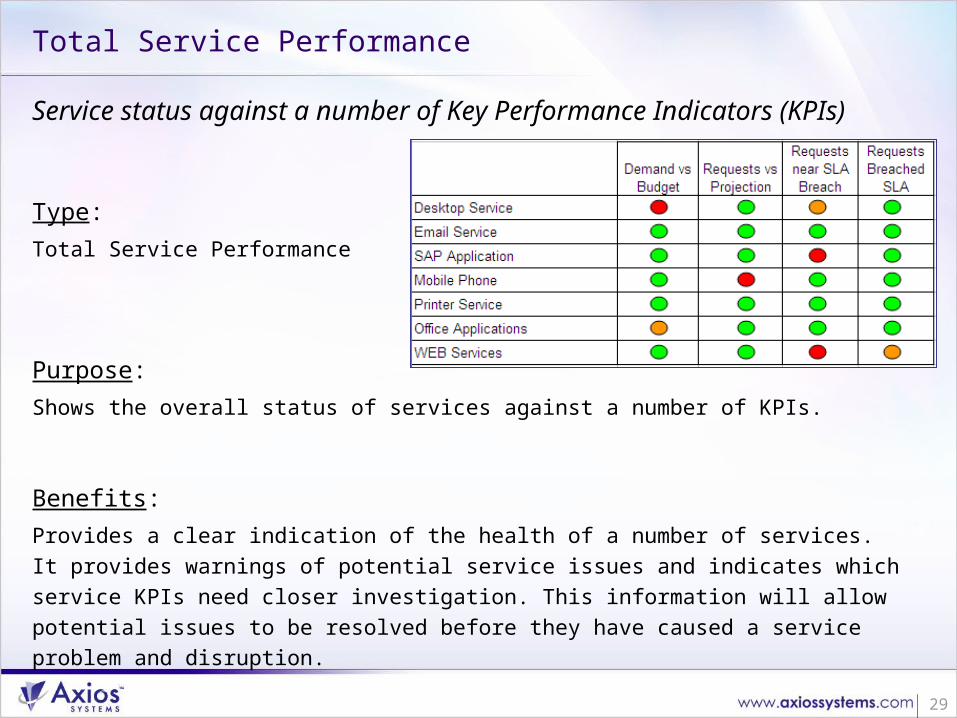
Total Service Performance
Service status against a number of Key Performance Indicators (KPIs)
Purpose:
Shows the overall status of services against a number of KPIs.
Type:
Total Service Performance
Benefits:
Provides a clear indication of the health of a number of services. It provides warnings of potential service issues and indicates which service KPIs need closer investigation. This information will allow potential issues to be resolved before they have caused a service problem and disruption.
30
31
Benefits That Metrics Can Bring
Good metrics help optimize the performance of the entire
organization
Directs focus on specific performance objectives
Makes it easier to spot trends and respond to issues
Helps align IT with the business goals
Drives efficiency, effectiveness and quality
Inspires continual improvements
Can help reduce costs
32
Top Tips for Metrics
1. Work with the business to identify meaningful metrics
2. Ensure they enable decision making
3. Keep them simple
4. Good enough is a good place to start
5. Focus on a few, good metrics

Summary
34
Top Tips for Building a Business Case
1. Define a business-based service strategy Work with customers to understand their service expectations and
priorities Define the IT business services Use workshops for common understanding
2. Define the IT service ‘supply chain’ Define and design the services and IT components required Build the Service Catalog Review the efficiency and cost of key services Identify areas for improvement
3. Find the value Build an improvement plan with business objectives and costs Business case and ROI over 2/3 years Build a practical program to implement Get people on board
35
Top Tips for Designing and Defining Services
1. Ensure involvement and buy-in from IT and business
2. Run strategy workshop
3. Define structure of services
4. Define services and service offerings
5. Use technology to help the definition, population and maintenance of the Service Catalog
6. Establish a service focus culture within IT and start thinking in service terms
36
Top Tips for Successful SLAs
1. Start with services – understand what current services are provided and what needs to be designed for improvement
2. Ask the business what they want – or what they think their services are
3. Use simple and appropriate language
4. Keep the SLA realistic and achievable
5. Only set up an SLA that can be measured
6. Keep them short and concise – otherwise no one will read them
7. Keep smiling
37
Top Tips for Metrics
1. Work with the business to identify meaningful metrics
2. Ensure they enable decision making
3. Keep them simple
4. Good enough is a good place to start
5. Focus on a few, good metrics
38
Additional Resources
Axios Systems Details:www.axiossystems.com [email protected] http://twitter.com/axios_systems http://www.servicecatalogblog.blogspot.com
Service Catalog Resources:Sharon Taylor Webcast Sharon Taylor White Paper
Webcast Series: 3 Steps to Building a Service Catalog Business Case Designing and Designing Your Services Rapid & Relevant SLAs : Integrating Service Catalog with the
Business
More information can be found on the Axios Systems website.
Information on the assyst Service Catalog can be also be found on our website.