Embed Size (px)
Citation preview
• Field trials and flowback data • Increased oil and gas production • Reduced pump pressures • Reduced energy cost
Rebound Aq
Case Study #1 Increased Oil • On June 1, 2012, rebound was introduced into a 2,200 ft. well that
produced only 0.5 bpd for a period of three years. • Based on the calculations of water in the system, five gallons of
Rebound Aq was poured into the well inlet at a 0.5% dilution which resulted in a final .04% dilution. The pump was set to percolate and the product was allowed to permeate into the surrounding near well bore formation. Upon restarting the pump, the operator showed a significant increase in oil flowback, up to 5 bpd. The operator also noticed sand from the Austin chalk formation represented in the recovered product. This was a significant observation showing Rebounds ability to clean out the veins of the formation and proppant sand from the original fracture. This increase in production lasted for three weeks. Before the use of Rebound, the wells produced 10.5 barrels of oil in a three week time frame. After treatment with Rebound, the next three weeks produced 105 barrels of oil resulting in a 900 % increase in production.
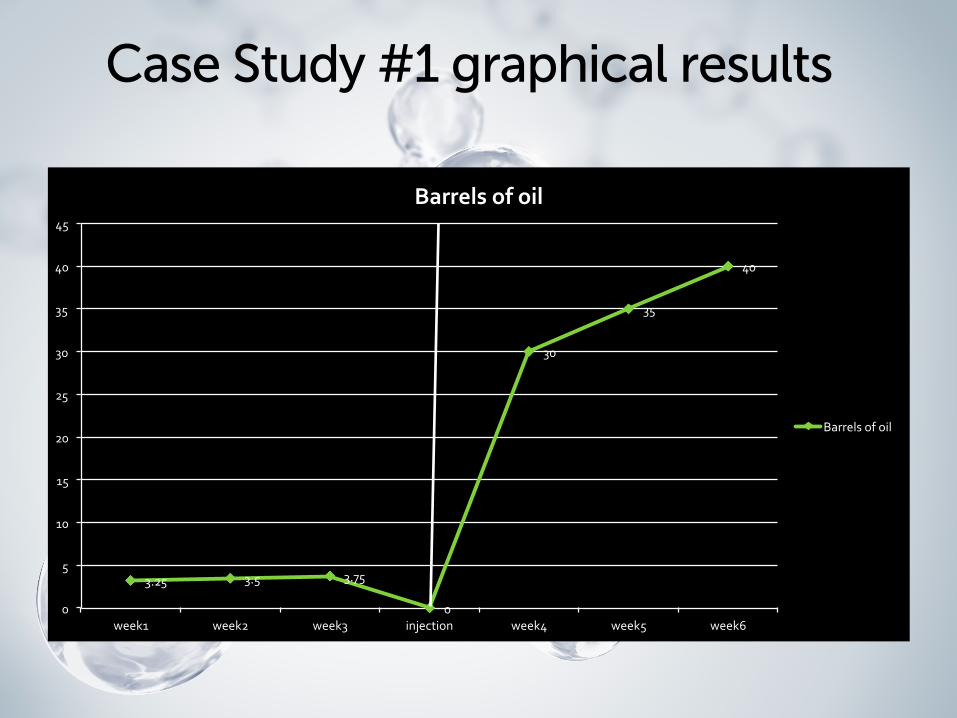
Case Study #1 graphical results
3.25 3.5 3.75
0
30
35
40
0
5
10
15
20
25
30
35
40
45
week1 week2 week3 injection week4 week5 week6
Barrels of oil
Barrels of oil
Rebound Aq injection
Case Study #2 Increased Gas and Energy Cost Savings • On February 14, 2013 Rebound Aq was introduced into a field of 6 wells that were
drilled in the 1940’s. The property owner stated previously prior to treatment, they produced a steady 3 ½ inches [which is equivalent to 1 barrel = 1 inch] or 3.5 bpd. After partial treatment of Rb into the production water tank, they saw an increase to a steady 4 bpd. After the plumbing was complete and the pressure dropped at the injection well and injection pump, he had one day of 6 barrels of production, and two days of 5 ½ barrels, then 5 barrels. After which it subsided to 4 ½ barrels and remained constant. The first of September showed an increase to 8bpd and has steadied throughout the month. That is an increase of 128%. Turning on the injection pump along with the MR pump injecting 3.48 gallons of Rb mixture a day, did indeed allow the pressures at both the injection pump and the injection well to reach a sustained maximum pressure allowance of 200 PSI for a time period of 40 minutes after building gradually. The injection well’s pressure went down to 100 PSI, and gradually decreased from there. This is a two-‐fold benefit, one being there is less mechanical strain kept on the injection pump, resulting in both longer life span of the pump and porcelain pistons but also a decreased electricity bill as the pump works more efficiently to push fluid down the line. The operator also estimates a gas production increase of 20-‐30%, although this was not documented.
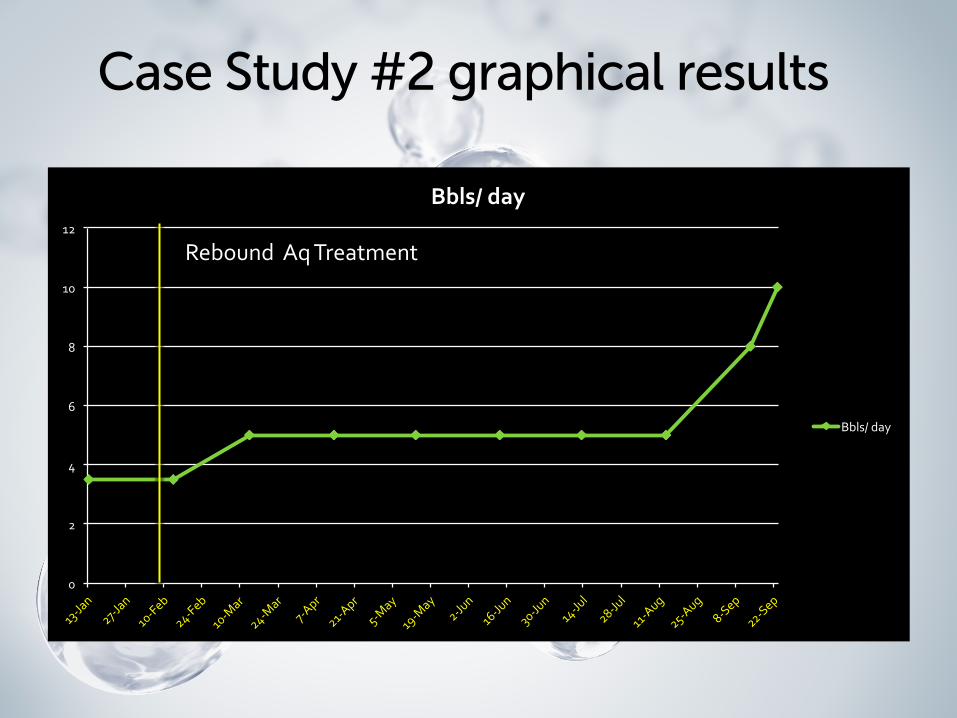
Case Study #2 graphical results
0
2
4
6
8
10
12
Bbls/ day
Bbls/ day
Rebound Aq Treatment


![TruXy: Trusted Storage Cloud for Scientific Workflowsdownload.xuebalib.com/q860f7QX1Vg.pdf · such as BioBlend [13], CloudMap [14] and Galaxy cloud [15]. However, none of these platforms](https://img.pdfslide.net/doc/110x75/6052a2f582a21f0bc0359a6a/truxy-trusted-storage-cloud-for-scientific-such-as-bioblend-13-cloudmap-14.jpg)