Embed Size (px)
Citation preview
1| Data & Org Performance|
JUNE 2012
Data and Organisational Performance
Giles Slinger
2| Data & Org Performance|
Data and Organisational Performance
Why is this important?
• Usable data is vital to organisational strategy and initiatives
• Most org initiatives have to start off with messy data, so methods and tactics for
handling messy data are crucial
• Here are two examples of organisations making the most of their data
– Case study 1: Organisational analytics – Hospital Trust 1
– Case study 2: Objectives Management to improve performance – Hospital Trust 2
3| Data & Org Performance|
Why clean data is important
4| Data & Org Performance|
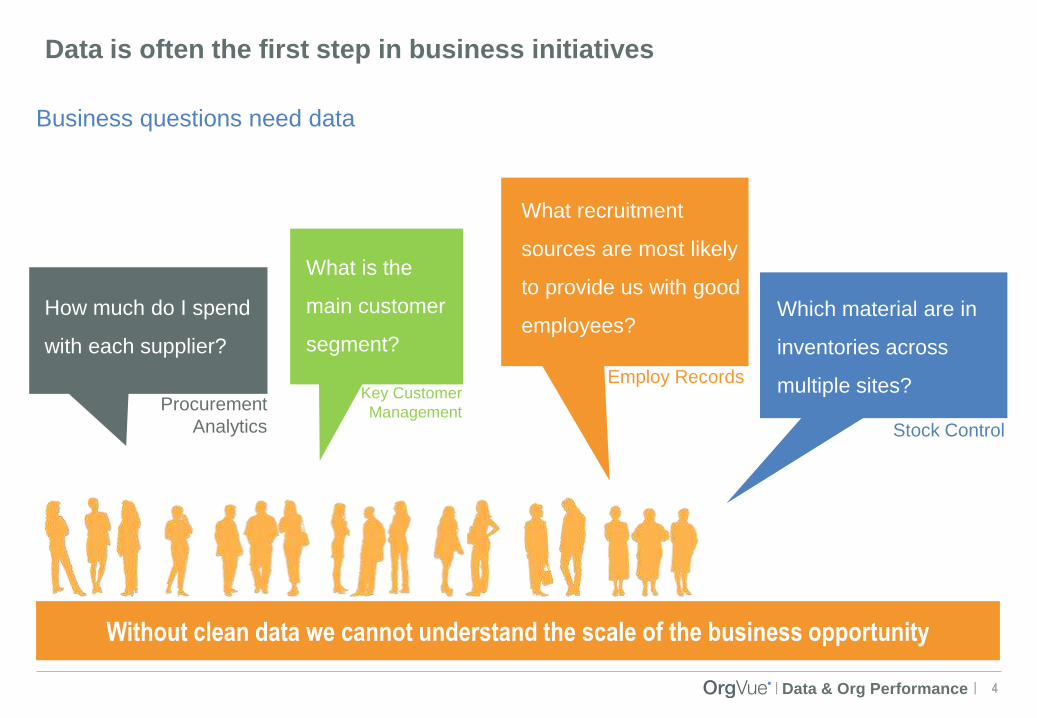
Data is often the first step in business initiatives
Business questions need data
What recruitment
sources are most likely
to provide us with good
employees?
Without clean data we cannot understand the scale of the business opportunity
Procurement
Analytics
Key Customer
Management
Employ Records
Stock Control
What is the
main customer
segment?
Which material are in
inventories across
multiple sites?
How much do I spend
with each supplier?

5| Data & Org Performance|
Despite this, messy data is everywhere
The situation among companies right now:
• The average large organization has 8 different databases. The spread of data across disparate
systems generates multiple versions of truth1)
• >90% of companies have chronic problems with their data, e.g. missing, outdated, inaccurate,
typos…1)
In 2/3 of organisations, the majority of time is wasted on consolidating, repairing and
manipulating data instead of analysing them2)
Source: 1) Experian, White paper: the state of data quality, 2013
2) Ventana, CIOs need to make information management a real priority, 2012
6| Data & Org Performance|
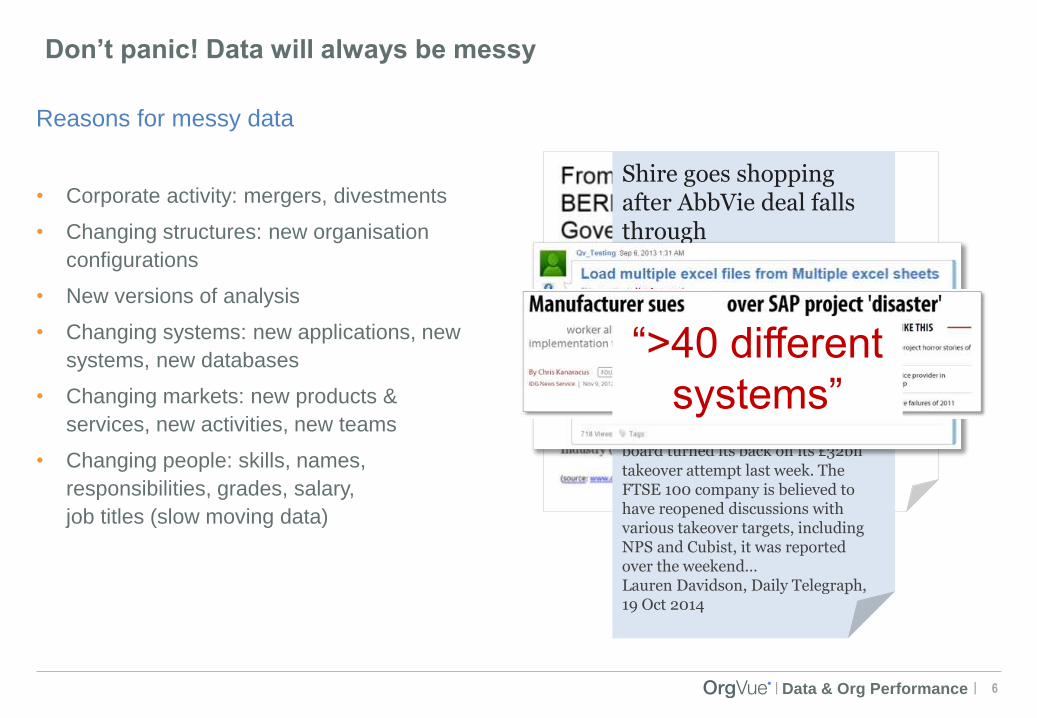
Don’t panic! Data will always be messy
• Corporate activity: mergers, divestments
• Changing structures: new organisation
configurations
• New versions of analysis
• Changing systems: new applications, new
systems, new databases
• Changing markets: new products &
services, new activities, new teams
• Changing people: skills, names,
responsibilities, grades, salary,
job titles (slow moving data)
Reasons for messy data
Shire goes shopping after AbbVie deal falls through
Shire is reportedly back on the acquisition trail, after AbbVie'sboard turned its back on its £32bn
takeover attempt last week. The FTSE 100 company is believed to have reopened discussions with various takeover targets, including NPS and Cubist, it was reported over the weekend…Lauren Davidson, Daily Telegraph, 19 Oct 2014
“>40 different
systems”

7| Data & Org Performance|
What’s the solution?
7 Steps to using data.
7 steps to use data
You will need to:
1. Merge data from multiple sources
2. Clean data live
3. Use tips & tricks to close gaps
4. Visualise data easily and beautifully
5. Intervene early and Agile
6. Understand the organisation as a
system
7. Sustain impact by tracking
achievements
• As-Is data analysis
• To-be org design
These three
steps form a
continuous
cycle.
8| Data & Org Performance|
Case study 1: Using analytics to locate and improve poor data
9| Data & Org Performance|
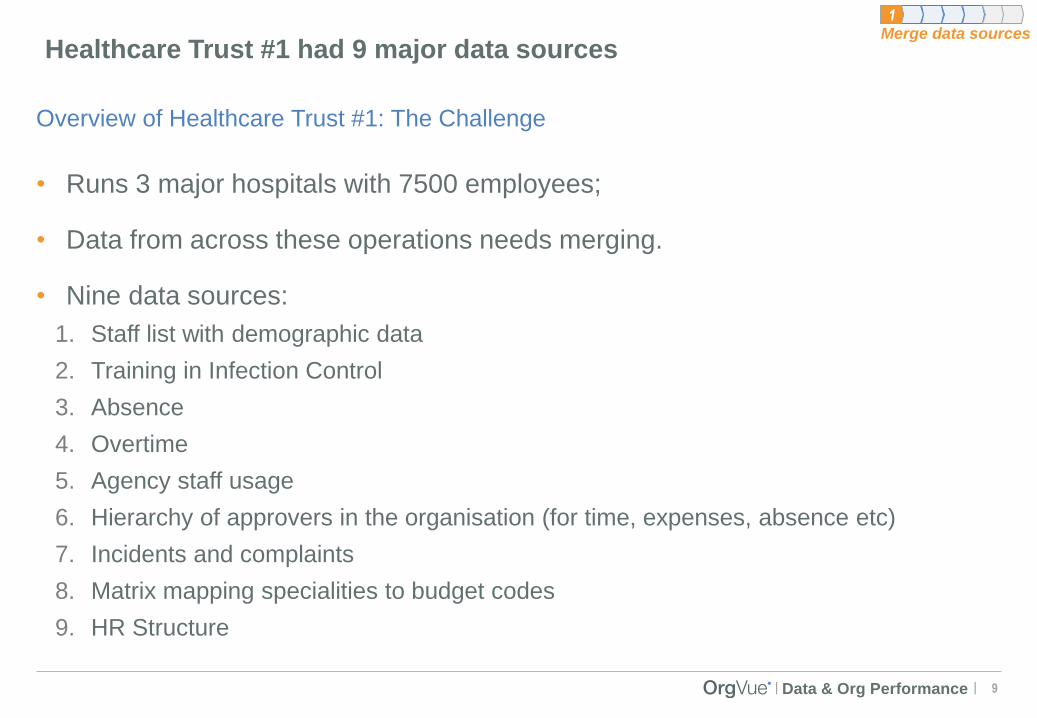
Healthcare Trust #1 had 9 major data sources
Overview of Healthcare Trust #1: The Challenge
• Runs 3 major hospitals with 7500 employees;
• Data from across these operations needs merging.
• Nine data sources:
1. Staff list with demographic data
2. Training in Infection Control
3. Absence
4. Overtime
5. Agency staff usage
6. Hierarchy of approvers in the organisation (for time, expenses, absence etc)
7. Incidents and complaints
8. Matrix mapping specialities to budget codes
9. HR Structure
1Merge data sources
10| Data & Org Performance|
The solution
11| Data & Org Performance|
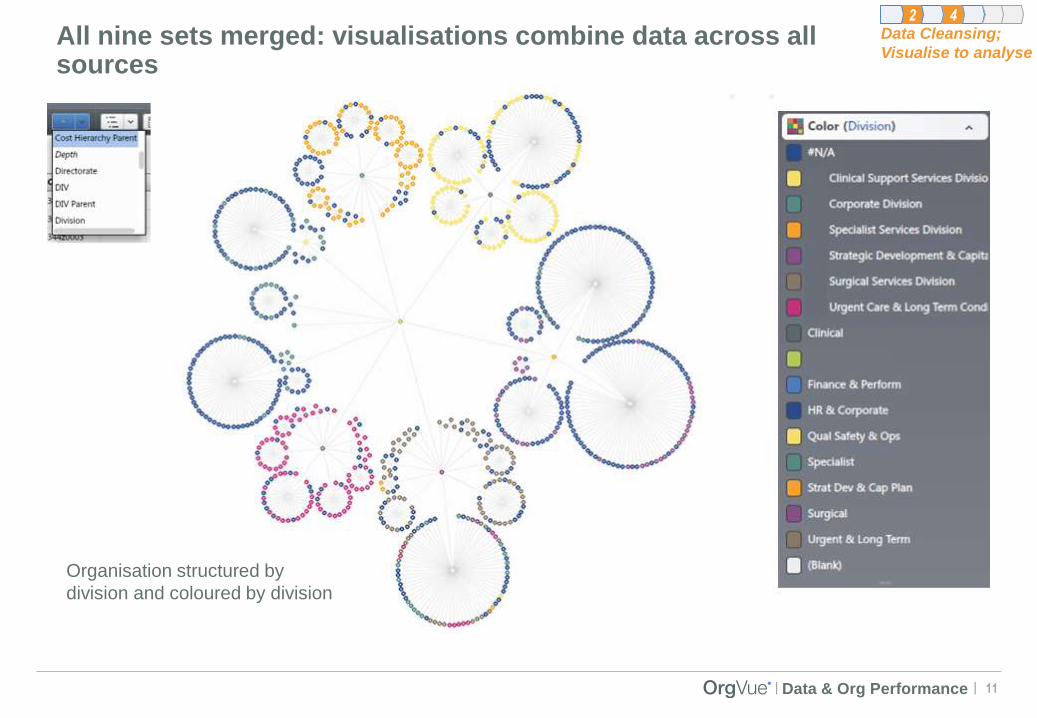
All nine sets merged: visualisations combine data across all sources
Data Cleansing;
Visualise to analyse
2
Organisation structured by
division and coloured by division
4

12| Data & Org Performance|
The Trust had 3 major hospitals with 19 other sites listed – possibly signalling a need for data cleansing
Visualisation of headcount by Location
SOME DATA CHALLENGES:
POSSIBLE CLEANSING REQUIRED ON
SITE LIST
4Clean data live
2
13| Data & Org Performance|
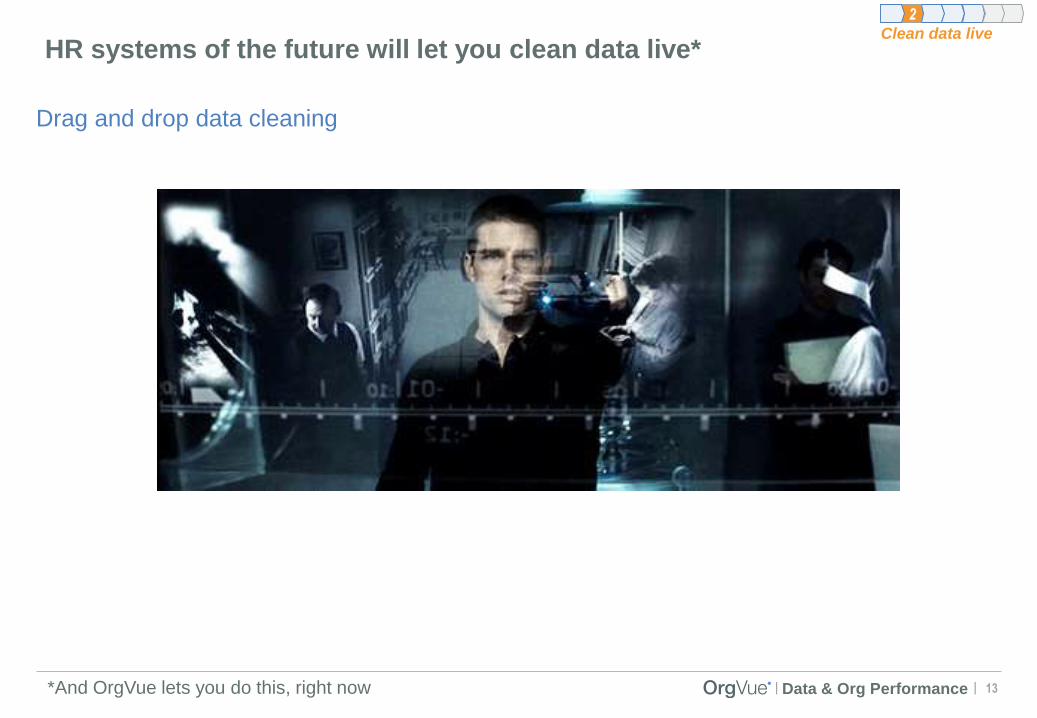
HR systems of the future will let you clean data live*
Drag and drop data cleaning
Clean data live
2
*And OrgVue lets you do this, right now
14| Data & Org Performance|
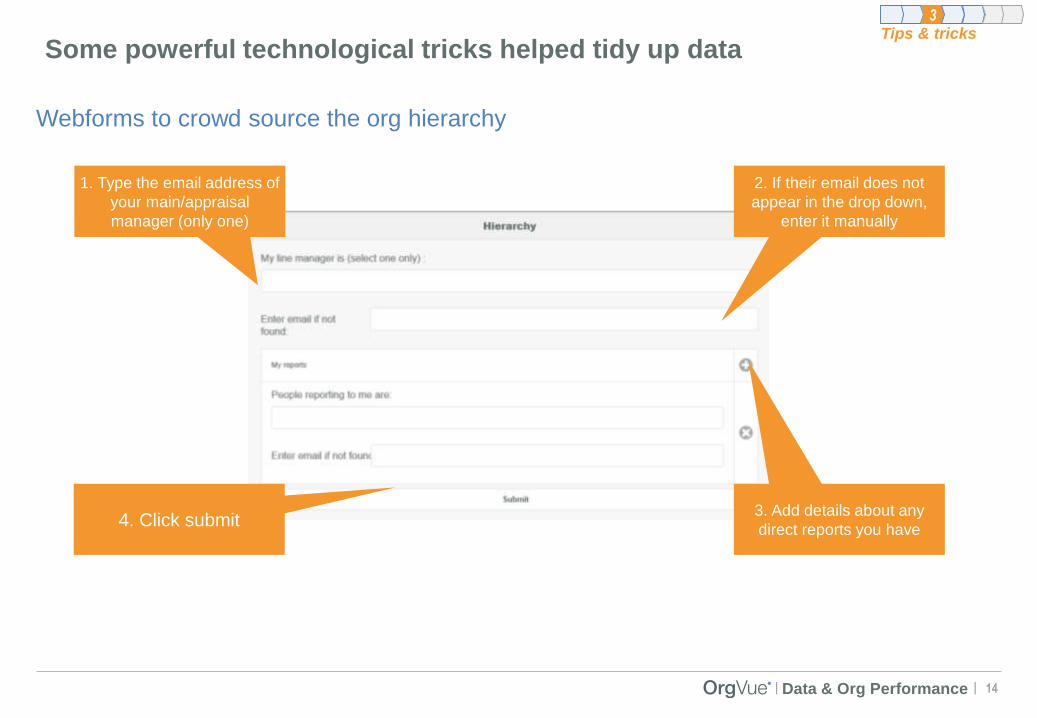
Some powerful technological tricks helped tidy up data
Webforms to crowd source the org hierarchy
1. Type the email address of
your main/appraisal
manager (only one)
3. Add details about any
direct reports you have
2. If their email does not
appear in the drop down,
enter it manually
4. Click submit
3Tips & tricks
15| Data & Org Performance|
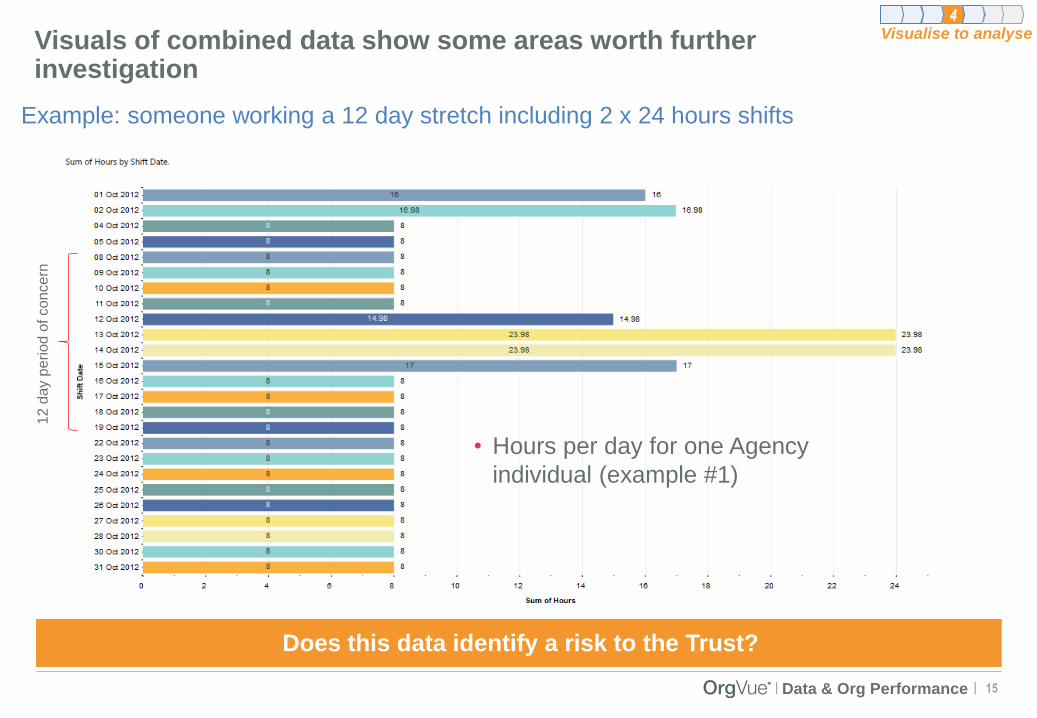
Visuals of combined data show some areas worth further investigation
Example: someone working a 12 day stretch including 2 x 24 hours shifts
Does this data identify a risk to the Trust?
12 d
ay p
erio
d o
f co
nce
rn
2Visualise to analyse
• Hours per day for one Agency
individual (example #1)
4
16| Data & Org Performance|
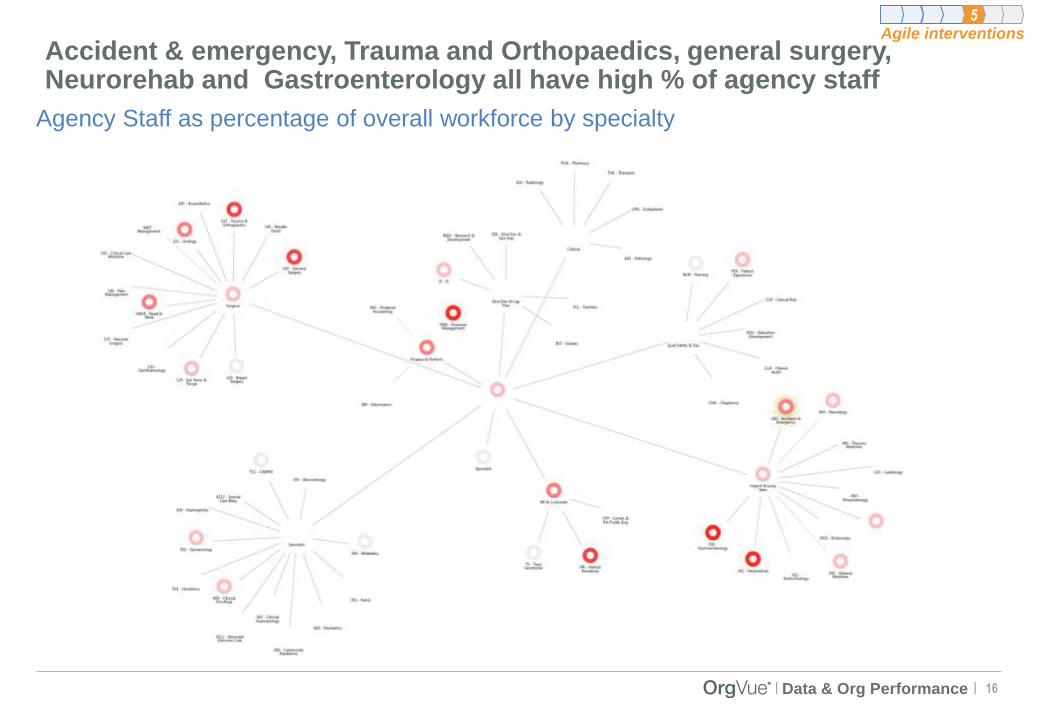
Accident & emergency, Trauma and Orthopaedics, general surgery, Neurorehab and Gastroenterology all have high % of agency staff
Agency Staff as percentage of overall workforce by specialty
5Agile interventions
17| Data & Org Performance|
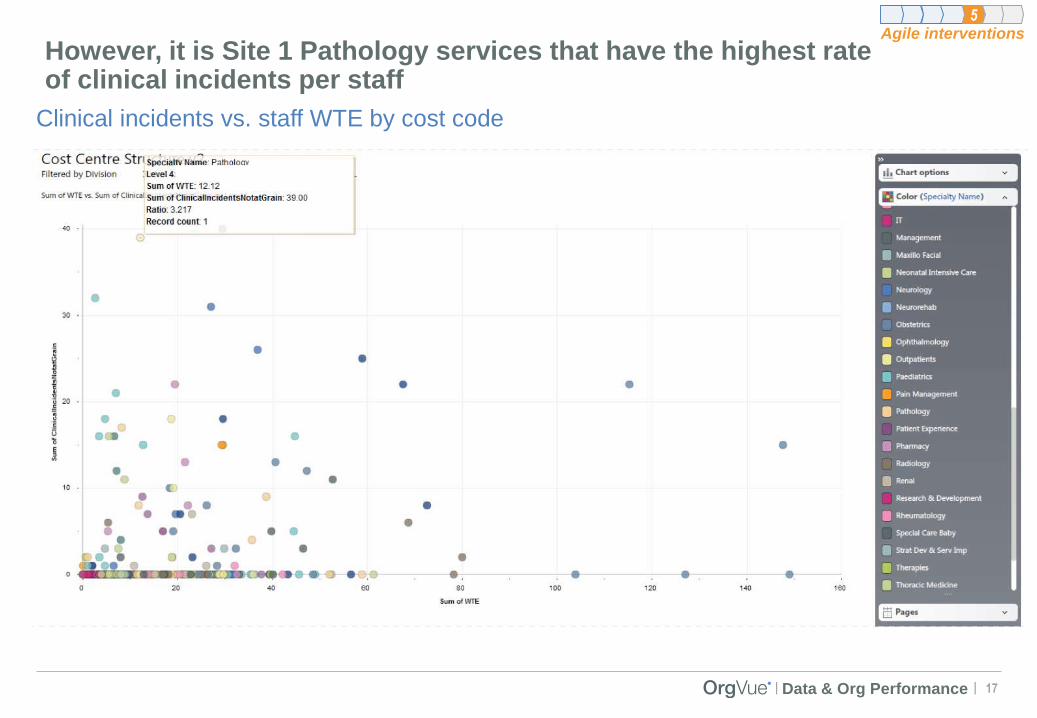
However, it is Site 1 Pathology services that have the highest rate of clinical incidents per staff
Clinical incidents vs. staff WTE by cost code
5Agile interventions
18| Data & Org Performance|
Case study 2: Making the most of your data

19| Data & Org Performance|
Case Study #2: An excellent hospital in the heart of the community
Hospital Overview
• Dual strength - serving a population of
>300,000 for general hospital services
and >1 million for cancer services
• 500 beds across 20 wards
• >50,000 inpatients
• >200,000 outpatients
• >3,000 employees (WTE)
• Annual income approx. £300m
• Annual surplus approx. £3m

20| Data & Org Performance|
But Objectives Setting remained a problem
• One ‘mega-spreadsheet’ of objectives
• Employees overloaded with objectives
• No visibility of objectives through the organisation
• Little alignment of staff with high level goals
• Existing performance review was entirely paper based
• HR system contained no reporting line information
CEO: “This is my number #1 priority for 2014-15”

21| Data & Org Performance|
The solution

22| Data & Org Performance|
Are there any
objectives that have
no owner?
Are we measuring all
of the required
properties for
successful objective
tracking?
Do some people
have too many
objectives?
Build an approximate objectives tree, then carry out basic sanity checksbefore finalisation
Taking a step back
Are there key aspects
of strategy not
represented by set
objectives?
After these checks have been made objectives can go ‘live’ and tracking can begin
Ownership
DistributionStrategy
Tracking
23| Data & Org Performance|
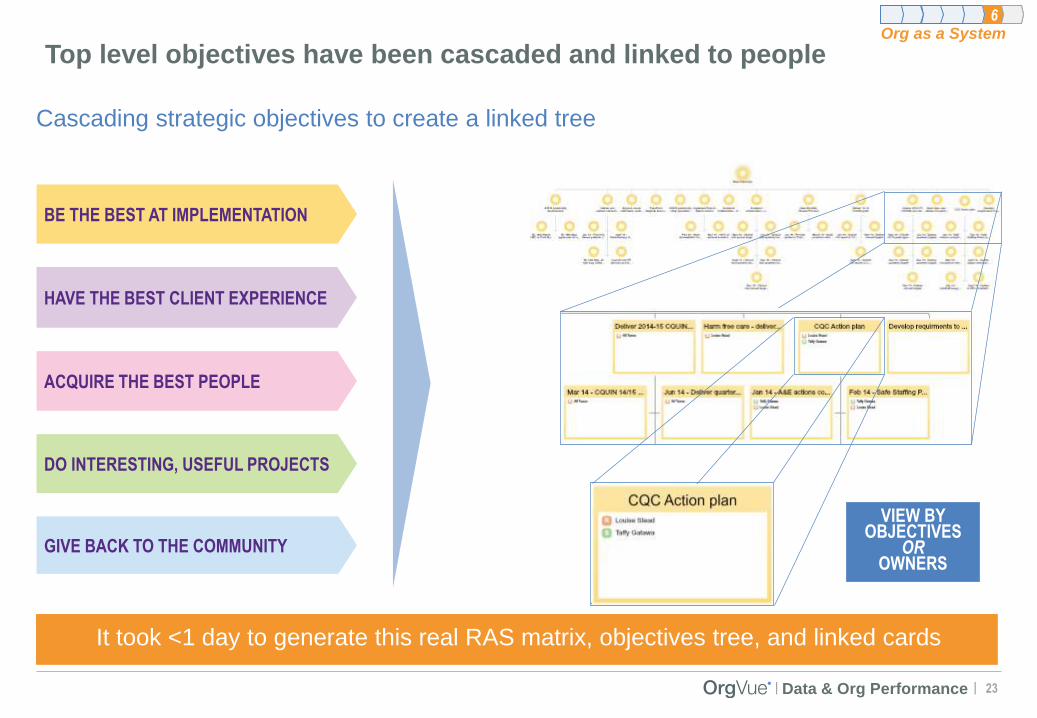
Top level objectives have been cascaded and linked to people
Cascading strategic objectives to create a linked tree
It took <1 day to generate this real RAS matrix, objectives tree, and linked cards
BE THE BEST AT IMPLEMENTATION
HAVE THE BEST CLIENT EXPERIENCE
ACQUIRE THE BEST PEOPLE
DO INTERESTING, USEFUL PROJECTS
GIVE BACK TO THE COMMUNITY
VIEW BY OBJECTIVES
OROWNERS
Org as a System76

24| Data & Org Performance|
Online webforms make it easy to generate, update and agree objectives
Objective input form mock-up
SPECIFIC
TIME-BOUND
RELEVANT
ACHIEVABLE
MEASURABLE
Org as a System76
25| Data & Org Performance|
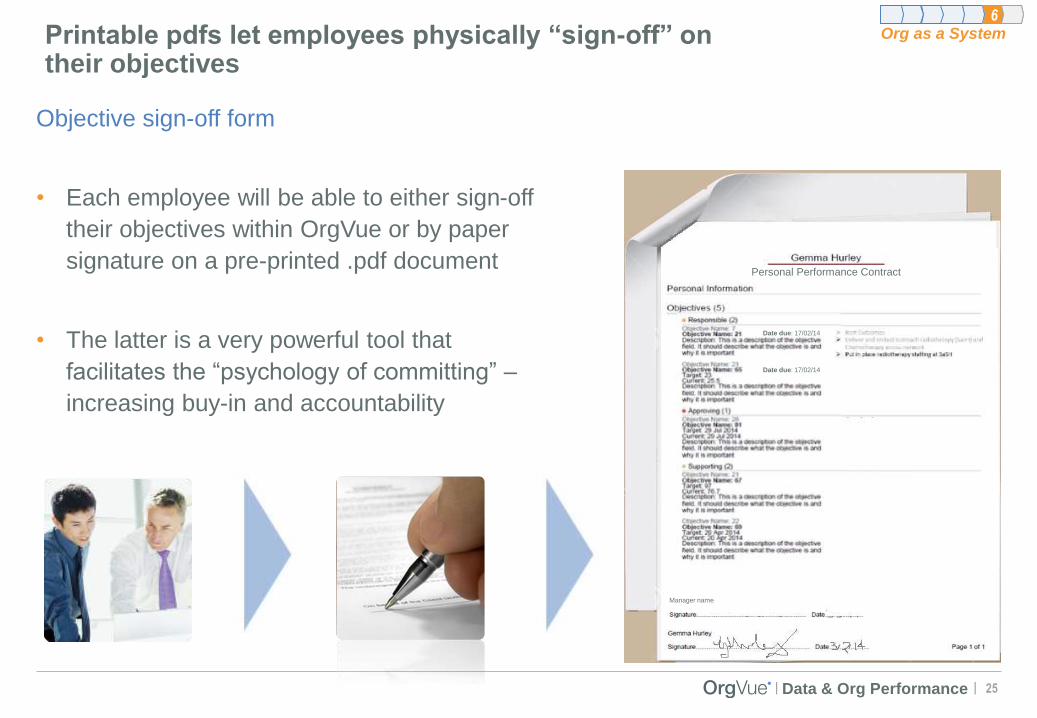
Printable pdfs let employees physically “sign-off” on their objectives
Objective sign-off form
• Each employee will be able to either sign-off
their objectives within OrgVue or by paper
signature on a pre-printed .pdf document
• The latter is a very powerful tool that
facilitates the “psychology of committing” –
increasing buy-in and accountability
Personal Performance Contract
Manager name
Date due: 17/02/14
Date due: 17/02/14
Org as a System76
26| Data & Org Performance|
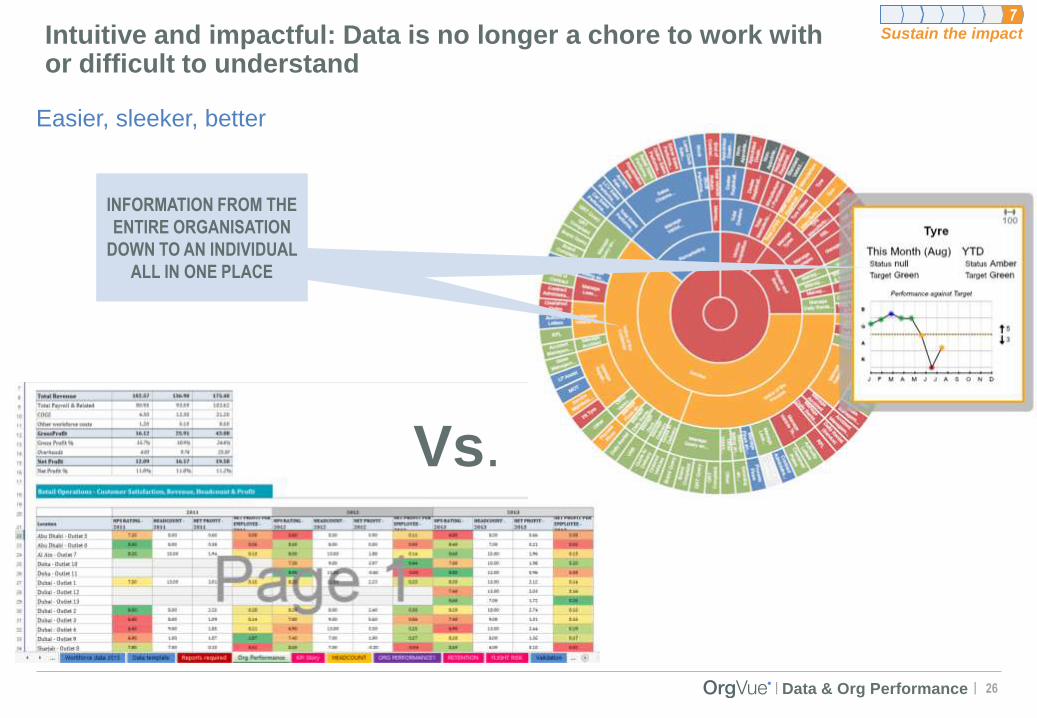
Intuitive and impactful: Data is no longer a chore to work with or difficult to understand
Easier, sleeker, better
Vs.
HOW IS THE TYRE
OBJECTIVE GOING?
INFORMATION FROM THE
ENTIRE ORGANISATION
DOWN TO AN INDIVIDUAL
ALL IN ONE PLACE
Sustain the impact6 7
27| Data & Org Performance|
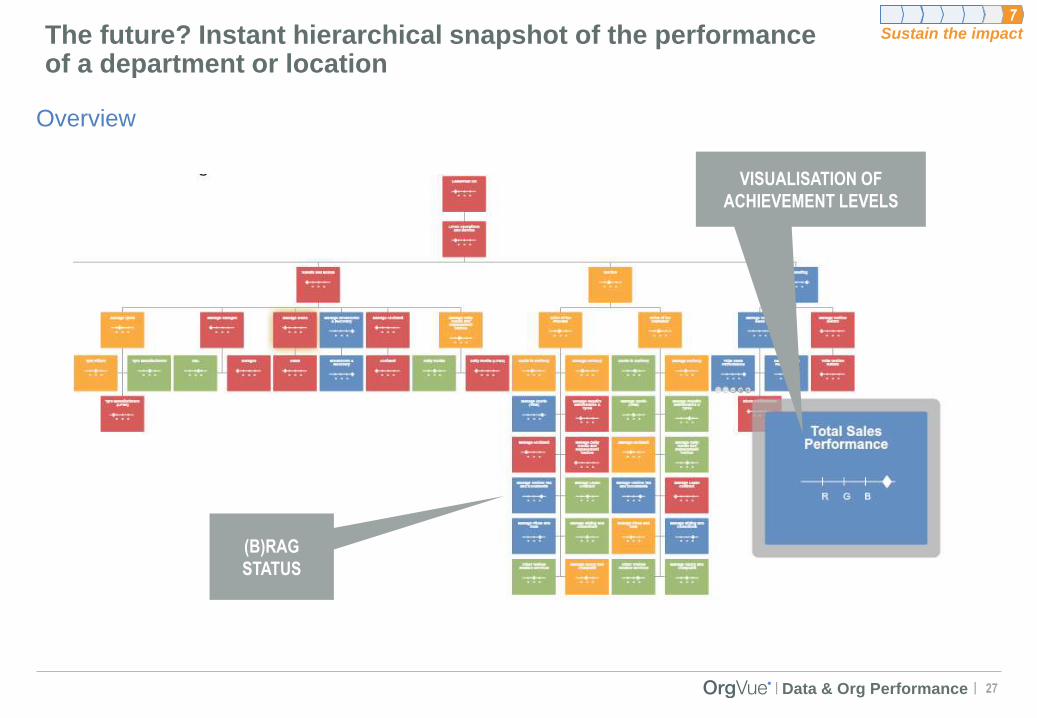
The future? Instant hierarchical snapshot of the performance of a department or location
Overview
VISUALISATION OF
ACHIEVEMENT LEVELS
(B)RAG
STATUS
Sustain the impact6 7
28| Data & Org Performance|
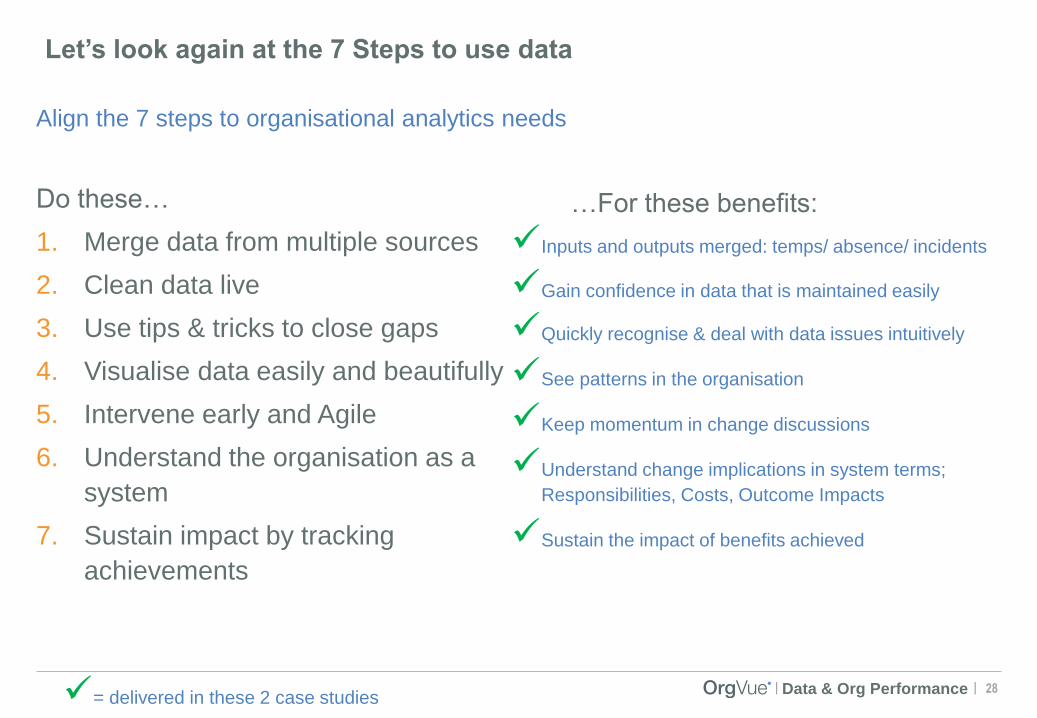
Let’s look again at the 7 Steps to use data
Align the 7 steps to organisational analytics needs
Do these…
1. Merge data from multiple sources
2. Clean data live
3. Use tips & tricks to close gaps
4. Visualise data easily and beautifully
5. Intervene early and Agile
6. Understand the organisation as a
system
7. Sustain impact by tracking
achievements
Inputs and outputs merged: temps/ absence/ incidents
Gain confidence in data that is maintained easily
Quickly recognise & deal with data issues intuitively
See patterns in the organisation
Keep momentum in change discussions
Understand change implications in system terms;
Responsibilities, Costs, Outcome Impacts
Sustain the impact of benefits achieved
…For these benefits:
= delivered in these 2 case studies

29| Data & Org Performance|
9
8
9
6
8
Systems will need to “enable users to visually explore
their data…"
Systems should “use visualisations to reveal outliers that
correspond to errors in the dataset”
Systems should enable “jumping among the tasks of
exploring, finding, integrating and cleaning data in a
consistent, integrated fashion"
Systems should “facilitate the integration and study of
multiple datasets at the same time"
Systems should “support collaboration through sharing
visualisations and data online for both viewing and
editing"
Looking to the future, a 2014 Tableau report on next generation data analytics systems suggests new capabilities will be needed
Key capabilities of next generation systems
Visual data interaction1
Source: Morton, Balazinska, Grossman and McKinlay, Support the data enthusiast: challenges for next generation
data analysis systems, 2014
Data cleaning
Seamless experience
Integration of multiple
datasets
Collaboration by
sharing visualisations
Capabilities Quotes Reasons
Interactive data quality dashboards
and intuitive drag-and-drop make
data cleaning quick and playful
Importance
Rating
Changes in data should reflect
instantly in visualisations and vice
versa
Innovative visualisations let users
explore data from multiple angles
Multiple contributors can work in
collaboration under clear data
control system
Data must be merged from multiple
datasets and multiple sources
2
3
4
5
30| Data & Org Performance|
Integrate and clean your data to manage your organisation
For more information contact us at: [email protected]