Embed Size (px)
Citation preview
DAILY REPORT 08
th MARCH 2016
YOUR MINTVISORY Call us at +91-731-6642300
Global markets at a glance
European shares fell on Monday, led lower by a slump in utility EDF after a senior executive quit, and by weaker bank stocks which were hit by some broker price target cuts. European stocks have rallied after a rocky start to 2016, as oil prices recovered and fears over a U.S. eco-nomic slowdown abated. Nevertheless, the pan-European FTSEurofirst 300 index remains down around 7% so far in 2016. JP Morgan Cazenove reduced its rating on equities to "underweight" for the first time since 2007, saying the re-cent market rebound was set to peter out. The FTSEuro-first, which reached one-month highs on Friday after three straight weeks of gains, closed 0.3% lower. The euro zone's blue-chip Euro STOXX 50 index fell 0.5%.
The Dow Jones industrial average and the S&P 500 index closed higher on Monday as a spike in energy shares offset sharp declines in large-cap technology names, which dragged down the Nasdaq. Crude prices, which have largely dictated the direction of the stock market this year, were up more than 5 percent. The S&P 500 energy sector .SPNY, up 2.4 percent, rose for the fifth consecutive session, a streak not seen since October. It is up more than 23 per-cent from its 2016 low in mid-January.
Japan's economy contracted less than initially estimated in the final quarter of 2015 but private consumption re-mained weak, underscoring the challenges facing premier Shinzo Abe in restoring growth amid intensifying overseas headwinds.
Previous day Roundup
Indian stock markets edged higher on Friday, posting their best weekly gain in more than four years, tracking gains in Asian markets and on improved risk appetite after the gov-ernment unveiled a fiscally prudent budget earlier this week. The Sensex was up 39.49 points at 24646.48, and the Nifty was up 9.75 points at 7485.35. About 1516 shares have advanced, 1087 shares declined, and 145 shares are unchanged. Bank Nifty posts biggest weekly gains in 10 years.
Index stats
The Market was very volatile in last session. The sartorial indices performed as follow; Consumer Durables [down 14.13pts], Capital Goods [up 11.15Pts], PSU [up 113.93pts], FMCG [up 7.96Pts], Realty [up 11.56pts], Power [up 19.90pts], Auto [up 35.09Pts], Healthcare [up 49.30Pts], IT [down 51.28pts], Metals [up 156.88Pts], TECK [down 24.11pts], Oil& Gas [up 34.26pts].
World Indices
Index Value % Change
D J l 17073.95 +67.18
S&P 500 2001.76 +1.77
NASDAQ 4708.25 -0.19
FTSE 100 6182.40 -17.03
Nikkei 225 16635.26 -276.06
Hong Kong 19954.69 -1.02
Top Gainers
Company CMP Change % Chg
PNB 83.35 4.35 5.51
BHEL 107.70 4.40 4.26
VEDL 87.15 3.20 3.81
SBIN 189.10 6.35 3.47
COALINDIA 325.00 10.90 3.47
Top Losers
Company CMP Change % Chg
HCLTECH 835.10 24.20 -2.82
TECHM 450.00 11.75 -2.54
IDEA 105.75 2.60 -2.40
ASIANPAINT 867.00 13.25 -1.51
SUNPHARMA 857.90 13.00 -1.49
Stocks at 52 Week’s HIGH
Symbol Prev. Close Change %Chg
JSWSTEEL 1,194.00 34.20 2.95
KELLTONTEC 215.40 19.55 9.98
MINDAIND 977.00 134.30 15.94
MINDTREE 1,595.95 20.55 1.30
- -
Indian Indices
Company CMP Change % Chg
NIFTY 7485.35 +9.75 +0.13
SENSEX 24646.48 +39.49 +0.16
Stocks at 52 Week’s LOW
Symbol Prev. Close Change %Chg
MONSANTO 1,590.10 -39.00 -2.39
RAIREKMOH 112.00 -4.85 -4.15
SHOPERSTOP 334.30 -7.50 -2.19
VIDHIDYE 57.00 -0.95 -1.64
ZODIACLOTH 222.00 -10.55 -4.54
DAILY REPORT 08
th MARCH 2016
YOUR MINTVISORY Call us at +91-731-6642300
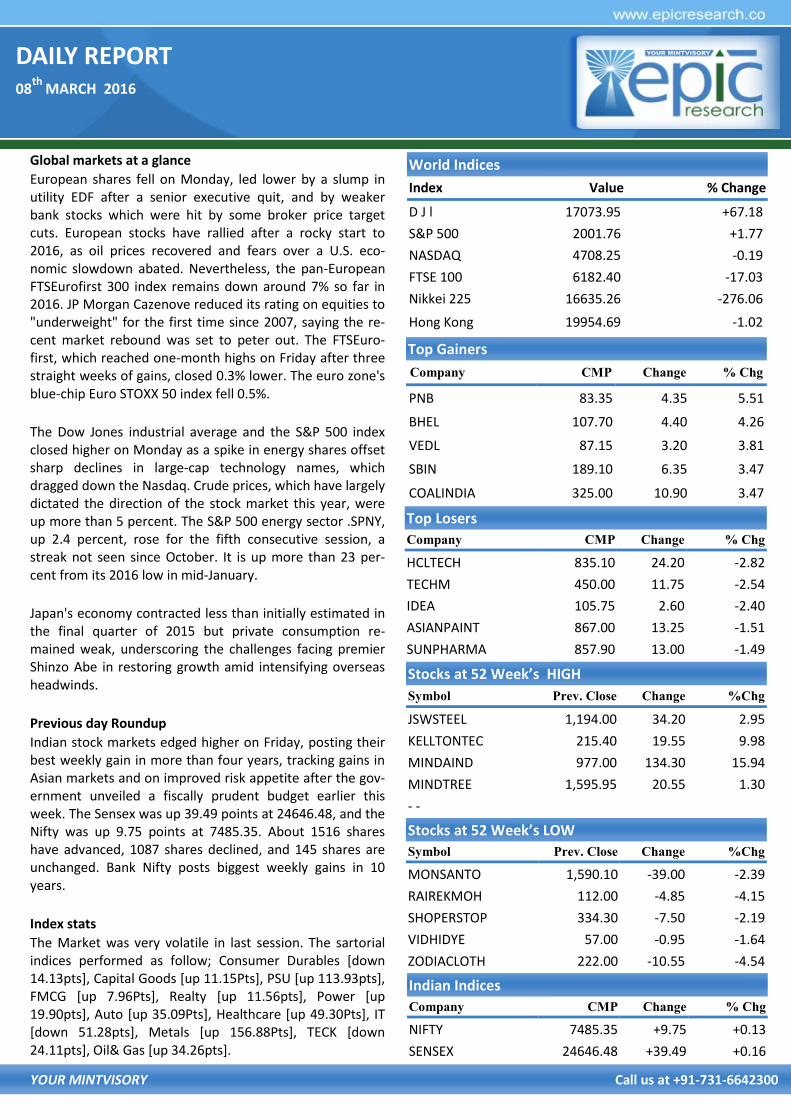
STOCK RECOMMENDATION [CASH] 3. SINTEX
In SINTEX we have seen that it has crossed a good resis-tance level of 72 but closed below but strength is seen in the volume in the stock so breakout is expected in the stock above this level in next trading session, so it is sug-gested to buy stock around 72.50-72.60 with a strict stop loss of 71.50 for the targets up to 73.60-75. MACRO NEWS
Alkem's Mandva plant gets establishment nod from US-FDA
CBDT forms directorates to monitor taxpayer service
Nalco to invest Rs 900 crore in Kakrapar Atomic Power plant
FDI in food processing to act as catalyst: Minister
Siemens Board approves sale of healthcare undertaking for Rs 3,050 crore
Economic affairs secretary says -Looking at Rs 50,000 crore in total for bank recapitalization
Environment Ministry releases new categorisation of industries
Finance Ministry says jewellers with turnover of over Rs 12cr to pay 1% excise on non-silver jewellery
Nalco to invest Rs 900cr in Kakrapar Atomic power plant
Ajanta Pharma receives US FDA nod for Almotriptan Malate tablets
Chambal Fertilisers signs Rs 500 crore term loan, Rs 300 crore bank guarantee agreement with SBI
Direct benefit transfer for fertilisers a welcome step: RCF
CIL mines have not halted production; demand weak: Swarup
Pharma crusader Thakur takes India's drug regulators to court
STOCK RECOMMENDATIONS [FUTURE] 1. HEXAWARE [FUTURE]
if we see the daily chart of HEXAWARE Future we can cleanly see that from last 4 days it is showing strength and also closed above resistance trend line, now trend line breakout is expected from stock, we suggest to buy it above the level 261 with a strict stop loss of 258 for the targets up to 264-266 on intraday basis. 2. GLENMARK [FUTURE]
GLENMARLK has broken a very good resistance level of 807 in the daily chart but there are possibilities that we may see some weakness from here as a result of profit booking, so it is suggested to buy it around the levels 804-805 with a strict stop loss of 795 for the targets up to 812-815 on intraday basis.
DAILY REPORT 08
th MARCH 2016
YOUR MINTVISORY Call us at +91-731-6642300
FUTURE & OPTION
MOST ACTIVE CALL OPTION
Symbol Op-
tion
Type
Strike
Price
LTP Traded
Volume
(Contracts)
Open
Interest
NIFTY CE 8,000 39.80 2,33,012 55,62,675
NIFTY CE 8,100 21.75 1,46,587 48,57,300
BANKNIFTY CE 17,000 151.35 42,269 4,86,780
TATASTEEL CE 280 7.40 4,327 14,86,000
IFCI CE 30 1.10 3,545 1,07,20,000
SBIN CE 230 2.65 3,161 54,84,000
LT CE 1,300 18.25 2,289 6,16,200
RELINFRA CE 620 25.00 2,289 5,82,400
MOST ACTIVE PUT OPTION
Symbol Op-
tion
Type
Strike
Price
LTP Traded
Volume
(Contracts)
Open
Interest
NIFTY PE 7,700 87.50 1,61,166 44,92,800
NIFTY PE 7,800 125.85 1,52,661 42,26,850
BANKNIFTY PE 16,000 144.85 42,029 4,38,780
TATASTEEL PE 250 3.00 2,528 18,50,000
TATASTEEL PE 260 5.25 2,117 13,82,000
SBIN PE 220 7.50 1,885 17,92,000
SBIN PE 210 3.55 1,545 17,80,000
RELINFRA PE 600 22.50 1,402 5,53,800
FII DERIVATIVES STATISTICS
BUY OPEN INTEREST AT THE END OF THE DAY SELL
No. of
Contracts Amount in
Crores No. of
Contracts Amount in
Crores No. of
Contracts Amount in
Crores NET AMOUNT
INDEX FUTURES 34231 1818.40 32193 1670.98 277359 15048.14 147.42
INDEX OPTIONS 546312 29387.59 550980 29633.61 1268446 70402.85 -246.02
STOCK FUTURES 97883 4340.39 89914 4040.20 1075198 48210.67 300.19
STOCK OPTIONS 55229 2396.16 55559 2393.99 58622 2613.38 2.17
TOTAL
STOCKS IN NEWS
Tech Mahindra Bombay HC approves amalgamation of TechM BPO and New vC Services
L&T completes sale of Coimbatore casting manufactur-ing unit to Bradken
Ashok Leyland to invest USD 10mn to expand UAE manufacturing plant capacity
Jindal Photo Bombay High Court approves scheme of arrangement between Jindal Poly Films & Company
Sadbhav Engineering unit Rohtak Panipat tollway re-sumes toll operations
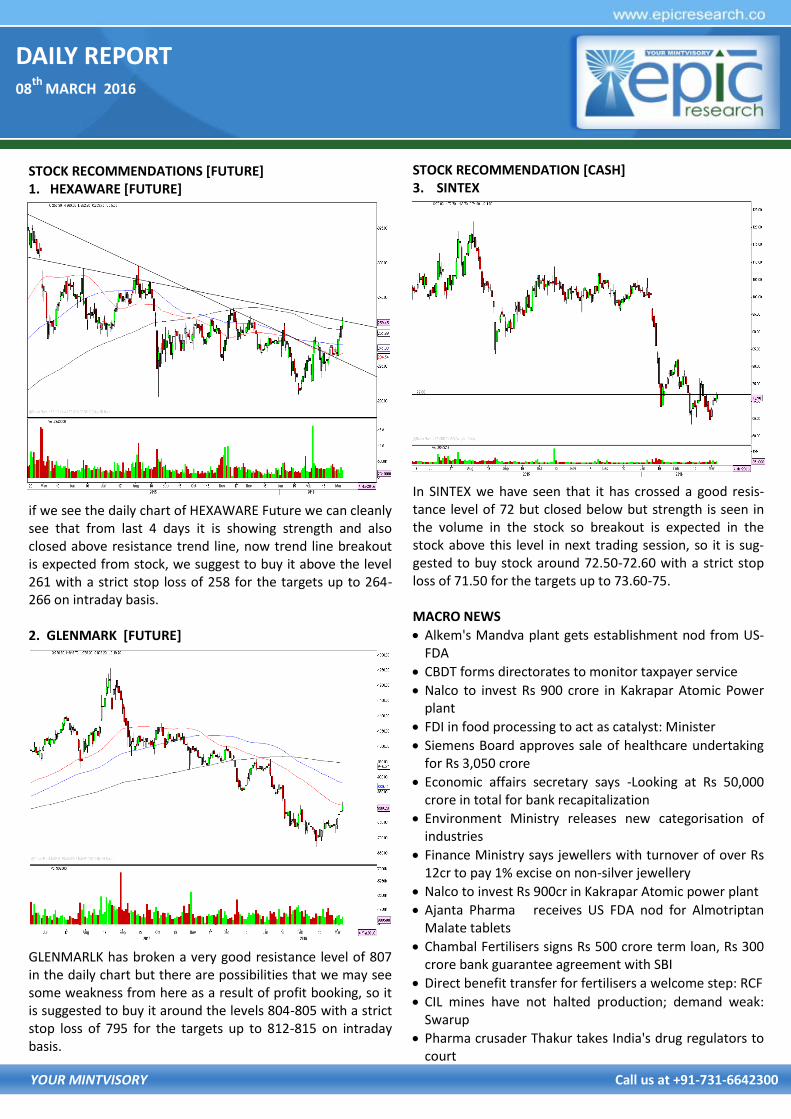
NIFTY FUTURE
Nifty remained steady to bullish along the day. Nifty has closed with a positive candlestick again but it has a strong resistance around 7500 and then around 7630 and like previous two sessions Nifty seem to open with gap up so it may come down from these resistance to fill gaps. So we advise you to sell it on rise around 7530 for the targets of 7430 and 7300 with strict SL of 7650.
INDICES R2 R1 PIVOT S1 S2
BANK NIFTY 15,712.00 15,525.00 15,265.00 15,078.00 14,818.00
NIFTY 7,540.00 7,512.00 7,478.00 7,450.00 7,416.00
DAILY REPORT 08
th MARCH 2016
YOUR MINTVISORY Call us at +91-731-6642300
RECOMMENDATIONS
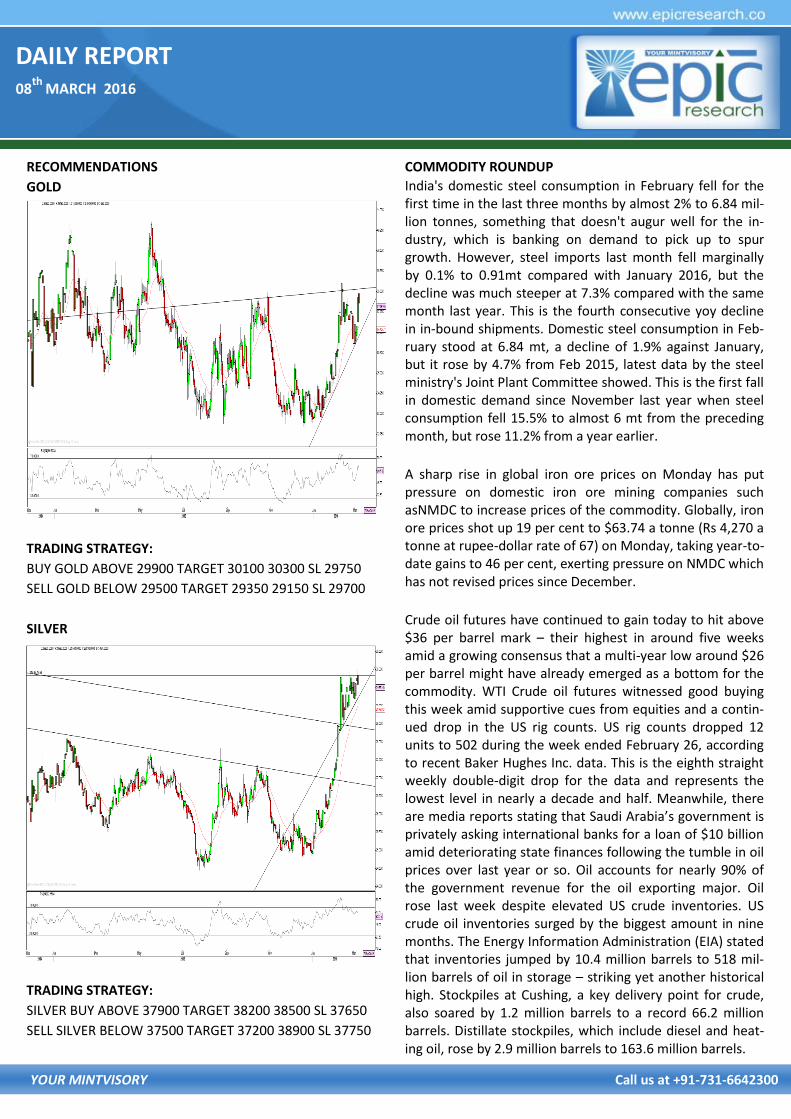
GOLD
TRADING STRATEGY:
BUY GOLD ABOVE 29900 TARGET 30100 30300 SL 29750
SELL GOLD BELOW 29500 TARGET 29350 29150 SL 29700
SILVER
TRADING STRATEGY:
SILVER BUY ABOVE 37900 TARGET 38200 38500 SL 37650
SELL SILVER BELOW 37500 TARGET 37200 38900 SL 37750
COMMODITY ROUNDUP
India's domestic steel consumption in February fell for the first time in the last three months by almost 2% to 6.84 mil-lion tonnes, something that doesn't augur well for the in-dustry, which is banking on demand to pick up to spur growth. However, steel imports last month fell marginally by 0.1% to 0.91mt compared with January 2016, but the decline was much steeper at 7.3% compared with the same month last year. This is the fourth consecutive yoy decline in in-bound shipments. Domestic steel consumption in Feb-ruary stood at 6.84 mt, a decline of 1.9% against January, but it rose by 4.7% from Feb 2015, latest data by the steel ministry's Joint Plant Committee showed. This is the first fall in domestic demand since November last year when steel consumption fell 15.5% to almost 6 mt from the preceding month, but rose 11.2% from a year earlier.
A sharp rise in global iron ore prices on Monday has put pressure on domestic iron ore mining companies such asNMDC to increase prices of the commodity. Globally, iron ore prices shot up 19 per cent to $63.74 a tonne (Rs 4,270 a tonne at rupee-dollar rate of 67) on Monday, taking year-to-date gains to 46 per cent, exerting pressure on NMDC which has not revised prices since December.
Crude oil futures have continued to gain today to hit above $36 per barrel mark – their highest in around five weeks amid a growing consensus that a multi-year low around $26 per barrel might have already emerged as a bottom for the commodity. WTI Crude oil futures witnessed good buying this week amid supportive cues from equities and a contin-ued drop in the US rig counts. US rig counts dropped 12 units to 502 during the week ended February 26, according to recent Baker Hughes Inc. data. This is the eighth straight weekly double-digit drop for the data and represents the lowest level in nearly a decade and half. Meanwhile, there are media reports stating that Saudi Arabia’s government is privately asking international banks for a loan of $10 billion amid deteriorating state finances following the tumble in oil prices over last year or so. Oil accounts for nearly 90% of the government revenue for the oil exporting major. Oil rose last week despite elevated US crude inventories. US crude oil inventories surged by the biggest amount in nine months. The Energy Information Administration (EIA) stated that inventories jumped by 10.4 million barrels to 518 mil-lion barrels of oil in storage – striking yet another historical high. Stockpiles at Cushing, a key delivery point for crude, also soared by 1.2 million barrels to a record 66.2 million barrels. Distillate stockpiles, which include diesel and heat-ing oil, rose by 2.9 million barrels to 163.6 million barrels.
DAILY REPORT 08
th MARCH 2016
YOUR MINTVISORY Call us at +91-731-6642300
NCDEX
NCDEX INDICES
Index Value % Change
CHANA 4224 -0.75
CORIANDER 6575 -0.78
COTTON SEED 2141 -0.74
GUAR SEED 2983 -0.27
JEERA 14115 +0.89
MUSTARDSEED 3836 -0.52
SOY BEAN 3622 -0.30
SUGAR M GRADE 3222 -0.09
TURMERIC 8872 -0.27
RECOMMENDATIONS
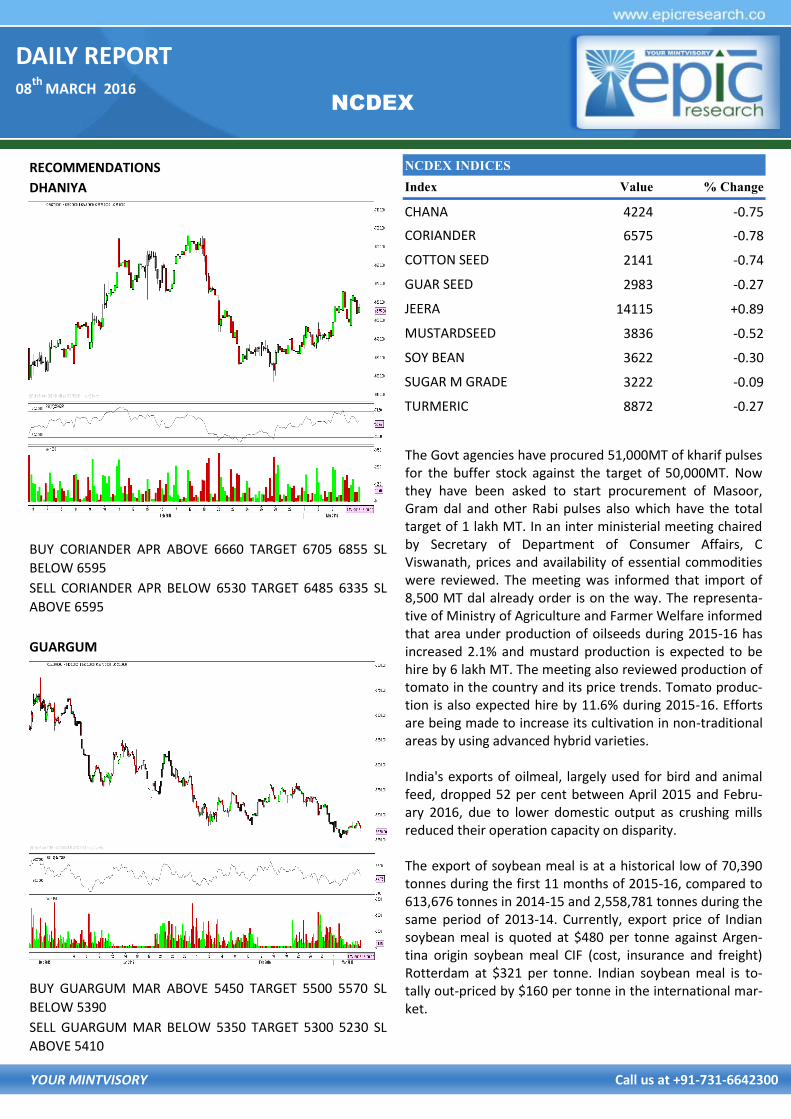
DHANIYA
BUY CORIANDER APR ABOVE 6660 TARGET 6705 6855 SL
BELOW 6595
SELL CORIANDER APR BELOW 6530 TARGET 6485 6335 SL
ABOVE 6595
GUARGUM
BUY GUARGUM MAR ABOVE 5450 TARGET 5500 5570 SL
BELOW 5390
SELL GUARGUM MAR BELOW 5350 TARGET 5300 5230 SL
ABOVE 5410
The Govt agencies have procured 51,000MT of kharif pulses for the buffer stock against the target of 50,000MT. Now they have been asked to start procurement of Masoor, Gram dal and other Rabi pulses also which have the total target of 1 lakh MT. In an inter ministerial meeting chaired by Secretary of Department of Consumer Affairs, C Viswanath, prices and availability of essential commodities were reviewed. The meeting was informed that import of 8,500 MT dal already order is on the way. The representa-tive of Ministry of Agriculture and Farmer Welfare informed that area under production of oilseeds during 2015-16 has increased 2.1% and mustard production is expected to be hire by 6 lakh MT. The meeting also reviewed production of tomato in the country and its price trends. Tomato produc-tion is also expected hire by 11.6% during 2015-16. Efforts are being made to increase its cultivation in non-traditional areas by using advanced hybrid varieties. India's exports of oilmeal, largely used for bird and animal feed, dropped 52 per cent between April 2015 and Febru-ary 2016, due to lower domestic output as crushing mills reduced their operation capacity on disparity. The export of soybean meal is at a historical low of 70,390 tonnes during the first 11 months of 2015-16, compared to 613,676 tonnes in 2014-15 and 2,558,781 tonnes during the same period of 2013-14. Currently, export price of Indian soybean meal is quoted at $480 per tonne against Argen-tina origin soybean meal CIF (cost, insurance and freight) Rotterdam at $321 per tonne. Indian soybean meal is to-tally out-priced by $160 per tonne in the international mar-ket.
DAILY REPORT 08
th MARCH 2016
YOUR MINTVISORY Call us at +91-731-6642300
RBI Reference Rate
Currency Rate Currency Rate
Rupee- $ 67.2713 Yen-100 59.1000
Euro 73.6688 GBP 95.2158
CURRENCY
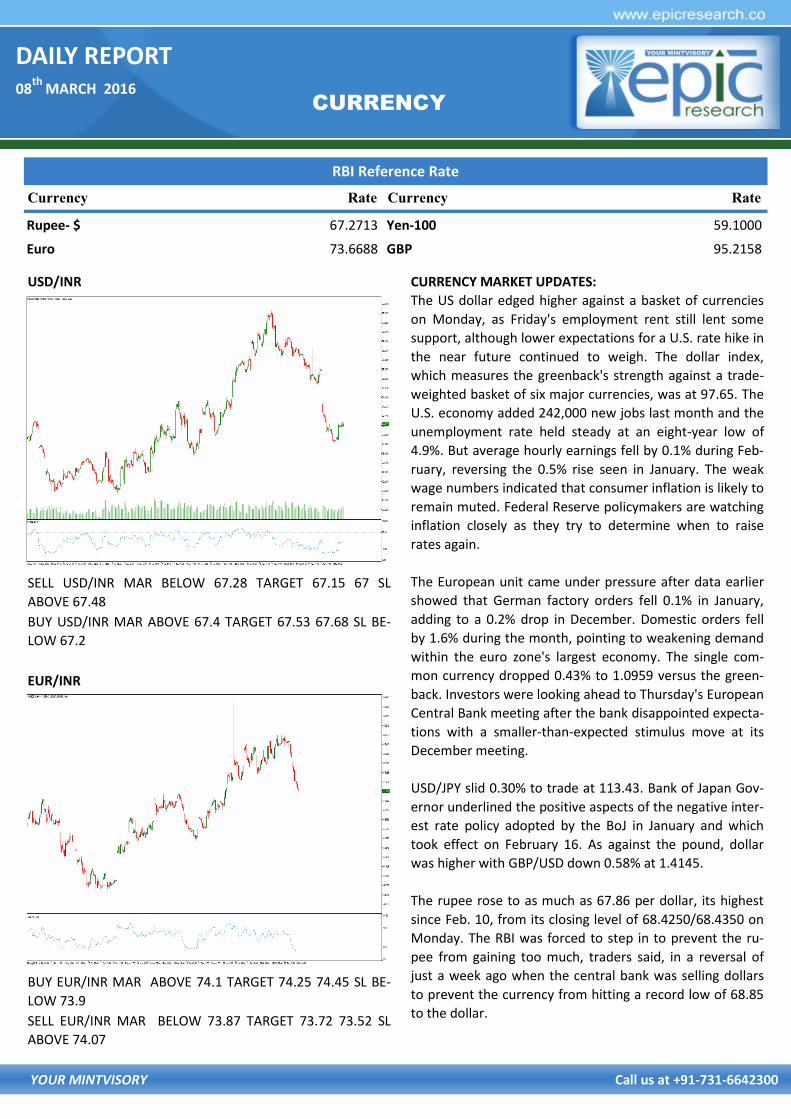
USD/INR
SELL USD/INR MAR BELOW 67.28 TARGET 67.15 67 SL
ABOVE 67.48
BUY USD/INR MAR ABOVE 67.4 TARGET 67.53 67.68 SL BE-
LOW 67.2
EUR/INR
BUY EUR/INR MAR ABOVE 74.1 TARGET 74.25 74.45 SL BE-
LOW 73.9
SELL EUR/INR MAR BELOW 73.87 TARGET 73.72 73.52 SL
ABOVE 74.07
CURRENCY MARKET UPDATES:
The US dollar edged higher against a basket of currencies
on Monday, as Friday's employment rent still lent some
support, although lower expectations for a U.S. rate hike in
the near future continued to weigh. The dollar index,
which measures the greenback's strength against a trade-
weighted basket of six major currencies, was at 97.65. The
U.S. economy added 242,000 new jobs last month and the
unemployment rate held steady at an eight-year low of
4.9%. But average hourly earnings fell by 0.1% during Feb-
ruary, reversing the 0.5% rise seen in January. The weak
wage numbers indicated that consumer inflation is likely to
remain muted. Federal Reserve policymakers are watching
inflation closely as they try to determine when to raise
rates again.
The European unit came under pressure after data earlier
showed that German factory orders fell 0.1% in January,
adding to a 0.2% drop in December. Domestic orders fell
by 1.6% during the month, pointing to weakening demand
within the euro zone's largest economy. The single com-
mon currency dropped 0.43% to 1.0959 versus the green-
back. Investors were looking ahead to Thursday's European
Central Bank meeting after the bank disappointed expecta-
tions with a smaller-than-expected stimulus move at its
December meeting.
USD/JPY slid 0.30% to trade at 113.43. Bank of Japan Gov-
ernor underlined the positive aspects of the negative inter-
est rate policy adopted by the BoJ in January and which
took effect on February 16. As against the pound, dollar
was higher with GBP/USD down 0.58% at 1.4145.
The rupee rose to as much as 67.86 per dollar, its highest
since Feb. 10, from its closing level of 68.4250/68.4350 on
Monday. The RBI was forced to step in to prevent the ru-
pee from gaining too much, traders said, in a reversal of
just a week ago when the central bank was selling dollars
to prevent the currency from hitting a record low of 68.85
to the dollar.
DAILY REPORT 08
th MARCH 2016
YOUR MINTVISORY Call us at +91-731-6642300
Date Commodity/ Currency
Pairs Contract Strategy Entry Level Target Stop Loss Remark
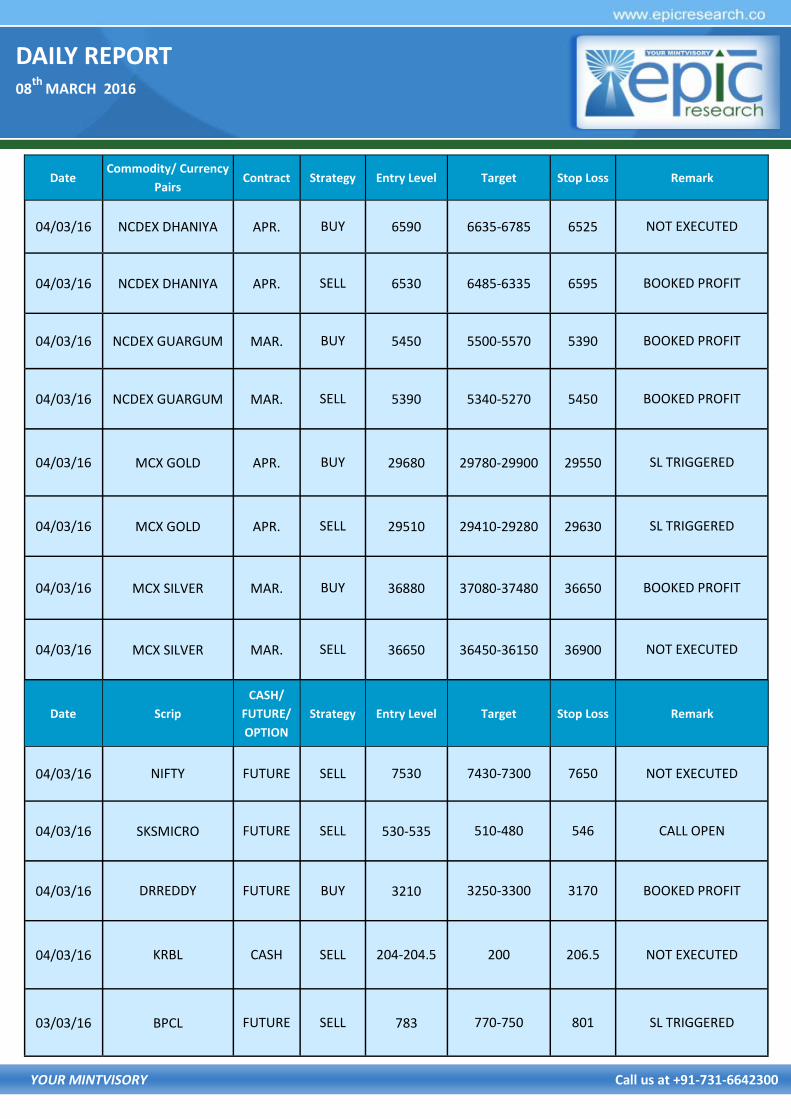
04/03/16 NCDEX DHANIYA APR. BUY 6590 6635-6785 6525 NOT EXECUTED
04/03/16 NCDEX DHANIYA APR. SELL 6530 6485-6335 6595 BOOKED PROFIT
04/03/16 NCDEX GUARGUM MAR. BUY 5450 5500-5570 5390 BOOKED PROFIT
04/03/16 NCDEX GUARGUM MAR. SELL 5390 5340-5270 5450 BOOKED PROFIT
04/03/16 MCX GOLD APR. BUY 29680 29780-29900 29550 SL TRIGGERED
04/03/16 MCX GOLD APR. SELL 29510 29410-29280 29630 SL TRIGGERED
04/03/16 MCX SILVER MAR. BUY 36880 37080-37480 36650 BOOKED PROFIT
04/03/16 MCX SILVER MAR. SELL 36650 36450-36150 36900 NOT EXECUTED
Date Scrip
CASH/
FUTURE/
OPTION
Strategy Entry Level Target Stop Loss Remark
04/03/16 NIFTY FUTURE SELL 7530 7430-7300 7650 NOT EXECUTED
04/03/16 SKSMICRO FUTURE SELL 530-535 510-480 546 CALL OPEN
04/03/16 DRREDDY FUTURE BUY 3210 3250-3300 3170 BOOKED PROFIT
04/03/16 KRBL CASH SELL 204-204.5 200 206.5 NOT EXECUTED
03/03/16 BPCL FUTURE SELL 783 770-750 801 SL TRIGGERED
DAILY REPORT 08
th MARCH 2016
YOUR MINTVISORY Call us at +91-731-6642300
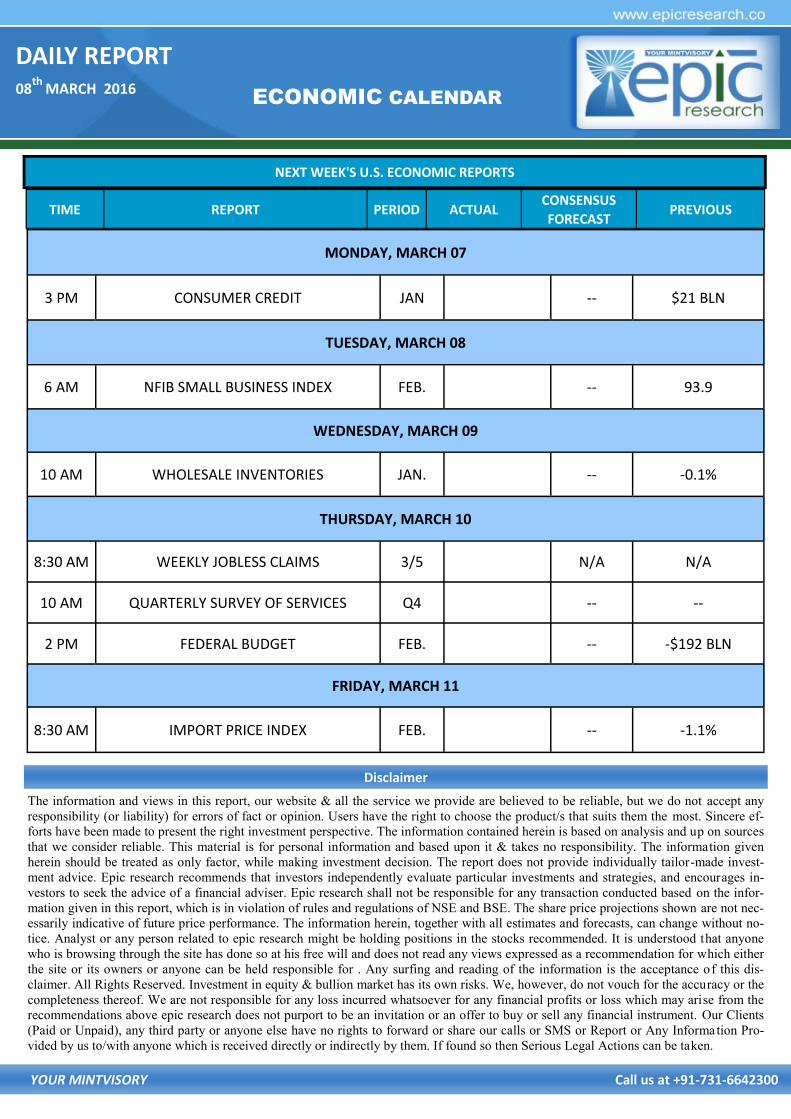
NEXT WEEK'S U.S. ECONOMIC REPORTS
ECONOMIC CALENDAR
The information and views in this report, our website & all the service we provide are believed to be reliable, but we do not accept any
responsibility (or liability) for errors of fact or opinion. Users have the right to choose the product/s that suits them the most. Sincere ef-
forts have been made to present the right investment perspective. The information contained herein is based on analysis and up on sources
that we consider reliable. This material is for personal information and based upon it & takes no responsibility. The information given
herein should be treated as only factor, while making investment decision. The report does not provide individually tailor-made invest-
ment advice. Epic research recommends that investors independently evaluate particular investments and strategies, and encourages in-
vestors to seek the advice of a financial adviser. Epic research shall not be responsible for any transaction conducted based on the infor-
mation given in this report, which is in violation of rules and regulations of NSE and BSE. The share price projections shown are not nec-
essarily indicative of future price performance. The information herein, together with all estimates and forecasts, can change without no-
tice. Analyst or any person related to epic research might be holding positions in the stocks recommended. It is understood that anyone
who is browsing through the site has done so at his free will and does not read any views expressed as a recommendation for which either
the site or its owners or anyone can be held responsible for . Any surfing and reading of the information is the acceptance of this dis-
claimer. All Rights Reserved. Investment in equity & bullion market has its own risks. We, however, do not vouch for the accuracy or the
completeness thereof. We are not responsible for any loss incurred whatsoever for any financial profits or loss which may arise from the
recommendations above epic research does not purport to be an invitation or an offer to buy or sell any financial instrument. Our Clients
(Paid or Unpaid), any third party or anyone else have no rights to forward or share our calls or SMS or Report or Any Information Pro-
vided by us to/with anyone which is received directly or indirectly by them. If found so then Serious Legal Actions can be taken.
Disclaimer
TIME REPORT PERIOD ACTUAL CONSENSUS
FORECAST PREVIOUS
MONDAY, MARCH 07
3 PM CONSUMER CREDIT JAN -- $21 BLN
TUESDAY, MARCH 08
6 AM NFIB SMALL BUSINESS INDEX FEB. -- 93.9
WEDNESDAY, MARCH 09
10 AM WHOLESALE INVENTORIES JAN. -- -0.1%
THURSDAY, MARCH 10
8:30 AM WEEKLY JOBLESS CLAIMS 3/5 N/A N/A
10 AM QUARTERLY SURVEY OF SERVICES Q4 -- --
2 PM FEDERAL BUDGET FEB. -- -$192 BLN
FRIDAY, MARCH 11
8:30 AM IMPORT PRICE INDEX FEB. -- -1.1%