Embed Size (px)
Citation preview

The Venetian Macao Marina Bay Sands, Singapore
Sands Macao Four Seasons Macao Sands Bethlehem The Venetian Las Vegas The Palazzo, Las Vegas
3Q15 Earnings Call PresentationOctober 21, 2015
The Parisian MacaoSands Cotai Central, Macao
This presentation contains forward-looking statements that are made pursuant to the Safe Harbor Provisions of the Private Securities Litigation Reform Act of 1995. Forward-looking statements involve a number of risks, uncertainties or other factors beyond the company’s control, which may cause material differences in actual results, performance or other expectations. These factors include, but are not limited to, general economic conditions, competition, new development, construction and ventures, substantial leverage and debt service, government regulation, tax law changes, legalization of gaming, interest rates, future terrorist acts, influenza, insurance, gaming promoters, risks relating to our gaming licenses, certificate and subconcession, infrastructure in Macao, our ability to meet certain development deadlines, our subsidiaries’ ability to make distribution payments to us, and other factors detailed in the reports filed by Las Vegas Sands Corp. with the Securities and Exchange Commission. Readers are cautioned not to place undue reliance on these forward-looking statements, which speak only as of the date thereof. Las Vegas Sands Corp. assumes no obligation to update such information.
Forward Looking Statements
2
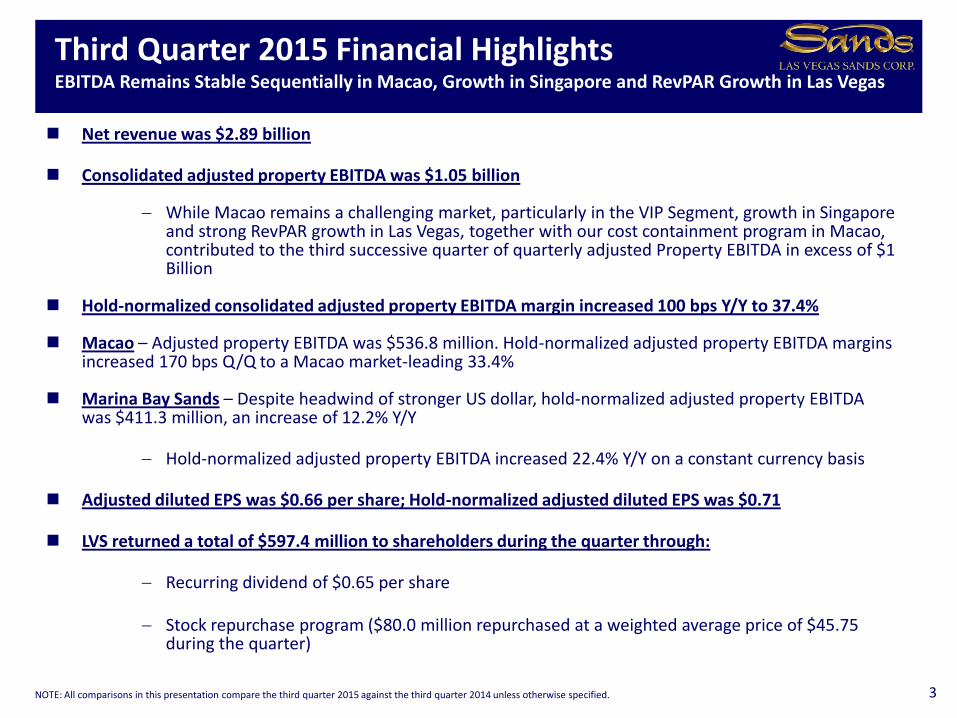
Net revenue was $2.89 billion
Consolidated adjusted property EBITDA was $1.05 billion
While Macao remains a challenging market, particularly in the VIP Segment, growth in Singapore and strong RevPAR growth in Las Vegas, together with our cost containment program in Macao, contributed to the third successive quarter of quarterly adjusted Property EBITDA in excess of $1 Billion
Hold-normalized consolidated adjusted property EBITDA margin increased 100 bps Y/Y to 37.4%
Macao – Adjusted property EBITDA was $536.8 million. Hold-normalized adjusted property EBITDA margins increased 170 bps Q/Q to a Macao market-leading 33.4%
Marina Bay Sands – Despite headwind of stronger US dollar, hold-normalized adjusted property EBITDA was $411.3 million, an increase of 12.2% Y/Y
Hold-normalized adjusted property EBITDA increased 22.4% Y/Y on a constant currency basis
Adjusted diluted EPS was $0.66 per share; Hold-normalized adjusted diluted EPS was $0.71
LVS returned a total of $597.4 million to shareholders during the quarter through:
Recurring dividend of $0.65 per share
Stock repurchase program ($80.0 million repurchased at a weighted average price of $45.75 during the quarter)
Third Quarter 2015 Financial HighlightsEBITDA Remains Stable Sequentially in Macao, Growth in Singapore and RevPAR Growth in Las Vegas
3NOTE: All comparisons in this presentation compare the third quarter 2015 against the third quarter 2014 unless otherwise specified.
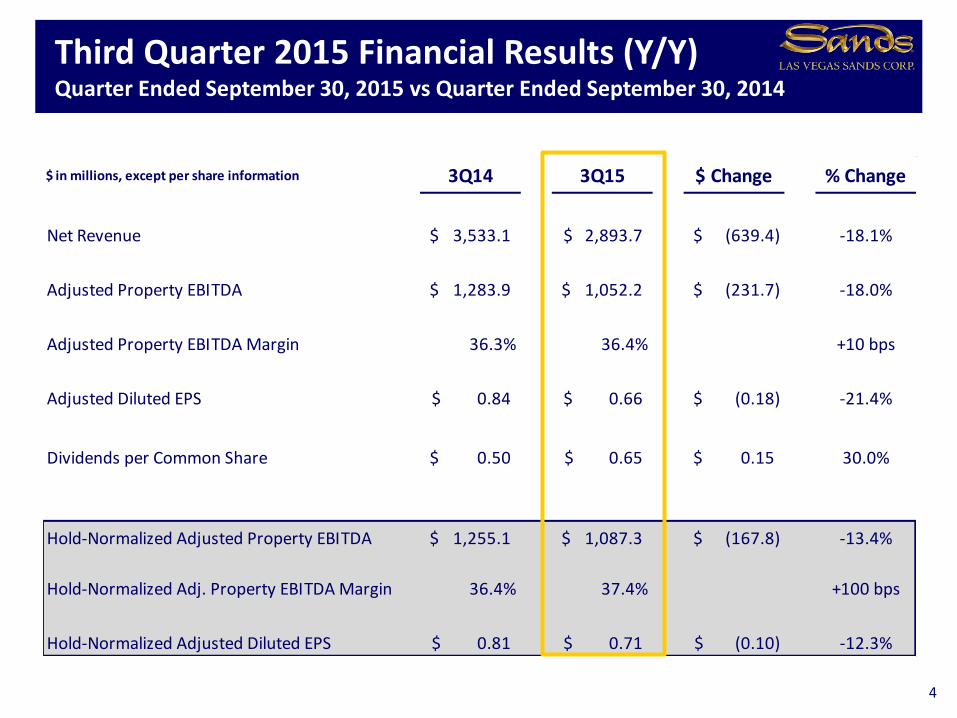
$ in millions, except per share information 3Q14 3Q15 $ Change % Change
Net Revenue 3,533.1$ 2,893.7$ (639.4)$ -18.1%
Adjusted Property EBITDA 1,283.9$ 1,052.2$ (231.7)$ -18.0%
Adjusted Property EBITDA Margin 36.3% 36.4% +10 bps
Adjusted Diluted EPS 0.84$ 0.66$ (0.18)$ -21.4%
Dividends per Common Share 0.50$ 0.65$ 0.15$ 30.0%
Hold-Normalized Adjusted Property EBITDA 1,255.1$ 1,087.3$ (167.8)$ -13.4%
Hold-Normalized Adj. Property EBITDA Margin 36.4% 37.4% +100 bps
Hold-Normalized Adjusted Diluted EPS 0.81$ 0.71$ (0.10)$ -12.3%
Third Quarter 2015 Financial Results (Y/Y)Quarter Ended September 30, 2015 vs Quarter Ended September 30, 2014
4
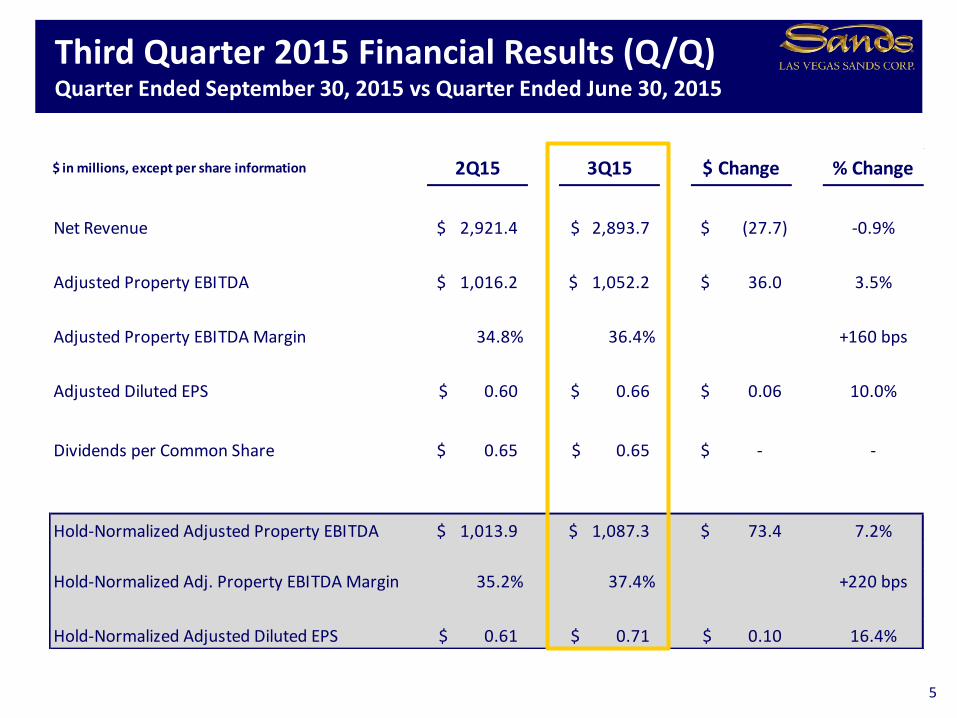
$ in millions, except per share information 2Q15 3Q15 $ Change % Change
Net Revenue 2,921.4$ 2,893.7$ (27.7)$ -0.9%
Adjusted Property EBITDA 1,016.2$ 1,052.2$ 36.0$ 3.5%
Adjusted Property EBITDA Margin 34.8% 36.4% +160 bps
Adjusted Diluted EPS 0.60$ 0.66$ 0.06$ 10.0%
Dividends per Common Share 0.65$ 0.65$ -$ -
Hold-Normalized Adjusted Property EBITDA 1,013.9$ 1,087.3$ 73.4$ 7.2%
Hold-Normalized Adj. Property EBITDA Margin 35.2% 37.4% +220 bps
Hold-Normalized Adjusted Diluted EPS 0.61$ 0.71$ 0.10$ 16.4%
Third Quarter 2015 Financial Results (Q/Q)Quarter Ended September 30, 2015 vs Quarter Ended June 30, 2015
5
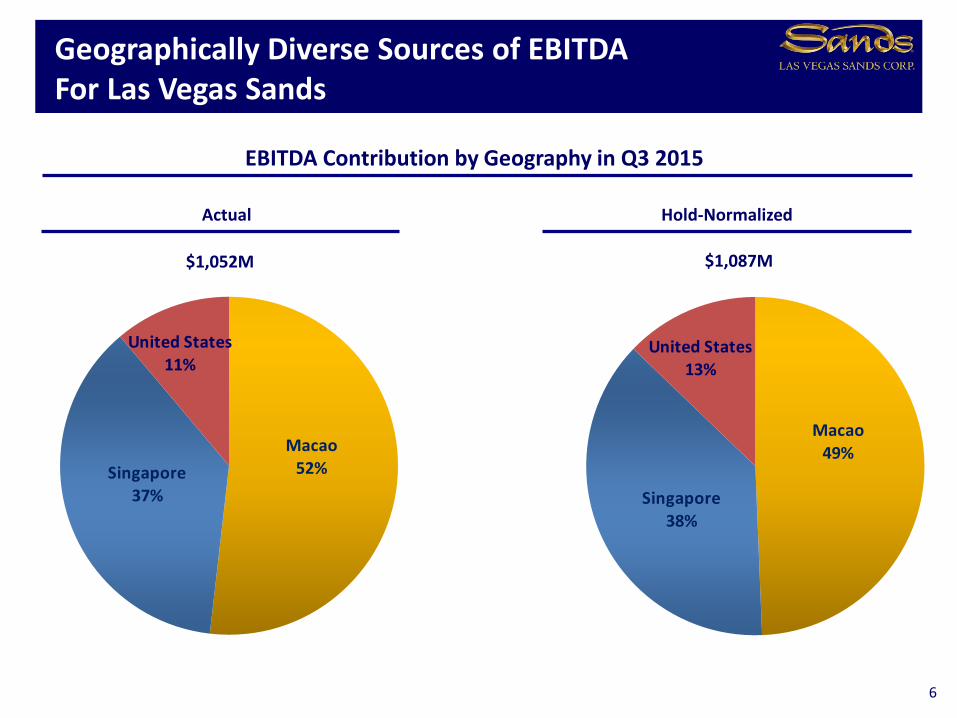
Macao49%
Singapore38%
United States13%
Macao52%Singapore
37%
United States11%
Actual
Geographically Diverse Sources of EBITDA For Las Vegas Sands
6
EBITDA Contribution by Geography in Q3 2015
Hold-Normalized
$1,052M $1,087M
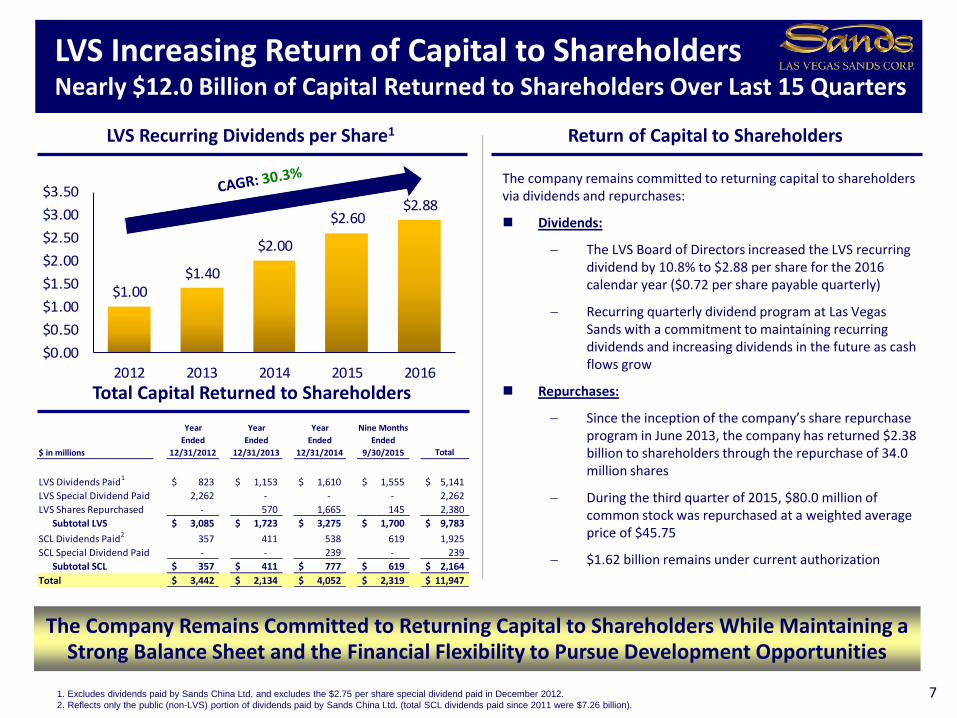
$1.00$1.40
$2.00
$2.60$2.88
$0.00
$0.50
$1.00
$1.50
$2.00
$2.50
$3.00
$3.50
2012 2013 2014 2015 2016
Year Year Year Nine Months
Ended Ended Ended Ended
$ in millions 12/31/2012 12/31/2013 12/31/2014 9/30/2015 Total
LVS Dividends Paid1 823$ 1,153$ 1,610$ 1,555$ 5,141$
LVS Special Dividend Paid 2,262 - - - 2,262
LVS Shares Repurchased - 570 1,665 145 2,380
Subtotal LVS 3,085$ 1,723$ 3,275$ 1,700$ 9,783$
SCL Dividends Paid2
357 411 538 619 1,925
SCL Special Dividend Paid - - 239 - 239
Subtotal SCL 357$ 411$ 777$ 619$ 2,164$
Total 3,442$ 2,134$ 4,052$ 2,319$ 11,947$
7
LVS Increasing Return of Capital to ShareholdersNearly $12.0 Billion of Capital Returned to Shareholders Over Last 15 Quarters
LVS Recurring Dividends per Share1
The company remains committed to returning capital to shareholders via dividends and repurchases:
Dividends:
The LVS Board of Directors increased the LVS recurring dividend by 10.8% to $2.88 per share for the 2016 calendar year ($0.72 per share payable quarterly)
Recurring quarterly dividend program at Las Vegas Sands with a commitment to maintaining recurring dividends and increasing dividends in the future as cash flows grow
Repurchases:
Since the inception of the company’s share repurchase program in June 2013, the company has returned $2.38 billion to shareholders through the repurchase of 34.0 million shares
During the third quarter of 2015, $80.0 million of common stock was repurchased at a weighted average price of $45.75
$1.62 billion remains under current authorization
1. Excludes dividends paid by Sands China Ltd. and excludes the $2.75 per share special dividend paid in December 2012.
2. Reflects only the public (non-LVS) portion of dividends paid by Sands China Ltd. (total SCL dividends paid since 2011 were $7.26 billion).
The Company Remains Committed to Returning Capital to Shareholders While Maintaining aStrong Balance Sheet and the Financial Flexibility to Pursue Development Opportunities
Total Capital Returned to Shareholders
Return of Capital to Shareholders
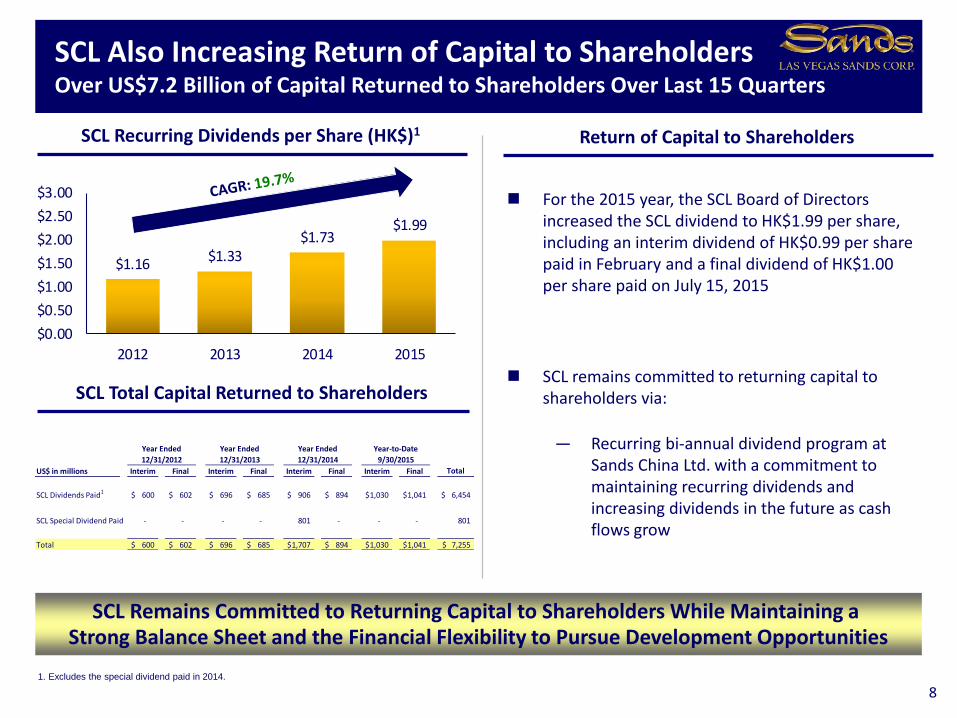
US$ in millions Interim Final Interim Final Interim Final Interim Final Total
SCL Dividends Paid1
600$ 602$ 696$ 685$ 906$ 894$ 1,030$ 1,041$ 6,454$
SCL Special Dividend Paid - - - - 801 - - - 801
Total 600$ 602$ 696$ 685$ 1,707$ 894$ 1,030$ 1,041$ 7,255$
Year-to-Date
9/30/201512/31/2012
Year Ended Year Ended Year Ended
12/31/2013 12/31/2014
$1.16$1.33
$1.73$1.99
$0.00
$0.50
$1.00
$1.50
$2.00
$2.50
$3.00
2012 2013 2014 2015
8
SCL Also Increasing Return of Capital to ShareholdersOver US$7.2 Billion of Capital Returned to Shareholders Over Last 15 Quarters
SCL Recurring Dividends per Share (HK$)1
For the 2015 year, the SCL Board of Directors increased the SCL dividend to HK$1.99 per share, including an interim dividend of HK$0.99 per share paid in February and a final dividend of HK$1.00 per share paid on July 15, 2015
SCL remains committed to returning capital to shareholders via:
— Recurring bi-annual dividend program at Sands China Ltd. with a commitment to maintaining recurring dividends and increasing dividends in the future as cash flows grow
1. Excludes the special dividend paid in 2014.
SCL Remains Committed to Returning Capital to Shareholders While Maintaining a Strong Balance Sheet and the Financial Flexibility to Pursue Development Opportunities
SCL Total Capital Returned to Shareholders
Return of Capital to Shareholders

6.5%
5.5% 5.2%
4.3%
3.7%
3.3%
0.0%
1.0%
2.0%
3.0%
4.0%
5.0%
6.0%
7.0%
$40.00 $47.31 $50.00 $60.00 $70.00 $80.00
5.5%
2.3%
0.0%
1.0%
2.0%
3.0%
4.0%
5.0%
6.0%
7.0%
LVS S&P500
LVS Generates Greater Forward Dividend Yield than the S&P500 Index
2015 Forward Dividend Yield of LVS and S&P5001
1. Reflects the 2015 dividend yield for LVS and the Bloomberg 2015 forward dividend yield estimate for the S&P500 on October 20, 2015.
2. Reflects the 2015 LVS dividend ($2.60) over the closing price for LVS on October 20, 2015.
LVS’s 2015 Dividend Yield of 5.5% Reflects a 320 bps Premium Above the S&P500 Forward Dividend Yield Estimates
Sensitivity of LVS Dividend Yield
Dividend Yield as of 10/20/15²
+320 bps
9
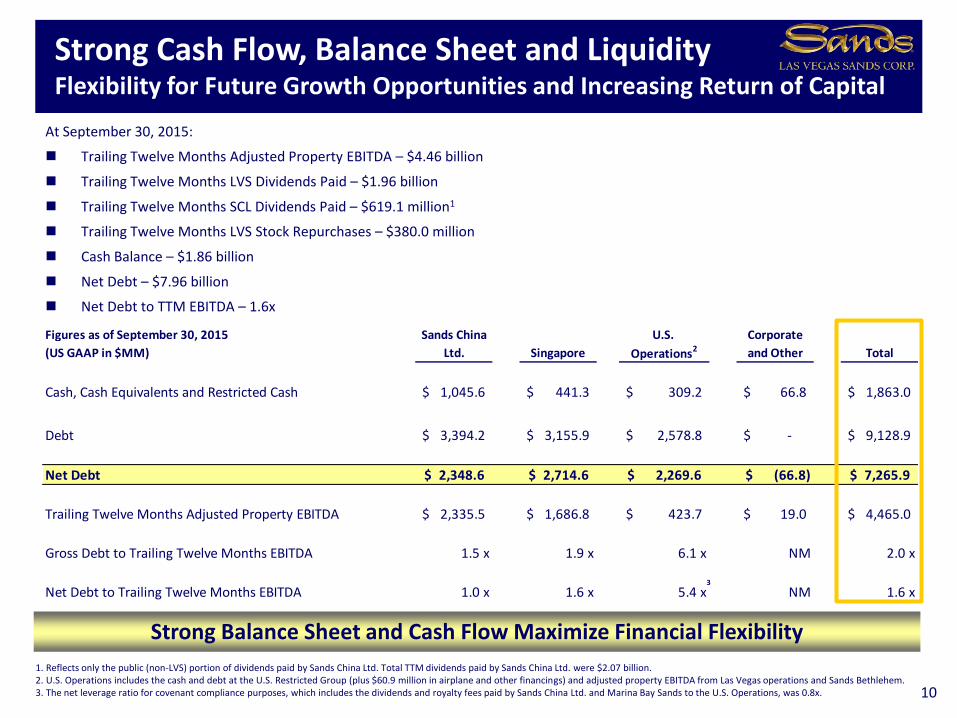
Figures as of September 30, 2015 Sands China U.S. Corporate
(US GAAP in $MM) Ltd. Singapore Operations2 and Other Total
Cash, Cash Equivalents and Restricted Cash 1,045.6$ 441.3$ 309.2$ 66.8$ 1,863.0$
Debt 3,394.2$ 3,155.9$ 2,578.8$ -$ 9,128.9$
Net Debt 2,348.6$ 2,714.6$ 2,269.6$ (66.8)$ 7,265.9$
Trailing Twelve Months Adjusted Property EBITDA 2,335.5$ 1,686.8$ 423.7$ 19.0$ 4,465.0$
Gross Debt to Trailing Twelve Months EBITDA 1.5 x 1.9 x 6.1 x NM 2.0 x
Net Debt to Trailing Twelve Months EBITDA 1.0 x 1.6 x 5.4 x NM 1.6 x
At September 30, 2015:
Trailing Twelve Months Adjusted Property EBITDA – $4.46 billion
Trailing Twelve Months LVS Dividends Paid – $1.96 billion
Trailing Twelve Months SCL Dividends Paid – $619.1 million1
Trailing Twelve Months LVS Stock Repurchases – $380.0 million
Cash Balance – $1.86 billion
Net Debt – $7.96 billion
Net Debt to TTM EBITDA – 1.6x
Strong Cash Flow, Balance Sheet and LiquidityFlexibility for Future Growth Opportunities and Increasing Return of Capital
10
1. Reflects only the public (non-LVS) portion of dividends paid by Sands China Ltd. Total TTM dividends paid by Sands China Ltd. were $2.07 billion.2. U.S. Operations includes the cash and debt at the U.S. Restricted Group (plus $60.9 million in airplane and other financings) and adjusted property EBITDA from Las Vegas operations and Sands Bethlehem.3. The net leverage ratio for covenant compliance purposes, which includes the dividends and royalty fees paid by Sands China Ltd. and Marina Bay Sands to the U.S. Operations, was 0.8x.
Strong Balance Sheet and Cash Flow Maximize Financial Flexibility
3
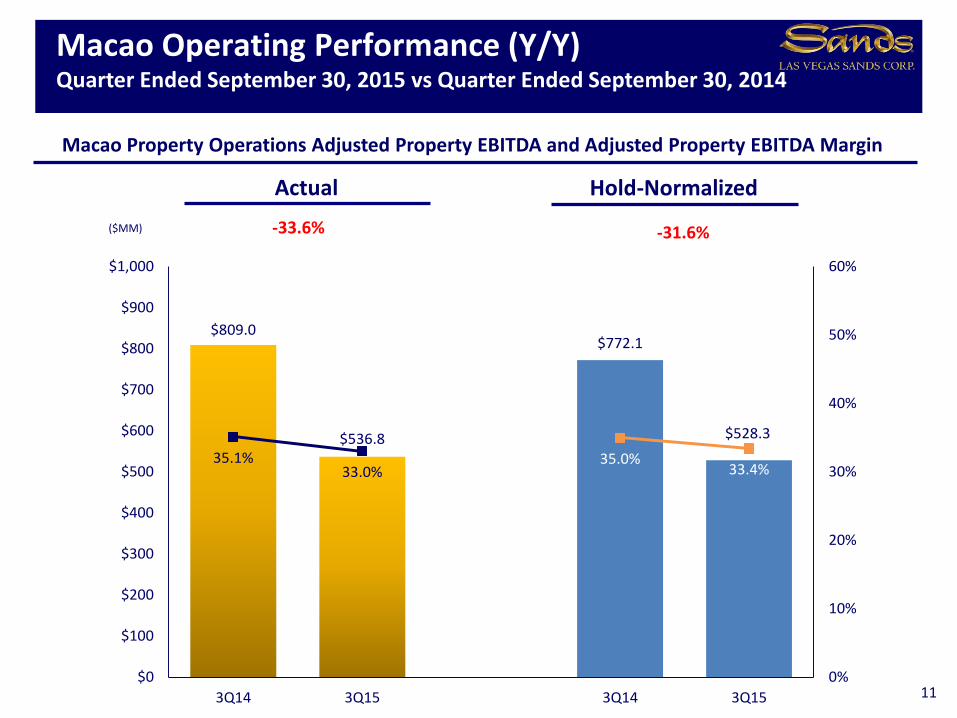
Macao Operating Performance (Y/Y)Quarter Ended September 30, 2015 vs Quarter Ended September 30, 2014
11
($MM)
Macao Property Operations Adjusted Property EBITDA and Adjusted Property EBITDA Margin
Actual Hold-Normalized
-31.6%-33.6%
$809.0
$536.8
$772.1
$528.3
35.1%33.0%
35.0%33.4%
0%
10%
20%
30%
40%
50%
60%
$0
$100
$200
$300
$400
$500
$600
$700
$800
$900
$1,000
3Q14 3Q15 3Q14 3Q15
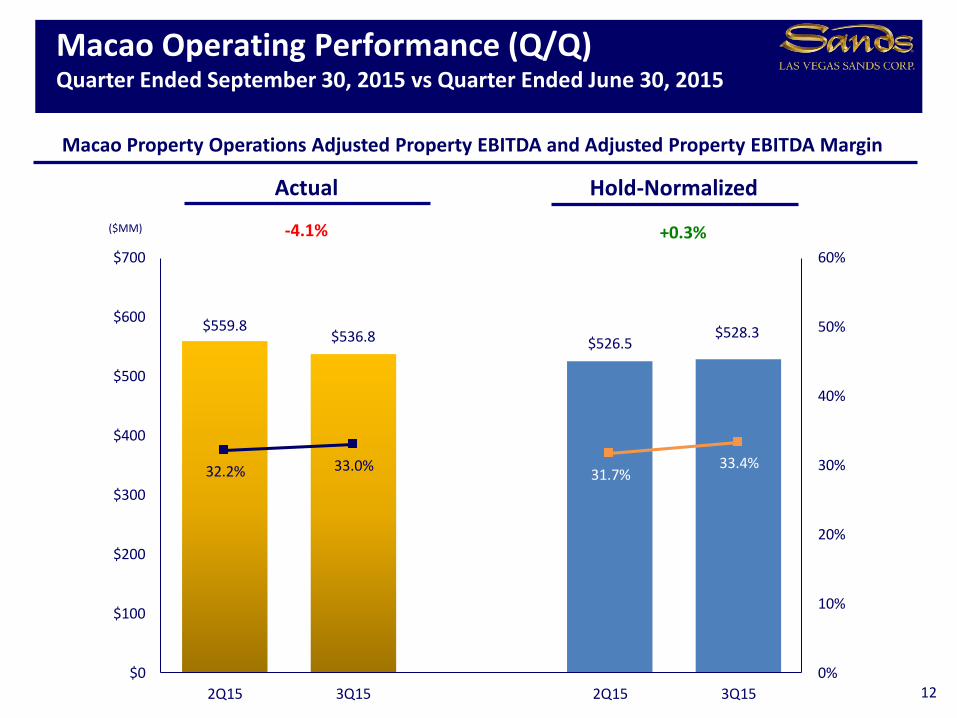
$559.8$536.8 $526.5
$528.3
32.2% 33.0%31.7%
33.4%
0%
10%
20%
30%
40%
50%
60%
$0
$100
$200
$300
$400
$500
$600
$700
2Q15 3Q15 2Q15 3Q15
Macao Operating Performance (Q/Q)Quarter Ended September 30, 2015 vs Quarter Ended June 30, 2015
12
($MM)
Macao Property Operations Adjusted Property EBITDA and Adjusted Property EBITDA Margin
Actual Hold-Normalized
+0.3%-4.1%
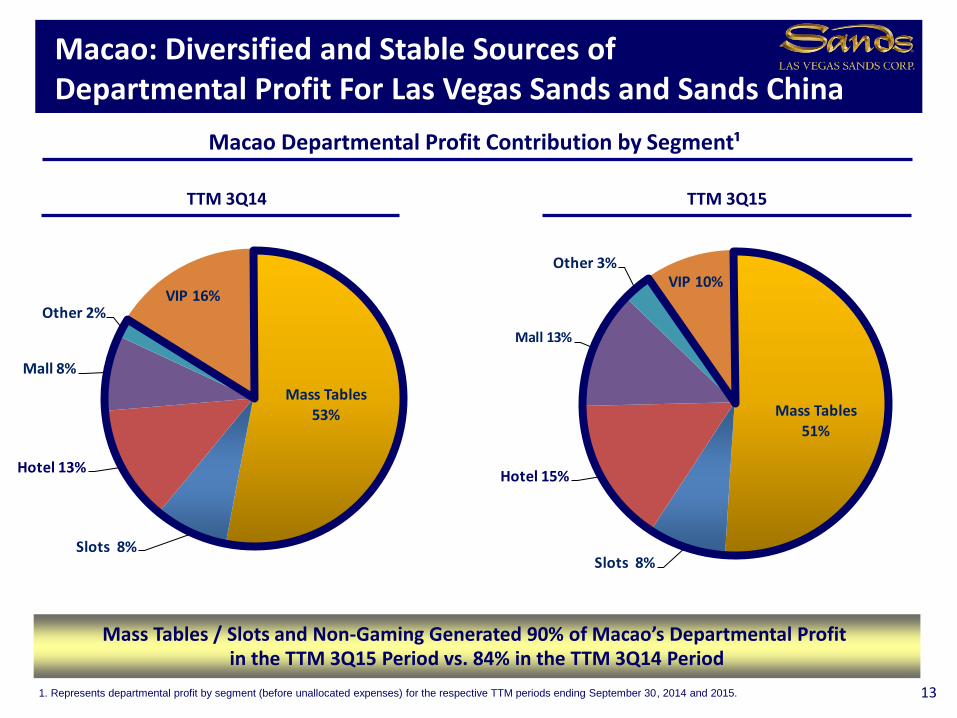
Mass Tables51%
Slots 8%
Hotel 15%
Mall 13%
Other 3%VIP 10%
Mass Tables
53%
Slots 8%
Hotel 13%
Mall 8%
Other 2%VIP 16%
TTM 3Q14
Macao: Diversified and Stable Sources of Departmental Profit For Las Vegas Sands and Sands China
13
Mass Tables / Slots and Non-Gaming Generated 90% of Macao’s Departmental Profit in the TTM 3Q15 Period vs. 84% in the TTM 3Q14 Period
Macao Departmental Profit Contribution by Segment¹
TTM 3Q15
1. Represents departmental profit by segment (before unallocated expenses) for the respective TTM periods ending September 30, 2014 and 2015.
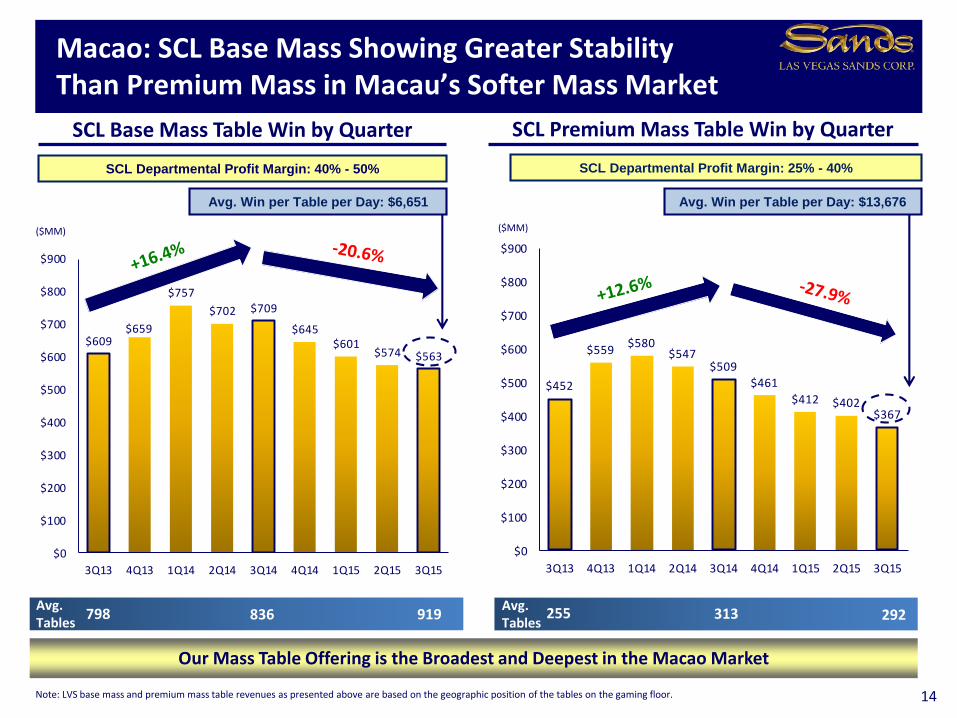
$452
$559$580
$547$509
$461
$412 $402$367
$0
$100
$200
$300
$400
$500
$600
$700
$800
$900
3Q13 4Q13 1Q14 2Q14 3Q14 4Q14 1Q15 2Q15 3Q15
$609$659
$757
$702 $709
$645$601
$574 $563
$0
$100
$200
$300
$400
$500
$600
$700
$800
$900
3Q13 4Q13 1Q14 2Q14 3Q14 4Q14 1Q15 2Q15 3Q15
14
SCL Base Mass Table Win by Quarter
Macao: SCL Base Mass Showing Greater Stability Than Premium Mass in Macau’s Softer Mass Market
Note: LVS base mass and premium mass table revenues as presented above are based on the geographic position of the tables on the gaming floor.
Our Mass Table Offering is the Broadest and Deepest in the Macao Market
($MM)
SCL Premium Mass Table Win by Quarter
SCL Departmental Profit Margin: 40% - 50% SCL Departmental Profit Margin: 25% - 40%
($MM)
255Avg.Tables
313 292798Avg.Tables
836 919
Avg. Win per Table per Day: $6,651 Avg. Win per Table per Day: $13,676

Executing Our Mass Strategy in Macao
Expansion of Mass Market
Offerings Underway with The Parisian
Family-friendly Entertainment World Class Concerts, Sporting Events
and Other Entertainment Offerings
Over 1.5 million sq. feet
of World Class Shopping
Market-Leading Customer Database
Highly Themed Tourism Attractions
Portfolio of Nearly
9,300 Suites and Hotel Rooms
Over 2 million sq. feet of Conference,
Exhibition and Carpeted Meeting Space
The Broadest
and Deepest
Mass
Tourism
Offerings
in Macao
Our Diversified Convention-based Integrated Resort Offerings Appeal to the Broadest Set of Customers and Comprise a Unique Competitive Advantage in the Macao Market 15
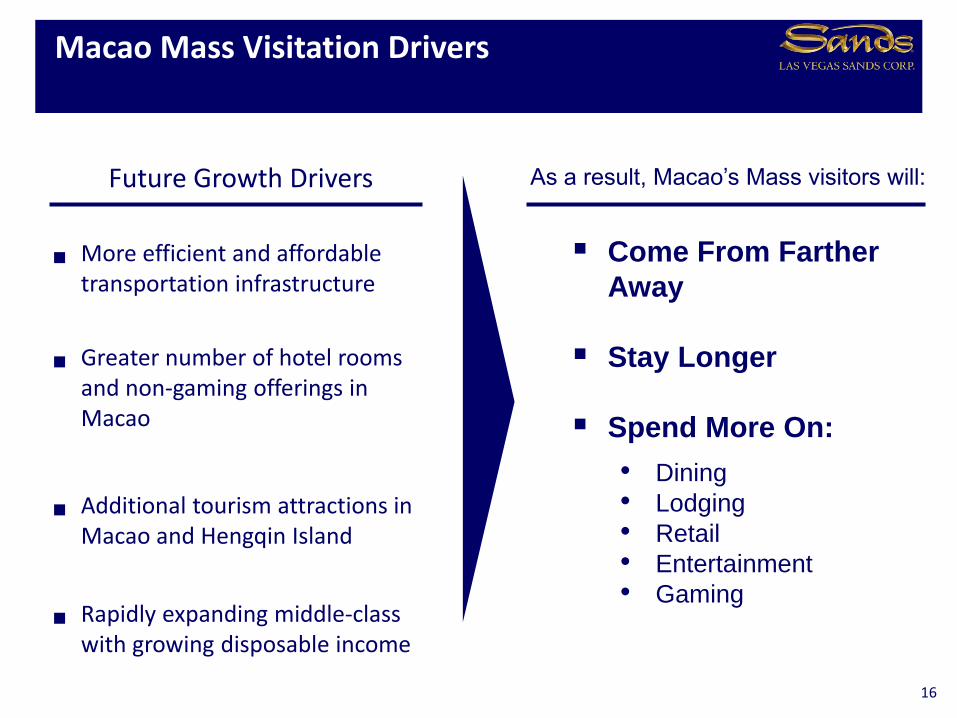
Macao Mass Visitation Drivers
Future Growth Drivers
More efficient and affordable transportation infrastructure
Greater number of hotel rooms and non-gaming offerings in Macao
Additional tourism attractions in Macao and Hengqin Island
Rapidly expanding middle-class with growing disposable income
16
As a result, Macao’s Mass visitors will:
Come From Farther
Away
Stay Longer
Spend More On:
• Dining
• Lodging
• Retail
• Entertainment
• Gaming
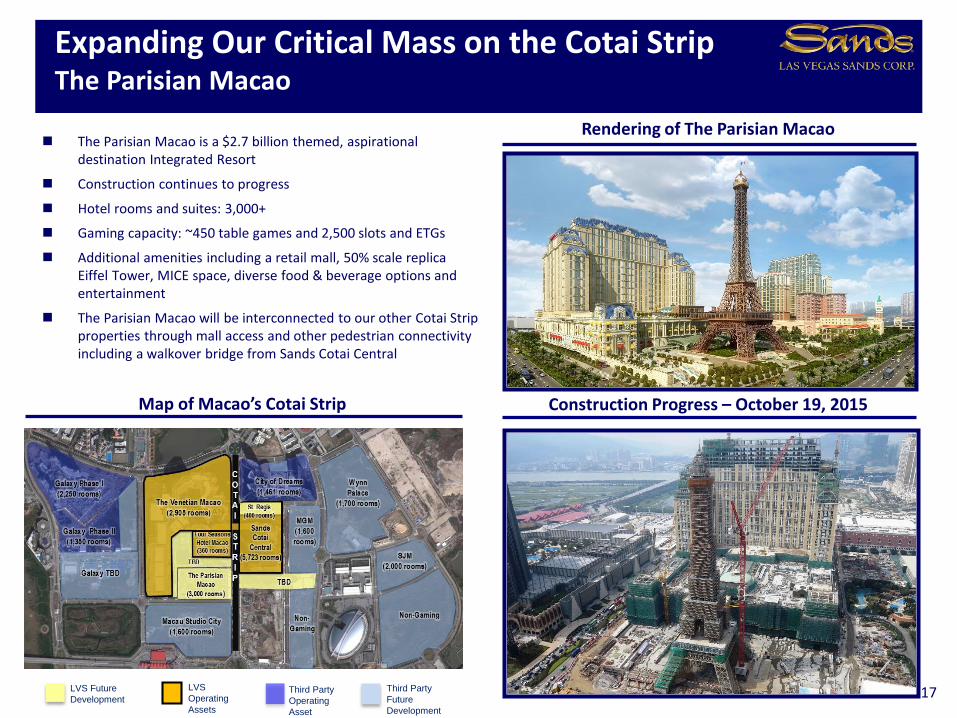
Expanding Our Critical Mass on the Cotai StripThe Parisian Macao
17LVS
Operating
Assets
Third Party
Operating
Asset
Third Party
Future
Development
Construction Progress – October 19, 2015Map of Macao’s Cotai Strip
The Parisian Macao is a $2.7 billion themed, aspirational destination Integrated Resort
Construction continues to progress
Hotel rooms and suites: 3,000+
Gaming capacity: ~450 table games and 2,500 slots and ETGs
Additional amenities including a retail mall, 50% scale replica Eiffel Tower, MICE space, diverse food & beverage options and entertainment
The Parisian Macao will be interconnected to our other Cotai Strip properties through mall access and other pedestrian connectivity including a walkover bridge from Sands Cotai Central
Rendering of The Parisian Macao
LVS Future
Development

Expanding Our Critical Mass on the Cotai StripThe St. Regis Tower at Sands Cotai Central
18
Rendering of St. Regis Porte CochereRendering of St. Regis Suite
St. Regis branded 5-star hotel and serviced apartments to complement the existing portfolio of brands on the Cotai Strip
Opening December 17, 2015
Construction continues to progress
Hotel rooms and suites: ~400
Serviced Apartments: ~300
Construction Progress – October 19, 2015
18% 18% 18% 18%
14% 15% 14% 14%
14% 12% 11% 10%
16% 14%13% 13%
10%9%
9% 10%
0%
20%
40%
60%
80%
2012 2013 2014 TTM 2Q15
28%32%
35% 35%
0%
10%
20%
30%
40%
2012 2013 2014 TTM 2Q15
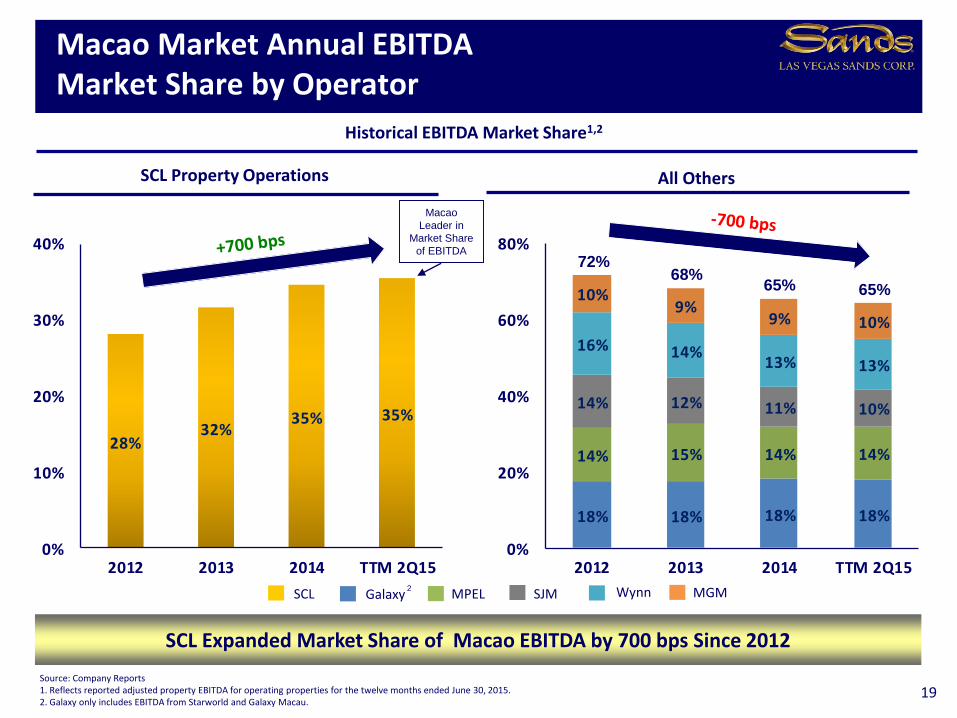
Macao Market Annual EBITDA Market Share by Operator
SCL Expanded Market Share of Macao EBITDA by 700 bps Since 2012
Source: Company Reports1. Reflects reported adjusted property EBITDA for operating properties for the twelve months ended June 30, 2015.2. Galaxy only includes EBITDA from Starworld and Galaxy Macau.
Historical EBITDA Market Share1,2
19
Galaxy MPELSCL2
SJM Wynn MGM
SCL Property Operations All Others
Macao
Leader in
Market Share
of EBITDA72%
68%65% 65%
$3.16 $3.15
$1.66 $1.62
$4.82 $4.77
$0.0
$2.0
$4.0
$6.0
3Q14 3Q15
Non-Rolling Tables Slot Machines
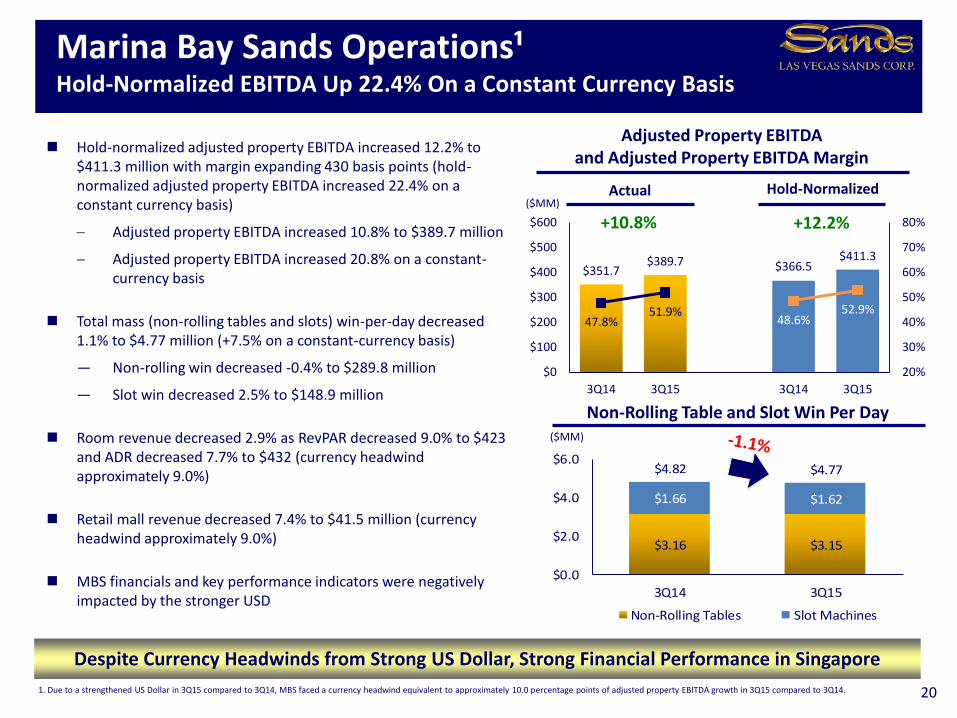
Marina Bay Sands Operations¹Hold-Normalized EBITDA Up 22.4% On a Constant Currency Basis
20
Actual
Hold-normalized adjusted property EBITDA increased 12.2% to $411.3 million with margin expanding 430 basis points (hold-normalized adjusted property EBITDA increased 22.4% on a constant currency basis)
Adjusted property EBITDA increased 10.8% to $389.7 million
Adjusted property EBITDA increased 20.8% on a constant-currency basis
Total mass (non-rolling tables and slots) win-per-day decreased 1.1% to $4.77 million (+7.5% on a constant-currency basis)
— Non-rolling win decreased -0.4% to $289.8 million
— Slot win decreased 2.5% to $148.9 million
Room revenue decreased 2.9% as RevPAR decreased 9.0% to $423 and ADR decreased 7.7% to $432 (currency headwind approximately 9.0%)
Retail mall revenue decreased 7.4% to $41.5 million (currency headwind approximately 9.0%)
MBS financials and key performance indicators were negatively impacted by the stronger USD
($MM)
($MM)
Adjusted Property EBITDA and Adjusted Property EBITDA Margin
Despite Currency Headwinds from Strong US Dollar, Strong Financial Performance in Singapore
Non-Rolling Table and Slot Win Per Day
Hold-Normalized
1. Due to a strengthened US Dollar in 3Q15 compared to 3Q14, MBS faced a currency headwind equivalent to approximately 10.0 percentage points of adjusted property EBITDA growth in 3Q15 compared to 3Q14.
$351.7$389.7 $366.5
$411.3
47.8%51.9%
48.6%52.9%
20%
30%
40%
50%
60%
70%
80%
$0
$100
$200
$300
$400
$500
$600
3Q14 3Q15 3Q14 3Q15
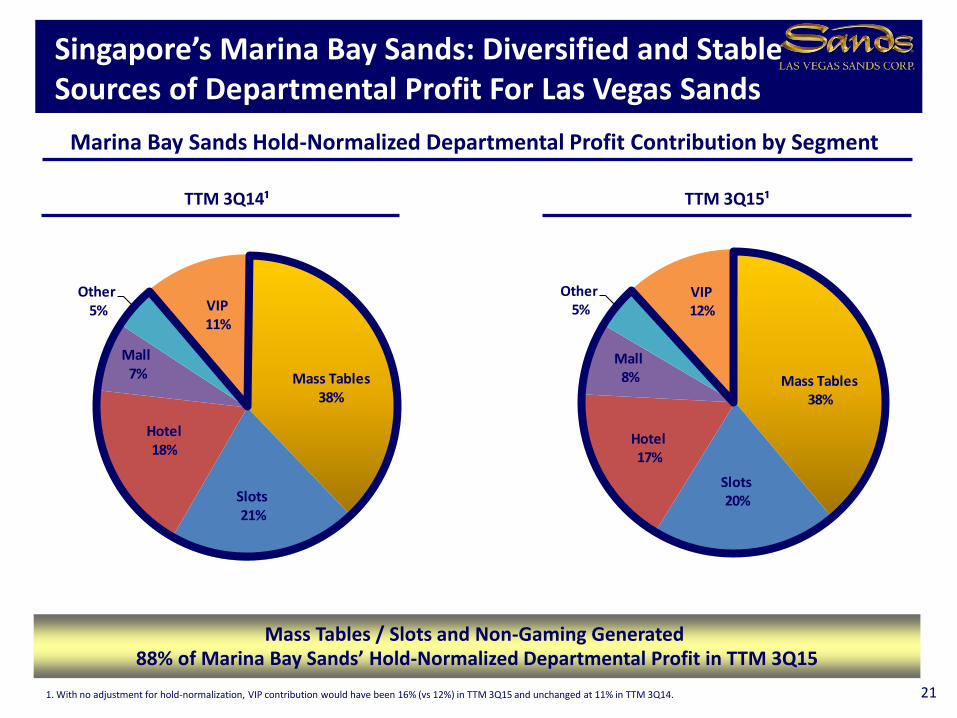
VIP12%
Mass Tables38%
Slots20%
Hotel17%
Mall8%
Other5%VIP
11%
Mass Tables38%
Slots21%
Hotel18%
Mall7%
Other5%
TTM 3Q14¹
Singapore’s Marina Bay Sands: Diversified and Stable Sources of Departmental Profit For Las Vegas Sands
21
Mass Tables / Slots and Non-Gaming Generated 88% of Marina Bay Sands’ Hold-Normalized Departmental Profit in TTM 3Q15
Marina Bay Sands Hold-Normalized Departmental Profit Contribution by Segment
TTM 3Q15¹
1. With no adjustment for hold-normalization, VIP contribution would have been 16% (vs 12%) in TTM 3Q15 and unchanged at 11% in TTM 3Q14.

$188 $192 $198 $205 $204
$129 $132 $139 $145 $141
$52 $57$61
$65 $63
$167$169
$171$171 $167
$536 $551$569 $586 $575
$0
$100
$200
$300
$400
$500
$600
3Q14 4Q14 1Q15 2Q15 3Q15
Venetian Macao Four Seasons Macao Sands Cotai Central¹ Marina Bay Sands
Asia Retail Mall Portfolio Continues to Generate Strong Growth in Revenue and Operating Profit
22
($MM)
Trailing Twelve Months Retail Mall Revenue
89% 89%86% 88%Operating Profit Margin 88%
1. At September 30, 2015, 331,587 square feet of gross leasable area were occupied out of a total of up to 600,000 square feet of retail mall space that will be featured at completion of all phases of Sands Cotai Central. 2. Tenant sales per square foot is the sum of reported comparable sales for the trailing 12-months divided by the comparable square footage for the same period. Only tenants that have occupied mall space for a minimum of 12 months are included in the tenant sales per square foot calculation.
$521M $514M$463M $482MOperating Profit $503M
TTM 3Q15 Sales per Sq. Foot²
MBS:$1,383
SCC:$938
Four Seasons:
Luxury: $5,168Other: $1,812
Venetian:$1,540
$415 $381
$218 $227
$633 $608
$0
$100
$200
$300
$400
$500
$600
$700
3Q14 3Q15
Baccarat Non-Baccarat
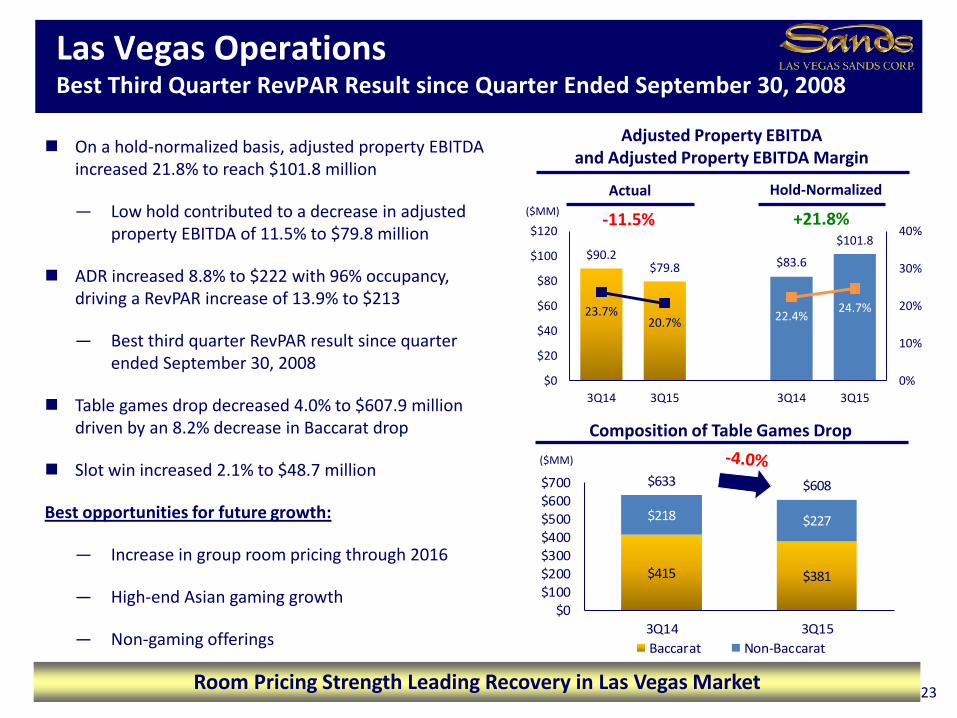
Las Vegas OperationsBest Third Quarter RevPAR Result since Quarter Ended September 30, 2008
23
Composition of Table Games Drop
On a hold-normalized basis, adjusted property EBITDA increased 21.8% to reach $101.8 million
— Low hold contributed to a decrease in adjusted property EBITDA of 11.5% to $79.8 million
ADR increased 8.8% to $222 with 96% occupancy, driving a RevPAR increase of 13.9% to $213
— Best third quarter RevPAR result since quarter ended September 30, 2008
Table games drop decreased 4.0% to $607.9 million driven by an 8.2% decrease in Baccarat drop
Slot win increased 2.1% to $48.7 million
Best opportunities for future growth:
— Increase in group room pricing through 2016
— High-end Asian gaming growth
— Non-gaming offerings
($MM)
Adjusted Property EBITDA and Adjusted Property EBITDA Margin
Room Pricing Strength Leading Recovery in Las Vegas Market
Actual($MM)
Hold-Normalized
$90.2$79.8 $83.6
$101.8
23.7%20.7% 22.4%
24.7%
0%
10%
20%
30%
40%
$0
$20
$40
$60
$80
$100
$120
3Q14 3Q15 3Q14 3Q15
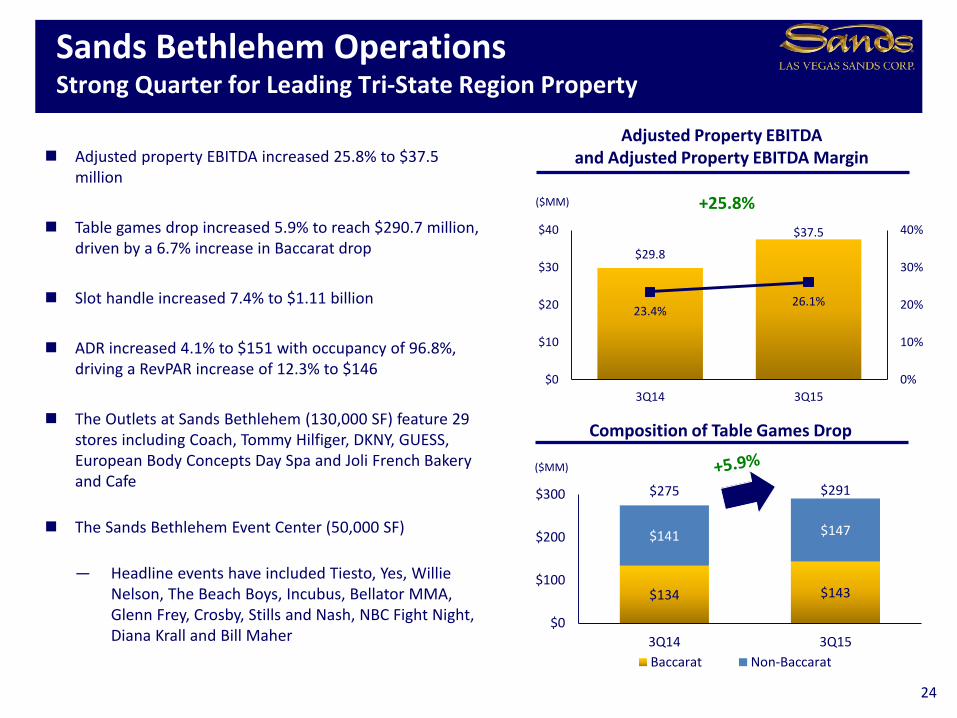
Sands Bethlehem OperationsStrong Quarter for Leading Tri-State Region Property
24
Adjusted property EBITDA increased 25.8% to $37.5 million
Table games drop increased 5.9% to reach $290.7 million, driven by a 6.7% increase in Baccarat drop
Slot handle increased 7.4% to $1.11 billion
ADR increased 4.1% to $151 with occupancy of 96.8%, driving a RevPAR increase of 12.3% to $146
The Outlets at Sands Bethlehem (130,000 SF) feature 29 stores including Coach, Tommy Hilfiger, DKNY, GUESS, European Body Concepts Day Spa and Joli French Bakery and Cafe
The Sands Bethlehem Event Center (50,000 SF)
— Headline events have included Tiesto, Yes, Willie Nelson, The Beach Boys, Incubus, Bellator MMA, Glenn Frey, Crosby, Stills and Nash, NBC Fight Night, Diana Krall and Bill Maher
($MM)
($MM)
Adjusted Property EBITDA and Adjusted Property EBITDA Margin
Composition of Table Games Drop
$29.8
$37.5
23.4%26.1%
0%
10%
20%
30%
40%
$0
$10
$20
$30
$40
3Q14 3Q15
$134 $143
$141 $147
$275 $291
$0
$100
$200
$300
3Q14 3Q15
Baccarat Non-Baccarat
South Korea
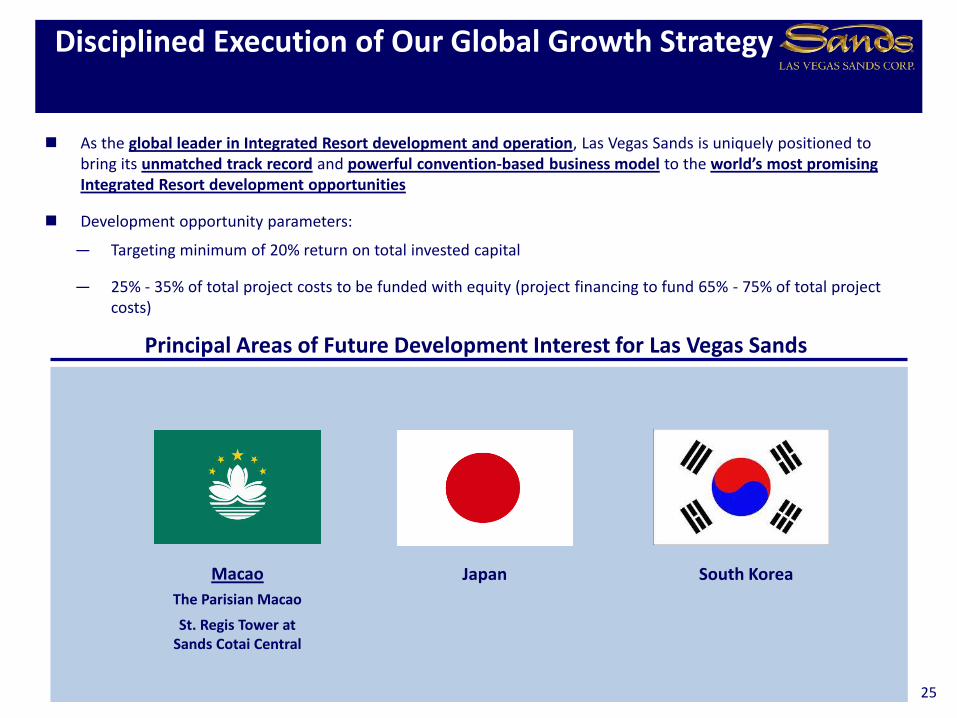
Principal Areas of Future Development Interest for Las Vegas Sands
Japan
As the global leader in Integrated Resort development and operation, Las Vegas Sands is uniquely positioned to bring its unmatched track record and powerful convention-based business model to the world’s most promising Integrated Resort development opportunities
Development opportunity parameters:
— Targeting minimum of 20% return on total invested capital
— 25% - 35% of total project costs to be funded with equity (project financing to fund 65% - 75% of total project costs)
Disciplined Execution of Our Global Growth Strategy
25
Macao
The Parisian Macao
St. Regis Tower atSands Cotai Central
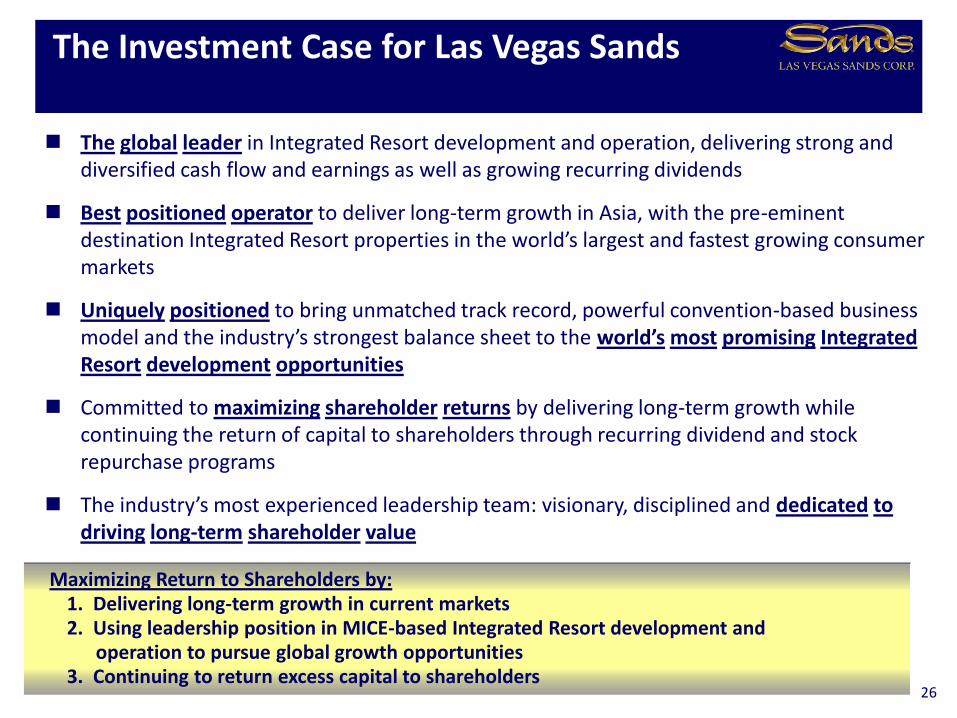
The global leader in Integrated Resort development and operation, delivering strong and diversified cash flow and earnings as well as growing recurring dividends
Best positioned operator to deliver long-term growth in Asia, with the pre-eminent destination Integrated Resort properties in the world’s largest and fastest growing consumer markets
Uniquely positioned to bring unmatched track record, powerful convention-based business model and the industry’s strongest balance sheet to the world’s most promising IntegratedResort development opportunities
Committed to maximizing shareholder returns by delivering long-term growth while continuing the return of capital to shareholders through recurring dividend and stock repurchase programs
The industry’s most experienced leadership team: visionary, disciplined and dedicated todriving long-term shareholder value
The Investment Case for Las Vegas Sands
26
Maximizing Return to Shareholders by:1. Delivering long-term growth in current markets 2. Using leadership position in MICE-based Integrated Resort development and
operation to pursue global growth opportunities3. Continuing to return excess capital to shareholders
Appendix

Historical Hold-Normalized Adj. Property EBITDA1
28
1. This schedule presents hold-normalized adjusted property EBITDA based on the following methodology:(a) for Macao operations and Marina Bay Sands: if the quarter’s rolling win percentage is outside of the 2.70%-3.00% band, then a hold-adjustment is calculated by applying a rolling win percentage of 2.85% to the rolling volume for the quarter.(b) for Las Vegas operations: starting with 1Q15, if the quarter’s Baccarat win percentage is outside of the 21.0%-29.0% band, then a hold-adjustment is calculated by applying a Baccarat win percentage of 25.0%, and if the quarter’s non-Baccarat win percentage is outside of the 16.0%-20.0% band, then a hold-adjustment is calculated by applying a non-Baccarat win percentage of 18.0%. Our expected Baccarat win percentage in the prior quarters was 22.0% to 30.0% (26.0% normalized) and our expected non-Baccarat win percentage in prior quarters was 14.0% to 18.0% (16.0% normalized).(c) for Sands Bethlehem: no hold-adjustment is made.(d) for all properties: gaming taxes, commissions paid to third parties on incremental win, bad debt expense, discounts and other incentives are applied to determine the adjusted property EBITDA impact.
2. Reflects consolidated adjusted property EBITDA inclusive of Other Asia (principally CotaiJet operations) segment.
$ in millions 3Q14 4Q14 1Q15 2Q15 3Q15
Macao Property Operations
Reported 809.0$ 711.2$ 527.7$ 559.8$ 536.8$
Hold-Normalized 772.1$ 686.2$ 527.7$ 526.5$ 528.3$
Marina Bay Sands
Reported 351.7$ 518.5$ 415.3$ 363.3$ 389.7$
Hold-Normalized 366.5$ 461.0$ 371.3$ 363.3$ 411.3$
Las Vegas Operations
Reported 90.2$ 78.0$ 74.1$ 54.2$ 79.8$
Hold-Normalized 83.6$ 87.6$ 89.2$ 85.3$ 101.8$
Sands Bethlehem
Reported 29.8$ 36.2$ 29.9$ 34.1$ 37.5$
Hold-Normalized 29.8$ 36.2$ 29.9$ 34.1$ 37.5$
LVS Consolidated2
Reported 1,283.9$ 1,346.1$ 1,050.5$ 1,016.2$ 1,052.2$
Hold-Normalized 1,255.1$ 1,273.3$ 1,021.6$ 1,013.9$ 1,087.3$
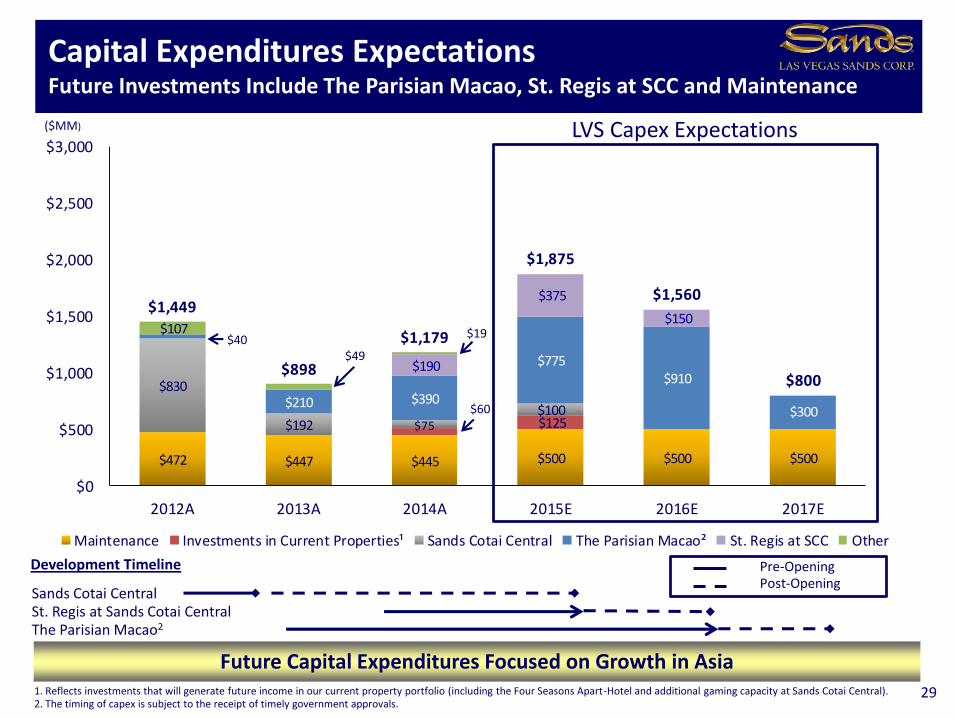
$472 $447 $445 $500 $500 $500
$125
$830
$192 $75$100
$210 $390
$775$910
$300
$190
$375
$150 $107
$1,449
$898
$1,179
$1,875
$1,560
$800
$0
$500
$1,000
$1,500
$2,000
$2,500
$3,000
2012A 2013A 2014A 2015E 2016E 2017E
Maintenance Investments in Current Properties¹ Sands Cotai Central The Parisian Macao² St. Regis at SCC Other
Capital Expenditures ExpectationsFuture Investments Include The Parisian Macao, St. Regis at SCC and Maintenance
Future Capital Expenditures Focused on Growth in Asia
($MM)
1. Reflects investments that will generate future income in our current property portfolio (including the Four Seasons Apart-Hotel and additional gaming capacity at Sands Cotai Central). 2. The timing of capex is subject to the receipt of timely government approvals.
Sands Cotai CentralSt. Regis at Sands Cotai CentralThe Parisian Macao2
LVS Capex Expectations
Development Timeline Pre-OpeningPost-Opening
29
$40$49
$60
$19
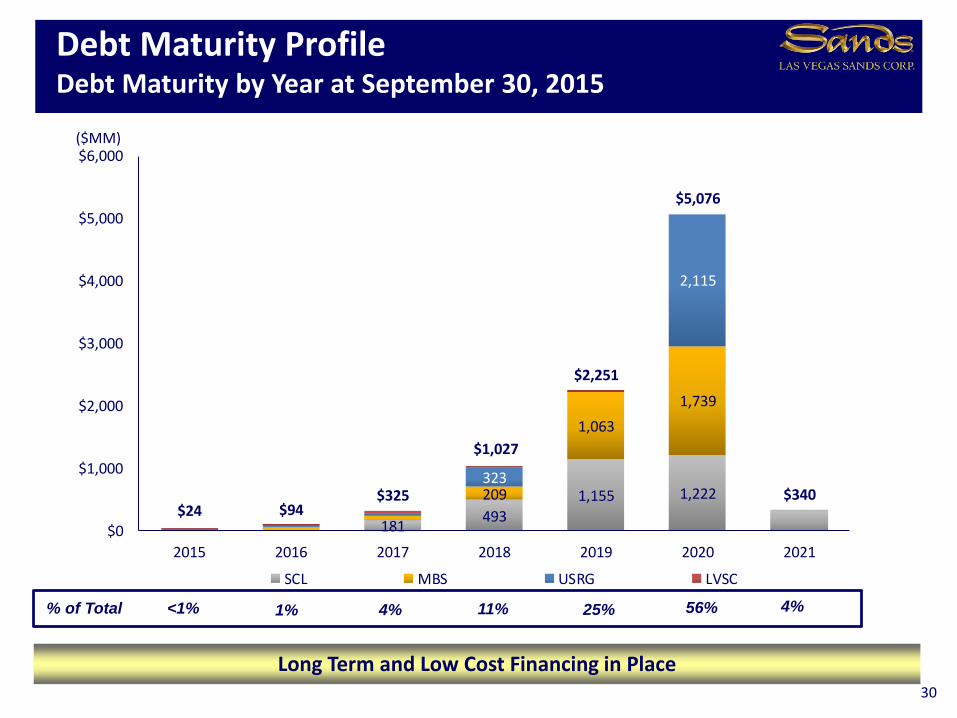
181 493
1,155 1,222209
1,063
1,739
323
2,115
$24 $94$325
$1,027
$2,251
$5,076
$340
$0
$1,000
$2,000
$3,000
$4,000
$5,000
$6,000
2015 2016 2017 2018 2019 2020 2021
SCL MBS USRG LVSC
Debt Maturity ProfileDebt Maturity by Year at September 30, 2015
Long Term and Low Cost Financing in Place
($MM)
<1% 1% 11%% of Total 4% 25% 56%
30
4%
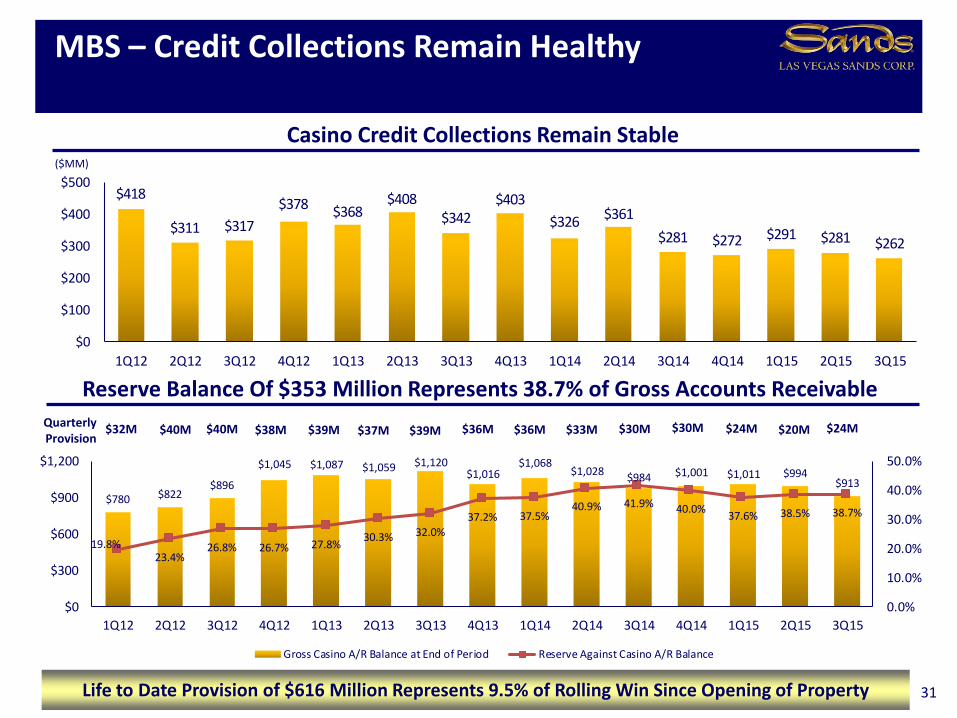
$418
$311 $317
$378 $368$408
$342$403
$326$361
$281 $272 $291 $281 $262
$0
$100
$200
$300
$400
$500
1Q12 2Q12 3Q12 4Q12 1Q13 2Q13 3Q13 4Q13 1Q14 2Q14 3Q14 4Q14 1Q15 2Q15 3Q15
MBS – Credit Collections Remain Healthy
31
($MM)
Reserve Balance Of $353 Million Represents 38.7% of Gross Accounts Receivable
Casino Credit Collections Remain Stable
Quarterly Provision
$40M
Life to Date Provision of $616 Million Represents 9.5% of Rolling Win Since Opening of Property
$38M $39M $37M $39M $36M $36M $33M $30M $30M $24M $20M $24M$32M $40M
$780 $822$896
$1,045 $1,087 $1,059 $1,120$1,016
$1,068$1,028
$984 $1,001 $1,011 $994$913
19.8%23.4%
26.8% 26.7% 27.8%30.3% 32.0%
37.2% 37.5%40.9% 41.9% 40.0%
37.6% 38.5% 38.7%
0.0%
10.0%
20.0%
30.0%
40.0%
50.0%
$0
$300
$600
$900
$1,200
1Q12 2Q12 3Q12 4Q12 1Q13 2Q13 3Q13 4Q13 1Q14 2Q14 3Q14 4Q14 1Q15 2Q15 3Q15
Gross Casino A/R Balance at End of Period Reserve Against Casino A/R Balance
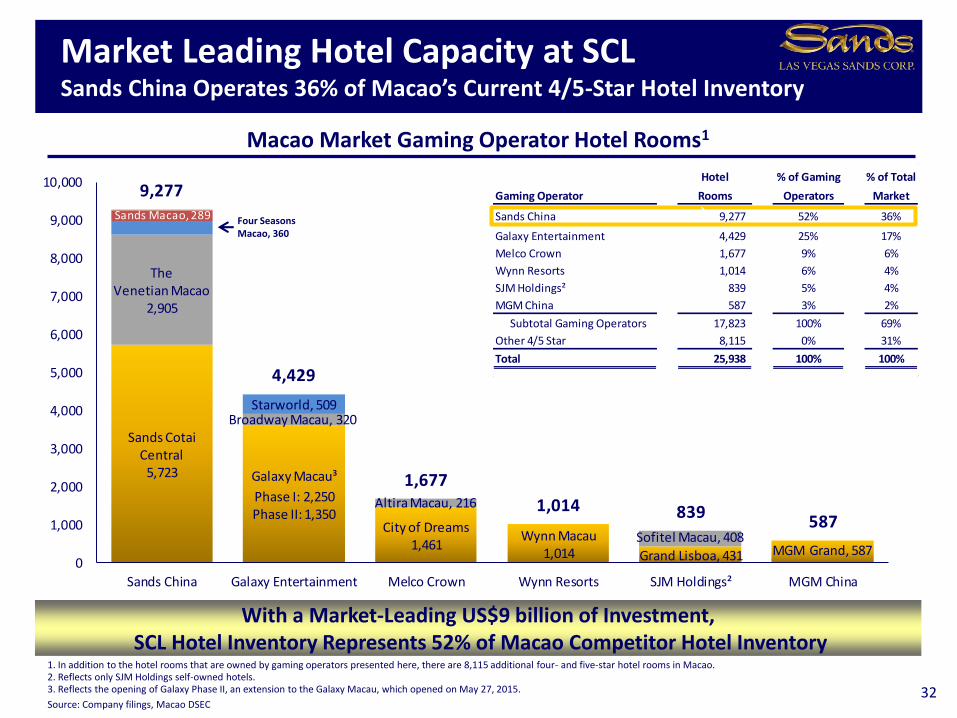
Sands Cotai Central
5,723
The Venetian Macao
2,905
Sands Macao, 289
Galaxy Macau³
Phase I: 2,250Phase II: 1,350
Broadway Macau, 320Starworld, 509
City of Dreams1,461
Altira Macau, 216
Wynn Macau1,014 Grand Lisboa, 431
Sofitel Macau, 408MGM Grand, 587
9,277
4,429
1,677
1,014 839587
0
1,000
2,000
3,000
4,000
5,000
6,000
7,000
8,000
9,000
10,000
Sands China Galaxy Entertainment Melco Crown Wynn Resorts SJM Holdings² MGM China
Hotel % of Gaming % of Total
Gaming Operator Rooms Operators Market
Sands China 9,277 52% 36%
Galaxy Entertainment 4,429 25% 17%
Melco Crown 1,677 9% 6%
Wynn Resorts 1,014 6% 4%
SJM Holdings² 839 5% 4%
MGM China 587 3% 2%
Subtotal Gaming Operators 17,823 100% 69%
Other 4/5 Star 8,115 0% 31%
Total 25,938 100% 100%
Market Leading Hotel Capacity at SCLSands China Operates 36% of Macao’s Current 4/5-Star Hotel Inventory
1. In addition to the hotel rooms that are owned by gaming operators presented here, there are 8,115 additional four- and five-star hotel rooms in Macao.2. Reflects only SJM Holdings self-owned hotels.3. Reflects the opening of Galaxy Phase II, an extension to the Galaxy Macau, which opened on May 27, 2015.
Source: Company filings, Macao DSEC32
With a Market-Leading US$9 billion of Investment,SCL Hotel Inventory Represents 52% of Macao Competitor Hotel Inventory
Macao Market Gaming Operator Hotel Rooms1
Four Seasons Macao, 360
`
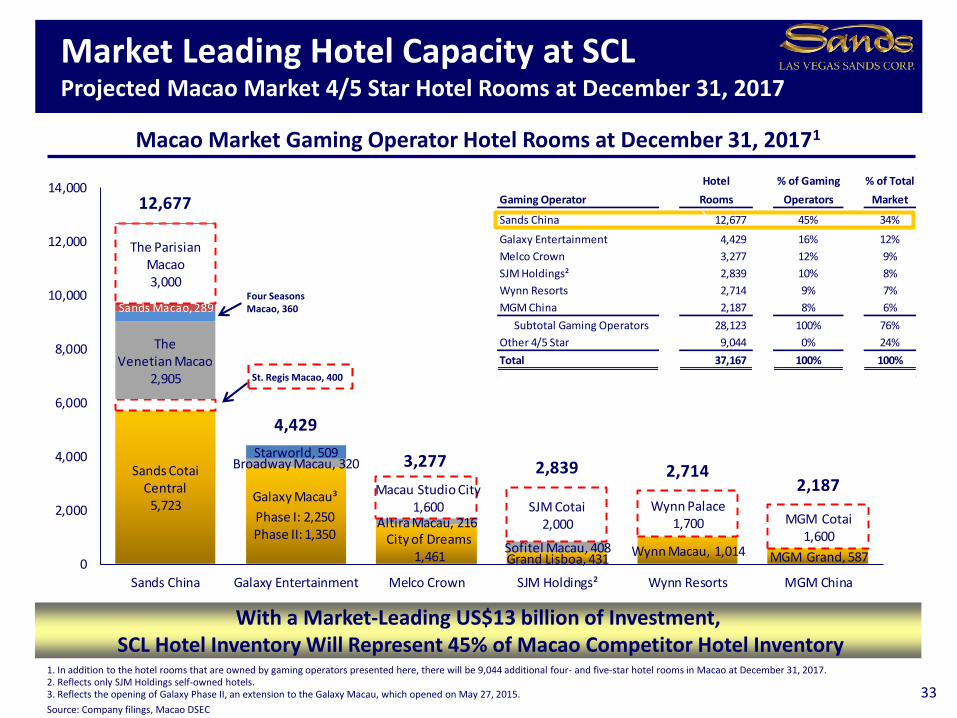
Sands Cotai Central
5,723
The Venetian Macao
2,905
Sands Macao, 289
The Parisian Macao3,000
Galaxy Macau³
Phase I: 2,250Phase II: 1,350
Broadway Macau, 320Starworld, 509
City of Dreams1,461
Altira Macau, 216
Macau Studio City1,600
Grand Lisboa, 431Sofitel Macau, 408
SJM Cotai2,000
Wynn Macau, 1,014
Wynn Palace1,700
MGM Grand, 587
MGM Cotai1,600
12,677
4,429
3,277 2,839 2,7142,187
0
2,000
4,000
6,000
8,000
10,000
12,000
14,000
Sands China Galaxy Entertainment Melco Crown SJM Holdings² Wynn Resorts MGM China
Hotel % of Gaming % of Total
Gaming Operator Rooms Operators Market
Sands China 12,677 45% 34%
Galaxy Entertainment 4,429 16% 12%
Melco Crown 3,277 12% 9%
SJM Holdings² 2,839 10% 8%
Wynn Resorts 2,714 9% 7%
MGM China 2,187 8% 6%
Subtotal Gaming Operators 28,123 100% 76%
Other 4/5 Star 9,044 0% 24%
Total 37,167 100% 100%
1. In addition to the hotel rooms that are owned by gaming operators presented here, there will be 9,044 additional four- and five-star hotel rooms in Macao at December 31, 2017.2. Reflects only SJM Holdings self-owned hotels.3. Reflects the opening of Galaxy Phase II, an extension to the Galaxy Macau, which opened on May 27, 2015.
Source: Company filings, Macao DSEC
33
Macao Market Gaming Operator Hotel Rooms at December 31, 20171
Four Seasons Macao, 360
St. Regis Macao, 400
`
With a Market-Leading US$13 billion of Investment,SCL Hotel Inventory Will Represent 45% of Macao Competitor Hotel Inventory
Market Leading Hotel Capacity at SCLProjected Macao Market 4/5 Star Hotel Rooms at December 31, 2017