Embed Size (px)
Citation preview
For more details contact us: [email protected]
© 2013 BRIDGEi2i Analytics Solutions Pvt. Ltd. All rights reserved
Information Insight Impact
User Guide

For more details contact us: [email protected]
© 2013 BRIDGEi2i Analytics Solutions Pvt. Ltd. All rights reserved
Information Insight Impact
BRIDGEi2i COMPANY OVERVIEW
BRIDGEi2i is an Analytics Solutions company partnering with businesses and institutions
globally, helping them achieve accelerated outcome harnessing the power of data.
BRIDGEi2i provides analytics solutions to business managers enabling them to drive data
based decision making in their day to day work and to help solve complex business issues
using analytics.
BRIDGEi2i is focused on helping companies build the BRIDGE from INFORMATION to
INSIGHTS to IMPACT.
INFORMATION - Manage and use large volumes of data from sources inside and
outside a firm which may be providing meaningful information for the firm.
INSIGHTS - Mine the data with sophisticated statistical or mathematical
techniques and tools to find underlying insights.
IMPACT - Use the identified findings and insights to make meaningful changes in
the business strategy to realize incremental top-line or bottom-line impact.
BRIDGEi2i intends to elevate enterprises to a new gradient where informed decision making
can multiply value manifold. The power of analytics in transforming businesses is
unassailable and BRIDGEi2i would like to be the catalyst in bringing about the change.
TO KNOW MORE ABOUT US:
Website: www.bridgei2i.com
LinkedIn Profile: http://www.linkedin.com/company/bridgei2i-analytics-solutions
Twitter: @BRIDGEi2i
SlideShare: http://www.slideshare.net/Bridgei2i/
For more details contact us: [email protected]
© 2013 BRIDGEi2i Analytics Solutions Pvt. Ltd. All rights reserved
Information Insight Impact
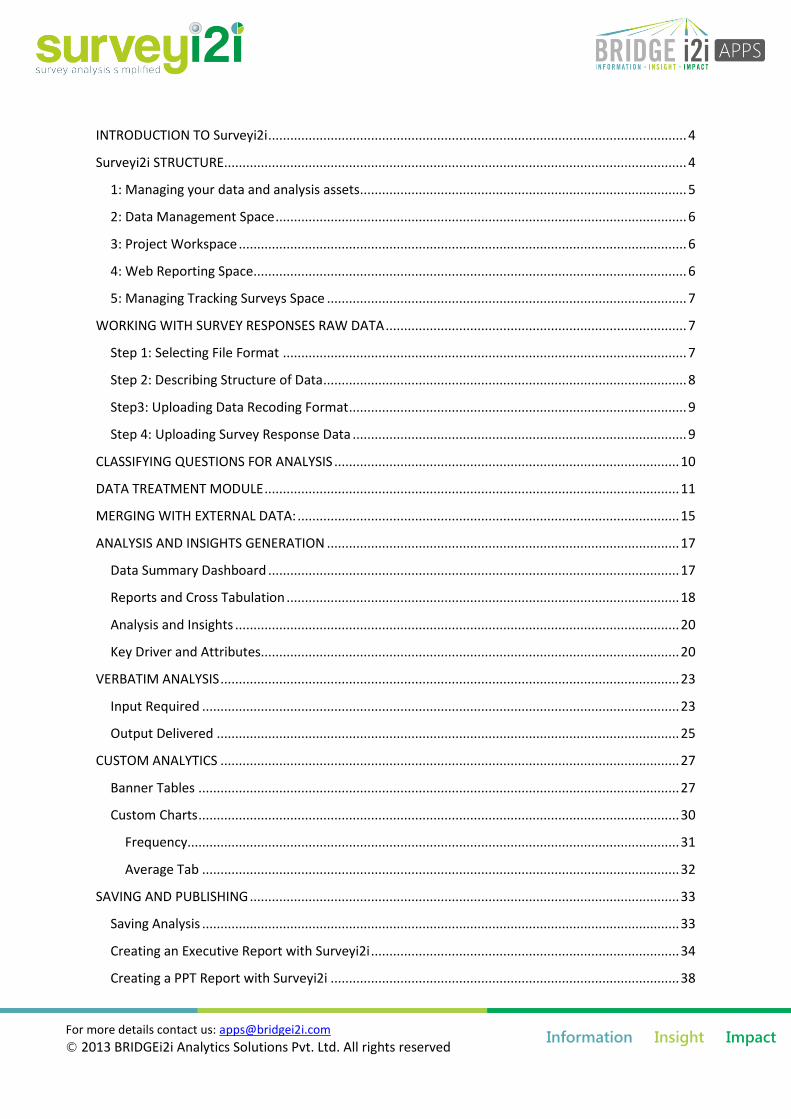
INTRODUCTION TO Surveyi2i .................................................................................................................. 4
Surveyi2i STRUCTURE .............................................................................................................................. 4
1: Managing your data and analysis assets ......................................................................................... 5
2: Data Management Space ................................................................................................................ 6
3: Project Workspace .......................................................................................................................... 6
4: Web Reporting Space ...................................................................................................................... 6
5: Managing Tracking Surveys Space .................................................................................................. 7
WORKING WITH SURVEY RESPONSES RAW DATA .................................................................................. 7
Step 1: Selecting File Format .............................................................................................................. 7
Step 2: Describing Structure of Data ................................................................................................... 8
Step3: Uploading Data Recoding Format ............................................................................................ 9
Step 4: Uploading Survey Response Data ........................................................................................... 9
CLASSIFYING QUESTIONS FOR ANALYSIS .............................................................................................. 10
DATA TREATMENT MODULE ................................................................................................................. 11
MERGING WITH EXTERNAL DATA: ........................................................................................................ 15
ANALYSIS AND INSIGHTS GENERATION ................................................................................................ 17
Data Summary Dashboard ................................................................................................................ 17
Reports and Cross Tabulation ........................................................................................................... 18
Analysis and Insights ......................................................................................................................... 20
Key Driver and Attributes.................................................................................................................. 20
VERBATIM ANALYSIS ............................................................................................................................. 23
Input Required .................................................................................................................................. 23
Output Delivered .............................................................................................................................. 25
CUSTOM ANALYTICS ............................................................................................................................. 27
Banner Tables ................................................................................................................................... 27
Custom Charts ................................................................................................................................... 30
Frequency...................................................................................................................................... 31
Average Tab .................................................................................................................................. 32
SAVING AND PUBLISHING ..................................................................................................................... 33
Saving Analysis .................................................................................................................................. 33
Creating an Executive Report with Surveyi2i .................................................................................... 34
Creating a PPT Report with Surveyi2i ............................................................................................... 38

For more details contact us: [email protected]
© 2013 BRIDGEi2i Analytics Solutions Pvt. Ltd. All rights reserved
Information Insight Impact
TRACKING SURVEY ................................................................................................................................ 40
For more details contact us: [email protected]
© 2013 BRIDGEi2i Analytics Solutions Pvt. Ltd. All rights reserved
Information Insight Impact
INTRODUCTION TO Surveyi2i Surveyi2i is an online application targeted at simplifying the process of turning survey
responses into actionable business insights. This is achieved by combining the simplicity of
Web 2.0, scalability of cloud computing and the power of cutting edge statistical models.
Key features of Surveyi2i are
Cross-tabulation and Visualization of summary data
Automated statistical significance testing
Key drivers of satisfaction/ preference and key attribute analysis
Text Mining of Comments – key words, themes, associated words, categorization of
comments and sentiment analysis
Automation of tracking dashboards for periodic surveys
Data treatments – missing imputation, index creations and transformations
Editable PowerPoint charts on click
Access to historical projects, data and reports
Creation and publishing of web based interactive reports
Despite the complexity of the analytics and the advanced statistical models which power
Surveyi2i, it is simple to use and costs significantly less than comparable products.
Surveyi2i is designed to ensure that you can effectively use it without going through pages
of documentation and training. With a click of a mouse you can easily understand the intent
of various aspects of the application. This document is intended to guide you with how to go
about using the application. This reference guide is developed to show you a screen-by-
screen demonstration of the application.
Surveyi2i STRUCTURE Surveyi2i has a very user-friendly structure to enable a quick and insightful analysis of
survey data. It has 5 major components.
For more details contact us: [email protected]
© 2013 BRIDGEi2i Analytics Solutions Pvt. Ltd. All rights reserved
Information Insight Impact
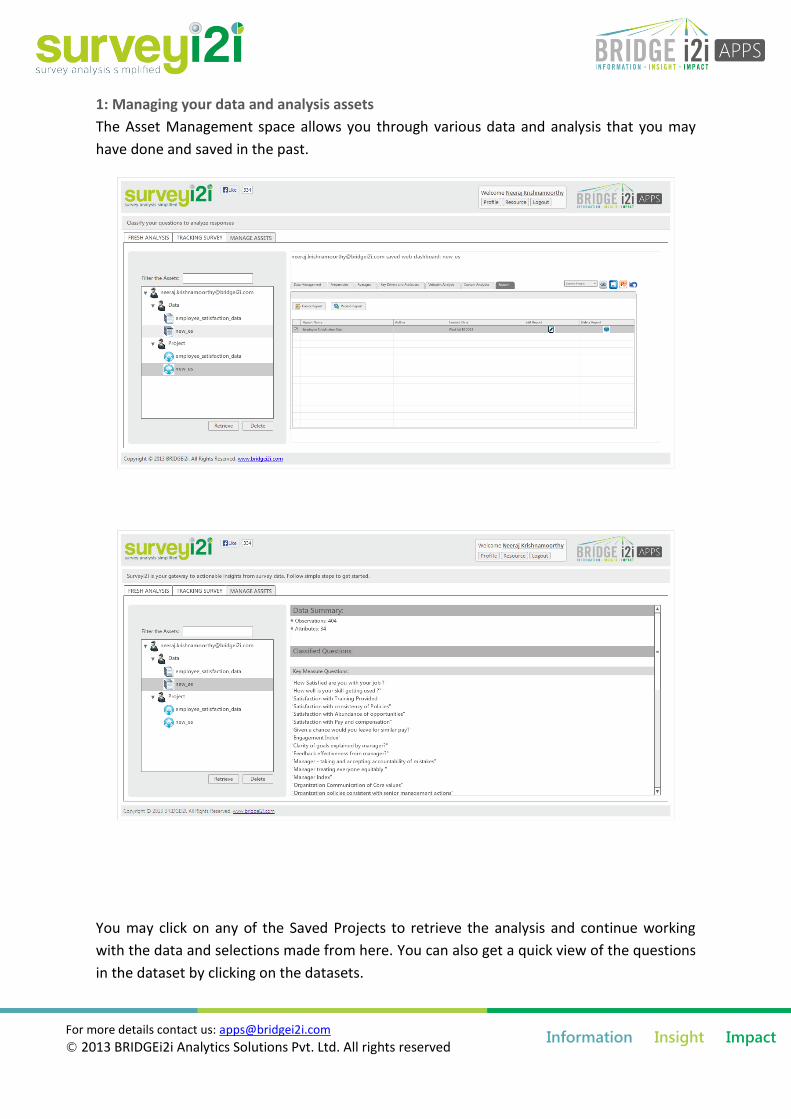
1: Managing your data and analysis assets
The Asset Management space allows you through various data and analysis that you may
have done and saved in the past.
You may click on any of the Saved Projects to retrieve the analysis and continue working
with the data and selections made from here. You can also get a quick view of the questions
in the dataset by clicking on the datasets.
For more details contact us: [email protected]
© 2013 BRIDGEi2i Analytics Solutions Pvt. Ltd. All rights reserved
Information Insight Impact
2: Data Management Space
In the data management space, surveyi2i enables you to
1. Perform various data treatments
2. Merge external data into survey analysis
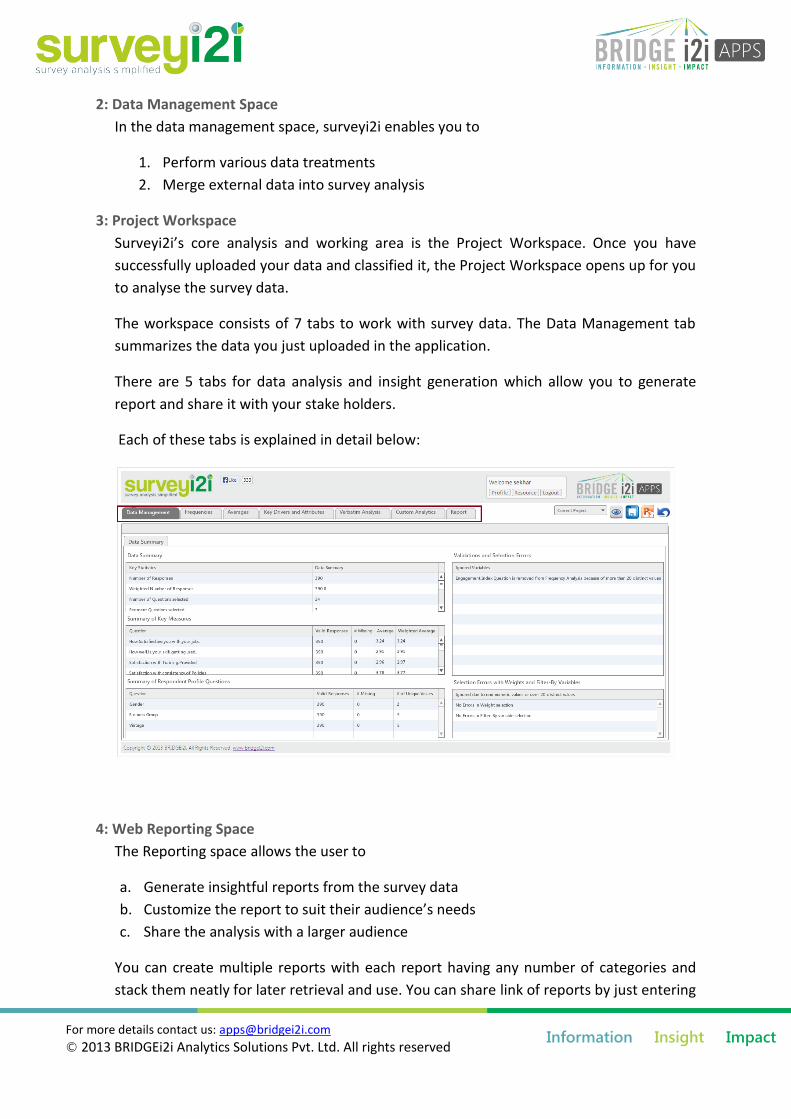
3: Project Workspace
Surveyi2i’s core analysis and working area is the Project Workspace. Once you have
successfully uploaded your data and classified it, the Project Workspace opens up for you
to analyse the survey data.
The workspace consists of 7 tabs to work with survey data. The Data Management tab
summarizes the data you just uploaded in the application.
There are 5 tabs for data analysis and insight generation which allow you to generate
report and share it with your stake holders.
Each of these tabs is explained in detail below:
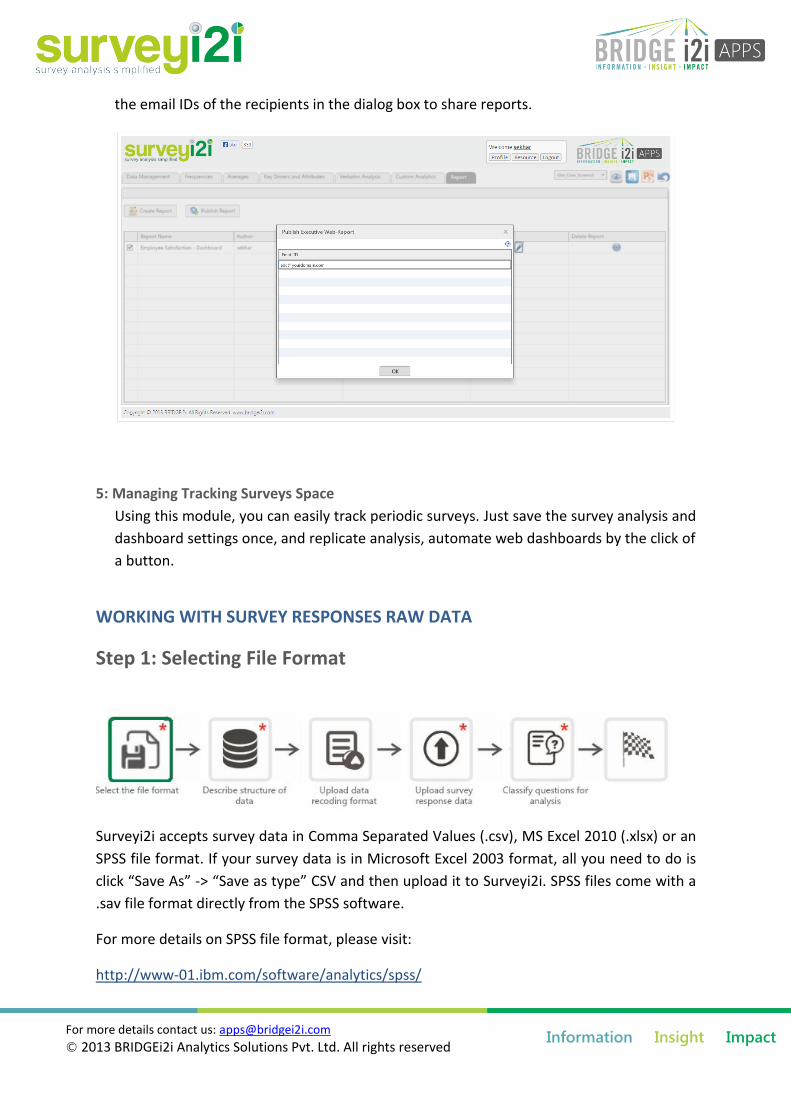
4: Web Reporting Space
The Reporting space allows the user to
a. Generate insightful reports from the survey data
b. Customize the report to suit their audience’s needs
c. Share the analysis with a larger audience
You can create multiple reports with each report having any number of categories and
stack them neatly for later retrieval and use. You can share link of reports by just entering
For more details contact us: [email protected]
© 2013 BRIDGEi2i Analytics Solutions Pvt. Ltd. All rights reserved
Information Insight Impact
the email IDs of the recipients in the dialog box to share reports.
5: Managing Tracking Surveys Space
Using this module, you can easily track periodic surveys. Just save the survey analysis and
dashboard settings once, and replicate analysis, automate web dashboards by the click of
a button.
WORKING WITH SURVEY RESPONSES RAW DATA
Step 1: Selecting File Format
Surveyi2i accepts survey data in Comma Separated Values (.csv), MS Excel 2010 (.xlsx) or an
SPSS file format. If your survey data is in Microsoft Excel 2003 format, all you need to do is
click “Save As” -> “Save as type” CSV and then upload it to Surveyi2i. SPSS files come with a
.sav file format directly from the SPSS software.
For more details on SPSS file format, please visit:
http://www-01.ibm.com/software/analytics/spss/
For more details contact us: [email protected]
© 2013 BRIDGEi2i Analytics Solutions Pvt. Ltd. All rights reserved
Information Insight Impact
Most of the online survey administering websites allows you to download survey data in any
of the formats mentioned above. Integrating survey data in to surveyi2i is hence very easy!
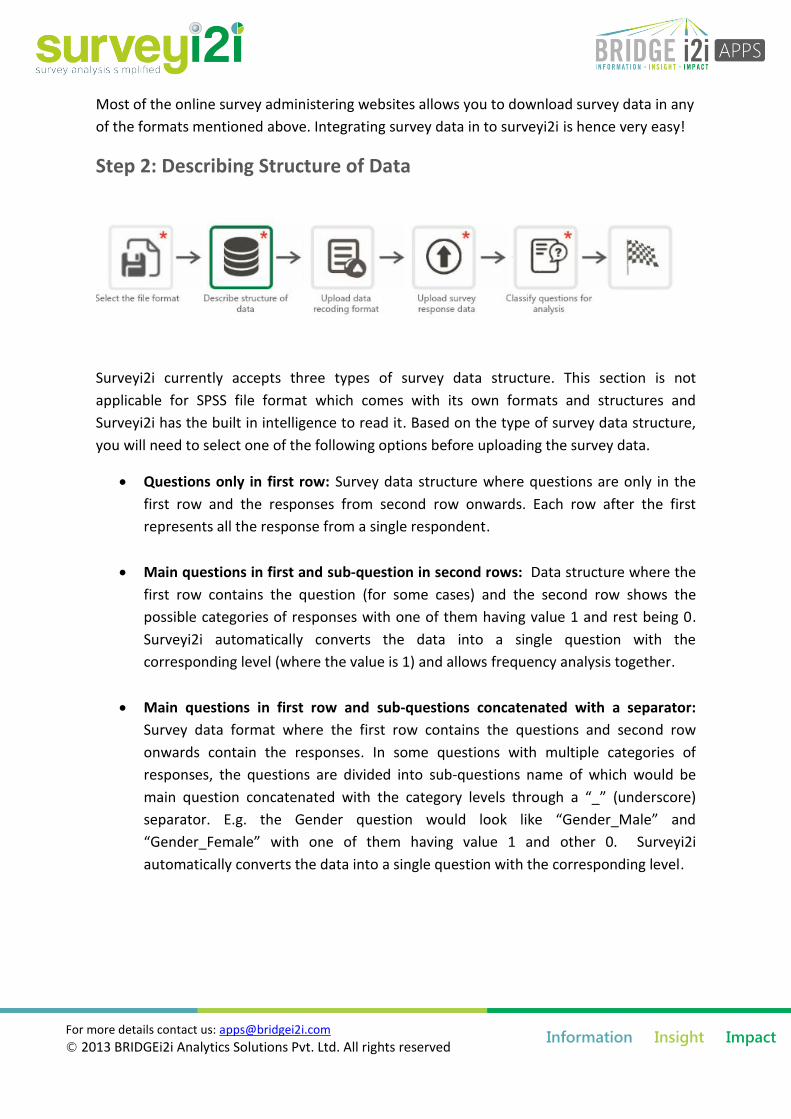
Step 2: Describing Structure of Data
Surveyi2i currently accepts three types of survey data structure. This section is not
applicable for SPSS file format which comes with its own formats and structures and
Surveyi2i has the built in intelligence to read it. Based on the type of survey data structure,
you will need to select one of the following options before uploading the survey data.
Questions only in first row: Survey data structure where questions are only in the
first row and the responses from second row onwards. Each row after the first
represents all the response from a single respondent.
Main questions in first and sub-question in second rows: Data structure where the
first row contains the question (for some cases) and the second row shows the
possible categories of responses with one of them having value 1 and rest being 0.
Surveyi2i automatically converts the data into a single question with the
corresponding level (where the value is 1) and allows frequency analysis together.
Main questions in first row and sub-questions concatenated with a separator:
Survey data format where the first row contains the questions and second row
onwards contain the responses. In some questions with multiple categories of
responses, the questions are divided into sub-questions name of which would be
main question concatenated with the category levels through a “_” (underscore)
separator. E.g. the Gender question would look like “Gender_Male” and
“Gender_Female” with one of them having value 1 and other 0. Surveyi2i
automatically converts the data into a single question with the corresponding level.
For more details contact us: [email protected]
© 2013 BRIDGEi2i Analytics Solutions Pvt. Ltd. All rights reserved
Information Insight Impact
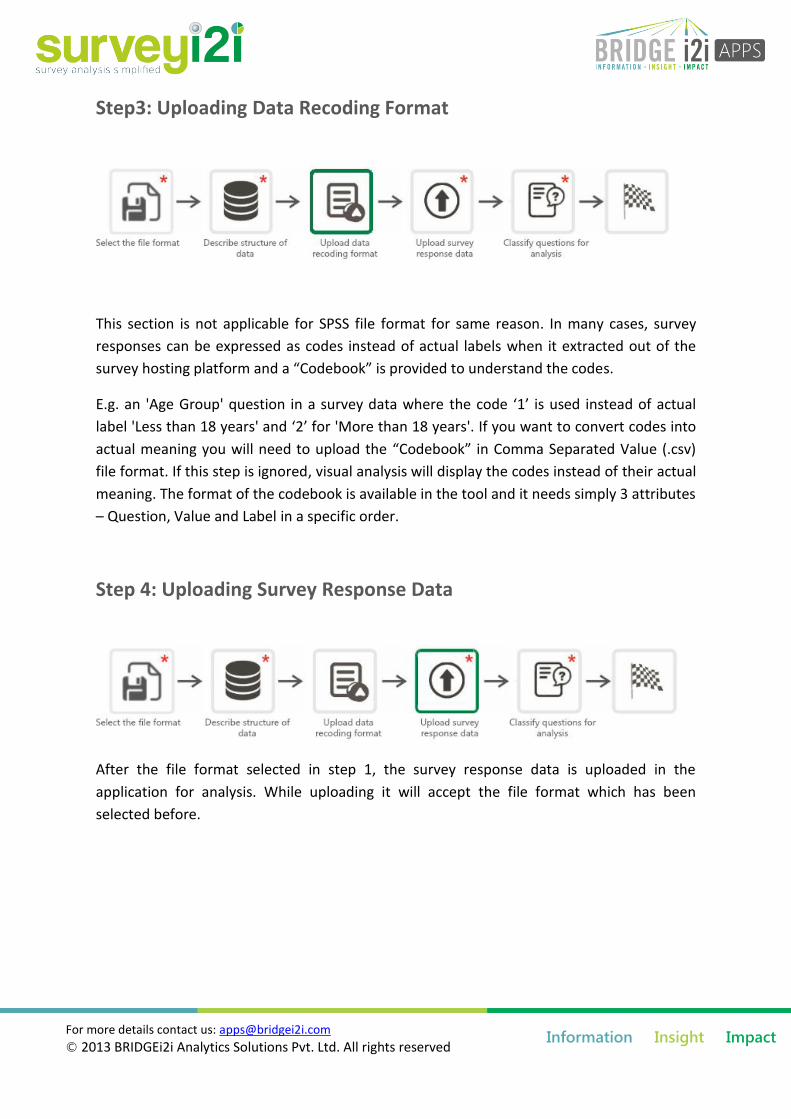
Step3: Uploading Data Recoding Format
This section is not applicable for SPSS file format for same reason. In many cases, survey
responses can be expressed as codes instead of actual labels when it extracted out of the
survey hosting platform and a “Codebook” is provided to understand the codes.
E.g. an 'Age Group' question in a survey data where the code ‘1’ is used instead of actual
label 'Less than 18 years' and ‘2’ for 'More than 18 years'. If you want to convert codes into
actual meaning you will need to upload the “Codebook” in Comma Separated Value (.csv)
file format. If this step is ignored, visual analysis will display the codes instead of their actual
meaning. The format of the codebook is available in the tool and it needs simply 3 attributes
– Question, Value and Label in a specific order.
Step 4: Uploading Survey Response Data
After the file format selected in step 1, the survey response data is uploaded in the
application for analysis. While uploading it will accept the file format which has been
selected before.
For more details contact us: [email protected]
© 2013 BRIDGEi2i Analytics Solutions Pvt. Ltd. All rights reserved
Information Insight Impact
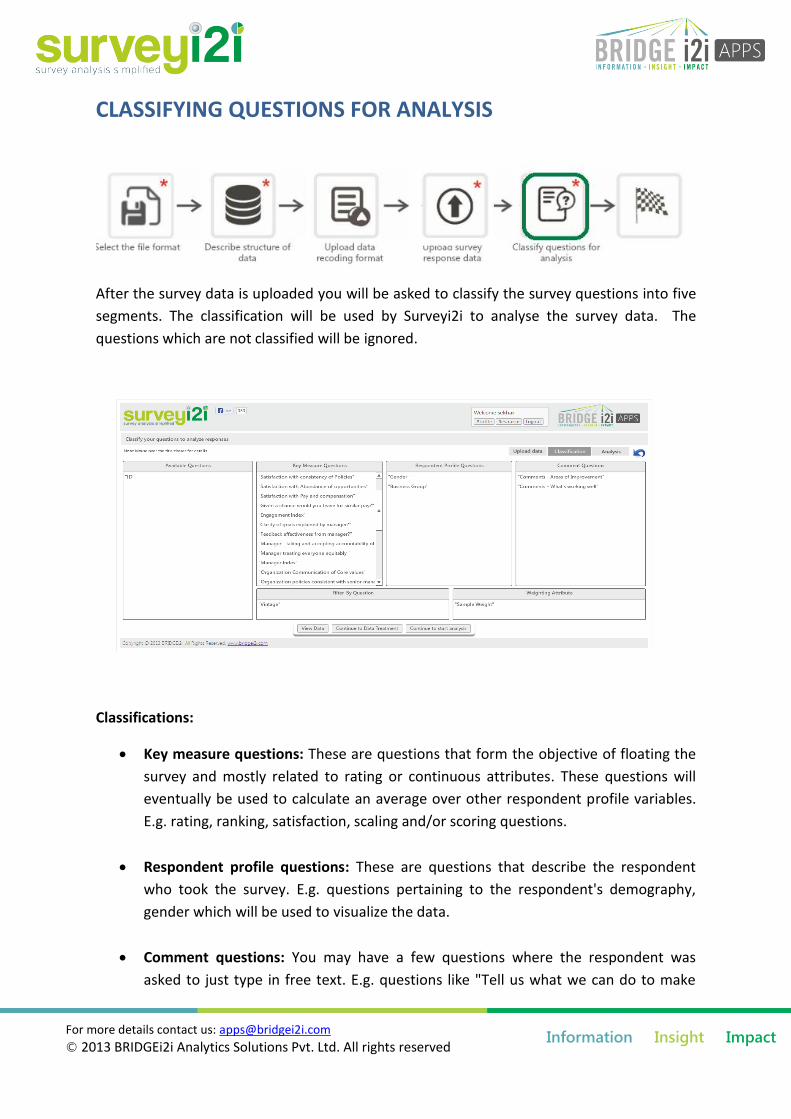
CLASSIFYING QUESTIONS FOR ANALYSIS
After the survey data is uploaded you will be asked to classify the survey questions into five
segments. The classification will be used by Surveyi2i to analyse the survey data. The
questions which are not classified will be ignored.
Classifications:
Key measure questions: These are questions that form the objective of floating the
survey and mostly related to rating or continuous attributes. These questions will
eventually be used to calculate an average over other respondent profile variables.
E.g. rating, ranking, satisfaction, scaling and/or scoring questions.
Respondent profile questions: These are questions that describe the respondent
who took the survey. E.g. questions pertaining to the respondent's demography,
gender which will be used to visualize the data.
Comment questions: You may have a few questions where the respondent was
asked to just type in free text. E.g. questions like "Tell us what we can do to make
For more details contact us: [email protected]
© 2013 BRIDGEi2i Analytics Solutions Pvt. Ltd. All rights reserved
Information Insight Impact
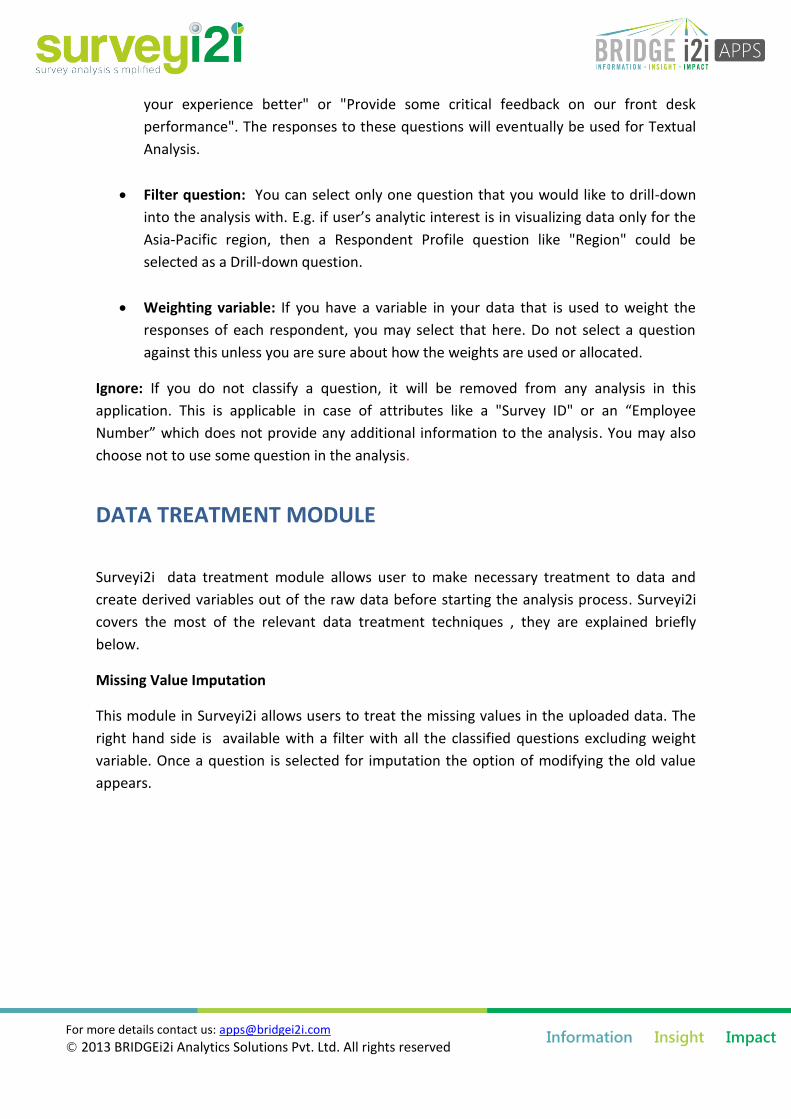
your experience better" or "Provide some critical feedback on our front desk
performance". The responses to these questions will eventually be used for Textual
Analysis.
Filter question: You can select only one question that you would like to drill-down
into the analysis with. E.g. if user’s analytic interest is in visualizing data only for the
Asia-Pacific region, then a Respondent Profile question like "Region" could be
selected as a Drill-down question.
Weighting variable: If you have a variable in your data that is used to weight the
responses of each respondent, you may select that here. Do not select a question
against this unless you are sure about how the weights are used or allocated.
Ignore: If you do not classify a question, it will be removed from any analysis in this
application. This is applicable in case of attributes like a "Survey ID" or an “Employee
Number” which does not provide any additional information to the analysis. You may also
choose not to use some question in the analysis.
DATA TREATMENT MODULE
Surveyi2i data treatment module allows user to make necessary treatment to data and
create derived variables out of the raw data before starting the analysis process. Surveyi2i
covers the most of the relevant data treatment techniques , they are explained briefly
below.
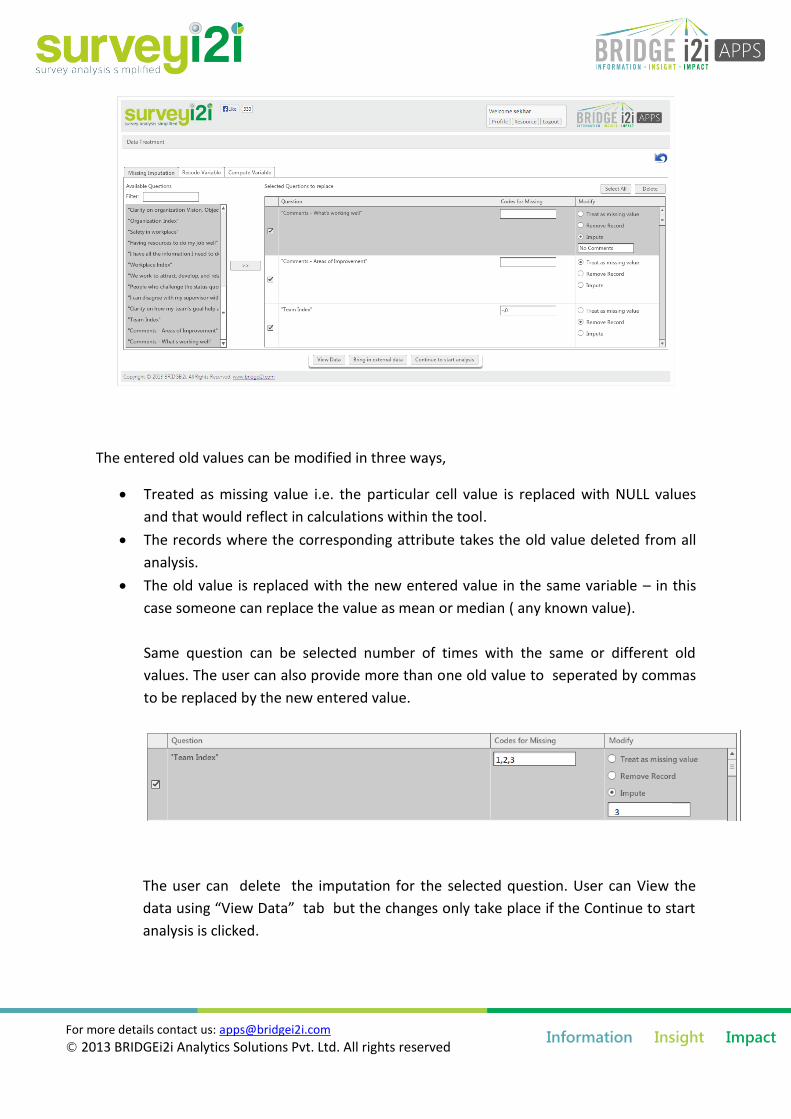
Missing Value Imputation
This module in Surveyi2i allows users to treat the missing values in the uploaded data. The
right hand side is available with a filter with all the classified questions excluding weight
variable. Once a question is selected for imputation the option of modifying the old value
appears.
For more details contact us: [email protected]
© 2013 BRIDGEi2i Analytics Solutions Pvt. Ltd. All rights reserved
Information Insight Impact
The entered old values can be modified in three ways,
Treated as missing value i.e. the particular cell value is replaced with NULL values
and that would reflect in calculations within the tool.
The records where the corresponding attribute takes the old value deleted from all
analysis.
The old value is replaced with the new entered value in the same variable – in this
case someone can replace the value as mean or median ( any known value).
Same question can be selected number of times with the same or different old
values. The user can also provide more than one old value to seperated by commas
to be replaced by the new entered value.
The user can delete the imputation for the selected question. User can View the
data using “View Data” tab but the changes only take place if the Continue to start
analysis is clicked.
For more details contact us: [email protected]
© 2013 BRIDGEi2i Analytics Solutions Pvt. Ltd. All rights reserved
Information Insight Impact
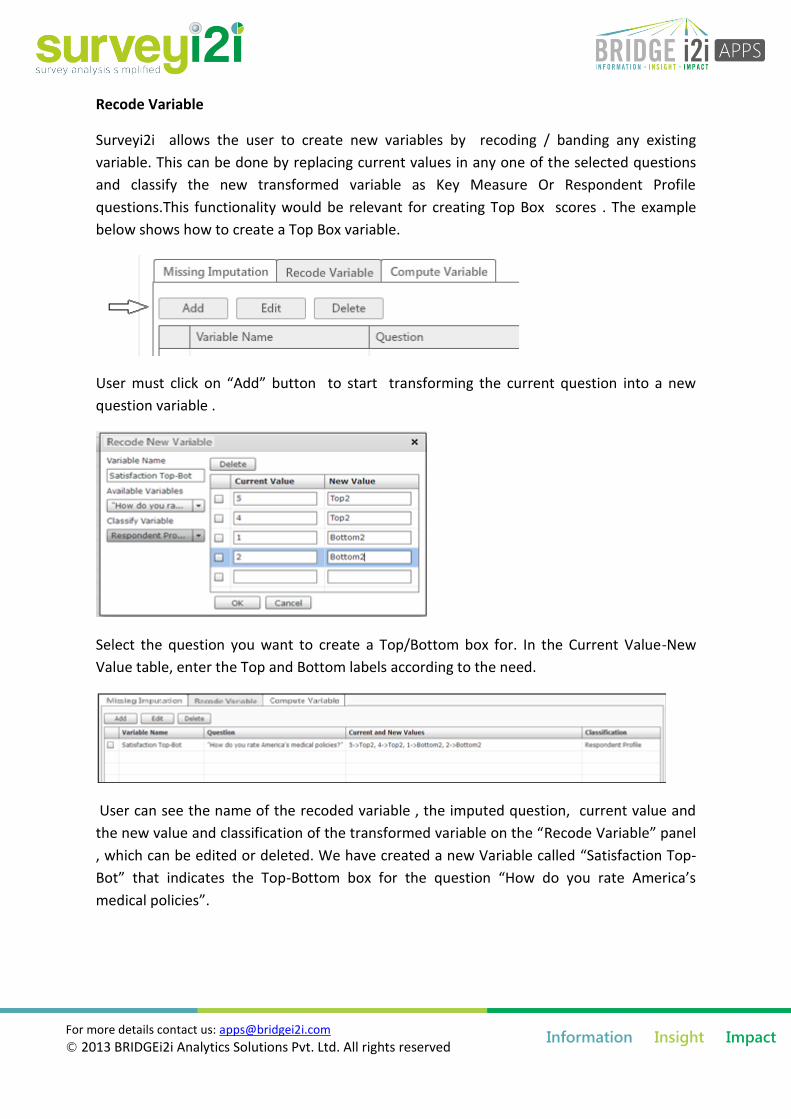
Recode Variable
Surveyi2i allows the user to create new variables by recoding / banding any existing
variable. This can be done by replacing current values in any one of the selected questions
and classify the new transformed variable as Key Measure Or Respondent Profile
questions.This functionality would be relevant for creating Top Box scores . The example
below shows how to create a Top Box variable.
User must click on “Add” button to start transforming the current question into a new
question variable .
Select the question you want to create a Top/Bottom box for. In the Current Value-New
Value table, enter the Top and Bottom labels according to the need.
User can see the name of the recoded variable , the imputed question, current value and
the new value and classification of the transformed variable on the “Recode Variable” panel
, which can be edited or deleted. We have created a new Variable called “Satisfaction Top-
Bot” that indicates the Top-Bottom box for the question “How do you rate America’s
medical policies”.
For more details contact us: [email protected]
© 2013 BRIDGEi2i Analytics Solutions Pvt. Ltd. All rights reserved
Information Insight Impact
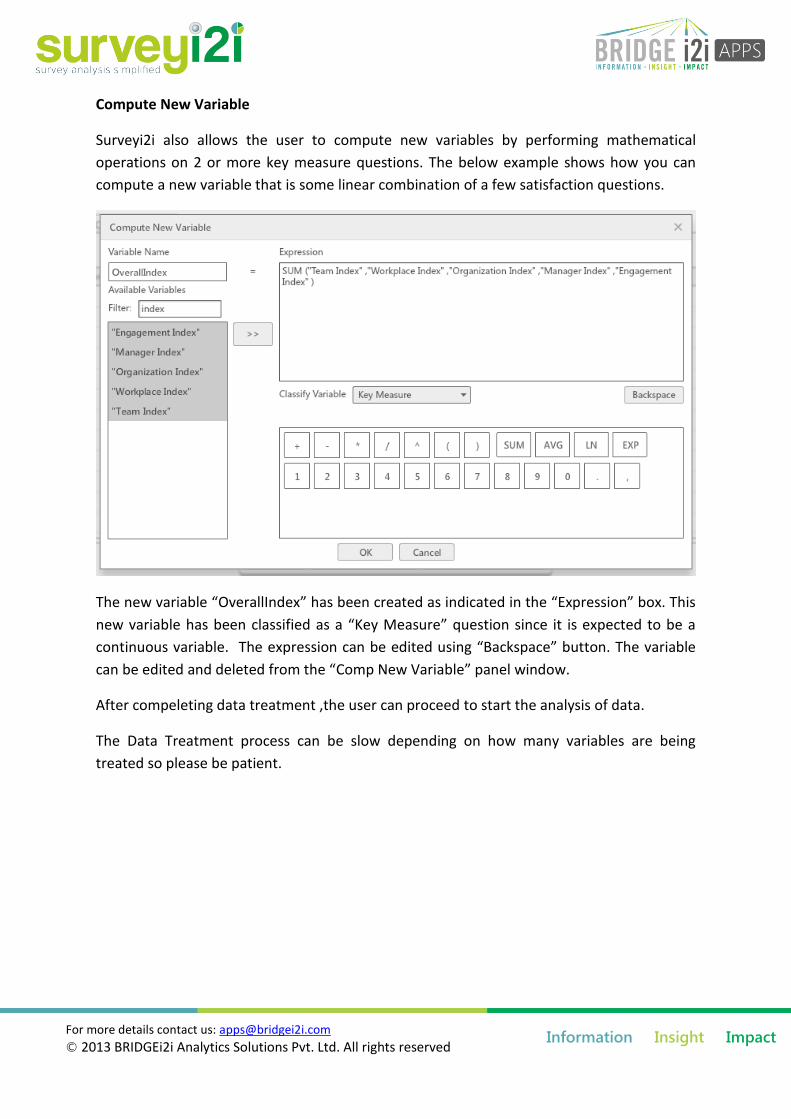
Compute New Variable
Surveyi2i also allows the user to compute new variables by performing mathematical
operations on 2 or more key measure questions. The below example shows how you can
compute a new variable that is some linear combination of a few satisfaction questions.
The new variable “OverallIndex” has been created as indicated in the “Expression” box. This
new variable has been classified as a “Key Measure” question since it is expected to be a
continuous variable. The expression can be edited using “Backspace” button. The variable
can be edited and deleted from the “Comp New Variable” panel window.
After compeleting data treatment ,the user can proceed to start the analysis of data.
The Data Treatment process can be slow depending on how many variables are being
treated so please be patient.
For more details contact us: [email protected]
© 2013 BRIDGEi2i Analytics Solutions Pvt. Ltd. All rights reserved
Information Insight Impact
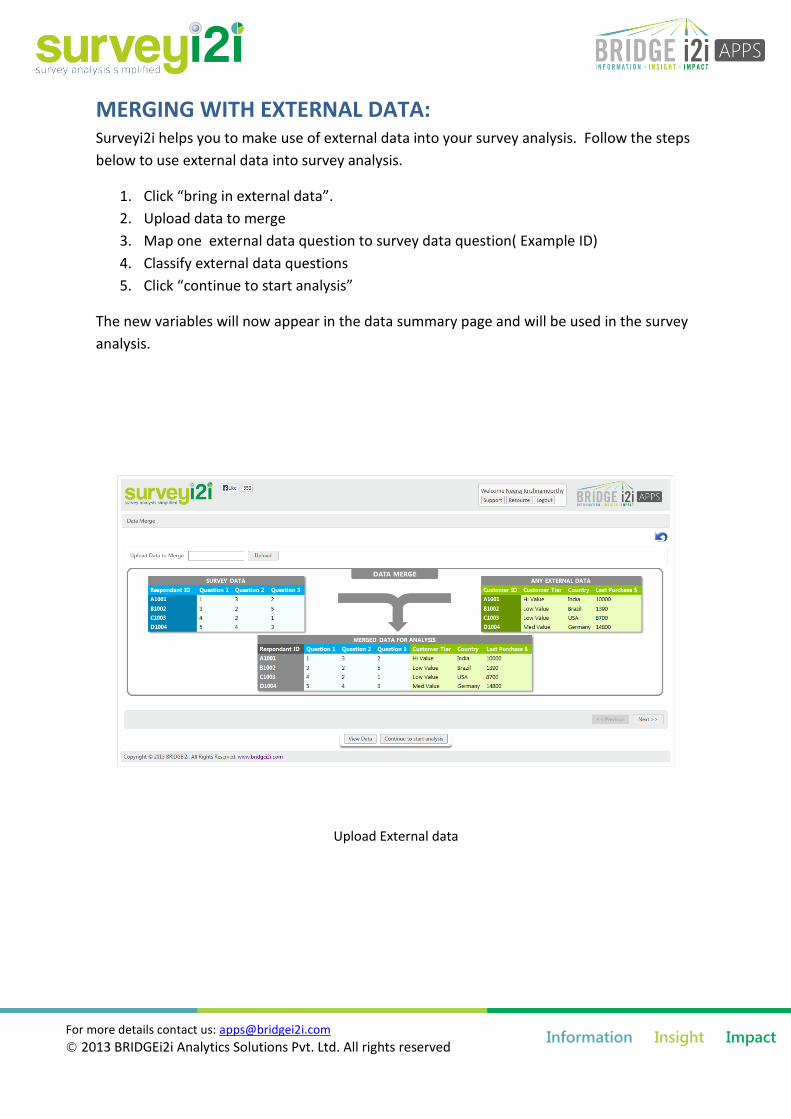
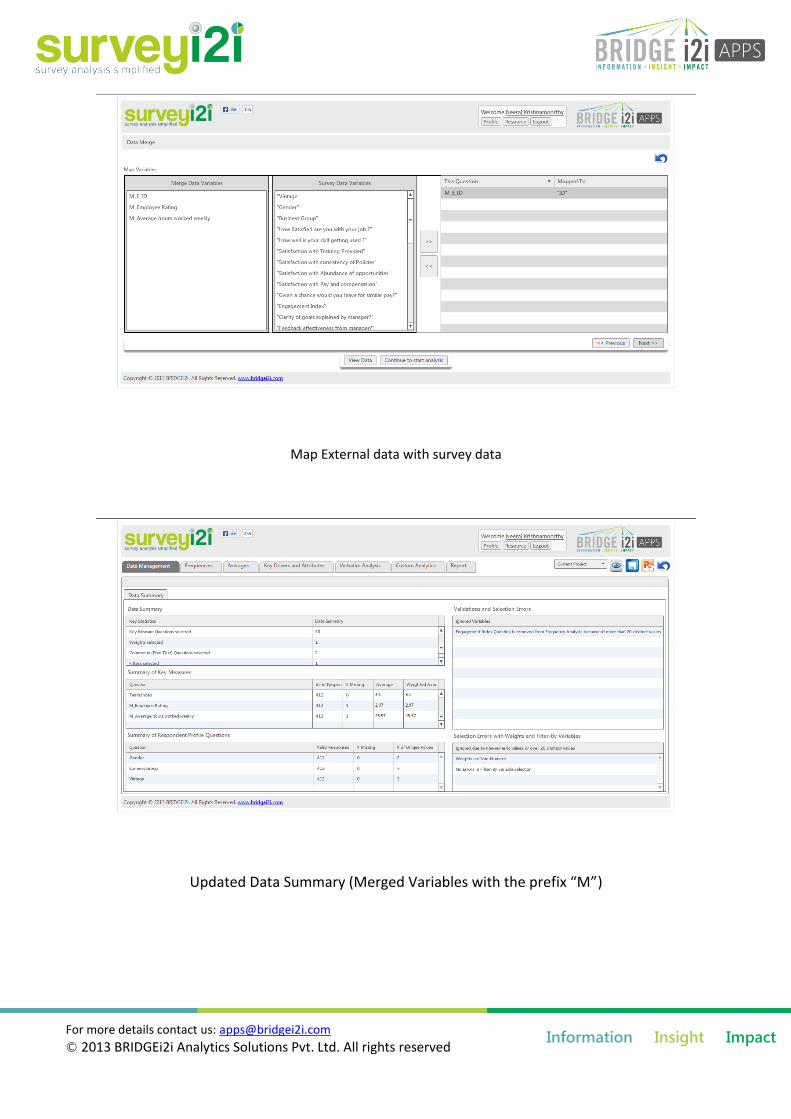
MERGING WITH EXTERNAL DATA: Surveyi2i helps you to make use of external data into your survey analysis. Follow the steps
below to use external data into survey analysis.
1. Click “bring in external data”.
2. Upload data to merge
3. Map one external data question to survey data question( Example ID)
4. Classify external data questions
5. Click “continue to start analysis”
The new variables will now appear in the data summary page and will be used in the survey
analysis.
Upload External data
For more details contact us: [email protected]
© 2013 BRIDGEi2i Analytics Solutions Pvt. Ltd. All rights reserved
Information Insight Impact
Map External data with survey data
Updated Data Summary (Merged Variables with the prefix “M”)
For more details contact us: [email protected]
© 2013 BRIDGEi2i Analytics Solutions Pvt. Ltd. All rights reserved
Information Insight Impact
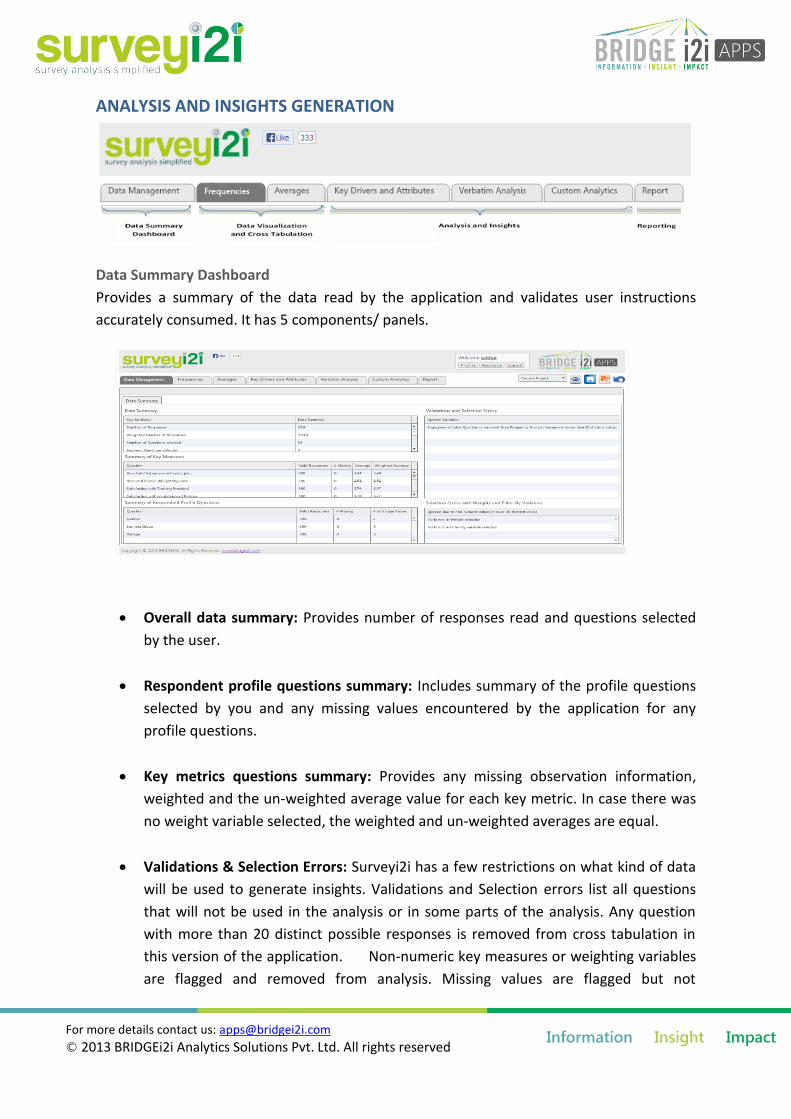
ANALYSIS AND INSIGHTS GENERATION
Data Summary Dashboard
Provides a summary of the data read by the application and validates user instructions
accurately consumed. It has 5 components/ panels.
Overall data summary: Provides number of responses read and questions selected
by the user.
Respondent profile questions summary: Includes summary of the profile questions
selected by you and any missing values encountered by the application for any
profile questions.
Key metrics questions summary: Provides any missing observation information,
weighted and the un-weighted average value for each key metric. In case there was
no weight variable selected, the weighted and un-weighted averages are equal.
Validations & Selection Errors: Surveyi2i has a few restrictions on what kind of data
will be used to generate insights. Validations and Selection errors list all questions
that will not be used in the analysis or in some parts of the analysis. Any question
with more than 20 distinct possible responses is removed from cross tabulation in
this version of the application. Non-numeric key measures or weighting variables
are flagged and removed from analysis. Missing values are flagged but not
For more details contact us: [email protected]
© 2013 BRIDGEi2i Analytics Solutions Pvt. Ltd. All rights reserved
Information Insight Impact
necessarily removed from the analysis.
Errors with Weights or Filter Variables: The weights in a survey data must not have
missing values or any non-numeric values. If such a record is encountered, the
weight variable is removed from the ensuing analysis. The Filter Variable must have
less than 20 levels to be used in the analysis.
Once the user is satisfied with the results of the upload process and either chooses to
correct or ignore the validation errors flagged by Surveyi2i, they may proceed to the Cross-
Tabulation and Reports tabs.
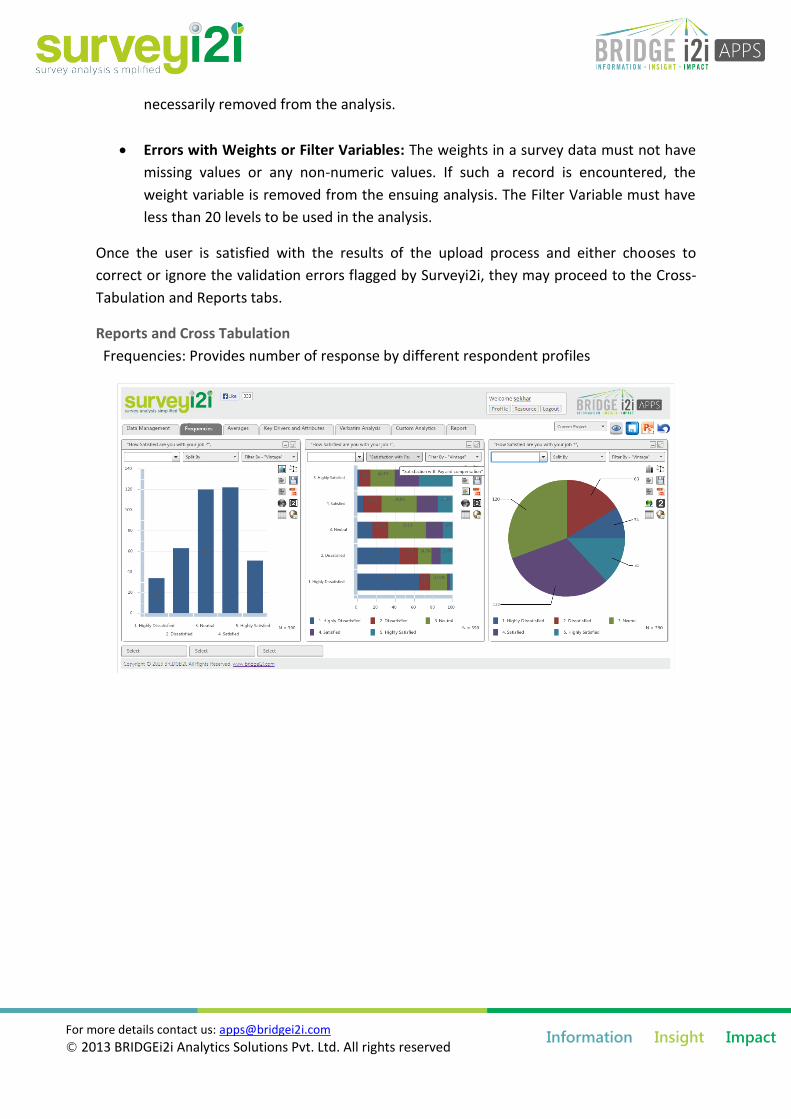
Reports and Cross Tabulation
Frequencies: Provides number of response by different respondent profiles
For more details contact us: [email protected]
© 2013 BRIDGEi2i Analytics Solutions Pvt. Ltd. All rights reserved
Information Insight Impact
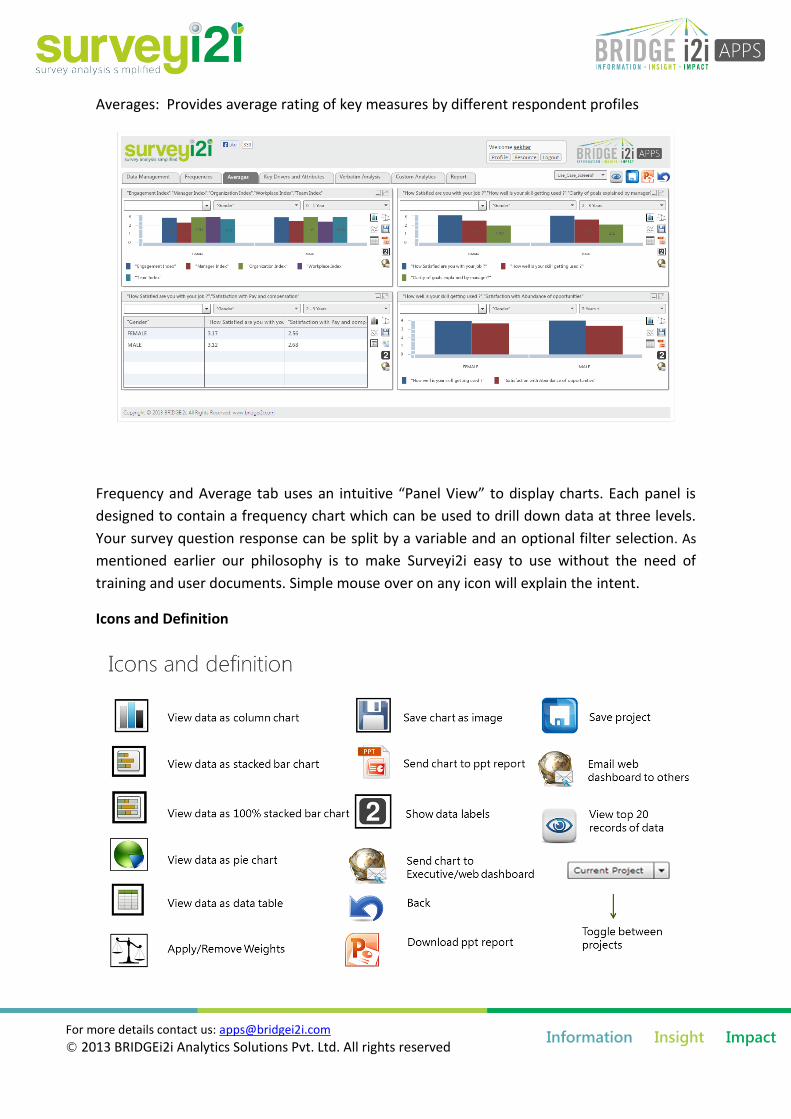
Averages: Provides average rating of key measures by different respondent profiles
Frequency and Average tab uses an intuitive “Panel View” to display charts. Each panel is
designed to contain a frequency chart which can be used to drill down data at three levels.
Your survey question response can be split by a variable and an optional filter selection. As
mentioned earlier our philosophy is to make Surveyi2i easy to use without the need of
training and user documents. Simple mouse over on any icon will explain the intent.
Icons and Definition
For more details contact us: [email protected]
© 2013 BRIDGEi2i Analytics Solutions Pvt. Ltd. All rights reserved
Information Insight Impact
After the Data Visualization stage, the user may proceed to some advanced analysis of the
data. AT this stage, the user is expected to have a good understanding of the data and a
vision of what they want to accomplish in their analysis and the various hypothesis they
want to test.
Analysis and Insights
The Analysis and Insights module comprises of 3 broad areas
Key Drivers and Attributes
Verbatim Analysis
Custom Analysis
Key Driver and Attributes
Key Driver Analysis
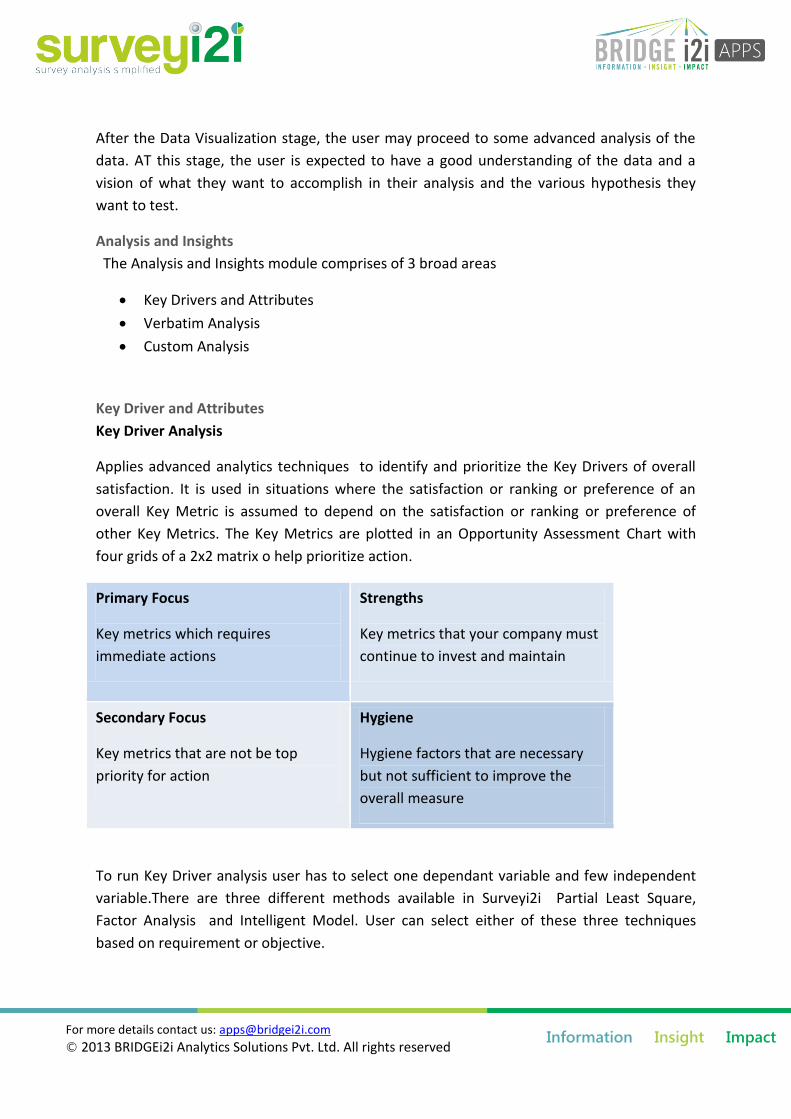
Applies advanced analytics techniques to identify and prioritize the Key Drivers of overall
satisfaction. It is used in situations where the satisfaction or ranking or preference of an
overall Key Metric is assumed to depend on the satisfaction or ranking or preference of
other Key Metrics. The Key Metrics are plotted in an Opportunity Assessment Chart with
four grids of a 2x2 matrix o help prioritize action.
Primary Focus
Key metrics which requires
immediate actions
Strengths
Key metrics that your company must
continue to invest and maintain
Secondary Focus
Key metrics that are not be top
priority for action
Hygiene
Hygiene factors that are necessary
but not sufficient to improve the
overall measure
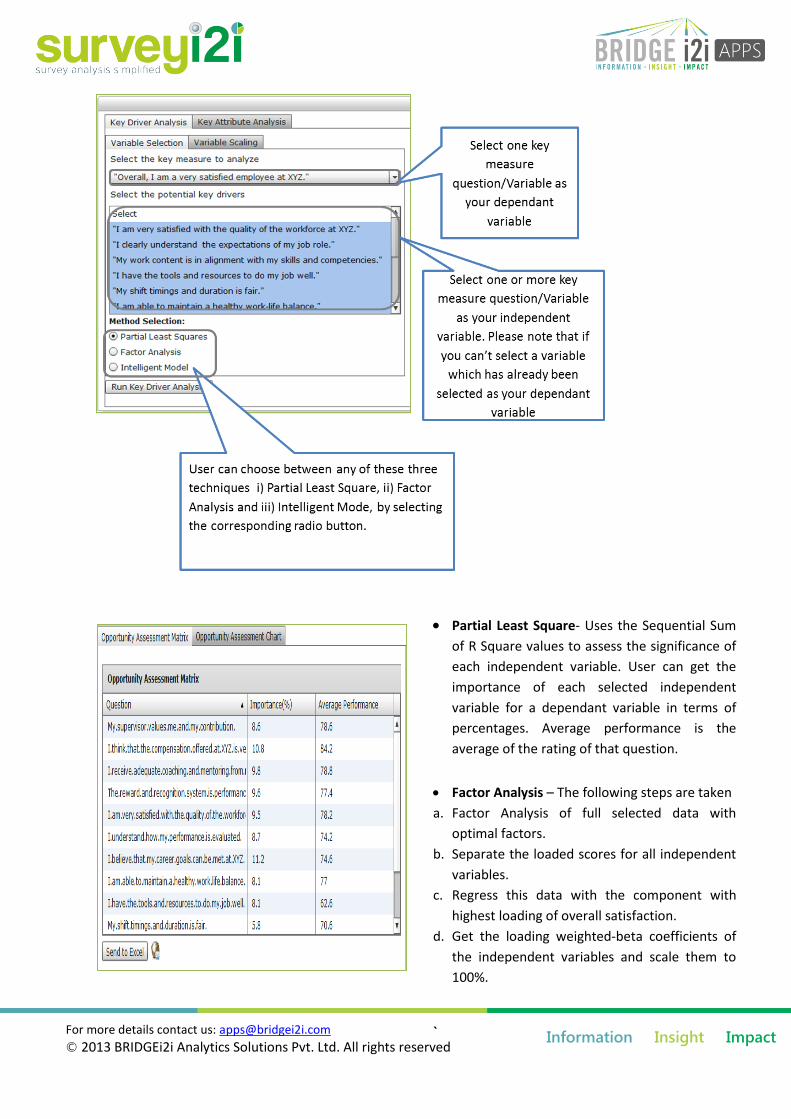
To run Key Driver analysis user has to select one dependant variable and few independent
variable.There are three different methods available in Surveyi2i Partial Least Square,
Factor Analysis and Intelligent Model. User can select either of these three techniques
based on requirement or objective.
For more details contact us: [email protected]
© 2013 BRIDGEi2i Analytics Solutions Pvt. Ltd. All rights reserved
Information Insight Impact
Partial Least Square- Uses the Sequential Sum
of R Square values to assess the significance of
each independent variable. User can get the
importance of each selected independent
variable for a dependant variable in terms of
percentages. Average performance is the
average of the rating of that question.
Factor Analysis – The following steps are taken
a. Factor Analysis of full selected data with
optimal factors.
b. Separate the loaded scores for all independent
variables.
c. Regress this data with the component with
highest loading of overall satisfaction.
d. Get the loading weighted-beta coefficients of
the independent variables and scale them to
100%.
`
For more details contact us: [email protected]
© 2013 BRIDGEi2i Analytics Solutions Pvt. Ltd. All rights reserved
Information Insight Impact
Intelligent Model – The Intelligent Model is a machine learning algorithm that learns the
regression coefficent based on multiple regression trees. It accounts for mixed effects.
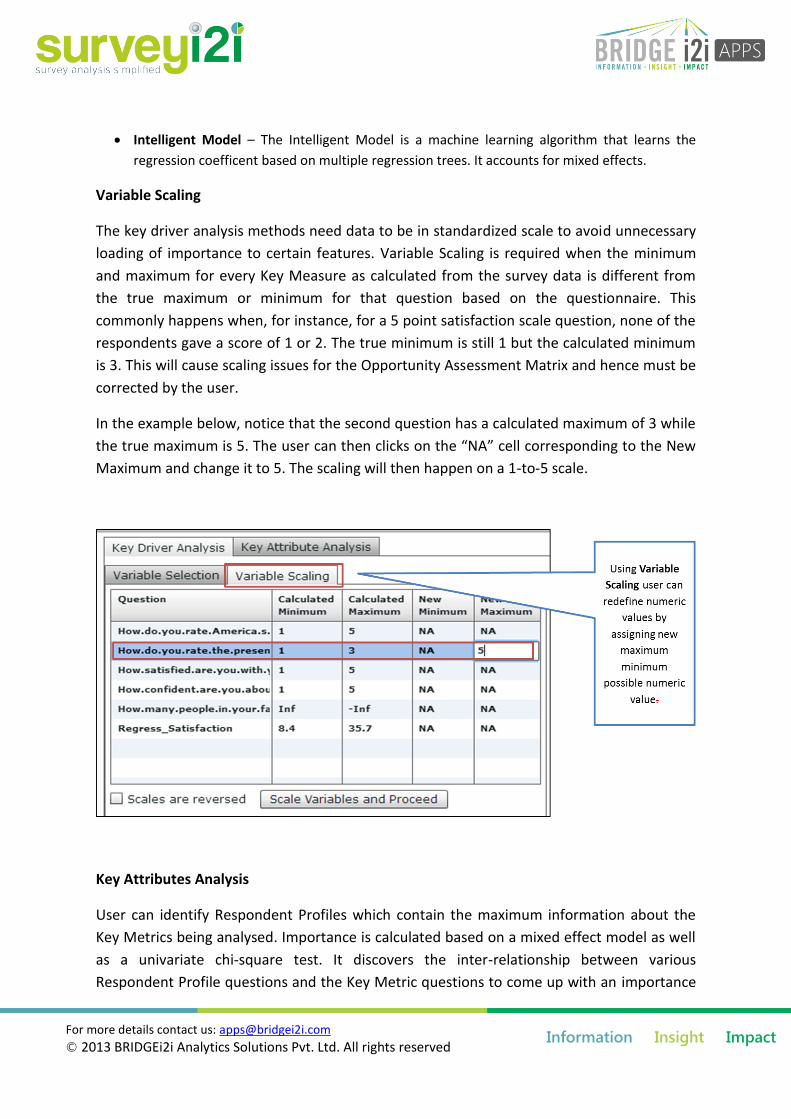
Variable Scaling
The key driver analysis methods need data to be in standardized scale to avoid unnecessary
loading of importance to certain features. Variable Scaling is required when the minimum
and maximum for every Key Measure as calculated from the survey data is different from
the true maximum or minimum for that question based on the questionnaire. This
commonly happens when, for instance, for a 5 point satisfaction scale question, none of the
respondents gave a score of 1 or 2. The true minimum is still 1 but the calculated minimum
is 3. This will cause scaling issues for the Opportunity Assessment Matrix and hence must be
corrected by the user.
In the example below, notice that the second question has a calculated maximum of 3 while
the true maximum is 5. The user can then clicks on the “NA” cell corresponding to the New
Maximum and change it to 5. The scaling will then happen on a 1-to-5 scale.
Key Attributes Analysis
User can identify Respondent Profiles which contain the maximum information about the
Key Metrics being analysed. Importance is calculated based on a mixed effect model as well
as a univariate chi-square test. It discovers the inter-relationship between various
Respondent Profile questions and the Key Metric questions to come up with an importance
For more details contact us: [email protected]
© 2013 BRIDGEi2i Analytics Solutions Pvt. Ltd. All rights reserved
Information Insight Impact
score.
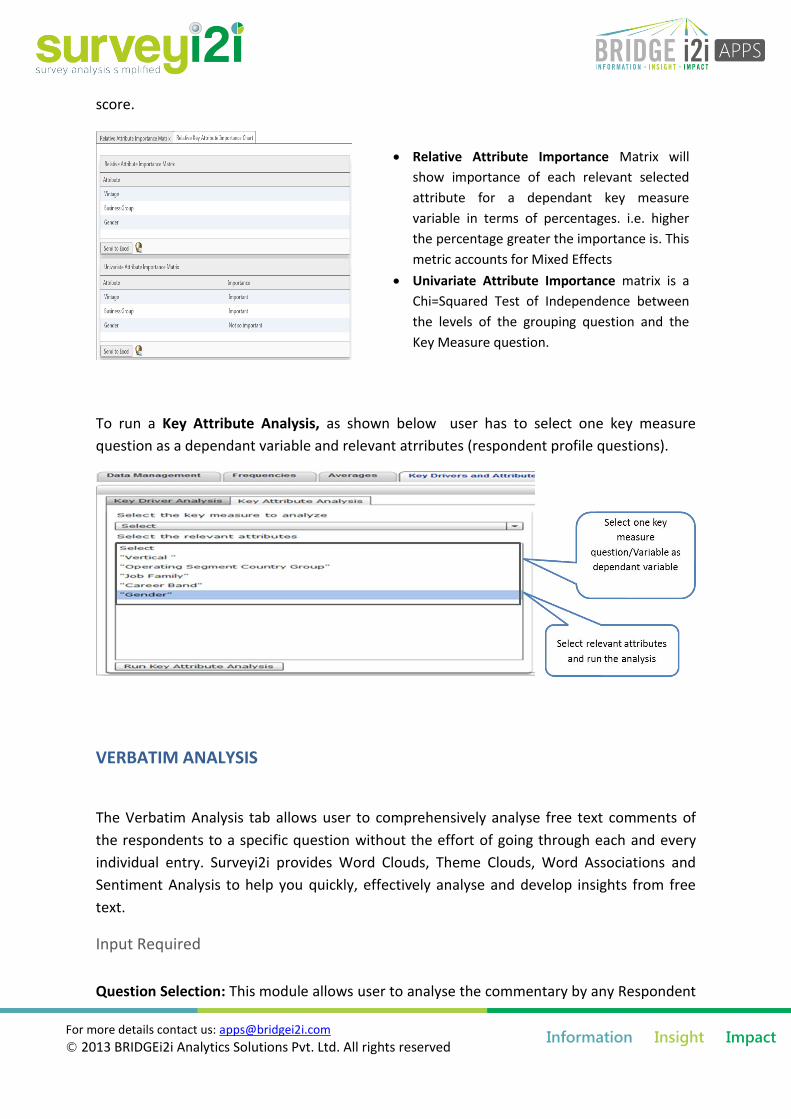
To run a Key Attribute Analysis, as shown below user has to select one key measure
question as a dependant variable and relevant atrributes (respondent profile questions).
VERBATIM ANALYSIS
The Verbatim Analysis tab allows user to comprehensively analyse free text comments of
the respondents to a specific question without the effort of going through each and every
individual entry. Surveyi2i provides Word Clouds, Theme Clouds, Word Associations and
Sentiment Analysis to help you quickly, effectively analyse and develop insights from free
text.
Input Required
Question Selection: This module allows user to analyse the commentary by any Respondent
Relative Attribute Importance Matrix will
show importance of each relevant selected
attribute for a dependant key measure
variable in terms of percentages. i.e. higher
the percentage greater the importance is. This
metric accounts for Mixed Effects
Univariate Attribute Importance matrix is a
Chi=Squared Test of Independence between
the levels of the grouping question and the
Key Measure question.
For more details contact us: [email protected]
© 2013 BRIDGEi2i Analytics Solutions Pvt. Ltd. All rights reserved
Information Insight Impact
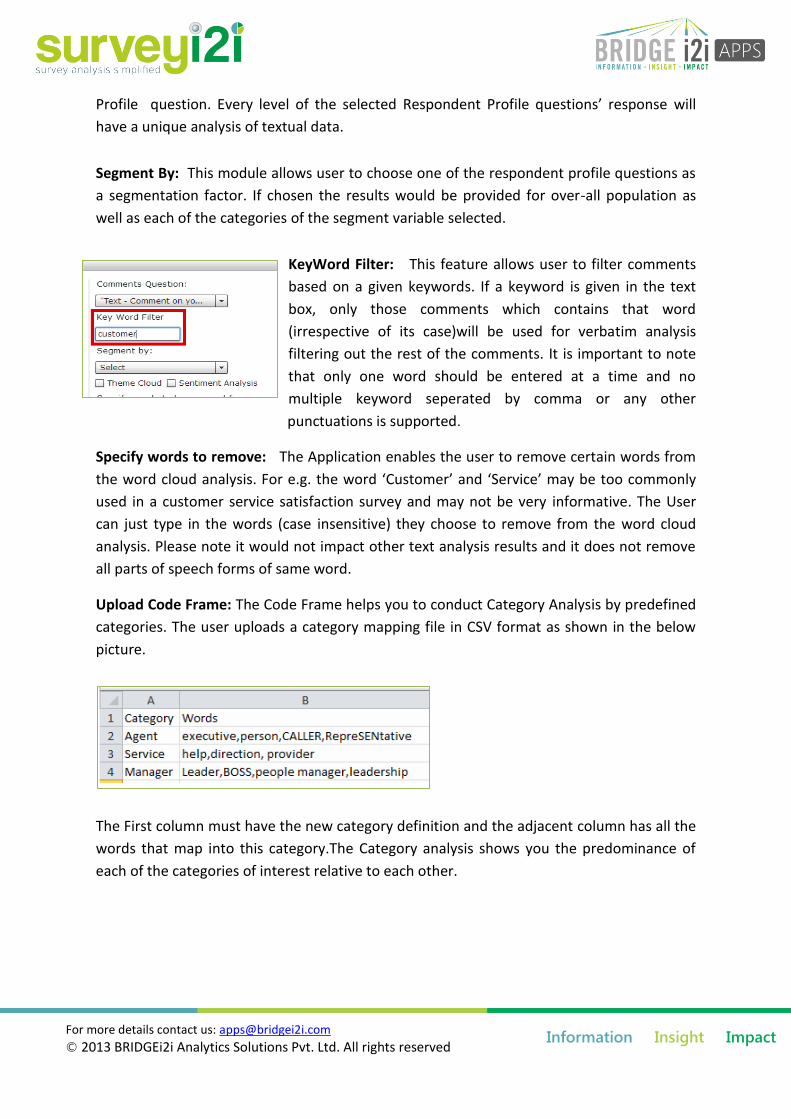
Profile question. Every level of the selected Respondent Profile questions’ response will
have a unique analysis of textual data.
Segment By: This module allows user to choose one of the respondent profile questions as
a segmentation factor. If chosen the results would be provided for over-all population as
well as each of the categories of the segment variable selected.
KeyWord Filter: This feature allows user to filter comments
based on a given keywords. If a keyword is given in the text
box, only those comments which contains that word
(irrespective of its case)will be used for verbatim analysis
filtering out the rest of the comments. It is important to note
that only one word should be entered at a time and no
multiple keyword seperated by comma or any other
punctuations is supported.
Specify words to remove: The Application enables the user to remove certain words from
the word cloud analysis. For e.g. the word ‘Customer’ and ‘Service’ may be too commonly
used in a customer service satisfaction survey and may not be very informative. The User
can just type in the words (case insensitive) they choose to remove from the word cloud
analysis. Please note it would not impact other text analysis results and it does not remove
all parts of speech forms of same word.
Upload Code Frame: The Code Frame helps you to conduct Category Analysis by predefined
categories. The user uploads a category mapping file in CSV format as shown in the below
picture.
The First column must have the new category definition and the adjacent column has all the
words that map into this category.The Category analysis shows you the predominance of
each of the categories of interest relative to each other.
For more details contact us: [email protected]
© 2013 BRIDGEi2i Analytics Solutions Pvt. Ltd. All rights reserved
Information Insight Impact
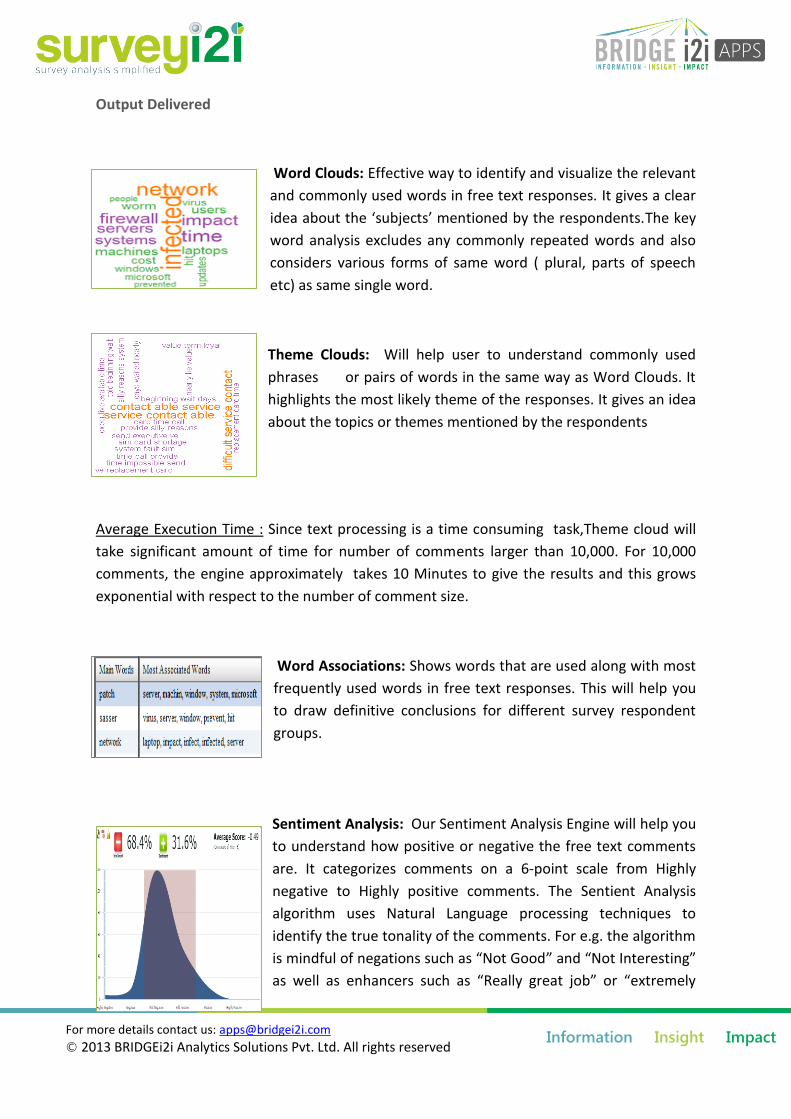
Output Delivered
Word Clouds: Effective way to identify and visualize the relevant
and commonly used words in free text responses. It gives a clear
idea about the ‘subjects’ mentioned by the respondents.The key
word analysis excludes any commonly repeated words and also
considers various forms of same word ( plural, parts of speech
etc) as same single word.
Theme Clouds: Will help user to understand commonly used
phrases or pairs of words in the same way as Word Clouds. It
highlights the most likely theme of the responses. It gives an idea
about the topics or themes mentioned by the respondents
Average Execution Time : Since text processing is a time consuming task,Theme cloud will
take significant amount of time for number of comments larger than 10,000. For 10,000
comments, the engine approximately takes 10 Minutes to give the results and this grows
exponential with respect to the number of comment size.
Word Associations: Shows words that are used along with most
frequently used words in free text responses. This will help you
to draw definitive conclusions for different survey respondent
groups.
Sentiment Analysis: Our Sentiment Analysis Engine will help you
to understand how positive or negative the free text comments
are. It categorizes comments on a 6-point scale from Highly
negative to Highly positive comments. The Sentient Analysis
algorithm uses Natural Language processing techniques to
identify the true tonality of the comments. For e.g. the algorithm
is mindful of negations such as “Not Good” and “Not Interesting”
as well as enhancers such as “Really great job” or “extremely
For more details contact us: [email protected]
© 2013 BRIDGEi2i Analytics Solutions Pvt. Ltd. All rights reserved
Information Insight Impact
delighted” and weights their sentiments in accordance. The final output is a sentiment
distribution across the 6 point scale and a frequency-sentiment weighted Positive or
Negative score. If the distribution is left skewed, it indicates a negative sentiment and the
user can see the Negativity from the score and vice versa. We also provide a overall
frequency-weighted scroe on the same 6 point scale although this metric does not take the
degree of positivity or negativity into account.
Average Execution Time : Sentiment Engine is integration of many text processing sub-
modules and hence,this is the most time consuming task.It will take significantely large
amount of time for number of comments larger than 10,000. For 10,000 comments, our
engine might even take 15 Minutes to give the results and the time increases exponentially
with respect to the number of comments.
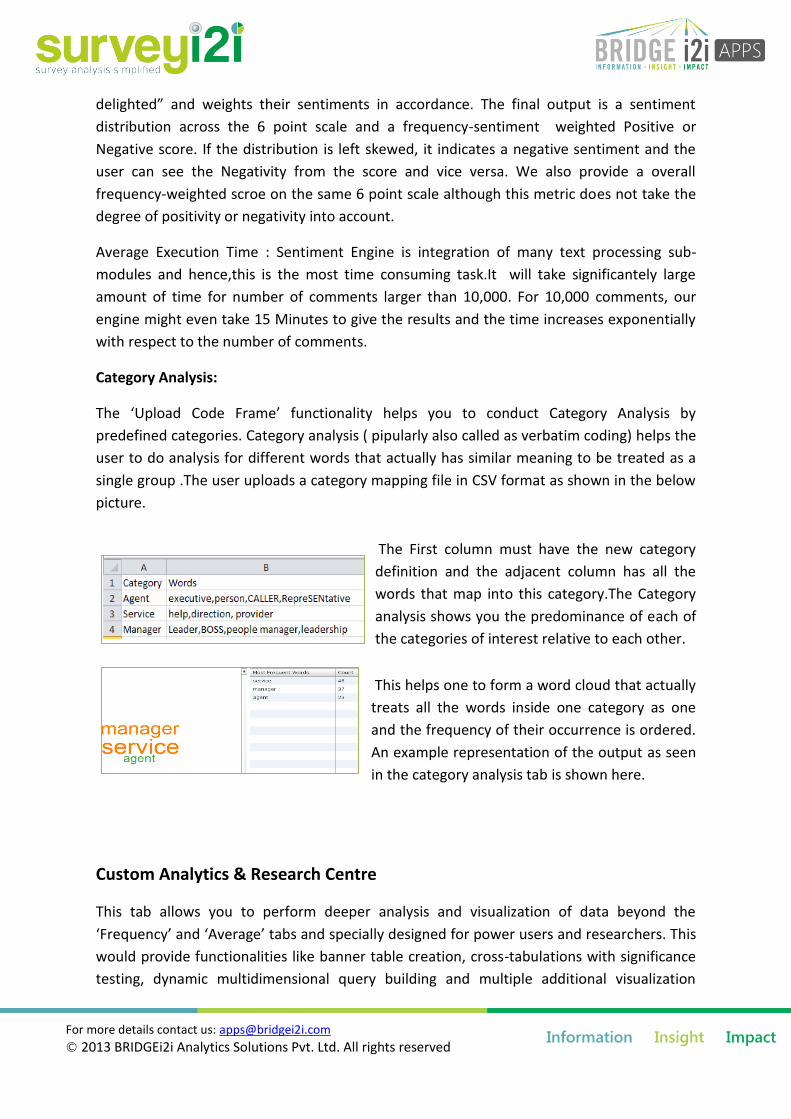
Category Analysis:
The ‘Upload Code Frame’ functionality helps you to conduct Category Analysis by
predefined categories. Category analysis ( pipularly also called as verbatim coding) helps the
user to do analysis for different words that actually has similar meaning to be treated as a
single group .The user uploads a category mapping file in CSV format as shown in the below
picture.
The First column must have the new category
definition and the adjacent column has all the
words that map into this category.The Category
analysis shows you the predominance of each of
the categories of interest relative to each other.
This helps one to form a word cloud that actually
treats all the words inside one category as one
and the frequency of their occurrence is ordered.
An example representation of the output as seen
in the category analysis tab is shown here.
Custom Analytics & Research Centre
This tab allows you to perform deeper analysis and visualization of data beyond the
‘Frequency’ and ‘Average’ tabs and specially designed for power users and researchers. This
would provide functionalities like banner table creation, cross-tabulations with significance
testing, dynamic multidimensional query building and multiple additional visualization
For more details contact us: [email protected]
© 2013 BRIDGEi2i Analytics Solutions Pvt. Ltd. All rights reserved
Information Insight Impact
options.
CUSTOM ANALYTICS
While the frequency and averages tab of Surveyi2i provides easy, fast cross-tabulation and
visualization options, an advanced user and researcher might find that restrictive in terms of
ability to drill down further into the data and run custom analysis and significance testing.
Custom Analytics tab of Surveyi2i provides a way for the user to not only create custom
queries through easy front end for deeper insights, but also provide ability to create
detailed banner table along with statistical significance tests .
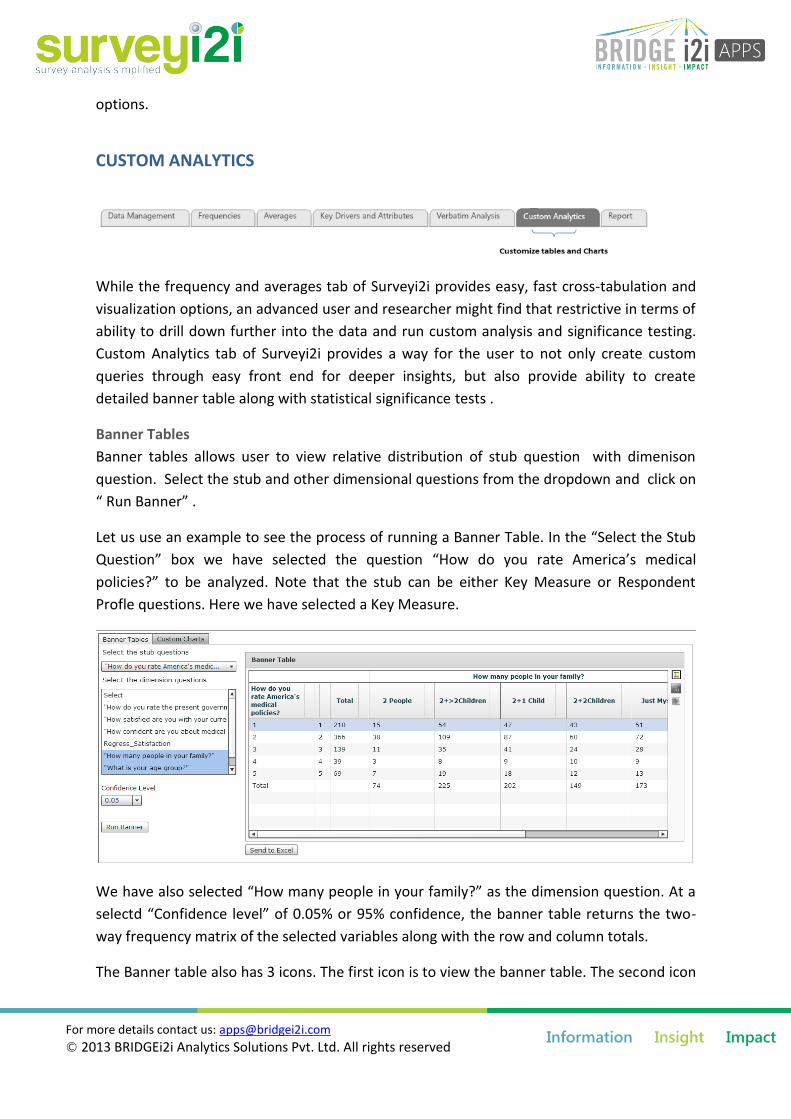
Banner Tables
Banner tables allows user to view relative distribution of stub question with dimenison
question. Select the stub and other dimensional questions from the dropdown and click on
“ Run Banner” .
Let us use an example to see the process of running a Banner Table. In the “Select the Stub
Question” box we have selected the question “How do you rate America’s medical
policies?” to be analyzed. Note that the stub can be either Key Measure or Respondent
Profle questions. Here we have selected a Key Measure.
We have also selected “How many people in your family?” as the dimension question. At a
selectd “Confidence level” of 0.05% or 95% confidence, the banner table returns the two-
way frequency matrix of the selected variables along with the row and column totals.
The Banner table also has 3 icons. The first icon is to view the banner table. The second icon
For more details contact us: [email protected]
© 2013 BRIDGEi2i Analytics Solutions Pvt. Ltd. All rights reserved
Information Insight Impact
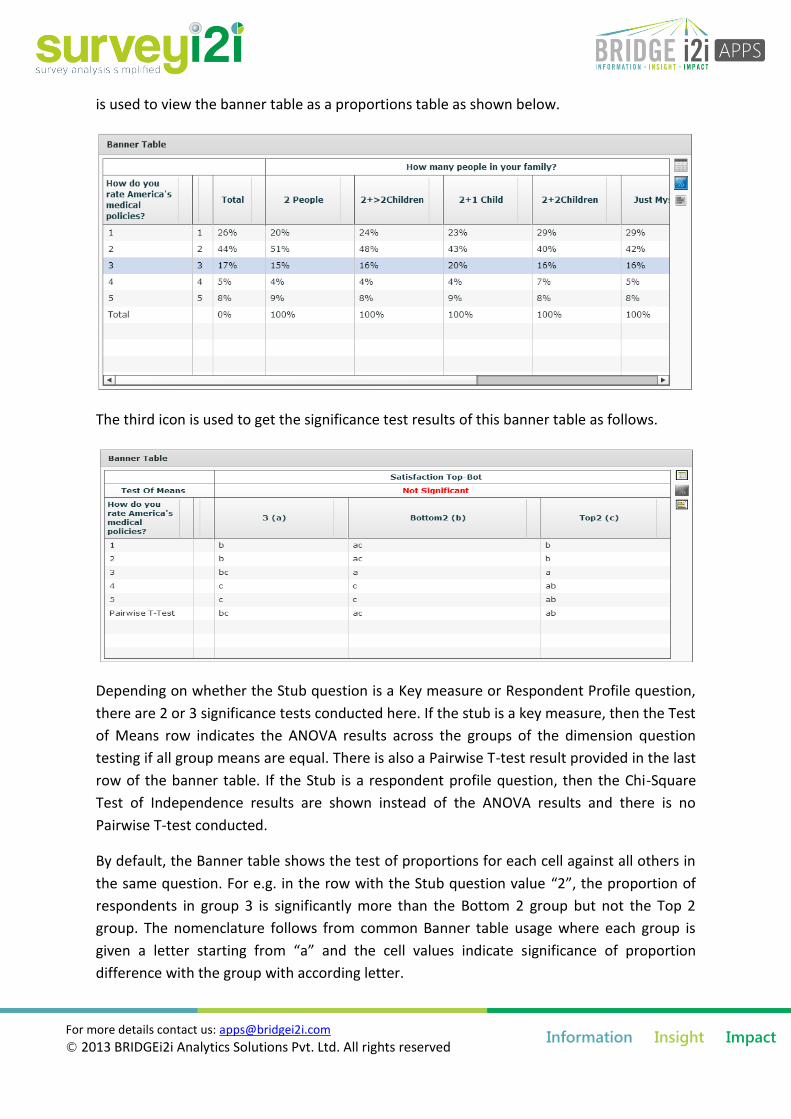
is used to view the banner table as a proportions table as shown below.
The third icon is used to get the significance test results of this banner table as follows.
Depending on whether the Stub question is a Key measure or Respondent Profile question,
there are 2 or 3 significance tests conducted here. If the stub is a key measure, then the Test
of Means row indicates the ANOVA results across the groups of the dimension question
testing if all group means are equal. There is also a Pairwise T-test result provided in the last
row of the banner table. If the Stub is a respondent profile question, then the Chi-Square
Test of Independence results are shown instead of the ANOVA results and there is no
Pairwise T-test conducted.
By default, the Banner table shows the test of proportions for each cell against all others in
the same question. For e.g. in the row with the Stub question value “2”, the proportion of
respondents in group 3 is significantly more than the Bottom 2 group but not the Top 2
group. The nomenclature follows from common Banner table usage where each group is
given a letter starting from “a” and the cell values indicate significance of proportion
difference with the group with according letter.

For more details contact us: [email protected]
© 2013 BRIDGEi2i Analytics Solutions Pvt. Ltd. All rights reserved
Information Insight Impact
For more details contact us: [email protected]
© 2013 BRIDGEi2i Analytics Solutions Pvt. Ltd. All rights reserved
Information Insight Impact
Custom Charts
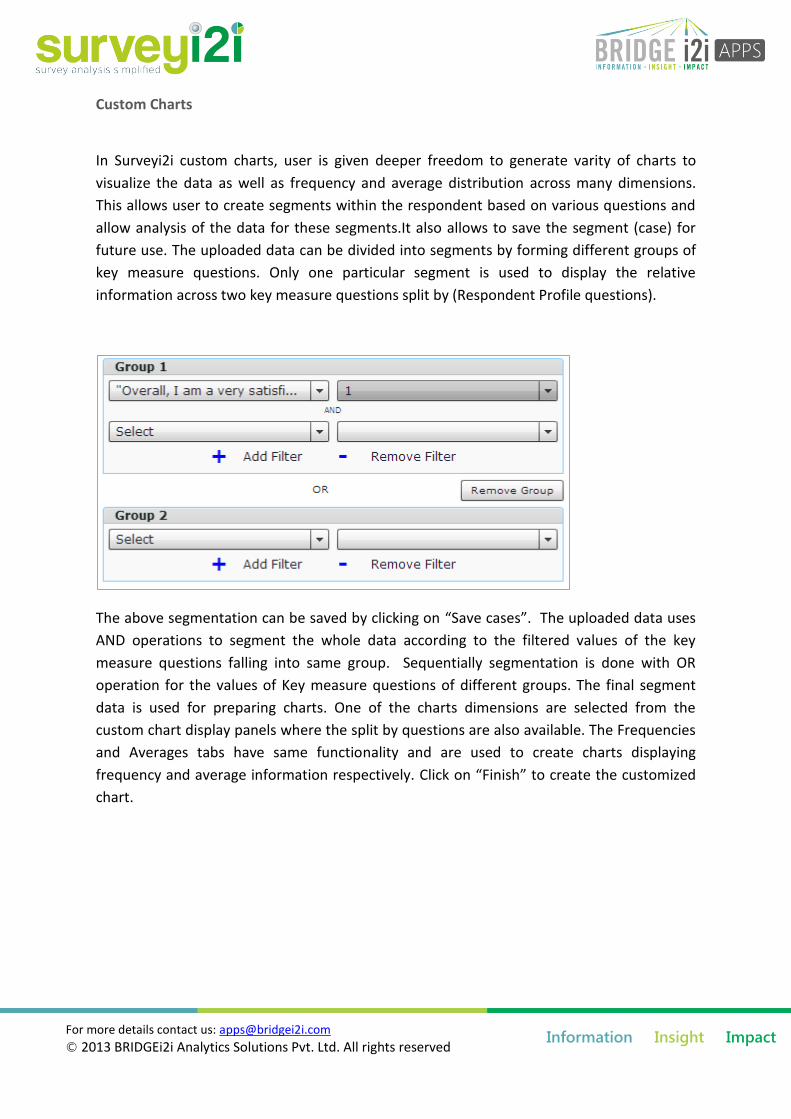
In Surveyi2i custom charts, user is given deeper freedom to generate varity of charts to
visualize the data as well as frequency and average distribution across many dimensions.
This allows user to create segments within the respondent based on various questions and
allow analysis of the data for these segments.It also allows to save the segment (case) for
future use. The uploaded data can be divided into segments by forming different groups of
key measure questions. Only one particular segment is used to display the relative
information across two key measure questions split by (Respondent Profile questions).
The above segmentation can be saved by clicking on “Save cases”. The uploaded data uses
AND operations to segment the whole data according to the filtered values of the key
measure questions falling into same group. Sequentially segmentation is done with OR
operation for the values of Key measure questions of different groups. The final segment
data is used for preparing charts. One of the charts dimensions are selected from the
custom chart display panels where the split by questions are also available. The Frequencies
and Averages tabs have same functionality and are used to create charts displaying
frequency and average information respectively. Click on “Finish” to create the customized
chart.

For more details contact us: [email protected]
© 2013 BRIDGEi2i Analytics Solutions Pvt. Ltd. All rights reserved
Information Insight Impact
Frequency
In above example a group is created by selecting few values from the two Key measure
questions “Overall, I am a very satisfied employee at XYZ.” and “I am very satisfied with the
quality of the workforce at XYZ.” A frequency chart is created in frequency tab by choosing
another key measure question” I clearly understand the expectations of my job role.” A
respondent profile question “Job Family” is selected as the split by question. This
segmentation is saved as “Case 1”. A bar chart is created after clicking the finish button.
There are only three values 3, 4, and 5 in the “I clearly understand the expectations of my
job role.” question after the data is segmented by group 1. The frequency distribution of
these values is shown over each levels of Job family question. Data labels are applied by
clicking on data label icon available on left side of the panel. A pop up window appears
when the mouse is taken to the top of each bar chart in [Level of Split by question, level of
Key measure question.
Format
Different chart types can be selected by clicking on icons on left of
display panel window. The chart can be shown as Bar chart, stacked
chart, Clustered chart, Line chart and Bubble chart. The icon also has an
option of viewing the data table for the chart. User can apply
corresponding weights, if any, and also apply data labels to the charts.
For more details contact us: [email protected]
© 2013 BRIDGEi2i Analytics Solutions Pvt. Ltd. All rights reserved
Information Insight Impact
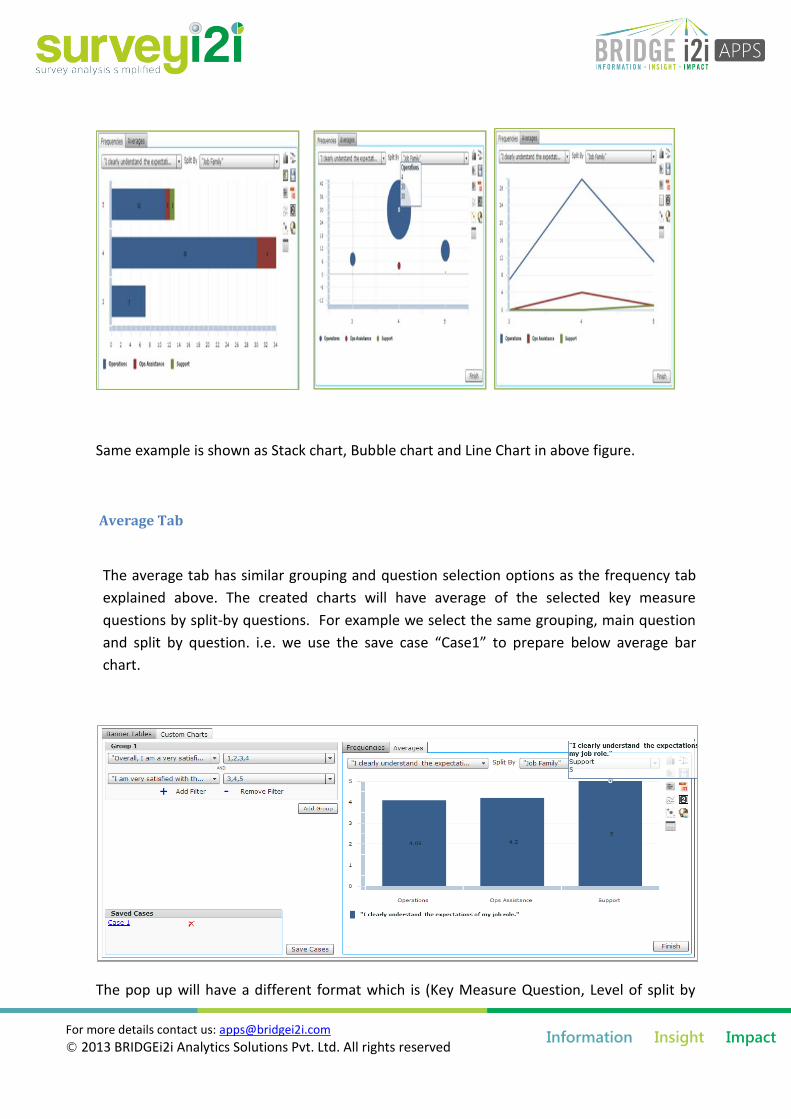
Same example is shown as Stack chart, Bubble chart and Line Chart in above figure.
Average Tab
The average tab has similar grouping and question selection options as the frequency tab
explained above. The created charts will have average of the selected key measure
questions by split-by questions. For example we select the same grouping, main question
and split by question. i.e. we use the save case “Case1” to prepare below average bar
chart.
The pop up will have a different format which is (Key Measure Question, Level of split by
For more details contact us: [email protected]
© 2013 BRIDGEi2i Analytics Solutions Pvt. Ltd. All rights reserved
Information Insight Impact
question, Average). The icons for different chart types, data table, applying weights and
data label is also available for user’s use.
The sureveyi2i custom charts also provide the option for user to save the chart as image.
The chart can be published on dashboard and the report can be send to Power Point
Presentation as a slide.
SAVING AND PUBLISHING
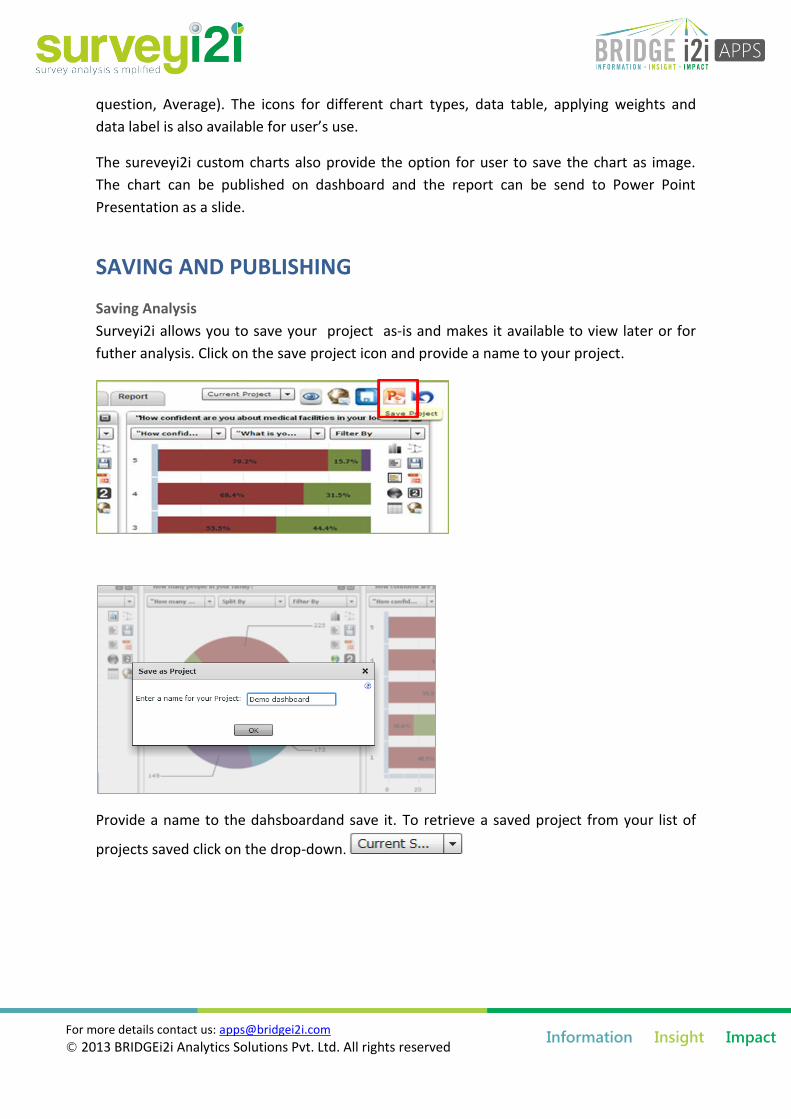
Saving Analysis
Surveyi2i allows you to save your project as-is and makes it available to view later or for
futher analysis. Click on the save project icon and provide a name to your project.
Provide a name to the dahsboardand save it. To retrieve a saved project from your list of
projects saved click on the drop-down.
For more details contact us: [email protected]
© 2013 BRIDGEi2i Analytics Solutions Pvt. Ltd. All rights reserved
Information Insight Impact
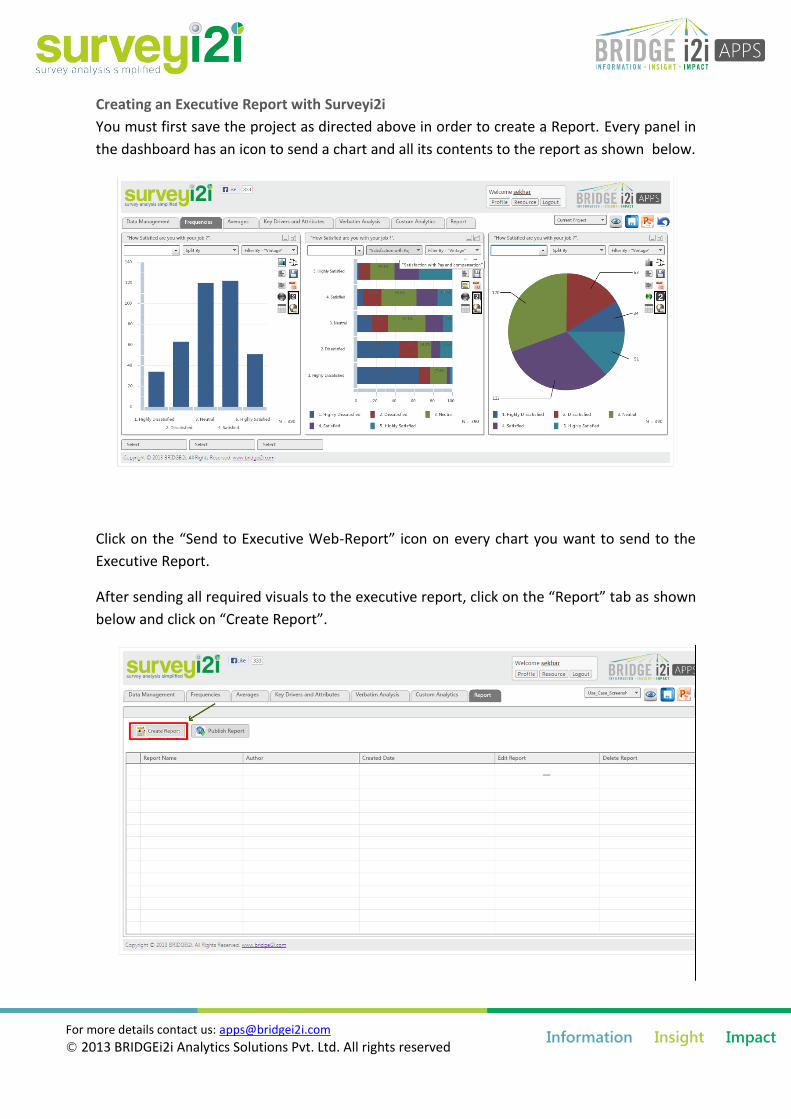
Creating an Executive Report with Surveyi2i
You must first save the project as directed above in order to create a Report. Every panel in
the dashboard has an icon to send a chart and all its contents to the report as shown below.
Click on the “Send to Executive Web-Report” icon on every chart you want to send to the
Executive Report.
After sending all required visuals to the executive report, click on the “Report” tab as shown
below and click on “Create Report”.
For more details contact us: [email protected]
© 2013 BRIDGEi2i Analytics Solutions Pvt. Ltd. All rights reserved
Information Insight Impact
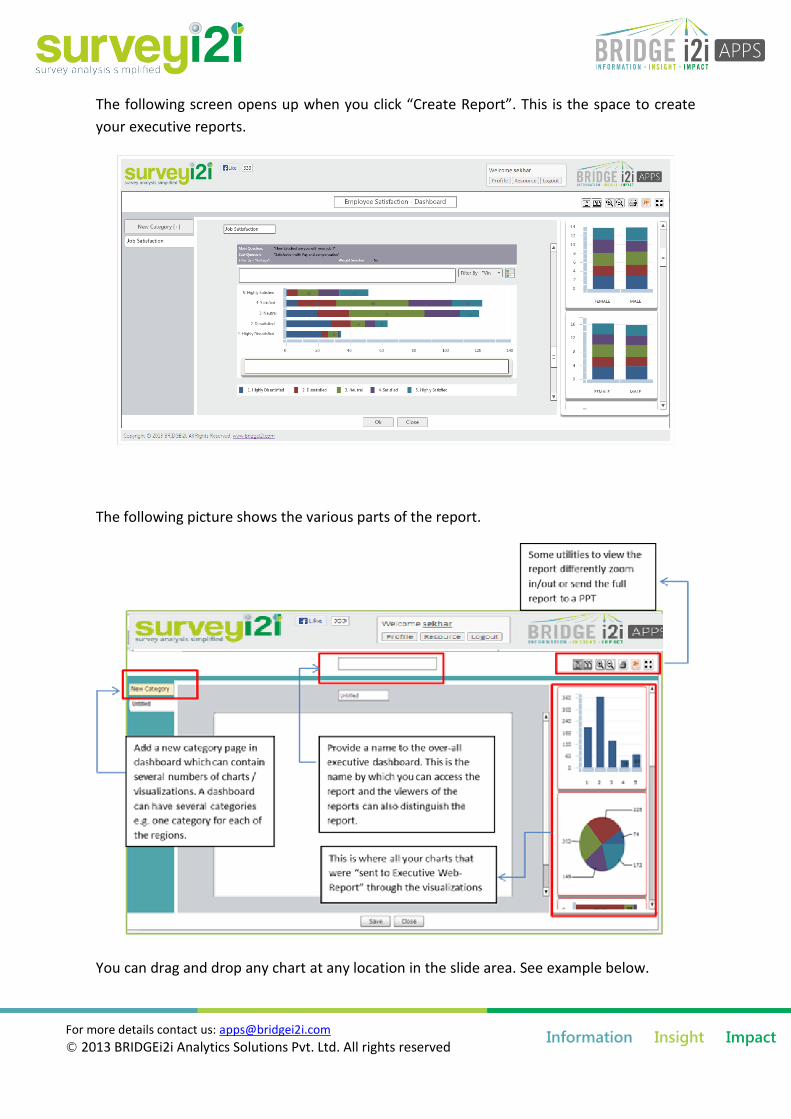
The following screen opens up when you click “Create Report”. This is the space to create
your executive reports.
The following picture shows the various parts of the report.
You can drag and drop any chart at any location in the slide area. See example below.
For more details contact us: [email protected]
© 2013 BRIDGEi2i Analytics Solutions Pvt. Ltd. All rights reserved
Information Insight Impact
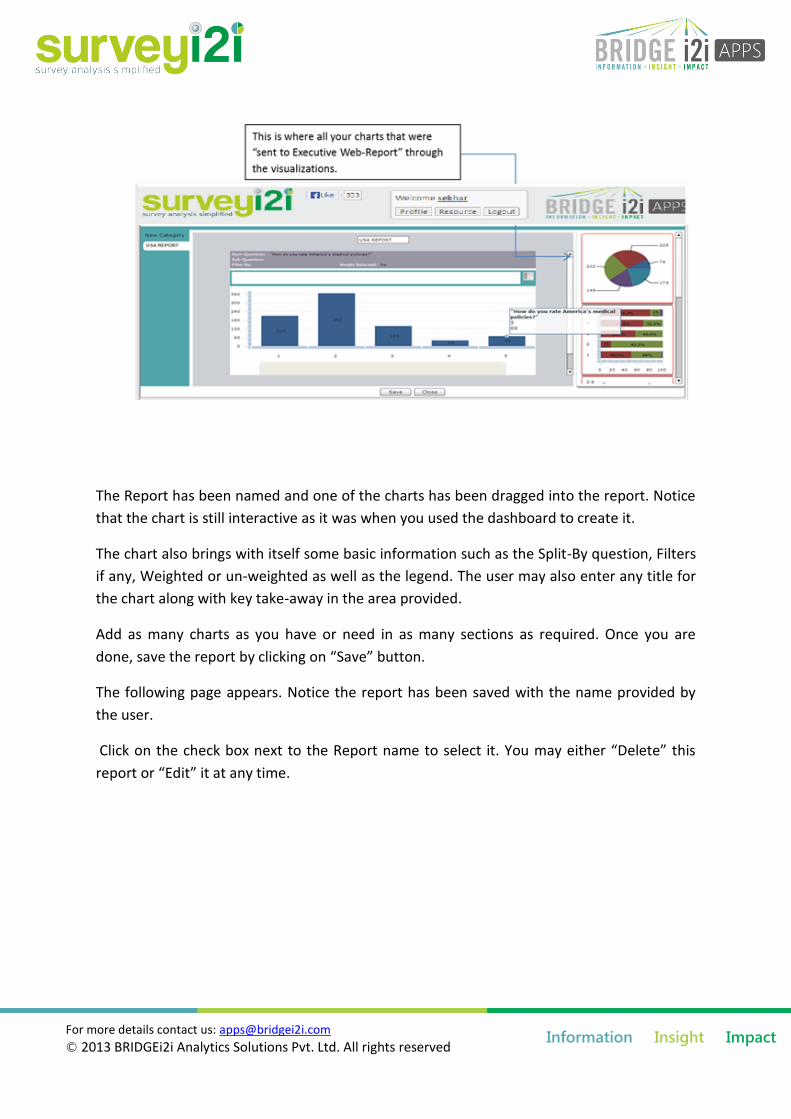
The Report has been named and one of the charts has been dragged into the report. Notice
that the chart is still interactive as it was when you used the dashboard to create it.
The chart also brings with itself some basic information such as the Split-By question, Filters
if any, Weighted or un-weighted as well as the legend. The user may also enter any title for
the chart along with key take-away in the area provided.
Add as many charts as you have or need in as many sections as required. Once you are
done, save the report by clicking on “Save” button.
The following page appears. Notice the report has been saved with the name provided by
the user.
Click on the check box next to the Report name to select it. You may either “Delete” this
report or “Edit” it at any time.
For more details contact us: [email protected]
© 2013 BRIDGEi2i Analytics Solutions Pvt. Ltd. All rights reserved
Information Insight Impact
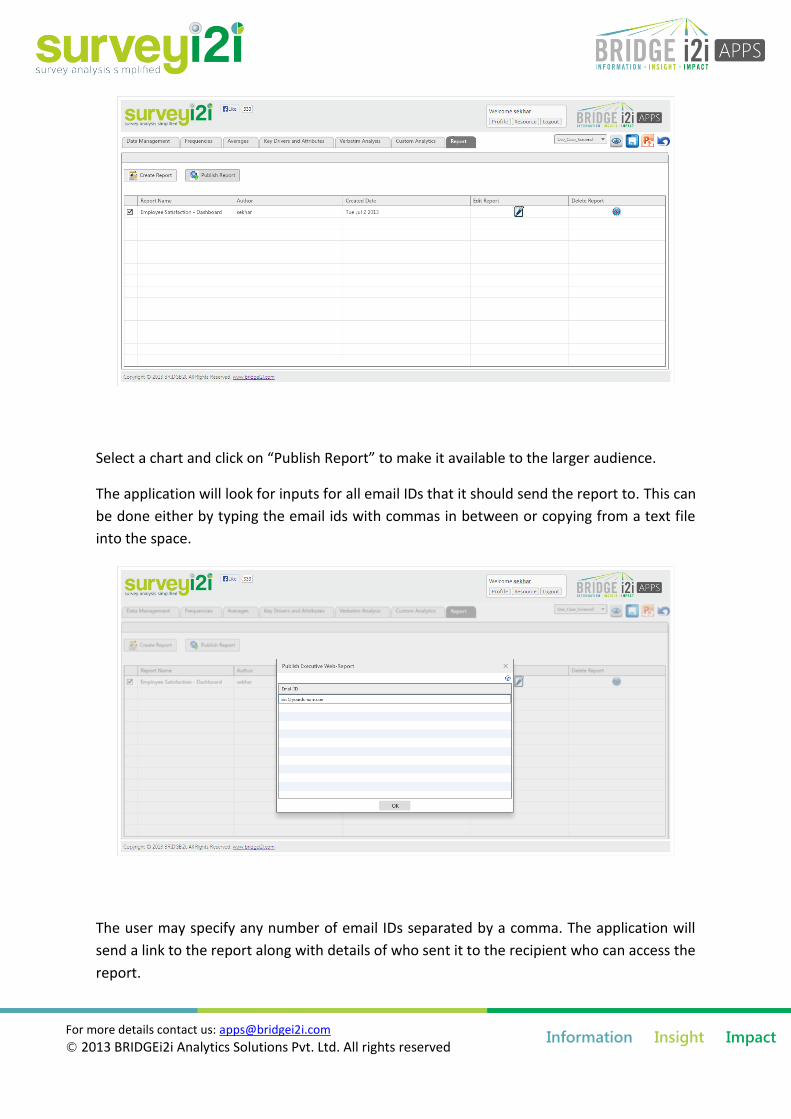
Select a chart and click on “Publish Report” to make it available to the larger audience.
The application will look for inputs for all email IDs that it should send the report to. This can
be done either by typing the email ids with commas in between or copying from a text file
into the space.
The user may specify any number of email IDs separated by a comma. The application will
send a link to the report along with details of who sent it to the recipient who can access the
report.

For more details contact us: [email protected]
© 2013 BRIDGEi2i Analytics Solutions Pvt. Ltd. All rights reserved
Information Insight Impact
Upon clicking the link, the recipient will see the report in a non-editable form as follows.
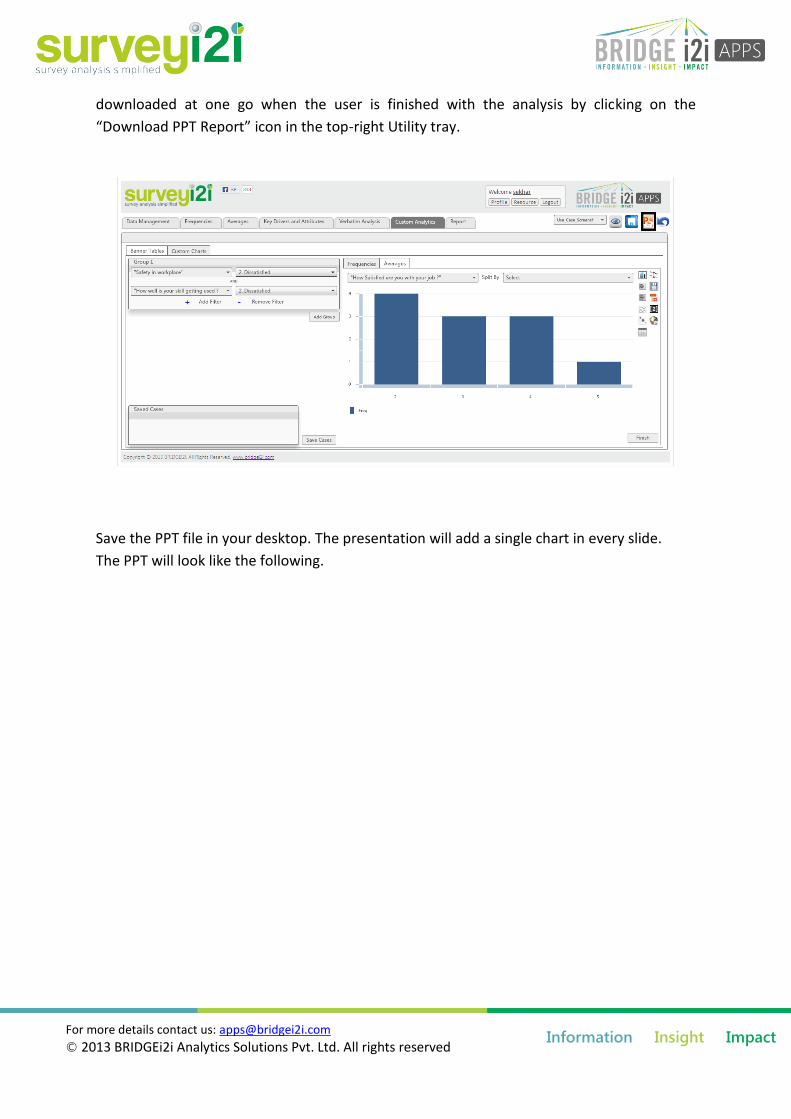
Creating a PPT Report with Surveyi2i
Surveyi2i can also create a PPT report in a much similar manner. Every chart panel has a
“Send to PPT report” icon as shown below.
Clicking on the icon sends all the charts to a Presentation tray that is invisible to the user.
Every chart item in the application has this utility and the entire presentation can be
For more details contact us: [email protected]
© 2013 BRIDGEi2i Analytics Solutions Pvt. Ltd. All rights reserved
Information Insight Impact
downloaded at one go when the user is finished with the analysis by clicking on the
“Download PPT Report” icon in the top-right Utility tray.
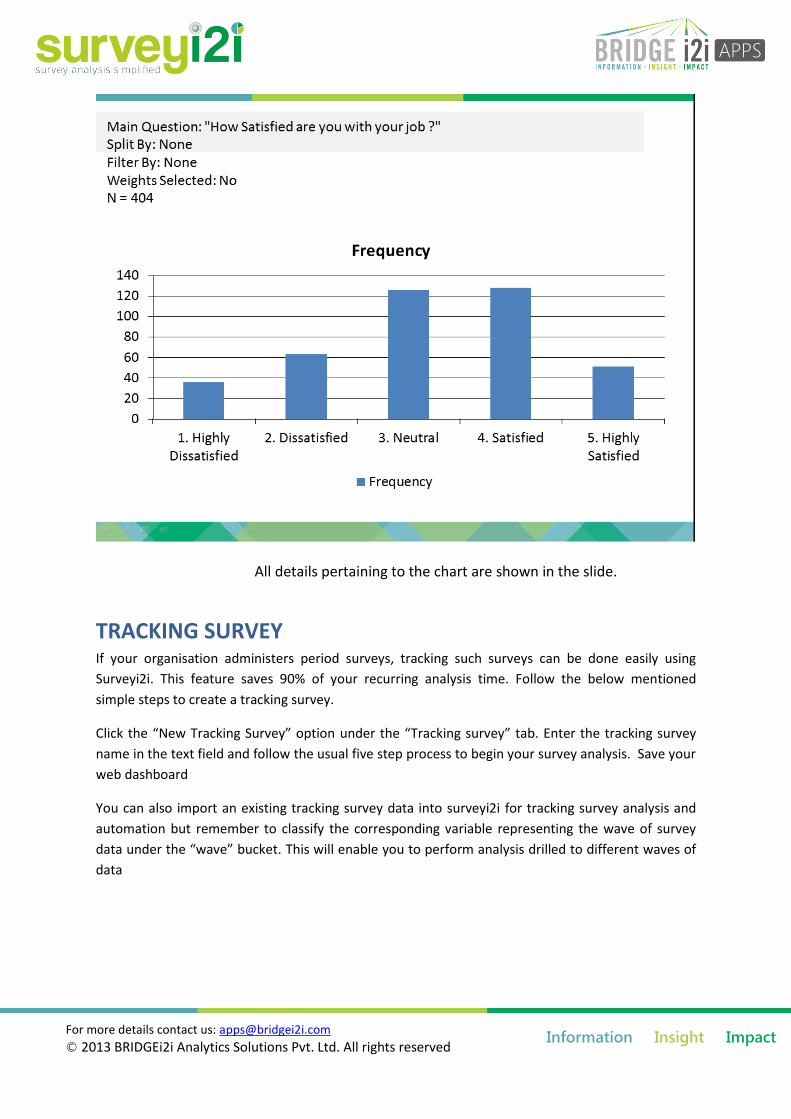
Save the PPT file in your desktop. The presentation will add a single chart in every slide.
The PPT will look like the following.
For more details contact us: [email protected]
© 2013 BRIDGEi2i Analytics Solutions Pvt. Ltd. All rights reserved
Information Insight Impact
All details pertaining to the chart are shown in the slide.
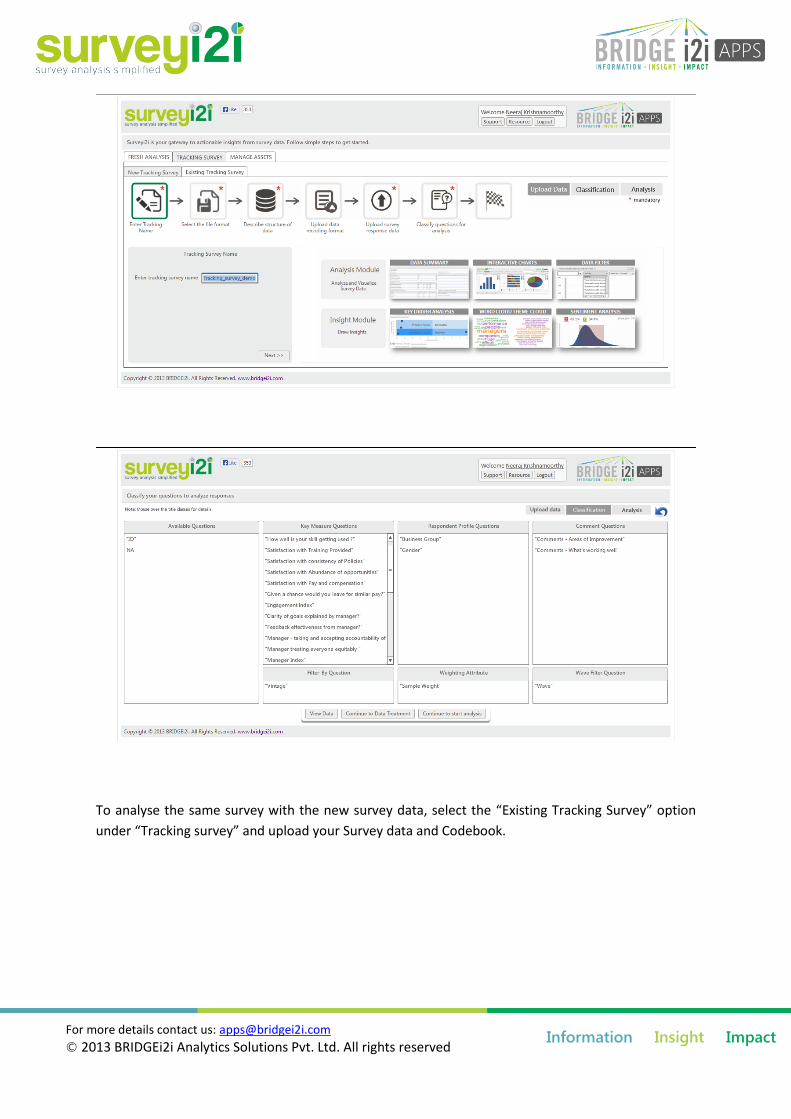
TRACKING SURVEY If your organisation administers period surveys, tracking such surveys can be done easily using
Surveyi2i. This feature saves 90% of your recurring analysis time. Follow the below mentioned
simple steps to create a tracking survey.
Click the “New Tracking Survey” option under the “Tracking survey” tab. Enter the tracking survey
name in the text field and follow the usual five step process to begin your survey analysis. Save your
web dashboard
You can also import an existing tracking survey data into surveyi2i for tracking survey analysis and
automation but remember to classify the corresponding variable representing the wave of survey
data under the “wave” bucket. This will enable you to perform analysis drilled to different waves of
data
For more details contact us: [email protected]
© 2013 BRIDGEi2i Analytics Solutions Pvt. Ltd. All rights reserved
Information Insight Impact
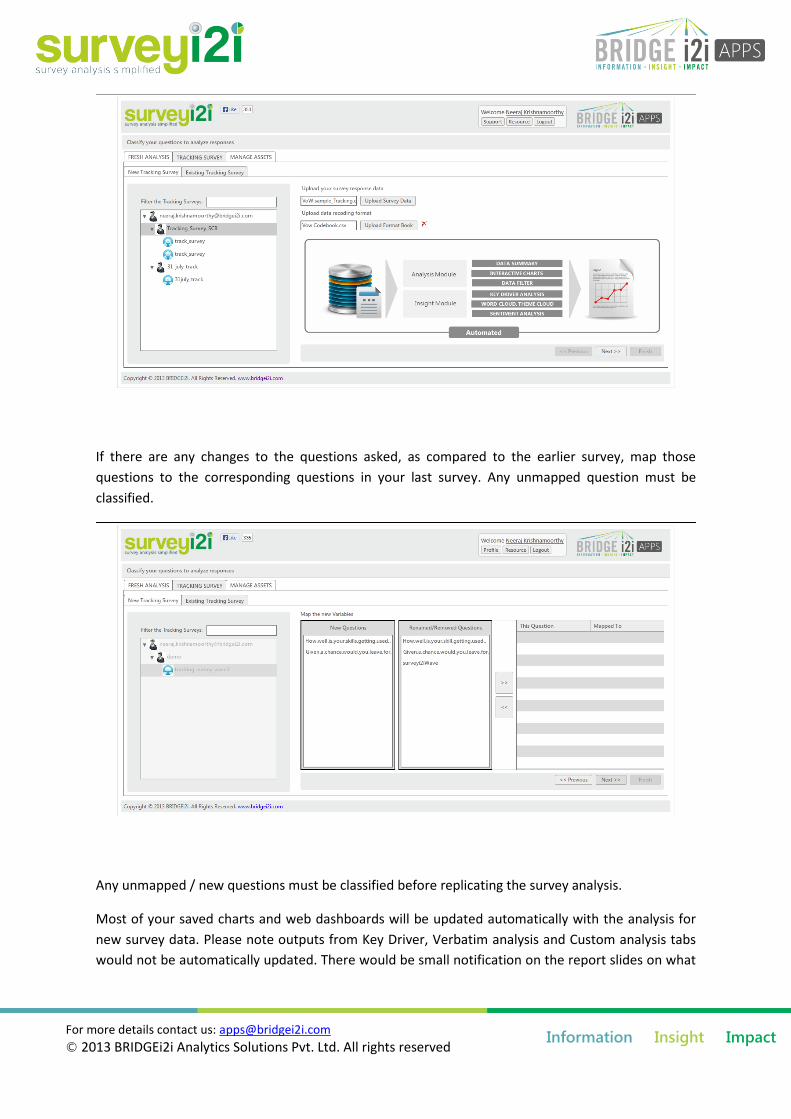
To analyse the same survey with the new survey data, select the “Existing Tracking Survey” option
under “Tracking survey” and upload your Survey data and Codebook.
For more details contact us: [email protected]
© 2013 BRIDGEi2i Analytics Solutions Pvt. Ltd. All rights reserved
Information Insight Impact
If there are any changes to the questions asked, as compared to the earlier survey, map those
questions to the corresponding questions in your last survey. Any unmapped question must be
classified.
Any unmapped / new questions must be classified before replicating the survey analysis.
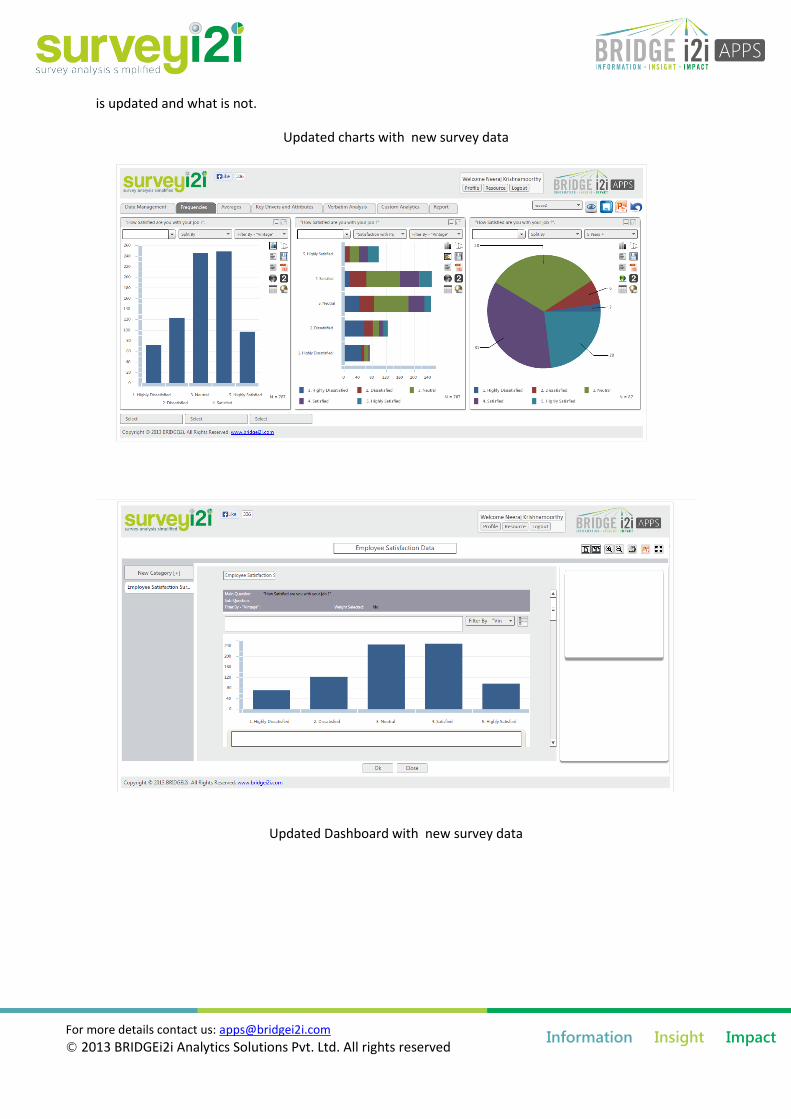
Most of your saved charts and web dashboards will be updated automatically with the analysis for
new survey data. Please note outputs from Key Driver, Verbatim analysis and Custom analysis tabs
would not be automatically updated. There would be small notification on the report slides on what
For more details contact us: [email protected]
© 2013 BRIDGEi2i Analytics Solutions Pvt. Ltd. All rights reserved
Information Insight Impact
is updated and what is not.
Updated charts with new survey data
Updated Dashboard with new survey data

For more details contact us: [email protected]
© 2013 BRIDGEi2i Analytics Solutions Pvt. Ltd. All rights reserved
Information Insight Impact
CONCLUSION
By now you should have a good understanding of the features of the Surveyi2i, and ideas
about how to effectively use it to drive insights from survey data. We are always looking for
ideas and feedback to improve our product, so if you have any suggestions or a particular
use case in mind, email us directly at [email protected].