Embed Size (px)
Citation preview
@ 2013 BRIDGEi2i Analytics Solutions Pvt. Ltd. All rights reserved
Surveyi2i
Features and Value Propositions
Issues in Survey Analytics
2
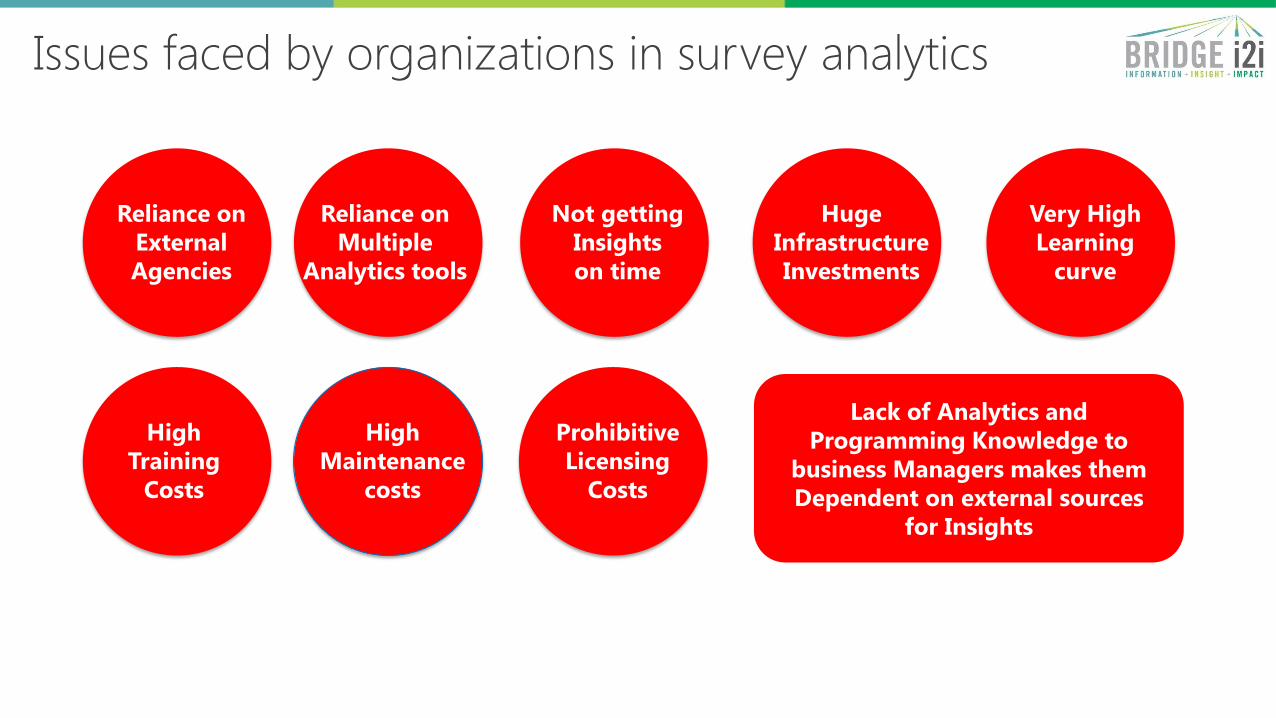
Issues faced by organizations in survey analytics
3
Reliance on
Multiple
Analytics tools
Reliance on
External
Agencies
Not getting
Insights
on time
Huge
Infrastructure
Investments
Very High
Learning
curve
High
Training
Costs
High
Maintenance
costs
Prohibitive
Licensing
Costs
Lack of Analytics and
Programming Knowledge to
business Managers makes them
Dependent on external sources
for Insights

Surveyi2i – Value Proposition
4

It is Google-like simple
Advanced Analytics at click of a
button
In memory processing- Robust
hardware
There are currently NO TOOLS in the
survey analytics space with advanced
analytics, text mining and reporting
features which can easily be used by
business managers to take data
driven decisions at an affordable
cost!
Surveyi2i at Survey analytics space
5
Lo
w
Hig
h
IT Dependent Business user driven
An
aly
tics
Cap
aci
ty

Surveyi2i – Value proposition
6
• Surveyi2i is an
integrated,
cloud based,
easy-to-use,
survey analysis and reporting platform with advanced analytics and text mining capabilities
which
empowers you
to take data backed decisions
without depending on others by giving
timely insights at an
affordable cost!
Where does Surveyi2i stand
in the “Survey Value chain”?
7
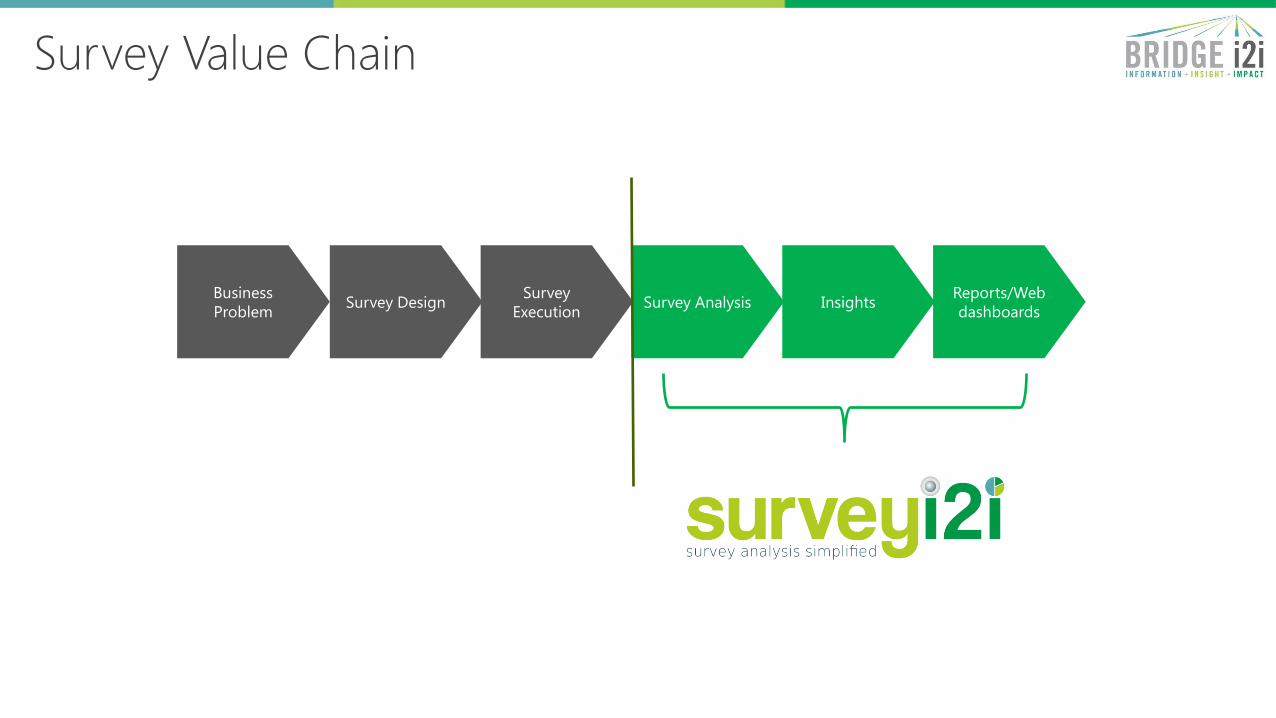
Survey Value Chain
8
Business
Problem Survey Design
Survey
Execution Survey Analysis Insights
Reports/Web
dashboards

Analysis – Insights – Sharing!!
ANALYZE Data
VISUALIZE Data
Derive INSIGHTS
SHARE Findings
Imp
act
Survey Data
Surveyi2i-Features
10
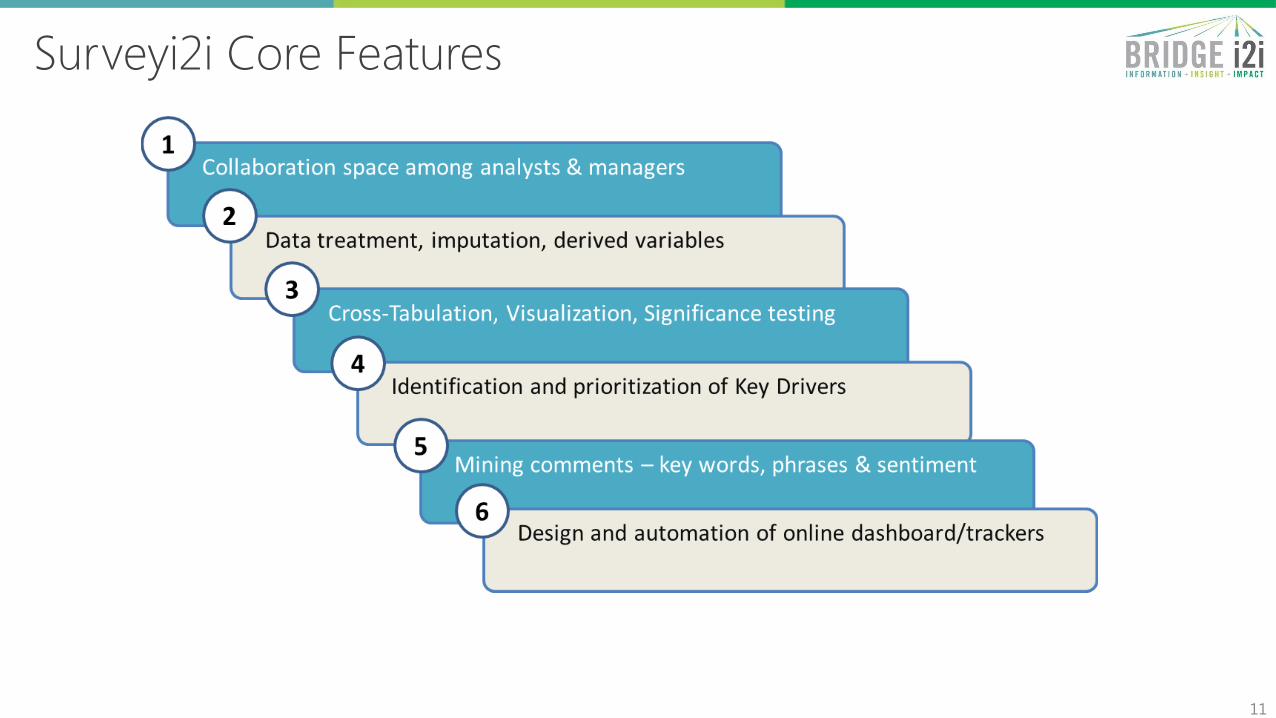
Surveyi2i Core Features
11

Surveyi2i- Components of the platform
12
Surveyi2i – Front End Layer for user interaction
Survey Repository – Store and Integrate Survey Data and Analysis
Exploration Module
» Cross – Tabulation
» Banners Tables
» Significance Tests
» Custom Segmentation
Text Analysis Module
» Frequency Count
» Theme Extraction
» Sentiment Analysis
» Feature Extraction
Collaboration Module
» Customizable Web Dashboards
» MS Office © Integration
» Collaboration and Query Space
Data Mgmt. Module
» Simple UI to upload survey data
» Tracking/ One Time Survey
» Multiple Data Format
» Data Management
Analytics Module
» Key Driver Analysis
» Key Attribute Analysis
Visualization Module
» Interactive charts
» Customization report format and styles
Security Layer – User Level Based Survey Data and Dashboard Access
Manage, Analyze, Visualize, Insights, Collaborate

How will surveyi2i enhance
my business decisions?
14
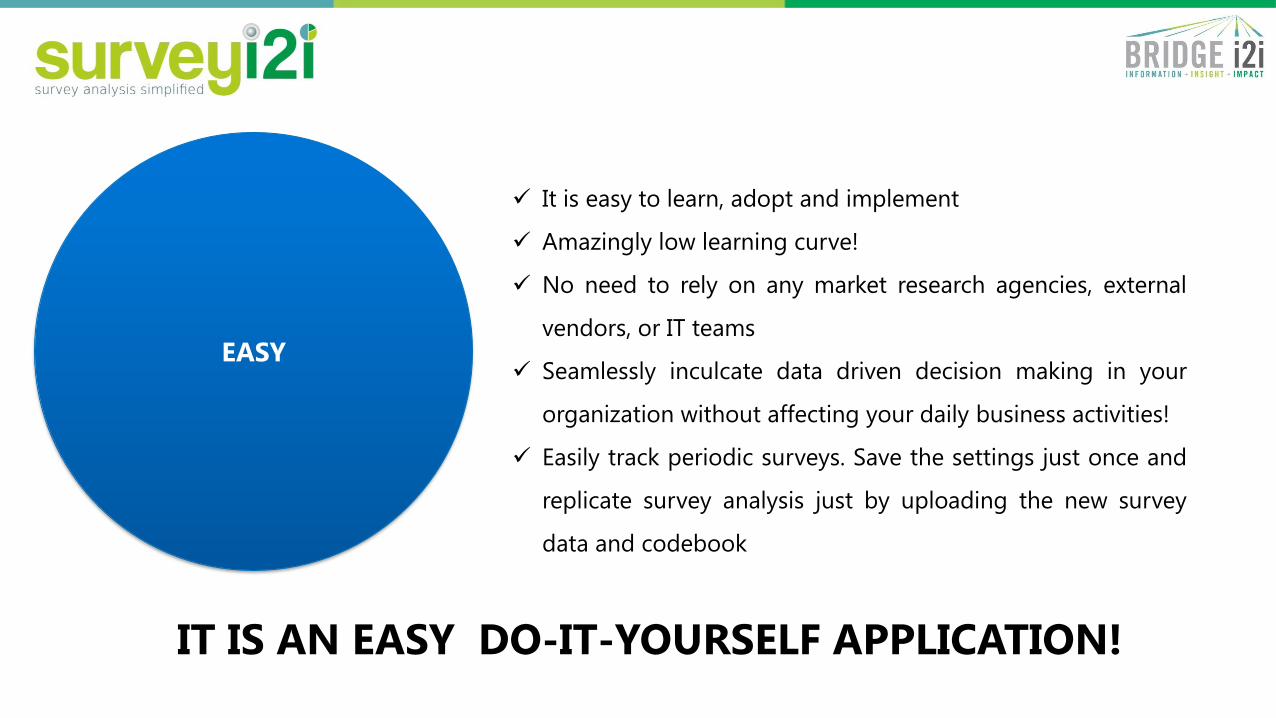
EASY
It is easy to learn, adopt and implement
Amazingly low learning curve!
No need to rely on any market research agencies, external
vendors, or IT teams
Seamlessly inculcate data driven decision making in your
organization without affecting your daily business activities!
Easily track periodic surveys. Save the settings just once and
replicate survey analysis just by uploading the new survey
data and codebook
IT IS AN EASY DO-IT-YOURSELF APPLICATION!

Identify key business trends and unearth key parameters to
focus with the help of advanced analytics – By the click of a
button!
Get sharp insights at great Speed!. Analyze within 4 hours,
instead of 4 weeks!
Say good bye to manual processing of textual data. Word
cloud, Theme cloud, Word associations, Verbatim coding –
All done within minutes
ADVANCED ANALYTICS & TEXT PROCESSING
UNDER ONE ROOF!
INSIGHTFUL

No IT infrastructure investments
No outsourcing costs
Very minimal training costs
No Maintenance costs
Say “No” to multiple analytical tools
No Prohibitive licensing costs!
Consume surveyi2i as “Software as a Service”(SaaS)
CUT 80% OF YOUR MARKET RESEARCH COSTS!
AFFORDABLE
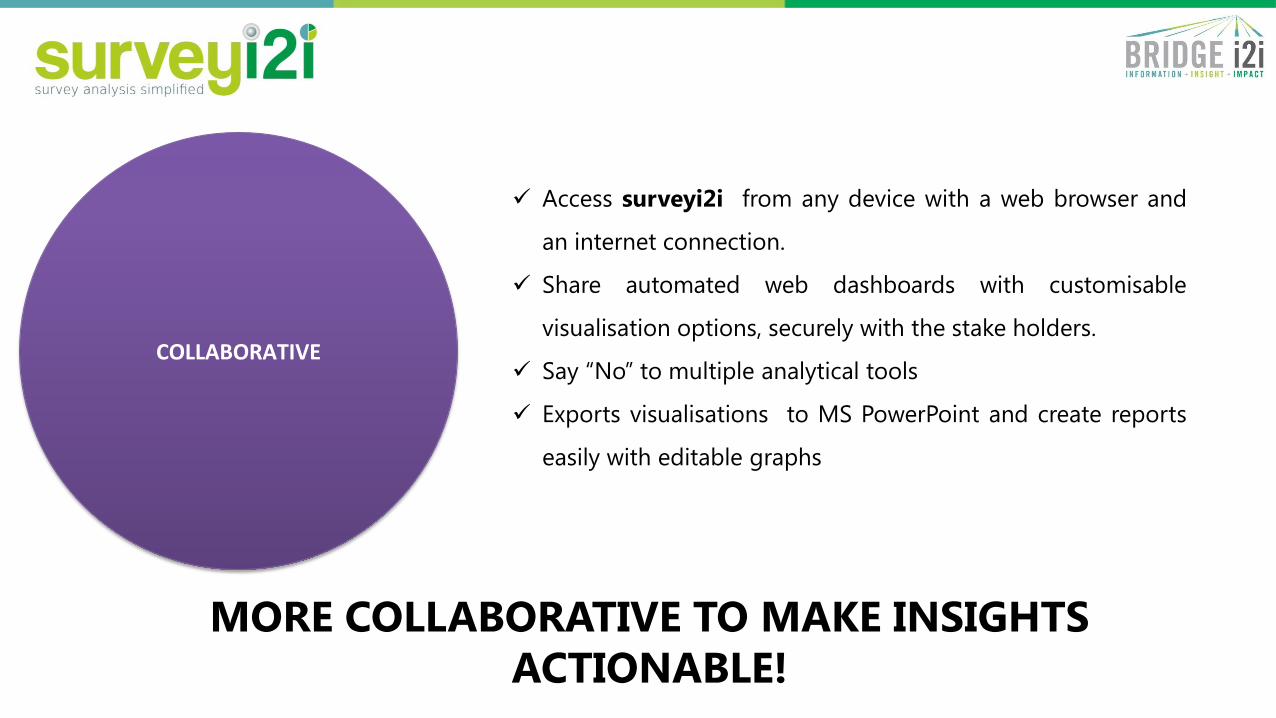
Access surveyi2i from any device with a web browser and
an internet connection.
Share automated web dashboards with customisable
visualisation options, securely with the stake holders.
Say “No” to multiple analytical tools
Exports visualisations to MS PowerPoint and create reports
easily with editable graphs
MORE COLLABORATIVE TO MAKE INSIGHTS
ACTIONABLE!
COLLABORATIVE

Use cases
19

Use case 1
Customer Service Executive
Surveyi2i can help your customer service executive to
Identify drivers of customer satisfaction
Identify trends in customer experience metrics
Identify drivers of customer engagement
Identify trends in customer experience
From Survey data Without relying on others!!

Use case 2
Human Resource Manager
Surveyi2i can help your human resource manager to
Derive actionable insights from exit interviews
Identify drivers of Employee satisfaction
Minimize attrition
Distribute Appraisal budget

Use case 3
22
Surveyi2i can help your marketing manager to
Understand the voice of the customer
Understand the market perception about a product/service
Understand the price elasticity / sensitivity reactions
Execute Pilot test strategies quickly
Choose the right marketing channel
Target the right customer
By giving timely insights from survey data!
Marketing Manager

Use case 4
23
Surveyi2i eases the work of Business Manager /Analyst
By providing him a single integrated tool for all his analytics and
reporting needs.
By providing him with easy reporting tools for PowerPoint
presentation and Web dashboards without any manual work and
coding
By providing him text processing engines to process text content ,
thereby saving his precious time by eliminating manual text analysis
Business Manager and Analyst

24
Deriving actionable Insights from survey data made Easy
and Affordable

25
Thank you