Embed Size (px)
Citation preview
Bulgaria:
Back on the right track
March 2015
DATE: MARCH, 2015 - 2 -
CONTENTS
Editorial p.3
Part 1: The macro view p.4
The growth to pick up in 2016 p.5
The political situation in Bulgaria p.11
The crisis in Russia and Ukraine p.12
Greece turmoil and Bulgaria p.13
Part 2: The market view p.14
Part 3: Top investments picks p.17
Agria Group Holding p.18 Monbat p.20
First Investment Bank p.22 Elana Agrocredit p.24 Speedy p.25 Chimimport p.27 CEZ Distribution p.29
Trace Group Hold p.31 Sirma Group Holding p.33
Sopharma Trading p.34
Disclaimer p.36

DATE: MARCH, 2015 - 3 -
EDITORIAL
Honestly, it has not been easy. In only one year, Bulgaria went through one of the toughest stress tests in the last 25 years – banks fell, depositors rushed for their money, three gov-ernments came and went in less than 24 months.
But guess what? The country enters 2015 back on the right track.
The economy is doing well even despite the negative impact from external factors like
Ukraine, Greece and sluggish Europe. Growth is modest (1.7% GDP growth y-o-y) but the potential pick up is evident with employment improving, domestic consumption waking up and the banking system once again overfilled with liquidity. Interest rates are falling so households and businesses will find it easier to start investing again.
EU funding is higher and absorption is improving significantly with agriculture, manufacturing
and infrastructure to gain the most. Structural reforms in the energy, health care, banking system and most importantly – the judiciary, are finally on the current political agenda.
Pension and social security system reshuffle is also being discussed putting the capital market
on pressure, only to free up more attractive valuations rather than a long-term distress. Main Bulgarian Stock Exchange index – SOFIX is back at 7.22x P/E.
Most importantly, the capital market is once again preferred for by local trend setters for
IPOs. Following Speedy’s (0SP BU) example from 2012, the leading software company Sirma Group Holding will tap investors’ interest in the coming weeks with its IPO.
These and other top economic trends and investment picks our Research Team has compiled
in the following pages.
Enjoy reading,
Sincerely,
Elana Trading’s Research Team

The Macro View
THE MACRO VIEW
The Macro View
DATE: MARCH, 2015 - 5 -
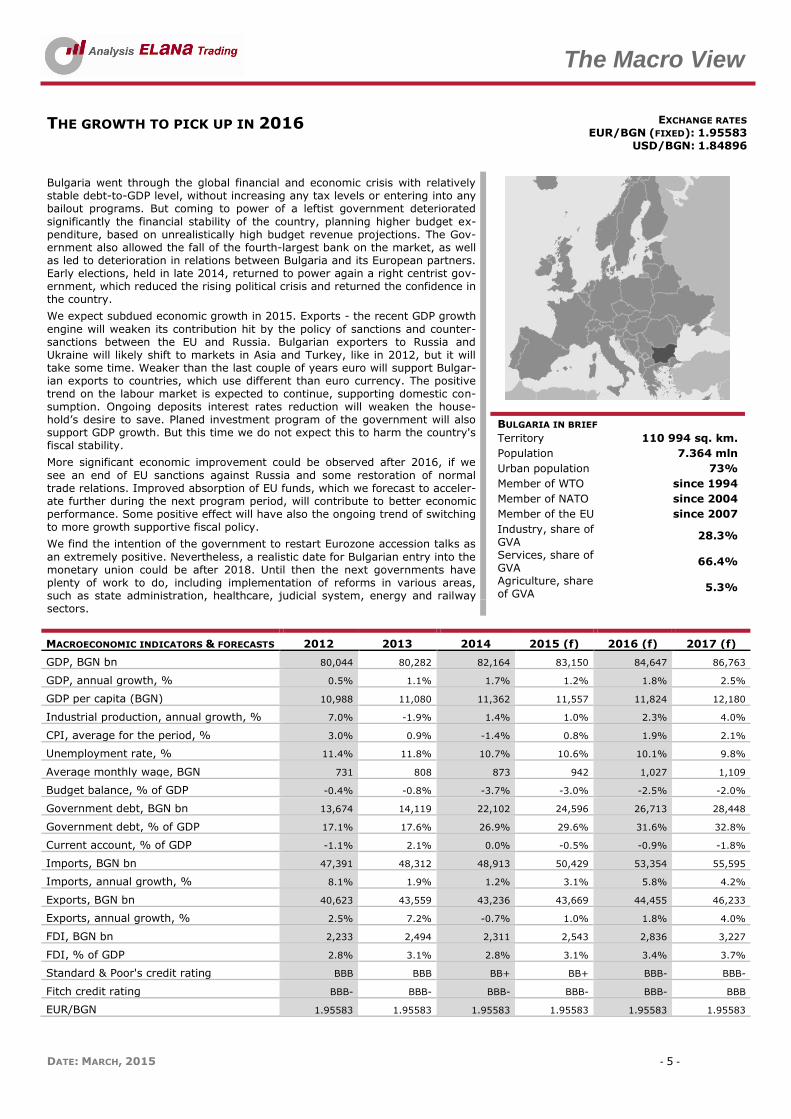
THE GROWTH TO PICK UP IN 2016 EXCHANGE RATES EUR/BGN (FIXED): 1.95583
USD/BGN: 1.84896
Bulgaria went through the global financial and economic crisis with relatively stable debt-to-GDP level, without increasing any tax levels or entering into any bailout programs. But coming to power of a leftist government deteriorated
significantly the financial stability of the country, planning higher budget ex-penditure, based on unrealistically high budget revenue projections. The Gov-ernment also allowed the fall of the fourth-largest bank on the market, as well as led to deterioration in relations between Bulgaria and its European partners. Early elections, held in late 2014, returned to power again a right centrist gov-ernment, which reduced the rising political crisis and returned the confidence in the country.
We expect subdued economic growth in 2015. Exports - the recent GDP growth
engine will weaken its contribution hit by the policy of sanctions and counter-sanctions between the EU and Russia. Bulgarian exporters to Russia and Ukraine will likely shift to markets in Asia and Turkey, like in 2012, but it will take some time. Weaker than the last couple of years euro will support Bulgar-ian exports to countries, which use different than euro currency. The positive trend on the labour market is expected to continue, supporting domestic con-sumption. Ongoing deposits interest rates reduction will weaken the house-hold’s desire to save. Planed investment program of the government will also support GDP growth. But this time we do not expect this to harm the country's fiscal stability.
More significant economic improvement could be observed after 2016, if we
see an end of EU sanctions against Russia and some restoration of normal trade relations. Improved absorption of EU funds, which we forecast to acceler-ate further during the next program period, will contribute to better economic performance. Some positive effect will have also the ongoing trend of switching to more growth supportive fiscal policy.
We find the intention of the government to restart Eurozone accession talks as
an extremely positive. Nevertheless, a realistic date for Bulgarian entry into the monetary union could be after 2018. Until then the next governments have plenty of work to do, including implementation of reforms in various areas, such as state administration, healthcare, judicial system, energy and railway sectors.
BULGARIA IN BRIEF
Territory 110 994 sq. km.
Population 7.364 mln
Urban population 73%
Member of WTO since 1994
Member of NATO since 2004
Member of the EU since 2007
Industry, share of GVA
28.3%
Services, share of GVA
66.4%
Agriculture, share of GVA
5.3%
MACROECONOMIC INDICATORS & FORECASTS 2012 2013 2014 2015 (f) 2016 (f) 2017 (f)
GDP, BGN bn 80,044 80,282 82,164 83,150 84,647 86,763
GDP, annual growth, % 0.5% 1.1% 1.7% 1.2% 1.8% 2.5%
GDP per capita (BGN) 10,988 11,080 11,362 11,557 11,824 12,180
Industrial production, annual growth, % 7.0% -1.9% 1.4% 1.0% 2.3% 4.0%
CPI, average for the period, % 3.0% 0.9% -1.4% 0.8% 1.9% 2.1%
Unemployment rate, % 11.4% 11.8% 10.7% 10.6% 10.1% 9.8%
Average monthly wage, BGN 731 808 873 942 1,027 1,109
Budget balance, % of GDP -0.4% -0.8% -3.7% -3.0% -2.5% -2.0%
Government debt, BGN bn 13,674 14,119 22,102 24,596 26,713 28,448
Government debt, % of GDP 17.1% 17.6% 26.9% 29.6% 31.6% 32.8%
Current account, % of GDP -1.1% 2.1% 0.0% -0.5% -0.9% -1.8%
Imports, BGN bn 47,391 48,312 48,913 50,429 53,354 55,595
Imports, annual growth, % 8.1% 1.9% 1.2% 3.1% 5.8% 4.2%
Exports, BGN bn 40,623 43,559 43,236 43,669 44,455 46,233
Exports, annual growth, % 2.5% 7.2% -0.7% 1.0% 1.8% 4.0%
FDI, BGN bn 2,233 2,494 2,311 2,543 2,836 3,227
FDI, % of GDP 2.8% 3.1% 2.8% 3.1% 3.4% 3.7%
Standard & Poor's credit rating BBB BBB BB+ BB+ BBB- BBB-
Fitch credit rating BBB- BBB- BBB- BBB- BBB- BBB
EUR/BGN 1.95583 1.95583 1.95583 1.95583 1.95583 1.95583

The Macro View
DATE: MARCH, 2015 - 6 -
MACROECONOMIC OVERVIEW
After a period of very rapid economic growth (2002-2008), the global financial crisis has slowed significantly the Bulgarian economy. But in contrast to many other European coun-tries, Bulgaria went through the crisis with relatively stable debt-to-GDP level, without increasing any tax levels or entering into any bailout programs. Ruling center right gov-ernment of GERB (Citizens for European Development of Bulgaria) in 2009-2013 also man-aged to return quickly the budget deficit below the Maastricht limit of 3% of GDP. As a result, Bulgaria was the only European country with increased credit rating by Moody's in 2010 and 2011.
After short period of a left-wing government (2013-2014), during which the ruling coalition
has worsened the fiscal discipline and attracted significant political disapproval, people voted again for a rightist government. The early parliamentary elections, held in 2014, were won again by right-center GERB, which managed to establish a coalition with another right party - Reformist Block (RB) and some smaller parties. This weakened the current political instability, which had started to transform into economic uncertainty.
Relatively stable political situation after the recent elections
The new government restored payments under the EU Operational Programmes, which were frozen during the past government, but due to lack of a significant labour market improvement, as well as the moderate foreign direct investments inflow, the post-crisis recovery is expected to remain subdued.
Our expectations are 2015 economic growth to decelerate slightly to 1.2% y-o-y. The re-
cent GDP growth engine – exports, will weaken its contribution, affected by the ongoing “sanctions war” between USA/EU and Russia, as well as the uncertainty caused by geopo-litical issues between Russia and Ukraine. Taking this into account, we expect domestic demand to strengthen its contribution to GDP. First signs of labour market improvement, observed during the second half of 2014, will likely lead to gradual increase in private con-sumption. The deposits interest rates reduction is also expecting to stimulate domestic consumption, making the desire to save not so strong.
But external factors will affect negatively the economic growth
The gross fixed capital formation will also be among growth drivers. As the country seems finally to emerge from a prolonged period of low investment, a growing need of invest-ments replacement has emerged. We expect the positive trend from 2014, when the indi-cator increased by average 4%-5% every quarter to continue. An additional boost will come from expected higher EU funds utilization, which is expected to continue to rise dur-ing the next years, as well as from the government spending, which is starting to increase
again after a period of a restrictive investment policy during 2009-2013.
Main 2015 growth drivers –gross fixed capital formation and do-
mestic consumption
More significant economic improvement could be observed after 2016, if we see the end of EU sanctions against Russia and some restoration of normal trade relations. This will bring back the business and consumer confidence, harmed by increased geopolitical risks and the policy of sanctions and counter-sanctions between the EU and Russia. A basis for our positive expectations are also improved absorption of EU funds, which we forecast to ac-celerate further during the next program period and planned more growth supportive fiscal policy. This will return the country on the way of “higher than EU average GDP growth”, which is essential if Bulgaria wants to bring its economic indicators close to EU average level.
More significant economic im-provement – after 2016
Exhibit 1: GDP growth, % change on an annual basis Exhibit 2: Contribution to GDP growth by final use compo-nents
Source: NSI, Eurostat, ELANA forecast
Source: NSI
-6%
-5%
-4%
-3%
-2%
-1%
0%
1%
2%
3%
4%
5%
6%
7%
8%
Bulgaria
EU-28 -50%
-40%
-30%
-20%
-10%
0%
10%
20%
30%
40%
50%
2006 2007 2008 2009 2010 2011 2012 2013 2014
Imports
Collective consumption
Individual Consumption
Gross fixed capital formation
Exports
The Macro View
DATE: MARCH, 2015 - 7 -
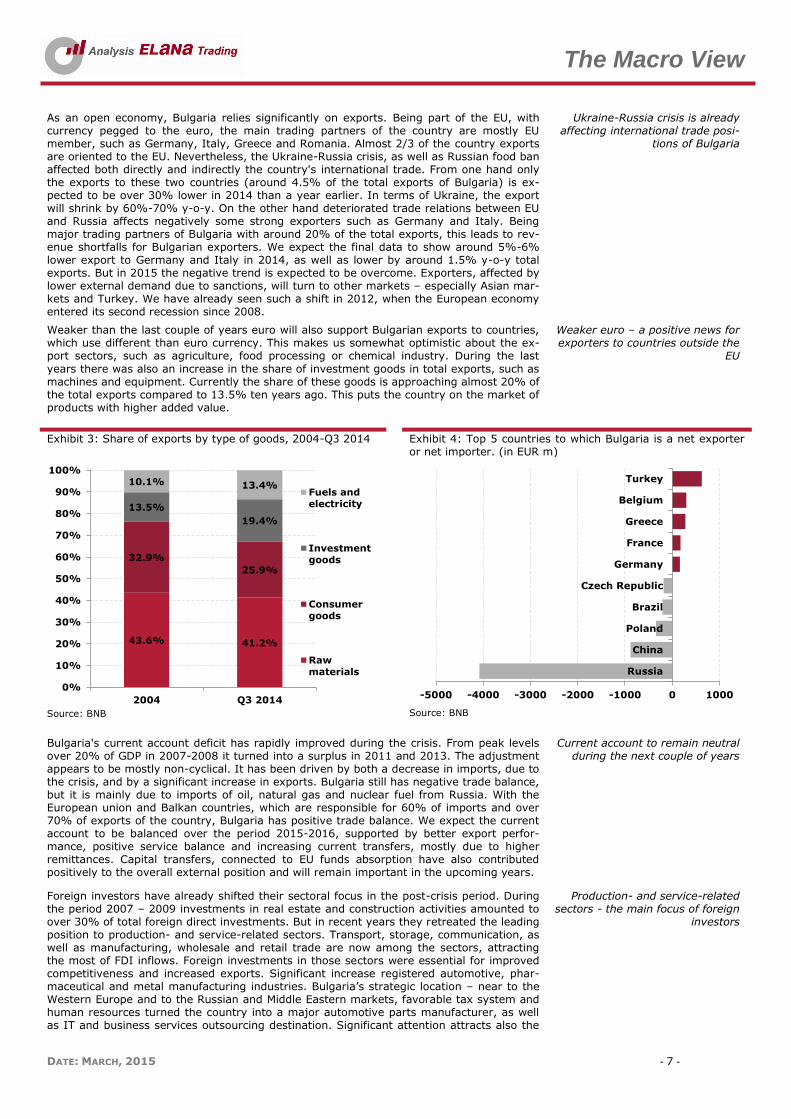
As an open economy, Bulgaria relies significantly on exports. Being part of the EU, with currency pegged to the euro, the main trading partners of the country are mostly EU member, such as Germany, Italy, Greece and Romania. Almost 2/3 of the country exports are oriented to the EU. Nevertheless, the Ukraine-Russia crisis, as well as Russian food ban affected both directly and indirectly the country's international trade. From one hand only the exports to these two countries (around 4.5% of the total exports of Bulgaria) is ex-pected to be over 30% lower in 2014 than a year earlier. In terms of Ukraine, the export will shrink by 60%-70% y-o-y. On the other hand deteriorated trade relations between EU and Russia affects negatively some strong exporters such as Germany and Italy. Being major trading partners of Bulgaria with around 20% of the total exports, this leads to rev-enue shortfalls for Bulgarian exporters. We expect the final data to show around 5%-6% lower export to Germany and Italy in 2014, as well as lower by around 1.5% y-o-y total exports. But in 2015 the negative trend is expected to be overcome. Exporters, affected by lower external demand due to sanctions, will turn to other markets – especially Asian mar-kets and Turkey. We have already seen such a shift in 2012, when the European economy entered its second recession since 2008.
Ukraine-Russia crisis is already affecting international trade posi-
tions of Bulgaria
Weaker than the last couple of years euro will also support Bulgarian exports to countries, which use different than euro currency. This makes us somewhat optimistic about the ex-port sectors, such as agriculture, food processing or chemical industry. During the last
years there was also an increase in the share of investment goods in total exports, such as machines and equipment. Currently the share of these goods is approaching almost 20% of the total exports compared to 13.5% ten years ago. This puts the country on the market of products with higher added value.
Weaker euro – a positive news for exporters to countries outside the
EU
Exhibit 3: Share of exports by type of goods, 2004-Q3 2014 Exhibit 4: Top 5 countries to which Bulgaria is a net exporter or net importer. (in EUR m)
Source: BNB
Source: BNB
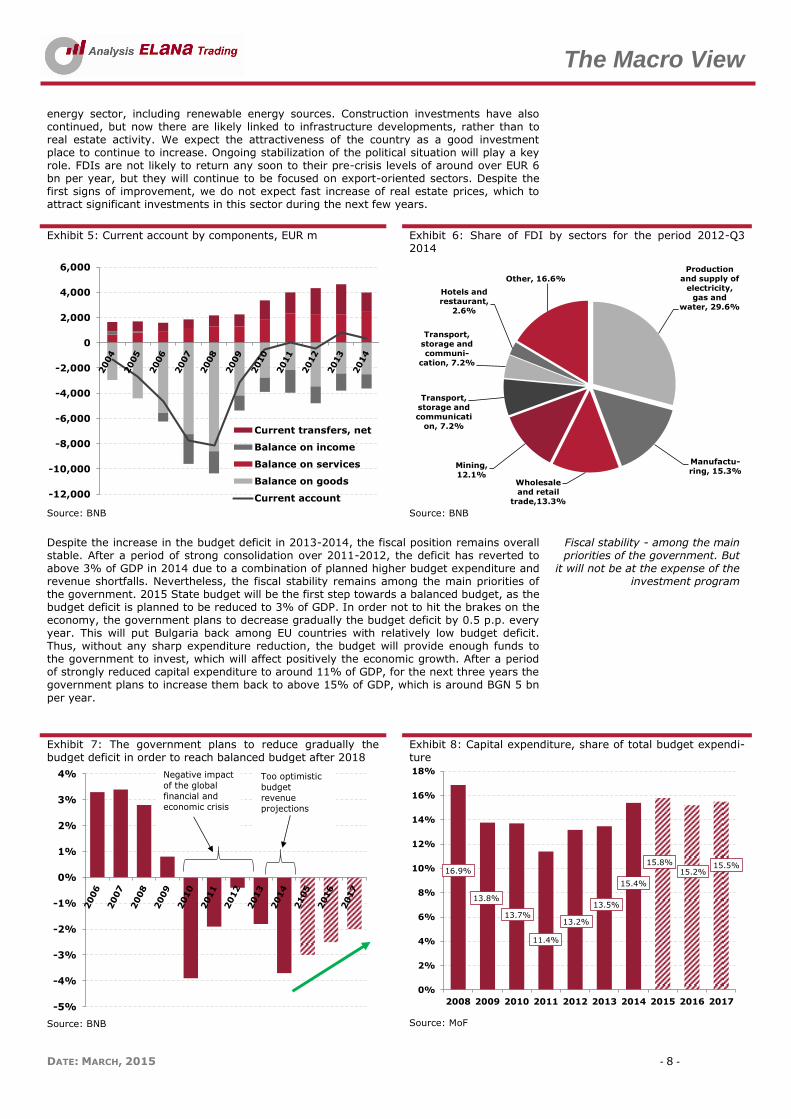
Bulgaria's current account deficit has rapidly improved during the crisis. From peak levels over 20% of GDP in 2007-2008 it turned into a surplus in 2011 and 2013. The adjustment appears to be mostly non-cyclical. It has been driven by both a decrease in imports, due to the crisis, and by a significant increase in exports. Bulgaria still has negative trade balance, but it is mainly due to imports of oil, natural gas and nuclear fuel from Russia. With the European union and Balkan countries, which are responsible for 60% of imports and over 70% of exports of the country, Bulgaria has positive trade balance. We expect the current account to be balanced over the period 2015-2016, supported by better export perfor-mance, positive service balance and increasing current transfers, mostly due to higher remittances. Capital transfers, connected to EU funds absorption have also contributed positively to the overall external position and will remain important in the upcoming years.
Current account to remain neutral during the next couple of years
Foreign investors have already shifted their sectoral focus in the post-crisis period. During the period 2007 – 2009 investments in real estate and construction activities amounted to over 30% of total foreign direct investments. But in recent years they retreated the leading position to production- and service-related sectors. Transport, storage, communication, as well as manufacturing, wholesale and retail trade are now among the sectors, attracting the most of FDI inflows. Foreign investments in those sectors were essential for improved competitiveness and increased exports. Significant increase registered automotive, phar-maceutical and metal manufacturing industries. Bulgaria’s strategic location – near to the Western Europe and to the Russian and Middle Eastern markets, favorable tax system and human resources turned the country into a major automotive parts manufacturer, as well as IT and business services outsourcing destination. Significant attention attracts also the
Production- and service-related sectors - the main focus of foreign
investors
43.6% 41.2%
32.9%
25.9%
13.5%
19.4%
10.1% 13.4%
0%
10%
20%
30%
40%
50%
60%
70%
80%
90%
100%
2004 Q3 2014
Fuels and
electricity
Investment
goods
Consumergoods
Raw
materials
-5000 -4000 -3000 -2000 -1000 0 1000
Russia
China
Poland
Brazil
Czech Republic
Germany
France
Greece
Belgium
Turkey
The Macro View
DATE: MARCH, 2015 - 8 -
energy sector, including renewable energy sources. Construction investments have also continued, but now there are likely linked to infrastructure developments, rather than to real estate activity. We expect the attractiveness of the country as a good investment place to continue to increase. Ongoing stabilization of the political situation will play a key role. FDIs are not likely to return any soon to their pre-crisis levels of around over EUR 6 bn per year, but they will continue to be focused on export-oriented sectors. Despite the first signs of improvement, we do not expect fast increase of real estate prices, which to attract significant investments in this sector during the next few years.
Exhibit 5: Current account by components, EUR m Exhibit 6: Share of FDI by sectors for the period 2012-Q3 2014
Source: BNB
Source: BNB
Despite the increase in the budget deficit in 2013-2014, the fiscal position remains overall stable. After a period of strong consolidation over 2011-2012, the deficit has reverted to above 3% of GDP in 2014 due to a combination of planned higher budget expenditure and revenue shortfalls. Nevertheless, the fiscal stability remains among the main priorities of the government. 2015 State budget will be the first step towards a balanced budget, as the budget deficit is planned to be reduced to 3% of GDP. In order not to hit the brakes on the economy, the government plans to decrease gradually the budget deficit by 0.5 p.p. every year. This will put Bulgaria back among EU countries with relatively low budget deficit. Thus, without any sharp expenditure reduction, the budget will provide enough funds to the government to invest, which will affect positively the economic growth. After a period of strongly reduced capital expenditure to around 11% of GDP, for the next three years the government plans to increase them back to above 15% of GDP, which is around BGN 5 bn
per year.
Fiscal stability - among the main priorities of the government. But
it will not be at the expense of the investment program
Exhibit 7: The government plans to reduce gradually the budget deficit in order to reach balanced budget after 2018
Exhibit 8: Capital expenditure, share of total budget expendi-ture
Source: BNB
Source: MoF
-12,000
-10,000
-8,000
-6,000
-4,000
-2,000
0
2,000
4,000
6,000
Current transfers, net
Balance on income
Balance on services
Balance on goods
Current account
Production and supply of
electricity, gas and
water, 29.6%
Manufactu-ring, 15.3%
Wholesale and retail
trade,13.3%
Mining, 12.1%
Transport, storage and communicati
on, 7.2%
Transport, storage and communi-
cation, 7.2%
Hotels and restaurant,
2.6%
Other, 16.6%
-5%
-4%
-3%
-2%
-1%
0%
1%
2%
3%
4% Too optimistic
budget revenue projections
Negative impact
of the global financial and economic crisis
16.9%
13.8%
13.7%
11.4%
13.2%
13.5%
15.4%
15.8%
15.2%15.5%
0%
2%
4%
6%
8%
10%
12%
14%
16%
18%
2008 2009 2010 2011 2012 2013 2014 2015 2016 2017
The Macro View
DATE: MARCH, 2015 - 9 -
Despite the announced 10% cut in public administration wage costs and some changes in the ministries’ structure, Bulgaria’s 2015 budget is not a budget of reform. We are also skeptic about the public officials’ reduction, because this will affect negatively the political image of the government at next election. Nevertheless, in contrast to the last year budg-et, this one appears to be considerably more realistic and we do not expect a budget revi-sion in 2015. The lower oil price will affect negatively revenue, but this will be partly com-pensated by higher private consumption and higher than initially planned economic growth. The government forecast of 0.8% GDP growth in 2015 is rather conservative given the already started employment increase, “unfrozen” EU programs and increased capital ex-penditure. Some threat could come from systematic lack of reforms and measures, aimed to improve the public and social systems. This could once again lead to deficit increase in upcoming years.
Some threat for the budget could come from lack of reforms
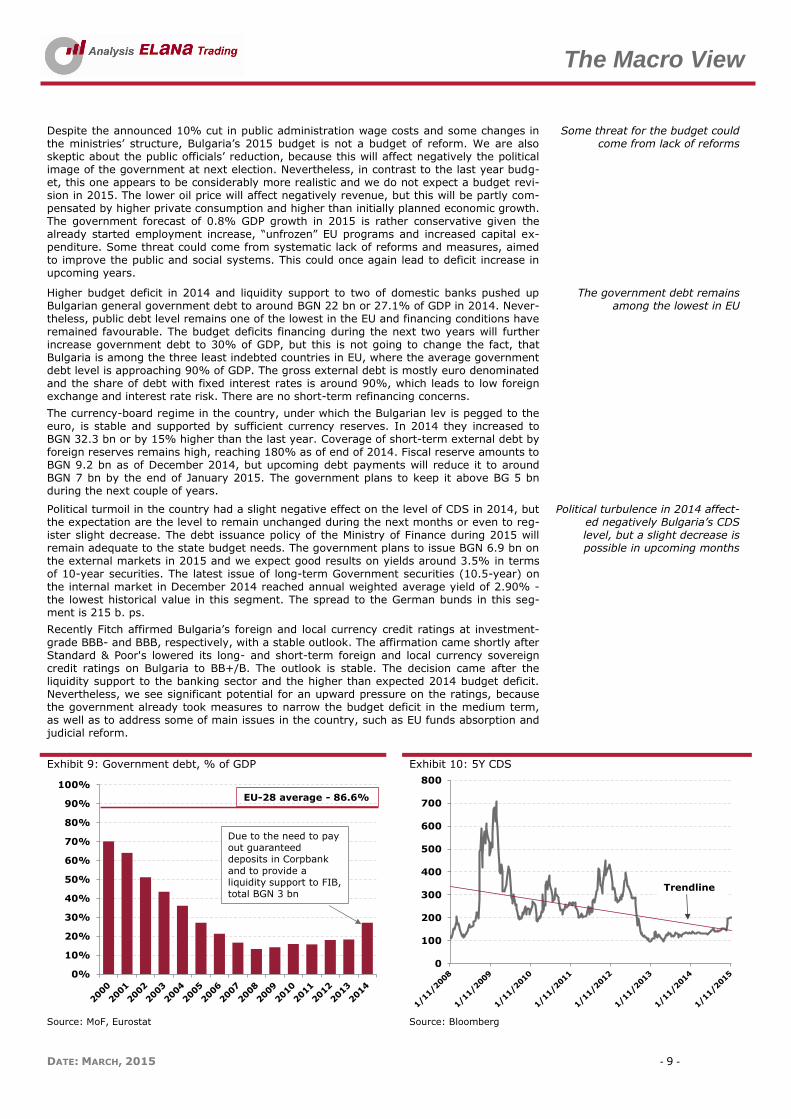
Higher budget deficit in 2014 and liquidity support to two of domestic banks pushed up Bulgarian general government debt to around BGN 22 bn or 27.1% of GDP in 2014. Never-theless, public debt level remains one of the lowest in the EU and financing conditions have remained favourable. The budget deficits financing during the next two years will further increase government debt to 30% of GDP, but this is not going to change the fact, that Bulgaria is among the three least indebted countries in EU, where the average government debt level is approaching 90% of GDP. The gross external debt is mostly euro denominated and the share of debt with fixed interest rates is around 90%, which leads to low foreign exchange and interest rate risk. There are no short-term refinancing concerns.
The currency-board regime in the country, under which the Bulgarian lev is pegged to the euro, is stable and supported by sufficient currency reserves. In 2014 they increased to BGN 32.3 bn or by 15% higher than the last year. Coverage of short-term external debt by foreign reserves remains high, reaching 180% as of end of 2014. Fiscal reserve amounts to BGN 9.2 bn as of December 2014, but upcoming debt payments will reduce it to around BGN 7 bn by the end of January 2015. The government plans to keep it above BG 5 bn during the next couple of years.
The government debt remains among the lowest in EU
Political turmoil in the country had a slight negative effect on the level of CDS in 2014, but the expectation are the level to remain unchanged during the next months or even to reg-ister slight decrease. The debt issuance policy of the Ministry of Finance during 2015 will remain adequate to the state budget needs. The government plans to issue BGN 6.9 bn on the external markets in 2015 and we expect good results on yields around 3.5% in terms of 10-year securities. The latest issue of long-term Government securities (10.5-year) on the internal market in December 2014 reached annual weighted average yield of 2.90% - the lowest historical value in this segment. The spread to the German bunds in this seg-ment is 215 b. ps.
Recently Fitch affirmed Bulgaria’s foreign and local currency credit ratings at investment-
grade BBB- and BBB, respectively, with a stable outlook. The affirmation came shortly after Standard & Poor's lowered its long- and short-term foreign and local currency sovereign credit ratings on Bulgaria to BB+/B. The outlook is stable. The decision came after the liquidity support to the banking sector and the higher than expected 2014 budget deficit. Nevertheless, we see significant potential for an upward pressure on the ratings, because the government already took measures to narrow the budget deficit in the medium term, as well as to address some of main issues in the country, such as EU funds absorption and judicial reform.
Political turbulence in 2014 affect-ed negatively Bulgaria’s CDS level, but a slight decrease is possible in upcoming months
Exhibit 9: Government debt, % of GDP Exhibit 10: 5Y CDS
Source: MoF, Eurostat
Source: Bloomberg
0%
10%
20%
30%
40%
50%
60%
70%
80%
90%
100%
EU-28 average - 86.6%
Due to the need to pay
out guaranteed
deposits in Corpbank
and to provide a
liquidity support to FIB,
total BGN 3 bn
0
100
200
300
400
500
600
700
800
Trendline
The Macro View
DATE: MARCH, 2015 - 10 -
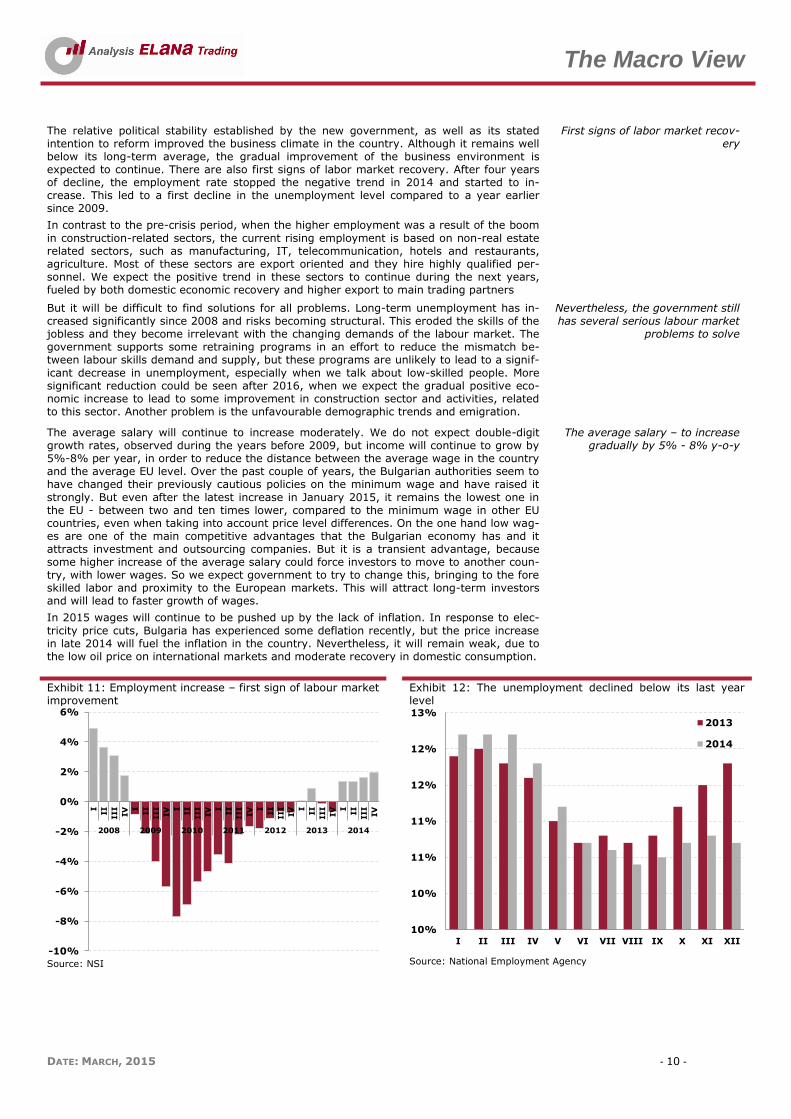
The relative political stability established by the new government, as well as its stated intention to reform improved the business climate in the country. Although it remains well below its long-term average, the gradual improvement of the business environment is expected to continue. There are also first signs of labor market recovery. After four years of decline, the employment rate stopped the negative trend in 2014 and started to in-crease. This led to a first decline in the unemployment level compared to a year earlier since 2009.
In contrast to the pre-crisis period, when the higher employment was a result of the boom
in construction-related sectors, the current rising employment is based on non-real estate related sectors, such as manufacturing, IT, telecommunication, hotels and restaurants, agriculture. Most of these sectors are export oriented and they hire highly qualified per-sonnel. We expect the positive trend in these sectors to continue during the next years, fueled by both domestic economic recovery and higher export to main trading partners
First signs of labor market recov-ery
But it will be difficult to find solutions for all problems. Long-term unemployment has in-creased significantly since 2008 and risks becoming structural. This eroded the skills of the jobless and they become irrelevant with the changing demands of the labour market. The government supports some retraining programs in an effort to reduce the mismatch be-tween labour skills demand and supply, but these programs are unlikely to lead to a signif-
icant decrease in unemployment, especially when we talk about low-skilled people. More significant reduction could be seen after 2016, when we expect the gradual positive eco-nomic increase to lead to some improvement in construction sector and activities, related to this sector. Another problem is the unfavourable demographic trends and emigration.
Nevertheless, the government still has several serious labour market
problems to solve
The average salary will continue to increase moderately. We do not expect double-digit growth rates, observed during the years before 2009, but income will continue to grow by 5%-8% per year, in order to reduce the distance between the average wage in the country and the average EU level. Over the past couple of years, the Bulgarian authorities seem to have changed their previously cautious policies on the minimum wage and have raised it
strongly. But even after the latest increase in January 2015, it remains the lowest one in the EU - between two and ten times lower, compared to the minimum wage in other EU countries, even when taking into account price level differences. On the one hand low wag-es are one of the main competitive advantages that the Bulgarian economy has and it attracts investment and outsourcing companies. But it is a transient advantage, because some higher increase of the average salary could force investors to move to another coun-try, with lower wages. So we expect government to try to change this, bringing to the fore skilled labor and proximity to the European markets. This will attract long-term investors and will lead to faster growth of wages.
In 2015 wages will continue to be pushed up by the lack of inflation. In response to elec-
tricity price cuts, Bulgaria has experienced some deflation recently, but the price increase in late 2014 will fuel the inflation in the country. Nevertheless, it will remain weak, due to the low oil price on international markets and moderate recovery in domestic consumption.
The average salary – to increase gradually by 5% - 8% y-o-y
Exhibit 11: Employment increase – first sign of labour market improvement
Exhibit 12: The unemployment declined below its last year level
Source: NSI
Source: National Employment Agency
-10%
-8%
-6%
-4%
-2%
0%
2%
4%
6%
I
II
III
IV I
II
III
IV I
IІ
III
IV I
IІ
III
IV I
IІ
III
IV I
IІ
III
IV I
IІ
III
IV
2008 2009 2010 2011 2012 2013 2014
10%
10%
11%
11%
12%
12%
13%
I II III IV V VI VII VIII IX X XI XII
2013
2014

Factors to Watch
THE POLITICAL MOVES
Bulgaria is ruled by a center-right coalition government, which came to power after an early election, held in the autumn of 2014. The center-right GERB party, which was also in power in 2009-2013, won the elections but did not get a full majority to rule alone. So, after long negotiations GERB signed a coalition agreement with the rightist party of the Reformist Bloc. But as the two had only 107 MPs (not enough for a majority of 121), two more parties agreed to support the cabinet - the center-left ABV, which obtained the post of Deputy Prime Minister and Minister of Labour and Social Policy, as well as the nationalist Patriotic Front, although it is not represented in government.
Although seemingly fragile and with low survival expectations, the coalition cabinet already
withstood some serious obstacles. Recovering the European Commission’s trust and re-sumption of blocked EU payments were among the first steps taken by the new coalition as the government includes many Brussels familiar faces such as the first Bulgarian EU com-missioner (2007-2009) Meglena Kuneca and the former member of the European parlia-ment Ivailo Kalfin. In addition, to their administrative experience, they would certainly make the political dialogue between Bulgaria and the EU easier.
2014 early elections
brought back to power a
center-right government
Will it be a government of reforms?
It certainly has great chances to be a reformist government. The country still has a number of problems to solve and society will welcome any political will to reform problematic sec-tors such as the judiciary, health care, energy, education, pension and social security sys-tems. The cabinet already included those sectors in its Government Program for Sustaina-ble Development of the Republic of Bulgaria (2014-2018), which encompasses the priori-ties of the coalition parties. The program covers 21 fields, including judicial, healthcare, education, pension, energy, elections law, demographic policy reforms together with infra-structure and economic development.
However, the upcoming municipal elections in the autumn of 2015 will be a major stress
test for the coalition making the coalition partners cautious to any radical changes, which could lead any vote loss. Therefore, we expect the government to “manage” the current status in 2015, rather than to try to implement any radical reforms in the coming months.
A good elections result will confirm societal support of the government and give confidence
to the coalition parties to make deeper reforms. Nevertheless, reform discussions are heavily underway. We have already seen initial steps in the judicial and energy sectors, which are expected to increase the public and business confidence in the judicial system and reduce the energy sector indebtedness. But even without any significant reforms dur-ing the first year, the most important thing is that the vision outlined by the government is Bulgaria to be a European country and it will work for supremacy of the law and transpar-ency. The previous government had pronounced deficit in both, so even small steps in this direction will be well welcomed by the society and business.
It has great chance to be
a reformist government
Will the cabinet survive a full term?
Although inter-coalition conflicts are inevitable, which could lead to early elections, the government is trying to impose a new culture of dialogue between partners in the coalition. Recent example for this is pension system reforms, which led to a major disagreement between the coalition partners. Currently, there are talks between them and representa-tives of business and trade unions to come to a sustainable decision. This makes us rather positive about the mid-term stability of the government, because the coalition partners are eager to prove that this type of state management - more open and dialogical, could be implemented in Bulgaria as well. Ruling parties have also an interest to keep the govern-ment stable to the municipal elections at the end of the year, because this will increase their chances for a better election result.
In mid-term the government will remain stable
Worse than expected municipal election results of some of the major coalition parties (GERB or the Reformist Block) could force them to leave the coalition, which will trigger early elections. This will be a sign, that the government policy does not find public support. Nevertheless, we do not consider this as a likely scenario, because the latest political atti-tudes studies shows that major coalition parties have not loss public support.
The long term viability of the government (after H1 2016) will depend on its ability to carry out the outlined reforms, especially in the field of justice and energy. So far, we have seen mostly strategies for reforms and only a few real steps in executing them. But in contrast to the previous government, the current one is finally including them on their immediate agenda and in addition is widely open to EU recommendations. We believe that partly due to government will for reform, partly to EU pressure, the coalition will implement the nec-essary reforms which will affect positively the economy (judicial system reform, education reform), strengthen the business and public support and will increase the chances of the government to last the entire or nearly the term.
Further viability of the govern-ment will depend on the reforms

Factors to Watch
DATE: MARCH, 2015 - 12 -
THE IMPACT OF THE CRISIS IN RUSSIA AND UKRAINE
The conflict between Russia and Ukraine has reduced Bulgarian goods export to the region in 2014 by half. However, the overall impact on the general economy is small as Russia and Ukraine take up less than 5% of total exports.
Nevertheless, export-oriented companies from various sectors of the economy, such as pharmaceutical producers, manufacturers of construction materials, petroleum and bitu-men materials, agricultural producers, suffered losses. Tourism and real estate were also affected as tourists from the conflict areas and holiday home purchases from Rus-sian/Ukrainian investors declined. In addition, the ruble devaluation posts a significant risk to many industries in the mid-term. We expect tourism and construction to be further
affected in 2015 as a number of large Russian tour operators went bankrupt.
2013 was the best year for the Bulgarian exports to Ukraine as the latter’s share increased
to almost 2% of the total export. However, due to military operation in Eastern Ukraine, it is expected to shrink by 2/3 y-o-y in 2014 and to be by EUR 270.0 m lower compared to 2013. Thus, Ukrainian exports’ share will decline to the 2009.
The export contraction to the Russian market, however, is expected to be significantly
smaller, declining by 13% y-o-y in 2014. The Russian market takes up around 2.5% of the total exports and in contrast to Ukraine is rather stable during the last few years. The ru-ble’s devaluation at the end of 2014 did not bring additional weakness in sales to Russia, which suggests that a limited impact should be expected in the future.
Severe impact on Bulgarian
export to Ukraine
Less impact from Russia
The main risks for the Bulgarian economy stemming from the Russian/Ukrainian conflict are concentrated in two directions – tourism and real estate.
In 2014, Russian tourists visiting Bulgaria decreased by 4% to 656K. This negative trend is
expected to continue in 2015 as ruble devaluation will make Bulgaria less attractive com-pared to similar service Turkey, for example. In addition, the forthcoming summer season will be affected negatively from the bankruptcies of large Russian tour operators and the absence of charter flights for the summer months.
However, we expect a gradual shift from organized tourism to individual visits in owned vacation properties as Russian investors own approximately 400K to 500K vacation homes in Bulgaria. Thus, the number of tourists that stay in owned properties will increase, while the revenues of hotels will decline.
Fewer Russian tourists and real estate investors to affect tourist
and construction sectors
Nevertheless, the real estate sector will be seriously affected. Agents already reported a sizable decrease in buying interest from their Russian clients, mainly on real estates in Bulgarian resorts and Black Sea cities. The decrease of tourists should also lead to fewer real estate buyers in these parts of the country. Real estate agents estimate a decline in the number of deals from 8% to 35% for different areas of the Black Sea coast.
At the same time, the construction statistics registered a peak in housing starts during the
first half of 2014. The sudden decrease of demand should create a glut on the market, followed by lower prices and eventual financial losses for construction companies and fi-nancing institutions.
Exhibit 13: Export to Russia declined moderately’ although the importance of the market decreased in 2013
Exhibit 14: The trade with Ukraine was hurt harder and will continue to contract faster than export to Russia
Source: BNB
Source: BNB
0.0%
0.5%
1.0%
1.5%
2.0%
2.5%
3.0%
3.5%
0
100
200
300
400
500
600
700Export in EUR m
Share of total (right scale)
0.0%
0.5%
1.0%
1.5%
2.0%
2.5%
0
50
100
150
200
250
300
350
400
450Export in EUR m
Share of total (right scale)

Factors to Watch
DATE: MARCH, 2015 - 13 -
GREECE TURMOIL AND BULGARIA
This year started with a deja-vu to 2012, when the Greek crisis and the possible exit of the country from the Eurozone shattered the markets. Greece remains a primary concern for investors due to the change in the government policy toward less severe austerity measures. The main difference to 2012 hides in the scale of contagion to other Eurozone countries. In the past, investors reacted very strongly to the insolvency risks of peripheral countries and heavily sold government bonds, thus leading to difficulties in financing budg-et deficits. Greece looks an isolated case this time, although it doesn’t make risks lower for the Bulgarian economy. We don’t consider the Grexit as a very likely scenario. On the con-trary, we expect Greece to maintain the euro, whereas the change in the political elite will
lead to shift in EU policy toward less austerity and more stimuli from the governments. This process already started and the next step is the QE policy of ECB that aims to prevent insolvency of peripheral countries. Moreover, the policy will try to improve the confidence to the Eurozone.
Despite the current difficulties, we do not expect Greece to exit the
Eurozone
Greece is the third largest investor in Bulgaria, after Austria and Netherlands. If we do not take into account Netherlands, which offers to non-resident corporate and individual clients a wide range of tax advantages and therefore is used as a place of registration of compa-nies from different countries, Greece is the second largest foreign investor in Bulgaria with a share of 7% of the total FDIs. Greece is also a major trading partner of Bulgaria. The export to our neighboring country represents 7% of total sales abroad. Greek businesses play a big role in Bulgaria’s large scale infrastructure projects and many Greeks own textile factories. So, any worsening of the Greek economy will have negative impact on Bulgaria.
But statistical data shows, that despite the unfavorable economic situation in Greece, the export to the county remains relatively unchanged during the last four years. This is a sign that Bulgaria exports to Greece mainly industrial goods and raw materials, rather than consumer goods. There is also no negative impact on tourists. In 2014 the number of Greek tourists, visiting Bulgaria increases by 10% compared to 2013.
Trade with Greece remains rela-tively unchanged. There is an
increase of Greek tourists
The Bulgarian banking system is another sector with significant Greek presence. On the local market operate three banks subsidiaries of Greek banks and one branch. Their assets exceed 23% of total assets of the banking system in the country. Nevertheless, the Bulgar-ian banking system is more resilient than the close connections to the Greek financial insti-tutions might suggest. The implication of any systematic shock in Greece might only affect directly the branch of Alpha Bank. The other three banks (owned by NBG, Eurobank and Piraeus) cover the capital adequacy requirements that are higher than other EU countries.
After 2008 the liabilities of banks to foreign counterparties, mainly the mother companies,
declined substantially. Bulgarian banks managed to attract deposits from residents, while the slow growth of assets contributed to the liquidity glut in the system. Those factors limit the risks on banks if Greece faces any problems in the financial system or if it exits the Eurozone. We don’t expect Bulgarian banks to have problems with capital adequacy or to be forced to restructure their liabilities and to lend to their mother companies. Most likely, the Bulgarian central bank would implement strong measures to limit the capital outflows. Therefore, we consider the banking system as immune to the Grexit. Nevertheless, the banks that work with many Greek companies will report operating losses from NPLs or from the decline of revenues.
Only limited impact on the bank-ing sector is expected
Exhibit 15: The export to Greece remains relatively stable during the last four years
Exhibit 26: The banks with Greek ownership started gradually to improve their results
Source: BNB
Source: BNB, Elana Trading
0%
2%
4%
6%
8%
10%
12%
0
200
400
600
800
1000
1200
1400
1600
1800 Export in EUR m
Share of total (right scale)
0%
5%
10%
15%
20%
25%
30%
-100
-50
0
50
100
150
200
250
300
350
400
2008 2009 2010 2011 2012 2013 2014
BG
N m
Net profit Assets, share of toral, %

The Market View
THE MARKET VIEW
The Market View
DATE: MARCH, 2015 - 15 -
OPPORTUNITIES ON THE HORIZON
Two years in a row Bulgarian stocks started January on a positive note. 2015 brings more cau-
tiousness among investors and is a reminiscence of the weak 2012, but offers much better buying opportunities.
The 2012 resemblances are several. The first is Greece with its debt problems that extend to the Eurozone through the uncertainty of a possible exit of the country from the monetary union or another round of debt problems of Portugal, Spain or even extension of technical defaults to Italy. EU economies are stagnating and despite the measures of ECB, the prospects for growth are far from being strong. This is negative for Bulgarian stocks as domestic companies are mostly export-ers and depend heavily on the economic growth in EU.
2015, however, is also a bit different from 2012. Political factors weight on the stock market after the early elections. Nevertheless, the ruling coalition looks stable and started the needed reforms in many sectors. Another difference is the steep decline of interest rates on deposits in 2014 which creates a positive environment for higher risk appetite. This will support the market in the long term, while the current subdued trading is due to the cautious stance of buyers that look for the bottom. What the new government may improve is reform transparence and dialog with all inter-ested parties so that any drastic moves do not take investors by surprise as in the case of the started pension reform. Changes in the latter were made with no due discussion surprising both society and investors. The political setback that followed to hear all interested parties, however,
returned some of the confidence lost.
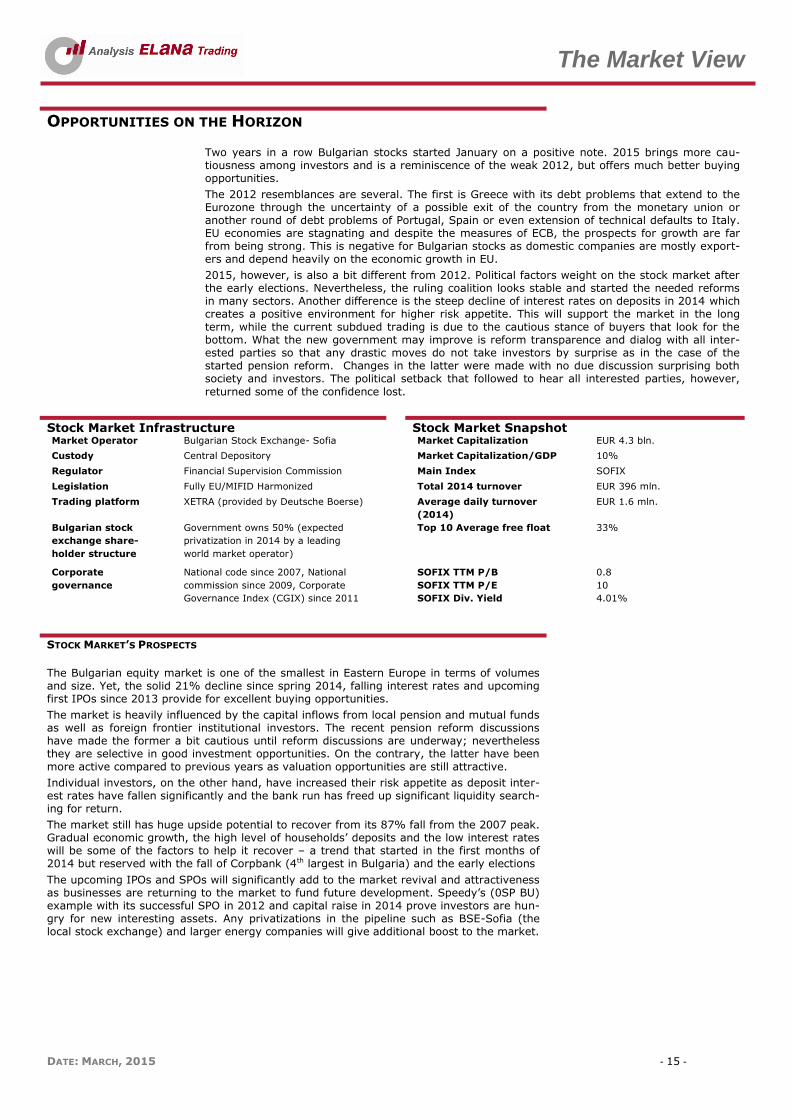
Stock Market Infrastructure Stock Market Snapshot Market Operator Bulgarian Stock Exchange- Sofia Market Capitalization EUR 4.3 bln.
Custody Central Depository Market Capitalization/GDP 10%
Regulator Financial Supervision Commission Main Index SOFIX
Legislation Fully EU/MIFID Harmonized Total 2014 turnover EUR 396 mln.
Trading platform XETRA (provided by Deutsche Boerse) Average daily turnover
(2014)
EUR 1.6 mln.
Bulgarian stock
exchange share-
holder structure
Government owns 50% (expected
privatization in 2014 by a leading
world market operator)
Top 10 Average free float 33%
Corporate
governance
National code since 2007, National
commission since 2009, Corporate
Governance Index (CGIX) since 2011
SOFIX TTM P/B
SOFIX TTM P/E
SOFIX Div. Yield
0.8
10
4.01%
STOCK MARKET’S PROSPECTS
The Bulgarian equity market is one of the smallest in Eastern Europe in terms of volumes and size. Yet, the solid 21% decline since spring 2014, falling interest rates and upcoming first IPOs since 2013 provide for excellent buying opportunities.
The market is heavily influenced by the capital inflows from local pension and mutual funds as well as foreign frontier institutional investors. The recent pension reform discussions have made the former a bit cautious until reform discussions are underway; nevertheless they are selective in good investment opportunities. On the contrary, the latter have been more active compared to previous years as valuation opportunities are still attractive.
Individual investors, on the other hand, have increased their risk appetite as deposit inter-est rates have fallen significantly and the bank run has freed up significant liquidity search-ing for return.
The market still has huge upside potential to recover from its 87% fall from the 2007 peak. Gradual economic growth, the high level of households’ deposits and the low interest rates will be some of the factors to help it recover – a trend that started in the first months of 2014 but reserved with the fall of Corpbank (4th largest in Bulgaria) and the early elections
The upcoming IPOs and SPOs will significantly add to the market revival and attractiveness as businesses are returning to the market to fund future development. Speedy’s (0SP BU) example with its successful SPO in 2012 and capital raise in 2014 prove investors are hun-gry for new interesting assets. Any privatizations in the pipeline such as BSE-Sofia (the local stock exchange) and larger energy companies will give additional boost to the market.
The Market View
DATE: MARCH, 2015 - 16 -
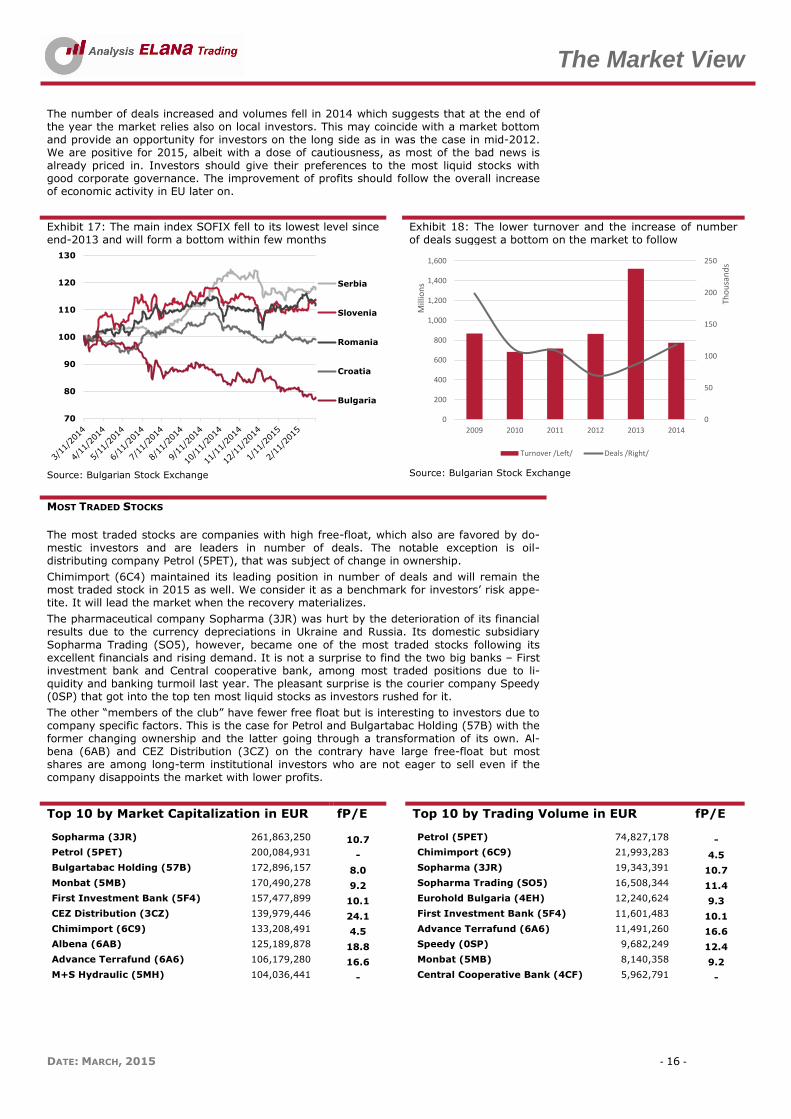
The number of deals increased and volumes fell in 2014 which suggests that at the end of the year the market relies also on local investors. This may coincide with a market bottom and provide an opportunity for investors on the long side as in was the case in mid-2012. We are positive for 2015, albeit with a dose of cautiousness, as most of the bad news is already priced in. Investors should give their preferences to the most liquid stocks with good corporate governance. The improvement of profits should follow the overall increase of economic activity in EU later on.
Exhibit 17: The main index SOFIX fell to its lowest level since end-2013 and will form a bottom within few months
Exhibit 18: The lower turnover and the increase of number of deals suggest a bottom on the market to follow
Source: Bulgarian Stock Exchange
Source: Bulgarian Stock Exchange
MOST TRADED STOCKS
The most traded stocks are companies with high free-float, which also are favored by do-mestic investors and are leaders in number of deals. The notable exception is oil-distributing company Petrol (5PET), that was subject of change in ownership.
Chimimport (6C4) maintained its leading position in number of deals and will remain the most traded stock in 2015 as well. We consider it as a benchmark for investors’ risk appe-tite. It will lead the market when the recovery materializes.
The pharmaceutical company Sopharma (3JR) was hurt by the deterioration of its financial results due to the currency depreciations in Ukraine and Russia. Its domestic subsidiary
Sopharma Trading (SO5), however, became one of the most traded stocks following its excellent financials and rising demand. It is not a surprise to find the two big banks – First investment bank and Central cooperative bank, among most traded positions due to li-quidity and banking turmoil last year. The pleasant surprise is the courier company Speedy (0SP) that got into the top ten most liquid stocks as investors rushed for it.
The other “members of the club” have fewer free float but is interesting to investors due to company specific factors. This is the case for Petrol and Bulgartabac Holding (57B) with the former changing ownership and the latter going through a transformation of its own. Al-bena (6AB) and CEZ Distribution (3CZ) on the contrary have large free-float but most shares are among long-term institutional investors who are not eager to sell even if the company disappoints the market with lower profits.
Top 10 by Market Capitalization in EUR
fP/E Top 10 by Trading Volume in EUR fP/E
Sopharma (3JR) 261,863,250 10.7 Petrol (5PET) 74,827,178 -
Petrol (5PET) 200,084,931 - Chimimport (6C9) 21,993,283 4.5
Bulgartabac Holding (57B) 172,896,157 8.0 Sopharma (3JR) 19,343,391 10.7
Monbat (5MB) 170,490,278 9.2 Sopharma Trading (SO5) 16,508,344 11.4
First Investment Bank (5F4) 157,477,899 10.1 Eurohold Bulgaria (4EH) 12,240,624 9.3
CEZ Distribution (3CZ) 139,979,446 24.1 First Investment Bank (5F4) 11,601,483 10.1
Chimimport (6C9) 133,208,491 4.5 Advance Terrafund (6A6) 11,491,260 16.6
Albena (6AB) 125,189,878 18.8 Speedy (0SP) 9,682,249 12.4
Advance Terrafund (6A6) 106,179,280 16.6 Monbat (5MB) 8,140,358 9.2
M+S Hydraulic (5MH) 104,036,441 - Central Cooperative Bank (4CF) 5,962,791 -
70
80
90
100
110
120
130
Serbia
Slovenia
Romania
Croatia
Bulgaria
0
50
100
150
200
250
0
200
400
600
800
1,000
1,200
1,400
1,600
2009 2010 2011 2012 2013 2014
Tho
usa
nd
s
Mill
ion
s
Turnover /Left/ Deals /Right/

Investment Picks
TOP INVESTMENT PICKS

Investment Picks
DATE: MARCH, 2015 - 18 -
AGRICULTURE
Bulgaria is a traditional producer and exporter of grains. The main markets for wheat are Middle East and EU countries. The production volumes depend on arable land each year, which is in direct connection to the previous year’s grain prices. Agricultural companies receive subsidies based on the arable land. Profits in the sector are highly correlated to subsidies, while volumes traded are
The process of land consolidation has been speeded up during the past ten years due to the rising prices and availability of credit. Current land market conditions are favorable for large grain pro-ducers, although the severe competition among them raised rents.
Exhibit 19: Global supply and demand of wheat suggest con-tinuation of annual surplus and subdued prices
Exhibit 20: Average prices of agricultural land increased steadily due to the strong profits in the sector
Source: USDA
Source: National Statistical Institute
TOP PICK: AGRIA GROUP HOLDING
Agria Group is a holding that includes companies in the field of agricultural production and grain trading and processing. The subsidiaries of Agria operate in Northeast Bulgaria with close proximity to the main Bulgarian maritime ports, providing the logistic capacity for the Group to be one of the largest grain exporters in the country. The grain trade contributes to more than 80% of consolidated revenues of Agria.
The agricultural production is the second largest segment in the Group. The main cultures grown are wheat, barley, maize, sunflower and rapeseed.
The strategy of the Group is to acquire smaller companies in the field of agri-cultural production. The benefit is hidden in the selection of land plots and production factors, including labor force. Moreover, Agria avoids the pitfall of paying higher than average rents or prices for land since it is not in direct completion for the rights to farm. The land Agria owns through its subsidiaries amounted 5,300 ha at the end-2014.
MARKET DATA
Shares Outstanding: 6.8m
Share Capital: BGN 6.8m
Free-float: 20%
Treasury Shares 0%
Market Cap.: BGN 60.5m
Avg. Daily Vol.: BGN 30,000
52 Weeks Range: BGN 4.7-9.5
Bloomberg A72 BU
One year target price BGN 15.11
Elana Recommendation BUY
In ‘000 BGN 2012 2013 2014 2015F 2012 2013 2014 2015F
Revenues 87,220 153,754 132,340 152,191 Total Assets 132,197 143,278 153,309 177,661
EBITDA 14,393 16,626 21,862 25,241 Total Debt 68,453 64,461 64,358 71,530
EBIT 10,467 13,675 18,181 21,307 Book Value 51,635 60,745 70,989 87,108
Net Profit 6,165 9,394 14,829 16,119 Enterprise Value 89,192 96,106 118,897 131,032
EBITDA Margin 16.50% 10.81% 16.52% 16.59% Market Cap 21,413 33,653 57,800 62,900
EBIT Margin 12.00% 8.89% 13.74% 14.00% Current Price 3.15 4.95 8.50 9.25
Net Profit Margin 7.07% 6.11% 11.21% 10.59% P/E 3.47 3.58 3.90 3.90
ROE 12.60% 16.72% 24.19% 20.39% P/B 0.41 0.55 0.81 0.72
ROA 5.44% 6.82% 10.39% 9.74% EV/EBITDA 6.20 5.78 5.44 5.19
500
550
600
650
700
750
19
91
19
92
19
93
19
94
19
95
19
96
19
97
19
98
19
99
20
00
20
01
20
02
20
03
20
04
20
05
20
06
20
07
20
08
20
09
20
10
20
11
20
12
20
13
20
14
Milli
on
Metr
ic T
on
s
Supply Demand
0
50
100
150
200
250
300
350
2010 2011 2012 2013
EU
R p
er h
a
Northeast Bulgaria Country Average
+8.5%
+9.6%
+8%
+20%
+25%
+22%
Investment Picks
DATE: MARCH, 2015 - 19 -
FINANCIAL ANALYSIS
The subsidizing of agricultural production in Bulgaria contributes substantially to the finan-cial results of Agria. The payments depend on the arable land and the investments in ma-chine and equipment of agricultural producers. To avoid concentration in payments and to support broad range of agricultural producers, the government approved a new scheme for subsidies that will affect large grain producers. Agria did not expect any decline of subsi-dies after the implementations of the new rules.
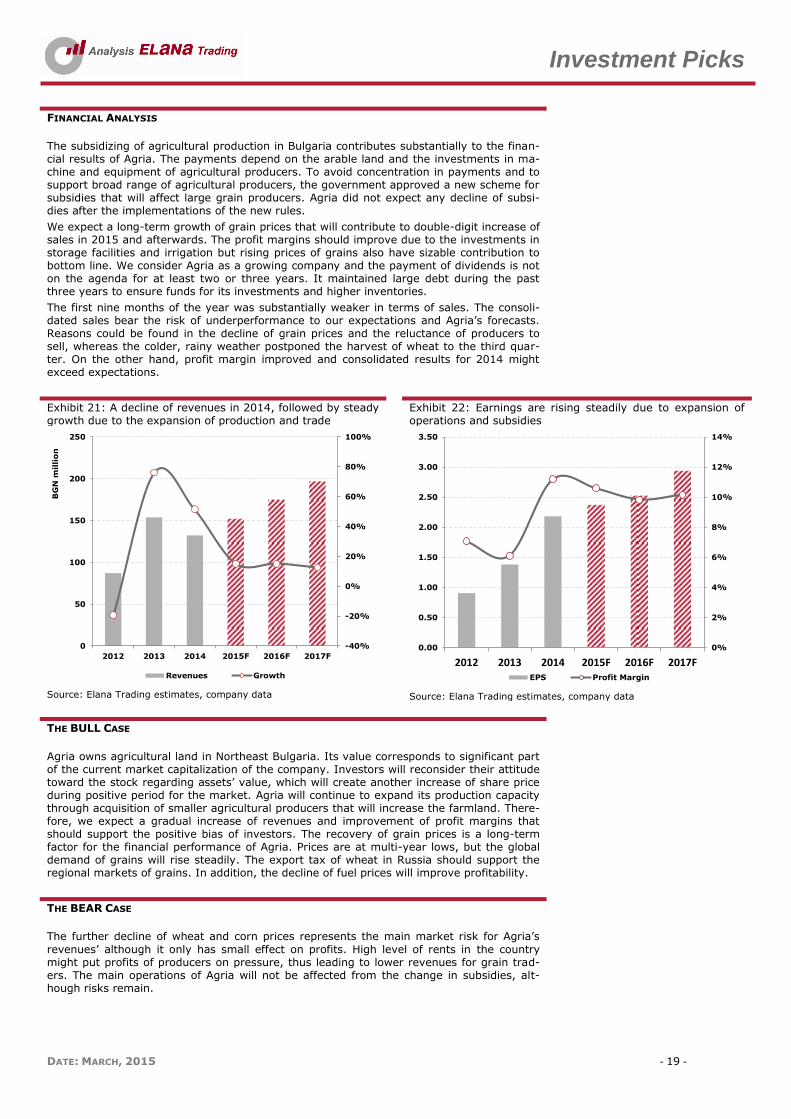
We expect a long-term growth of grain prices that will contribute to double-digit increase of sales in 2015 and afterwards. The profit margins should improve due to the investments in storage facilities and irrigation but rising prices of grains also have sizable contribution to bottom line. We consider Agria as a growing company and the payment of dividends is not on the agenda for at least two or three years. It maintained large debt during the past three years to ensure funds for its investments and higher inventories.
The first nine months of the year was substantially weaker in terms of sales. The consoli-dated sales bear the risk of underperformance to our expectations and Agria’s forecasts. Reasons could be found in the decline of grain prices and the reluctance of producers to sell, whereas the colder, rainy weather postponed the harvest of wheat to the third quar-ter. On the other hand, profit margin improved and consolidated results for 2014 might exceed expectations.
Exhibit 21: A decline of revenues in 2014, followed by steady growth due to the expansion of production and trade
Exhibit 22: Earnings are rising steadily due to expansion of operations and subsidies
Source: Elana Trading estimates, company data
Source: Elana Trading estimates, company data
THE BULL CASE
Agria owns agricultural land in Northeast Bulgaria. Its value corresponds to significant part of the current market capitalization of the company. Investors will reconsider their attitude toward the stock regarding assets’ value, which will create another increase of share price during positive period for the market. Agria will continue to expand its production capacity through acquisition of smaller agricultural producers that will increase the farmland. There-fore, we expect a gradual increase of revenues and improvement of profit margins that should support the positive bias of investors. The recovery of grain prices is a long-term factor for the financial performance of Agria. Prices are at multi-year lows, but the global demand of grains will rise steadily. The export tax of wheat in Russia should support the regional markets of grains. In addition, the decline of fuel prices will improve profitability.
THE BEAR CASE
The further decline of wheat and corn prices represents the main market risk for Agria’s
revenues’ although it only has small effect on profits. High level of rents in the country might put profits of producers on pressure, thus leading to lower revenues for grain trad-ers. The main operations of Agria will not be affected from the change in subsidies, alt-hough risks remain.
-40%
-20%
0%
20%
40%
60%
80%
100%
0
50
100
150
200
250
2012 2013 2014 2015F 2016F 2017F
BG
N m
illi
on
Revenues Growth
0%
2%
4%
6%
8%
10%
12%
14%
0.00
0.50
1.00
1.50
2.00
2.50
3.00
3.50
2012 2013 2014 2015F 2016F 2017FEPS Profit Margin
Investment Picks
DATE: MARCH, 2015 - 20 -
AUTOMOTIVE & ELECTRICAL EQUIPMENT
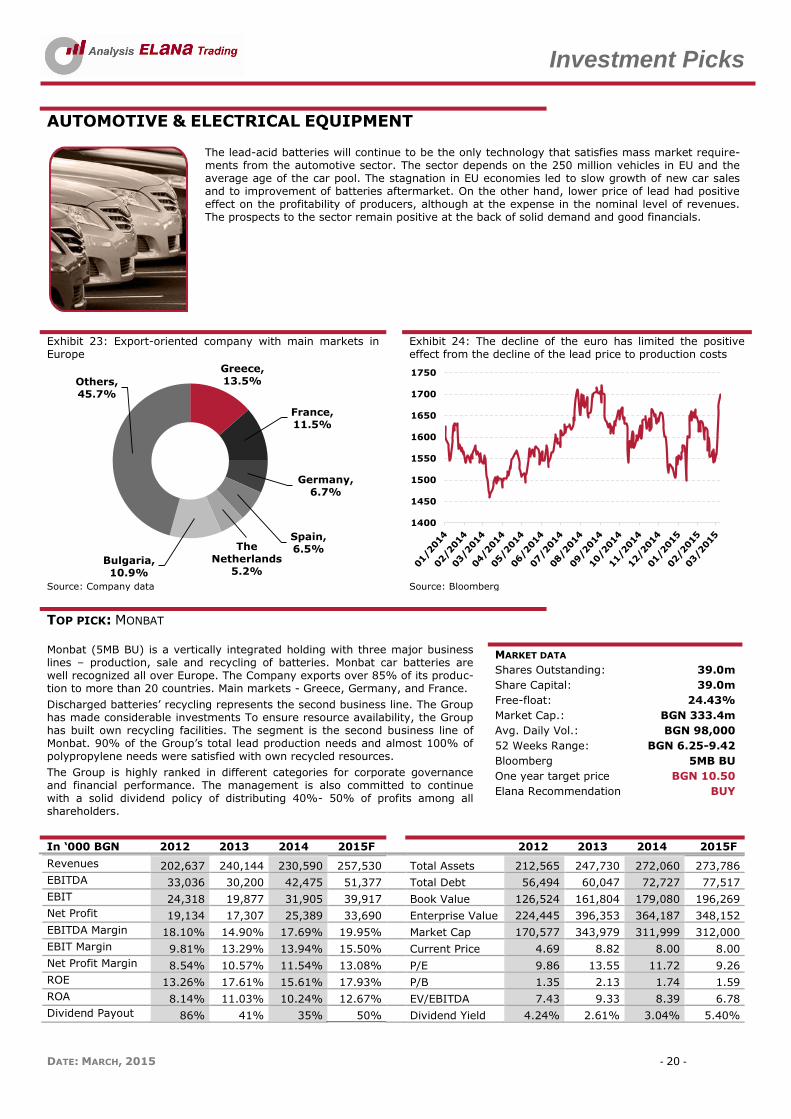
The lead-acid batteries will continue to be the only technology that satisfies mass market require-ments from the automotive sector. The sector depends on the 250 million vehicles in EU and the average age of the car pool. The stagnation in EU economies led to slow growth of new car sales and to improvement of batteries aftermarket. On the other hand, lower price of lead had positive effect on the profitability of producers, although at the expense in the nominal level of revenues. The prospects to the sector remain positive at the back of solid demand and good financials.
Exhibit 23: Export-oriented company with main markets in Europe
Exhibit 24: The decline of the euro has limited the positive effect from the decline of the lead price to production costs
Source: Company data
Source: Bloomberg
TOP PICK: MONBAT
Monbat (5MB BU) is a vertically integrated holding with three major business lines – production, sale and recycling of batteries. Monbat car batteries are well recognized all over Europe. The Company exports over 85% of its produc-tion to more than 20 countries. Main markets - Greece, Germany, and France.
Discharged batteries’ recycling represents the second business line. The Group has made considerable investments To ensure resource availability, the Group has built own recycling facilities. The segment is the second business line of Monbat. 90% of the Group’s total lead production needs and almost 100% of polypropylene needs were satisfied with own recycled resources.
The Group is highly ranked in different categories for corporate governance and financial performance. The management is also committed to continue with a solid dividend policy of distributing 40%- 50% of profits among all shareholders.
MARKET DATA
Shares Outstanding: 39.0m
Share Capital: 39.0m
Free-float: 24.43%
Market Cap.: BGN 333.4m
Avg. Daily Vol.: BGN 98,000
52 Weeks Range: BGN 6.25-9.42
Bloomberg 5MB BU
One year target price BGN 10.50
Elana Recommendation BUY
In ‘000 BGN 2012 2013 2014 2015F 2012 2013 2014 2015F
Revenues 202,637 240,144 230,590 257,530 Total Assets 212,565 247,730 272,060 273,786
EBITDA 33,036 30,200 42,475 51,377 Total Debt 56,494 60,047 72,727 77,517
EBIT 24,318 19,877 31,905 39,917 Book Value 126,524 161,804 179,080 196,269
Net Profit 19,134 17,307 25,389 33,690 Enterprise Value 224,445 396,353 364,187 348,152
EBITDA Margin 18.10% 14.90% 17.69% 19.95% Market Cap 170,577 343,979 311,999 312,000
EBIT Margin 9.81% 13.29% 13.94% 15.50% Current Price 4.69 8.82 8.00 8.00
Net Profit Margin 8.54% 10.57% 11.54% 13.08% P/E 9.86 13.55 11.72 9.26
ROE 13.26% 17.61% 15.61% 17.93% P/B 1.35 2.13 1.74 1.59
ROA 8.14% 11.03% 10.24% 12.67% EV/EBITDA 7.43 9.33 8.39 6.78
Dividend Payout 86% 41% 35% 50% Dividend Yield 4.24% 2.61% 3.04% 5.40%
Greece, 13.5%
France, 11.5%
Germany, 6.7%
Spain, 6.5%The
Netherlands 5.2%
Bulgaria, 10.9%
Others, 45.7%
1400
1450
1500
1550
1600
1650
1700
1750
Investment Picks
DATE: MARCH, 2015 - 21 -
FINANCIAL ANALYSIS
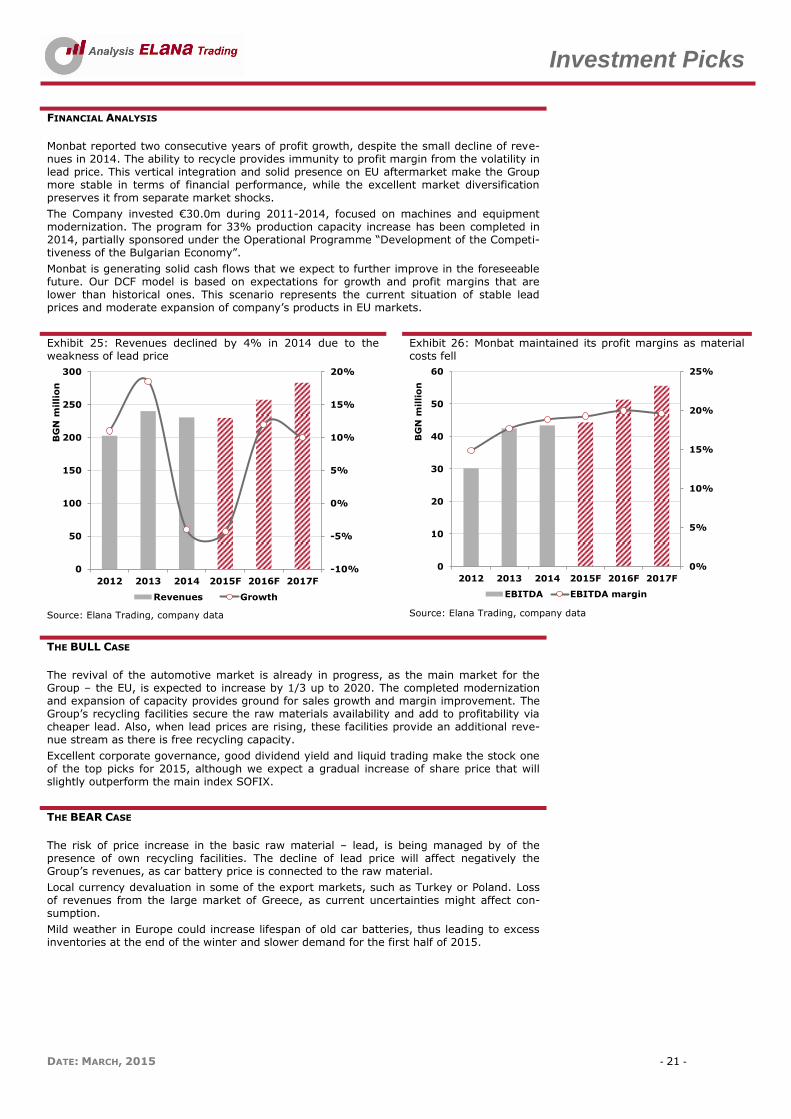
Monbat reported two consecutive years of profit growth, despite the small decline of reve-nues in 2014. The ability to recycle provides immunity to profit margin from the volatility in lead price. This vertical integration and solid presence on EU aftermarket make the Group more stable in terms of financial performance, while the excellent market diversification preserves it from separate market shocks.
The Company invested €30.0m during 2011-2014, focused on machines and equipment modernization. The program for 33% production capacity increase has been completed in 2014, partially sponsored under the Operational Programme “Development of the Competi-tiveness of the Bulgarian Economy”.
Monbat is generating solid cash flows that we expect to further improve in the foreseeable future. Our DCF model is based on expectations for growth and profit margins that are lower than historical ones. This scenario represents the current situation of stable lead prices and moderate expansion of company’s products in EU markets.
Exhibit 25: Revenues declined by 4% in 2014 due to the weakness of lead price
Exhibit 26: Monbat maintained its profit margins as material costs fell
Source: Elana Trading, company data
Source: Elana Trading, company data
THE BULL CASE
The revival of the automotive market is already in progress, as the main market for the Group – the EU, is expected to increase by 1/3 up to 2020. The completed modernization and expansion of capacity provides ground for sales growth and margin improvement. The Group’s recycling facilities secure the raw materials availability and add to profitability via cheaper lead. Also, when lead prices are rising, these facilities provide an additional reve-nue stream as there is free recycling capacity.
Excellent corporate governance, good dividend yield and liquid trading make the stock one of the top picks for 2015, although we expect a gradual increase of share price that will slightly outperform the main index SOFIX.
THE BEAR CASE
The risk of price increase in the basic raw material – lead, is being managed by of the presence of own recycling facilities. The decline of lead price will affect negatively the Group’s revenues, as car battery price is connected to the raw material.
Local currency devaluation in some of the export markets, such as Turkey or Poland. Loss of revenues from the large market of Greece, as current uncertainties might affect con-sumption.
Mild weather in Europe could increase lifespan of old car batteries, thus leading to excess inventories at the end of the winter and slower demand for the first half of 2015.
-10%
-5%
0%
5%
10%
15%
20%
0
50
100
150
200
250
300
2012 2013 2014 2015F 2016F 2017F
BG
N m
illio
n
Revenues Growth
0%
5%
10%
15%
20%
25%
0
10
20
30
40
50
60
2012 2013 2014 2015F 2016F 2017F
BG
N m
illio
n
EBITDA EBITDA margin
Investment Picks
DATE: MARCH, 2015 - 22 -
BANKS & OTHER FINANCIAL SERVICES
CHALLENGING ENVIROMENT, BUT THE SECTOR SUCCESSFULLY ADAPTING TO IT
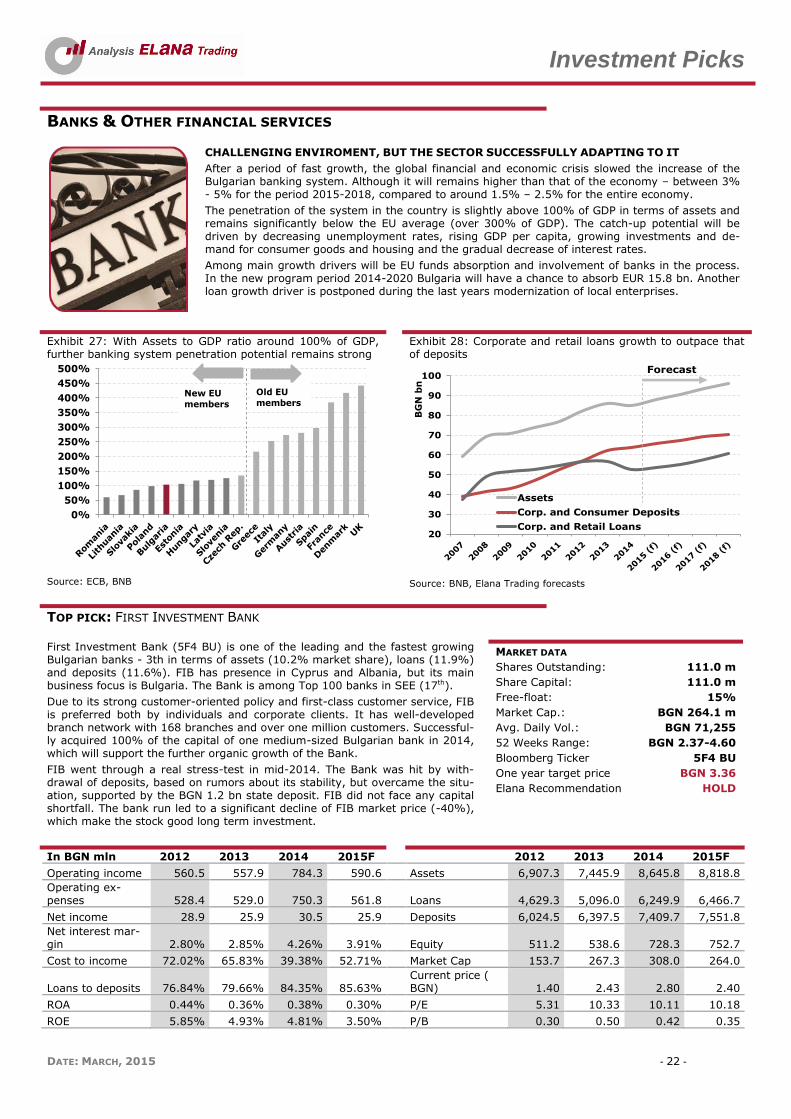
After a period of fast growth, the global financial and economic crisis slowed the increase of the Bulgarian banking system. Although it will remains higher than that of the economy – between 3% - 5% for the period 2015-2018, compared to around 1.5% – 2.5% for the entire economy.
The penetration of the system in the country is slightly above 100% of GDP in terms of assets and remains significantly below the EU average (over 300% of GDP). The catch-up potential will be driven by decreasing unemployment rates, rising GDP per capita, growing investments and de-mand for consumer goods and housing and the gradual decrease of interest rates.
Among main growth drivers will be EU funds absorption and involvement of banks in the process. In the new program period 2014-2020 Bulgaria will have a chance to absorb EUR 15.8 bn. Another loan growth driver is postponed during the last years modernization of local enterprises.
Exhibit 27: With Assets to GDP ratio around 100% of GDP, further banking system penetration potential remains strong
Exhibit 28: Corporate and retail loans growth to outpace that of deposits
Source: ECB, BNB
Source: BNB, Elana Trading forecasts
TOP PICK: FIRST INVESTMENT BANK First Investment Bank (5F4 BU) is one of the leading and the fastest growing Bulgarian banks - 3th in terms of assets (10.2% market share), loans (11.9%) and deposits (11.6%). FIB has presence in Cyprus and Albania, but its main business focus is Bulgaria. The Bank is among Top 100 banks in SEE (17th).
Due to its strong customer-oriented policy and first-class customer service, FIB is preferred both by individuals and corporate clients. It has well-developed branch network with 168 branches and over one million customers. Successful-ly acquired 100% of the capital of one medium-sized Bulgarian bank in 2014, which will support the further organic growth of the Bank.
FIB went through a real stress-test in mid-2014. The Bank was hit by with-drawal of deposits, based on rumors about its stability, but overcame the situ-ation, supported by the BGN 1.2 bn state deposit. FIB did not face any capital shortfall. The bank run led to a significant decline of FIB market price (-40%), which make the stock good long term investment.
MARKET DATA
Shares Outstanding: 111.0 m
Share Capital: 111.0 m
Free-float: 15%
Market Cap.: BGN 264.1 m
Avg. Daily Vol.: BGN 71,255
52 Weeks Range: BGN 2.37-4.60
Bloomberg Ticker 5F4 BU
One year target price BGN 3.36
Elana Recommendation HOLD
In BGN mln 2012 2013 2014 2015F 2012 2013 2014 2015F
Operating income 560.5 557.9 784.3 590.6 Assets 6,907.3 7,445.9 8,645.8 8,818.8
Operating ex-penses 528.4 529.0 750.3 561.8
Loans 4,629.3 5,096.0 6,249.9 6,466.7
Net income 28.9 25.9 30.5 25.9 Deposits 6,024.5 6,397.5 7,409.7 7,551.8
Net interest mar-gin 2.80% 2.85% 4.26% 3.91%
Equity 511.2 538.6 728.3 752.7
Cost to income 72.02% 65.83% 39.38% 52.71% Market Cap 153.7 267.3 308.0 264.0
Loans to deposits 76.84% 79.66% 84.35% 85.63% Current price (
BGN) 1.40 2.43 2.80 2.40
ROA 0.44% 0.36% 0.38% 0.30% P/E 5.31 10.33 10.11 10.18
ROE 5.85% 4.93% 4.81% 3.50% P/B 0.30 0.50 0.42 0.35
0%
50%
100%
150%
200%
250%
300%
350%
400%
450%
500%
Old EU
membersNew EU
members
20
30
40
50
60
70
80
90
100
BG
N b
n
Assets
Corp. and Consumer Deposits
Corp. and Retail Loans
Forecast
Investment Picks
DATE: MARCH, 2015 - 23 -
FINANCIAL PERFORMANCE
First Investment Bank is expected to continue to grow faster than the market average. Acquisition of Unionbank led to a significant expansion of FIB’s balance sheets and cus-tomers’ database and will support operating income. Only in 2014 it increased by over BGN 100 m. and will continue to be generated mainly from Bank’s core operations (inter-est income plus fee and commission income).
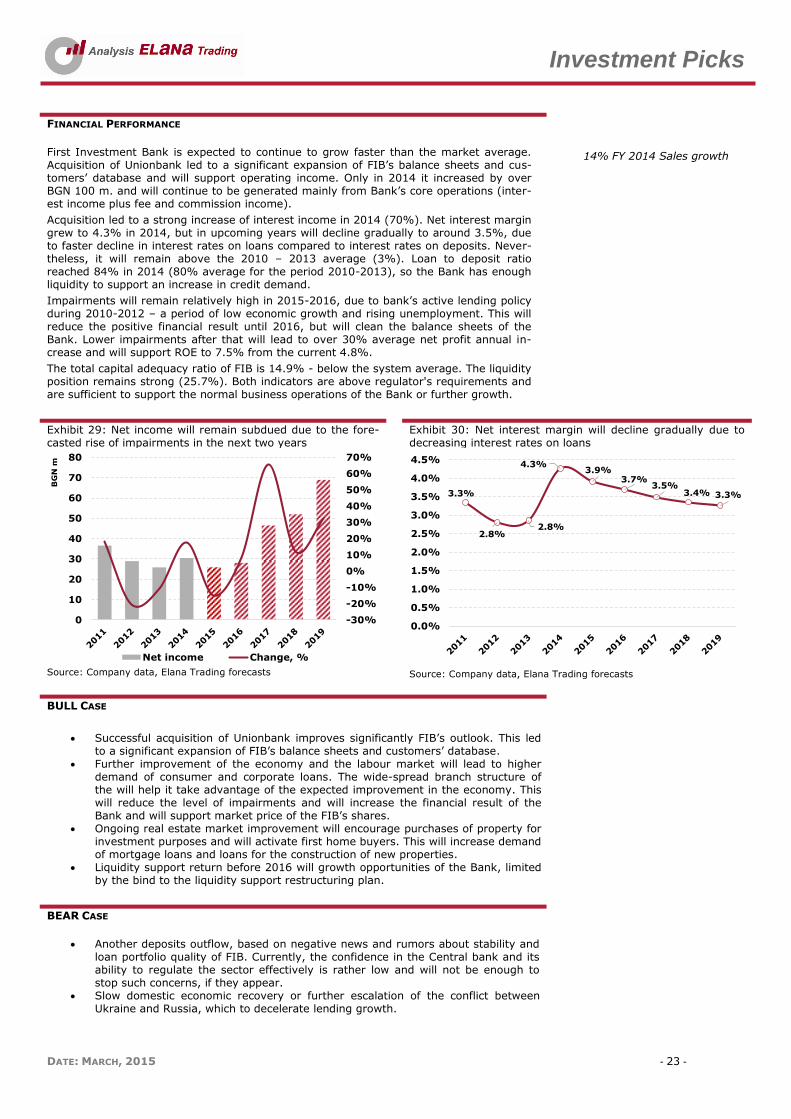
Acquisition led to a strong increase of interest income in 2014 (70%). Net interest margin grew to 4.3% in 2014, but in upcoming years will decline gradually to around 3.5%, due to faster decline in interest rates on loans compared to interest rates on deposits. Never-theless, it will remain above the 2010 – 2013 average (3%). Loan to deposit ratio reached 84% in 2014 (80% average for the period 2010-2013), so the Bank has enough liquidity to support an increase in credit demand.
Impairments will remain relatively high in 2015-2016, due to bank’s active lending policy during 2010-2012 – a period of low economic growth and rising unemployment. This will reduce the positive financial result until 2016, but will clean the balance sheets of the Bank. Lower impairments after that will lead to over 30% average net profit annual in-crease and will support ROE to 7.5% from the current 4.8%.
The total capital adequacy ratio of FIB is 14.9% - below the system average. The liquidity position remains strong (25.7%). Both indicators are above regulator's requirements and are sufficient to support the normal business operations of the Bank or further growth.
14% FY 2014 Sales growth
Exhibit 29: Net income will remain subdued due to the fore-casted rise of impairments in the next two years
Exhibit 30: Net interest margin will decline gradually due to decreasing interest rates on loans
Source: Company data, Elana Trading forecasts
Source: Company data, Elana Trading forecasts
BULL CASE
Successful acquisition of Unionbank improves significantly FIB’s outlook. This led to a significant expansion of FIB’s balance sheets and customers’ database.
Further improvement of the economy and the labour market will lead to higher demand of consumer and corporate loans. The wide-spread branch structure of the will help it take advantage of the expected improvement in the economy. This will reduce the level of impairments and will increase the financial result of the Bank and will support market price of the FIB’s shares.
Ongoing real estate market improvement will encourage purchases of property for investment purposes and will activate first home buyers. This will increase demand of mortgage loans and loans for the construction of new properties.
Liquidity support return before 2016 will growth opportunities of the Bank, limited by the bind to the liquidity support restructuring plan.
BEAR CASE
Another deposits outflow, based on negative news and rumors about stability and
loan portfolio quality of FIB. Currently, the confidence in the Central bank and its ability to regulate the sector effectively is rather low and will not be enough to stop such concerns, if they appear.
Slow domestic economic recovery or further escalation of the conflict between Ukraine and Russia, which to decelerate lending growth.
-30%
-20%
-10%
0%
10%
20%
30%
40%
50%
60%
70%
0
10
20
30
40
50
60
70
80
BG
N m
Net income Change, %
3.3%
2.8%2.8%
4.3%3.9%
3.7%3.5%
3.4% 3.3%
0.0%
0.5%
1.0%
1.5%
2.0%
2.5%
3.0%
3.5%
4.0%
4.5%

Investment Picks
DATE: MARCH, 2015 - 24 -
TOP PICK: ELANA AGROCREDIT
Elana Agrocredit is the first financial company in Bulgaria specialized in financial leasing for the purchase of agricultural land. It was created by the team that started the first and biggest for its time REIT for agricultural land in Bulgaria – ELARG, which yielded 25% average annual return when liquidated.
Elana Agrocredit is a joint stock company, but operates as a REIT distributing 90% of profits. It raises capital on the Bulgarian capital market and provides financing to farmers to buy arable land. It extends long term leases (up to 10 years) at 10% interest and a minimum 20% down payment by the lessees.
Elana Agrocredit’s innovative business model taps on the local farmers’ aim to increase the land they own. It owns the land until full lease repayment. It also aims at increasing profitability by leveraging the business with funding from local and international institutions (i.e the EBRD and Societe General) as well as by diversifying into leasing financing for other agri-related projects as irrigation, new machinery, etc.
Elana Agrocredit IPO-ed on the Bulgarian Stock Exchange in September 2013. In the spring of 2015, the Company will be raising additional capital. With the SPO the Company will offer 15.35 m new shares at an issue price of BGN 1.02.
Will distribute first dividend of BGN 0.0623 DPS or 6% dividend yield.
In ‘000 BGN 2013 2014 2015F 2013 2014 2015F
Revenues 44 955 2,865 Total Assets 5,109 11,256 31,350
EBIT (37) 493 2,305 Total Debt 0 5,657 9,060
Net Profit (38) 340 1,839 Equity 5,085 5,425 22,291
EBIT Margin -84.09% 51.62% 80.45% Lease receivables 1,233 9,844 29,882
Net Profit Margin -86.36% 35.60% 64.18% Financed land (ha.) 230 1,780 4,916
Dividend Payout n/a 94% 90% Average price (BGN/ha) 6,736 7,236 7,598
Dividend Yield n/a 5.87% 7.62% Market Cap 5,233 5,320 21,730
ROE -0.75% 6.27% 8.25% Current Price (BGN) 1.023 1.062 1.062
DPS (BGN) n/a 0.062 0.081 P/E n/a 15.98 11.82
BVPS (BGN0 0.994 1.061 1.089 P/B 1.03 1.00 0.97
FINANCIAL PERFORMANCE
Elana Agrocredit’s land market experience and lease market momentum give it a considerable competitive advantage in building up a significant market posi-tion. It has already financed 2500+ in 19 of the 20 major districts in Bulgaria. In its first ful operational year, 2014, it has invested BGN 13+ m and financed the acquisition of 1780 ha of arable land.
The Company’s specific business model entails interest income to be major revenue source. However, the Company also profits from a fixed BGN 5 per dca (0.1ha) annual management fee and any proceeds from the sale of land on defaulted leases.
In 2014, it generated BGN 955K of revenues, 54% of which came from normal interest income and 37% from the sale of land on defaulted leases. The rest were land management. Overall, the Company had 95% interest payment collection. All lease repayments are due on September 15th after farmers have reaped the profits from the agricultural year. If a farmer delays payments with more than 30 days, the Company can sell the corresponding land as the land title stays with it until full lease repayment.
2014 profitability settled at 36% net income margin due higher debt financing costs. Going forward we expect debt costs to decline with the increase in equity capital and sustaining a debt to equity ratio of 2:1. Thus, it will open up room for additional profitability up to 70%-80% average EBT and 50%-60% average net income margins.
MARKET DATA
Shares Outstanding: 5.115 m
Share Capital: 5.115 m
Free-float: 42.2%
Market Cap.: BGN 5.5 m
Avg. Daily Vol.: BGN 10,000
52 Weeks Range: BGN 1.01-1.085
Bloomberg Ticker 0EA BU
One year target price BGN 1.06
Elana Recommendation BUY
BULL CASE
Growing land market and increased EU agricultural subsidies to stimulate land demand and agricultural investments
BEAR CASE Land ownership limitation in Bulgaria to entities/persons within the EU and ECC to
limit the Company’s equity capital funding pool.

Investment Picks
DATE: MARCH, 2015 - 25 -
COURIER SERVICES
DELIVERING ON PROMISES
Courier services have been a solid outperformer of the general economy, registering double digit growth driven by with the booming e-commerce industry, B2C, (6% of GDP) and businesses out-sourcing logistic services and optimizing their supply chain, B2B.
E-sales in Bulgaria have doubled over the last five years from BGN 2.5 bn in 2010 to BGN 5.06 bn in 2014, according to the national statistics data. At the same time, the people buying goods online have tripled, reaching almost a million or 13% of the population in the country.
The B2B segment also a major sector driver with parcel delivery and hybrid postal services rising significantly as more businesses prefer to outsource logistics and certain supply chain services.
Exhibit 31: E-Sales in Bulgaria doubled in five years Exhibit 32: Non-universal postal services drive up growth
Source: National Statistics Institute
Source: National Statistics Institute
TOP PICK: SPEEDY Speedy (0SP BU) is the leading Bulgarian courier with a 37% market share. It is the 2nd largest postal service provider after the incumbent Bulgarian Post. It is one of the fastest growing companies in Bulgaria with high brand recogni-tion. Its core business is door to door standard and express delivery services that represent 95% of the revenues in 2014. The B2B segment contributes the most the Company’s revenues, but B2C is advancing fast as well.
2014 was a corner stone year in Speedy’s history. The Company struck a stra-tegic agreement with the French GeoPost, 2nd largest land courier service pro-vider in Europe. Accordingly, GeoPost acquired 25% of Speedy with a majority option in 2020 at an EV/EBITDA multiple of 8x. On the other hand, Speedy acquired GeoPost’s business in Bulgaria and Romania (GeoPost Bulgaria and DPD Romania, respectively), thus allowing Speedy to expand into the larger and faster growing Romanian courier market.
For the two years as a public company, Speedy awarded investors with a 5% average dividend yield, 50% average ROE and excellent growth potential.
MARKET DATA
Shares Outstanding: 5.34 m
Share Capital: BGN 5.34 m
Free-float: 8.9%
Market Cap.: BGN 180 m
Avg. Daily Vol.: BGN 20,000
52 Weeks Range: BGN 20.95-34.99
Bloomberg Ticker 0SP BU
One year target price BGN 38.43
Recommendation BUY
In ‘000 BGN 2012 2013 2014 2015F 2012 2013 2014 2015F
Revenues 54,524 66,297 80,948 121,986 Total Assets 25,692 37,215 78,617 87,163
EBITDA 11,050 13,558 16,148 20,499 Total Debt 5,848 10,140 19,952 20,494
EBIT 8,317 10,382 11,165 16,590 Book Value 10,523 14,933 39,213 42,835
Net Profit 7,614 8,827 9,652 13,916 Enterprise Value 78,225 99,256 182,326 178,842
EBITDA Margin 20.27% 20.45% 19.95% 16.80% Market Cap 76,333 97,830 173,417 173,417
EBIT Margin 15.25% 15.66% 13.79% 13.60% Current Price 51.50 22.00 32.50 32.50
Net Profit Margin 13.96% 13.31% 11.92% 11.41% P/E 10.03 7.39 15.22 12.46
ROE 72.36% 59.11% 24.61% 31.00% P/B 7.25 6.55 4.42 3.59
ROA 29.64% 23.72% 12.28% 16.46% EV/EBITDA 7.08 7.32 11.29 8.72
Dividend Payout 58.01% 33.58% 50.00% 50.00% Dividend Yield 5.79% 4.55% 2.78% (F) 4.01%
189.6 189.4 203.4 209.0 219.4237.0
258.3
47.4 41.641.7
49.050.0
50.5
49.5
0
50
100
150
200
250
300
350
2010 2011 2012 2013 2014 (f) 2015 (f) 2016 (f)
BG
N m
ln
Universal services
Non-universal services

Investment Picks
DATE: MARCH, 2015 - 26 -
FINANCIAL PERFORMANCE
Speedy reports fifth consecutive year of rising revenue with FY 2014 sales growth acceler-ating to 22% and overall performance above expectations.
Major sales growth drivers are the speeding B2B parcels and international deliveries as well as the booming B2C and e-commerce deliveries. The latter rose 20% in 2014 while the former added above 25%. Romania contributed significantly to the top line as well as Speedy finalized the acquisition of DPD Romania in mid-November 2014 and started con-solidating it. Overall, local market sales both in Romania and Bulgaria rose 19%, while international delivery sales increased 63% hitting a 10% share of sales.
On bottom line side, Speedy’s performance in 2014 slightly above expectations with Net Income margin narrowing to 11.9% and EBITDA margin finishing at 19.9%. The Bulgarian marker is the major margin contributor as Speedy as the market leader in the country is a trend setter rather than trend follower. Romania, on the other hand, is a less profitable market with margins fluctuating in single digit numbers. The Romanian market as is mostly driven by the fast growing but less profitable e-commerce B2C segment. Additionally, the Romanian market is highly fragmented with many small courier service providers.
22% FY 2014 sales growth
Going forward, developing the Romanian market will require additional investments both in infrastructure and business development. Thus, in the near future we expect to see further expansion of the top line but additional narrowing in the bottom line.
Part of these investments will be reflected in rising debt levels as well. In 2014, total debt doubled as parts of it were used to acquire GeoPost’s business in Bulgaria and Romania while the other will be invested in developing the Romanian market. Overall, debt to equity ratio declined as Speedy increased its share capital in the autumn of 2014.
Exhibit 33: 50% expected growth in sales in 2015 due to full acquisition effect
Exhibit 34: EBITDA margin declined due to acquisitions but to stabilized at 16%
Source: Bulgarian Communications Regulation Commission
Source: Company data
BULL CASE
Speedy’s leading market position in Bulgaria provides for double digit growth to
continue in the coming years as the Company is diversified both on the B2B and the B2C market
Expanding into the larger and faster growing Romanian market to further add to the top line of the Group allowing it to considerably increase the scale of opera-tions and reap additional benefits from the rising cross-border trade, including in the e-commerce segment.
BEAR CASE
Increased competition both in Bulgaria and Romania to slow down and eat up
some chunks of Speedy’s profitability pie. Low free float to hinder the stocks market performance.

Investment Picks
DATE: MARCH, 2015 - 27 -
DIVERSIFIED HOLDINGS
Financial services in Bulgaria are the fastest developing sector despite the economic slowdown and the post-crisis decline of confidence among corporates and households. The prospects for devel-opment remain firmly positive at the back of acceleration of GDP growth and the need for invest-ments in many sectors. The low penetration of financial services should provide long-term boost for the insurance companies. Banks reported high level of non-performing loans.
Exhibit 35: Banking systems rely on economic growth for further
Exhibit 36: Growth of gross premium income in Bulgaria de-celerates but remain above LT average
Source: Eurostat
Source: Financial Supervision Commission
TOP PICK: CHIMIMPORT
Chimimport was established in 1947 as a foreign trade enterprise specialized in trading with chemical products and currently is one of Bulgaria’s biggest conglomerates with more than 70 subsidiaries. Major segments - financial sector (represented by the Central Cooperative Bank (4CF BU) and the insur-ance company Armeec), transport sector (represented by the national air car-rier Bulgaria Air and the Bulgarian River Shipping) and the production, pro-cessing and trade with vegetable oil, grains and fuels (T43 BU). It also manag-es some of the largest private pension funds in the country.
The Group’s structure offers huge opportunity for synergies and cross selling in the financial and transport sectors. The Group operates the biggest Bulgarian airline and participates in joint ventures running the biggest airplane mainte-nance company in the country and two of the busiest airports in the country (in the seaside cities of Varna and Bourgas).
MARKET DATA
Ordinary Shares Outstanding:
144m
Share Capital: BGN 144m
Free-float: 24.02%
Treasury Shares 0%
Market Cap.: BGN 250m
Avg. Daily Vol.: BGN 100,000
52 Weeks Range: BGN 1.52-2.39
Bloomberg 6C4 BU
One year target price BGN 3.22
Elana Recommendation BUY
In ‘000 BGN 2012 2013 2014 2015F 2012 2013 2014 2015F
Revenues cons. 517,599
542,225
532,481
581,220
Stock Price BGN
0.83 2.14 1.64 1.64
Finance (non fin.) 39,907 40,696 33,794 42,755 Total # Shares 239,646 228,183 227,392 227,392
Trade & Production 147,216
172,831
130,365
188,818
Market Cap 199,865 487,171 372,923 372,923
Transportation 370,357
377,026
380,052
404,647
Net Profit 107,416 86,456 75,210 81,227
Premium income 359,862
392,487
509,227
464,116
P/E 1.86 5.63 4.96 4.59
Insurance Income 19,698 25,858 23,681 32,488 Equity 1,460,443
1,538,031
1,570,956
1,609,898 Net interest income 84,810 101,60
6 96,437 99,330 P/B 0.14 0.32 0.24 0.23
Securities profits cons.
167,167
72,603 73,460 n/f Assets 5,998,056
6,602,207
7,391,985
7,835,504 Sales & Admin.
Costs 190,18
7 212,36
7 211,05
7 217,95
8 ROE 7.36% 5.62% 4.79% 5.05%
0%
10%
20%
30%
40%
50%
60% Consumer loans / GDP
Mortgage loans / GDP
Corporate loans / GDP
20.8%
-4.9% -5.6%
-0.9%
-1.9%
6.5%
3.8%
0.0
0.2
0.4
0.6
0.8
1.0
1.2
1.4
1.6
1.8
2008 2009 2010 2011 2012 2013 I-XI.
2014
-10%
-5%
0%
5%
10%
15%
20%
25%
BG
N b
n
Total Growth, %

Investment Picks
DATE: MARCH, 2015 - 28 -
FINANCIAL PERFORMANCE
The Holding is not only developing its strategic assets in seemingly three different sectors but it is also trading with securities and actively buying and selling small companies. There-fore, financial profits have essential contribution for Chimimport’s results. The biggest part is due to the operations with securities. The Holding reported only small profits from sale of stakes in subsidiaries or other acquisition related activities. The bank’s portfolio constitutes mainly of government bonds that appreciated substantially during the last three years. The gains from securities trading increased only marginally in 2014 to BGN 73 mln., which represented 80% of the total net profit. Some of the financial profits in the Group are due to the stakes in related public listed companies due to their low liquidity and limited free-float. Chimimport doesn’t have the practice to support stock prices of its subsidiaries or to create artificial demand.
The consolidated assets soared by in 2014 due mainly to the growth of liabilities, while net assets of the Group increased by 3%. The elimination from consolidation and the subtrac-tion of insurance reserves resulted to 2% growth of equity of Chimimport to BGN 1.57 bn. The financial sector has the biggest contribution in consolidated assets but its share in the net profit fell by 38%. This is the largest recorded decline of the segment which corre-sponds to the decrease of profit of Central Cooperative Bank. The insurance company Armeec did not report sizable decline of profits, whereas the results of pension funds man-agement companies were unchanged. The profit from revaluation of assets of financial companies contributed the most to the weaker performance.
The transportation segment reported an improvement of operating profit, while transport and production companies increased their profits from securities trading.
Exhibit 37: Net assets continued its moderate increase, sup-ported by financial and transport sectors
Exhibit 38: But lower than last year net income from the financial sector reduced the total net income of the holding
Source: Company data
Source: Company data
THE BULL CASE
The financial sector will grow faster than the economy in the next several years. Chimim-port integrates the opportunities for cross selling and synergies between its subsidiaries. The past several years proved the positive trend from the synergy of the three different sectors. This will continue in near future but only with limited contribution to the overall financial result. The strongest factor for growth of the stock and Chimimport’s profit lies in the possible public offerings of subsidiaries. The insurance company Armeec is the largest on the market and could become a trigger for growth if the Holding decides to sell a stake. Chimimport’s shares are the most liquid on the Bulgarian market and will outperform other blue chips during positive period for the stock exchange. The divergence in common and preferred share prices offer arbitrage profit in favor of the latter.
THE BEAR CASE
The banking segment is susceptible to further deterioration of NPLs. The reform of the private pension system might influence negatively the performance of Chimimport, includ-ing profits from trading with securities.
2.11 2.19
0.45 0.45
0.440.46
0.0
0.5
1.0
1.5
2.0
2.5
3.0
3.5
2013 2014
BG
N b
n
Construction
Production and
trade
Transport
Financial sector
+4%
+3%
+3%
71.49
44.37
13.90
22.23
16.83
25.71
0
20
40
60
80
100
120
2013 2014
BG
N m
Production and
trade
Transport
Financial sector
-9%
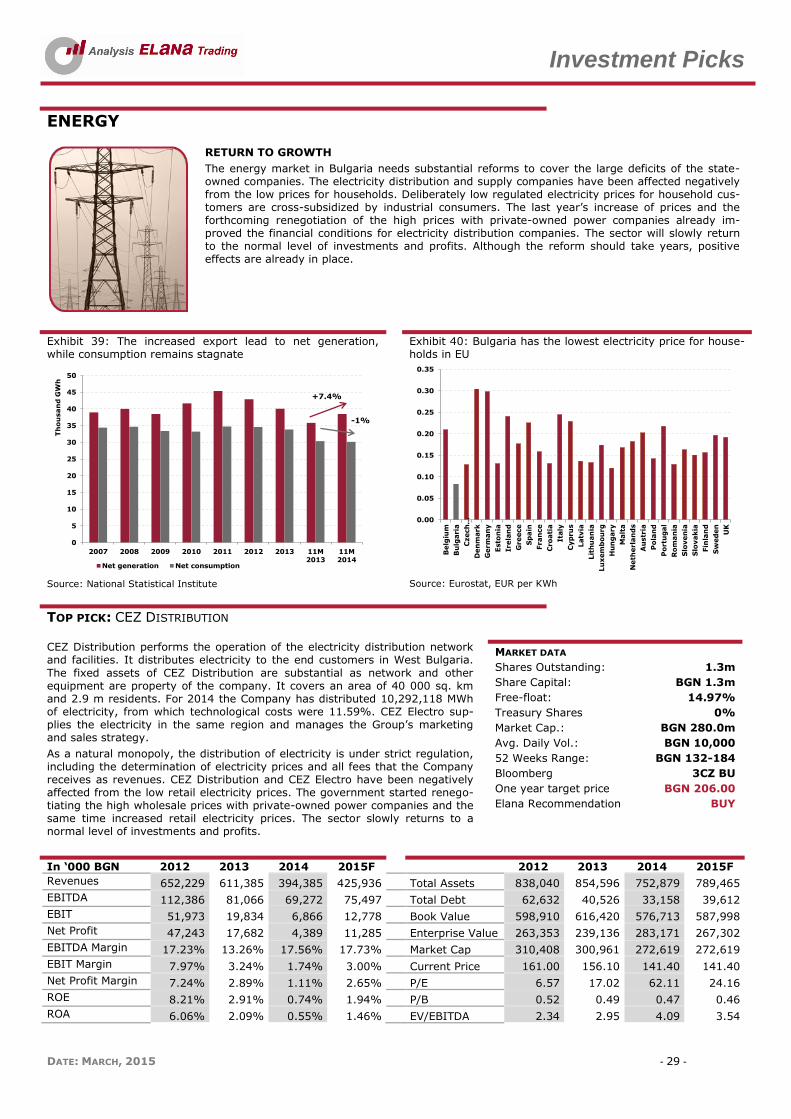
Investment Picks
DATE: MARCH, 2015 - 29 -
ENERGY
RETURN TO GROWTH
The energy market in Bulgaria needs substantial reforms to cover the large deficits of the state-owned companies. The electricity distribution and supply companies have been affected negatively from the low prices for households. Deliberately low regulated electricity prices for household cus-tomers are cross-subsidized by industrial consumers. The last year’s increase of prices and the forthcoming renegotiation of the high prices with private-owned power companies already im-proved the financial conditions for electricity distribution companies. The sector will slowly return to the normal level of investments and profits. Although the reform should take years, positive effects are already in place.
Exhibit 39: The increased export lead to net generation, while consumption remains stagnate
Exhibit 40: Bulgaria has the lowest electricity price for house-holds in EU
Source: National Statistical Institute
Source: Eurostat, EUR per KWh
TOP PICK: CEZ DISTRIBUTION
CEZ Distribution performs the operation of the electricity distribution network and facilities. It distributes electricity to the end customers in West Bulgaria.
The fixed assets of CEZ Distribution are substantial as network and other equipment are property of the company. It covers an area of 40 000 sq. km and 2.9 m residents. For 2014 the Company has distributed 10,292,118 MWh of electricity, from which technological costs were 11.59%. CEZ Electro sup-plies the electricity in the same region and manages the Group’s marketing and sales strategy.
As a natural monopoly, the distribution of electricity is under strict regulation, including the determination of electricity prices and all fees that the Company receives as revenues. CEZ Distribution and CEZ Electro have been negatively affected from the low retail electricity prices. The government started renego-tiating the high wholesale prices with private-owned power companies and the same time increased retail electricity prices. The sector slowly returns to a normal level of investments and profits.
MARKET DATA
Shares Outstanding: 1.3m
Share Capital: BGN 1.3m
Free-float: 14.97%
Treasury Shares 0%
Market Cap.: BGN 280.0m
Avg. Daily Vol.: BGN 10,000
52 Weeks Range: BGN 132-184
Bloomberg 3CZ BU
One year target price BGN 206.00
Elana Recommendation BUY
In ‘000 BGN 2012 2013 2014 2015F 2012 2013 2014 2015F
Revenues 652,229 611,385 394,385 425,936 Total Assets 838,040 854,596 752,879 789,465
EBITDA 112,386 81,066 69,272 75,497 Total Debt 62,632 40,526 33,158 39,612
EBIT 51,973 19,834 6,866 12,778 Book Value 598,910 616,420 576,713 587,998
Net Profit 47,243 17,682 4,389 11,285 Enterprise Value 263,353 239,136 283,171 267,302
EBITDA Margin 17.23% 13.26% 17.56% 17.73% Market Cap 310,408 300,961 272,619 272,619
EBIT Margin 7.97% 3.24% 1.74% 3.00% Current Price 161.00 156.10 141.40 141.40
Net Profit Margin 7.24% 2.89% 1.11% 2.65% P/E 6.57 17.02 62.11 24.16
ROE 8.21% 2.91% 0.74% 1.94% P/B 0.52 0.49 0.47 0.46
ROA 6.06% 2.09% 0.55% 1.46% EV/EBITDA 2.34 2.95 4.09 3.54
0
5
10
15
20
25
30
35
40
45
50
2007 2008 2009 2010 2011 2012 2013 11M2013
11M2014
Th
ou
san
d G
Wh
Net generation Net consumption
-1%
+7.4%
0.00
0.05
0.10
0.15
0.20
0.25
0.30
0.35
Belg
ium
Bu
lgari
a
Czech
…
Den
mark
Germ
an
y
Esto
nia
Irela
nd
Gre
ece
Sp
ain
Fran
ce
Cro
ati
a
Ita
ly
Cyp
rus
Latv
ia
Lit
hu
an
ia
Lu
xem
bo
urg
Hu
ng
ary
Malt
a
Neth
erl
an
ds
Au
str
ia
Po
lan
d
Po
rtu
gal
Ro
man
ia
Slo
ven
ia
Slo
vakia
Fin
lan
d
Sw
ed
en
UK
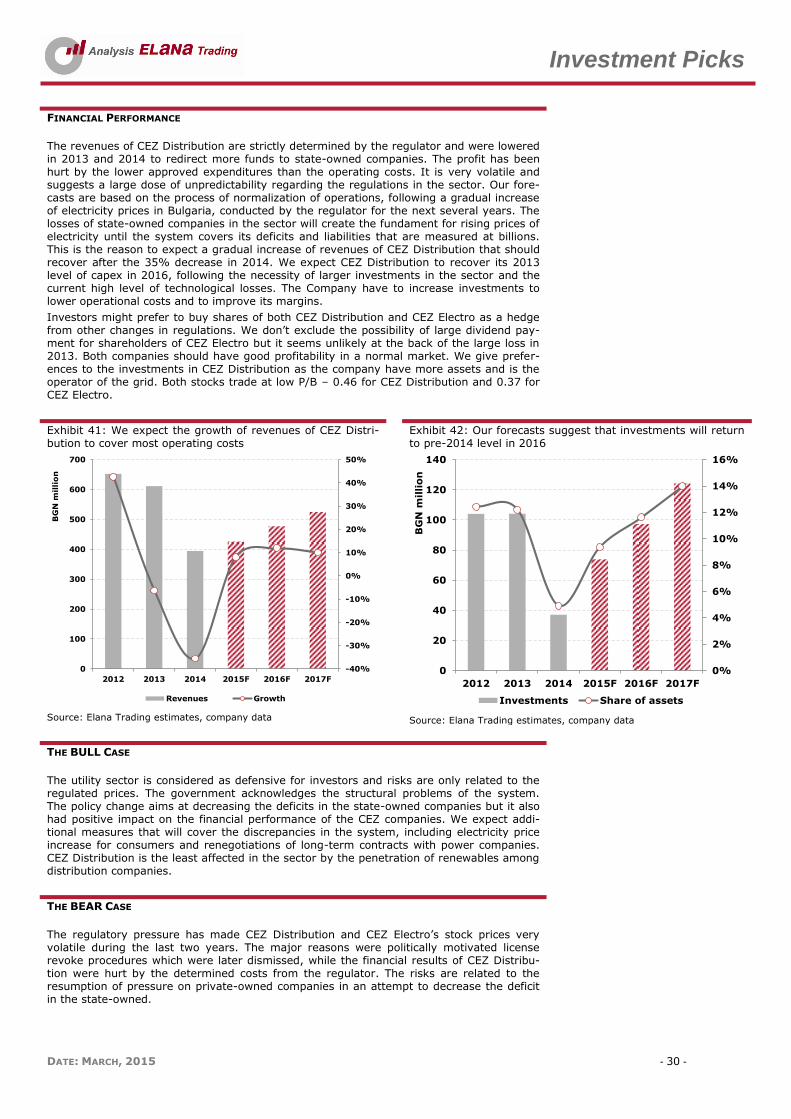
Investment Picks
DATE: MARCH, 2015 - 30 -
FINANCIAL PERFORMANCE
The revenues of CEZ Distribution are strictly determined by the regulator and were lowered in 2013 and 2014 to redirect more funds to state-owned companies. The profit has been hurt by the lower approved expenditures than the operating costs. It is very volatile and suggests a large dose of unpredictability regarding the regulations in the sector. Our fore-casts are based on the process of normalization of operations, following a gradual increase of electricity prices in Bulgaria, conducted by the regulator for the next several years. The losses of state-owned companies in the sector will create the fundament for rising prices of electricity until the system covers its deficits and liabilities that are measured at billions. This is the reason to expect a gradual increase of revenues of CEZ Distribution that should recover after the 35% decrease in 2014. We expect CEZ Distribution to recover its 2013 level of capex in 2016, following the necessity of larger investments in the sector and the current high level of technological losses. The Company have to increase investments to lower operational costs and to improve its margins.
Investors might prefer to buy shares of both CEZ Distribution and CEZ Electro as a hedge from other changes in regulations. We don’t exclude the possibility of large dividend pay-ment for shareholders of CEZ Electro but it seems unlikely at the back of the large loss in 2013. Both companies should have good profitability in a normal market. We give prefer-ences to the investments in CEZ Distribution as the company have more assets and is the operator of the grid. Both stocks trade at low P/B – 0.46 for CEZ Distribution and 0.37 for CEZ Electro.
Exhibit 41: We expect the growth of revenues of CEZ Distri-bution to cover most operating costs
Exhibit 42: Our forecasts suggest that investments will return to pre-2014 level in 2016
Source: Elana Trading estimates, company data
Source: Elana Trading estimates, company data
THE BULL CASE
The utility sector is considered as defensive for investors and risks are only related to the regulated prices. The government acknowledges the structural problems of the system. The policy change aims at decreasing the deficits in the state-owned companies but it also had positive impact on the financial performance of the CEZ companies. We expect addi-tional measures that will cover the discrepancies in the system, including electricity price increase for consumers and renegotiations of long-term contracts with power companies. CEZ Distribution is the least affected in the sector by the penetration of renewables among distribution companies.
THE BEAR CASE
The regulatory pressure has made CEZ Distribution and CEZ Electro’s stock prices very volatile during the last two years. The major reasons were politically motivated license revoke procedures which were later dismissed, while the financial results of CEZ Distribu-tion were hurt by the determined costs from the regulator. The risks are related to the resumption of pressure on private-owned companies in an attempt to decrease the deficit in the state-owned.
-40%
-30%
-20%
-10%
0%
10%
20%
30%
40%
50%
0
100
200
300
400
500
600
700
2012 2013 2014 2015F 2016F 2017F
BG
N m
illi
on
Revenues Growth
0%
2%
4%
6%
8%
10%
12%
14%
16%
0
20
40
60
80
100
120
140
2012 2013 2014 2015F 2016F 2017F
BG
N m
illio
n
Investments Share of assets
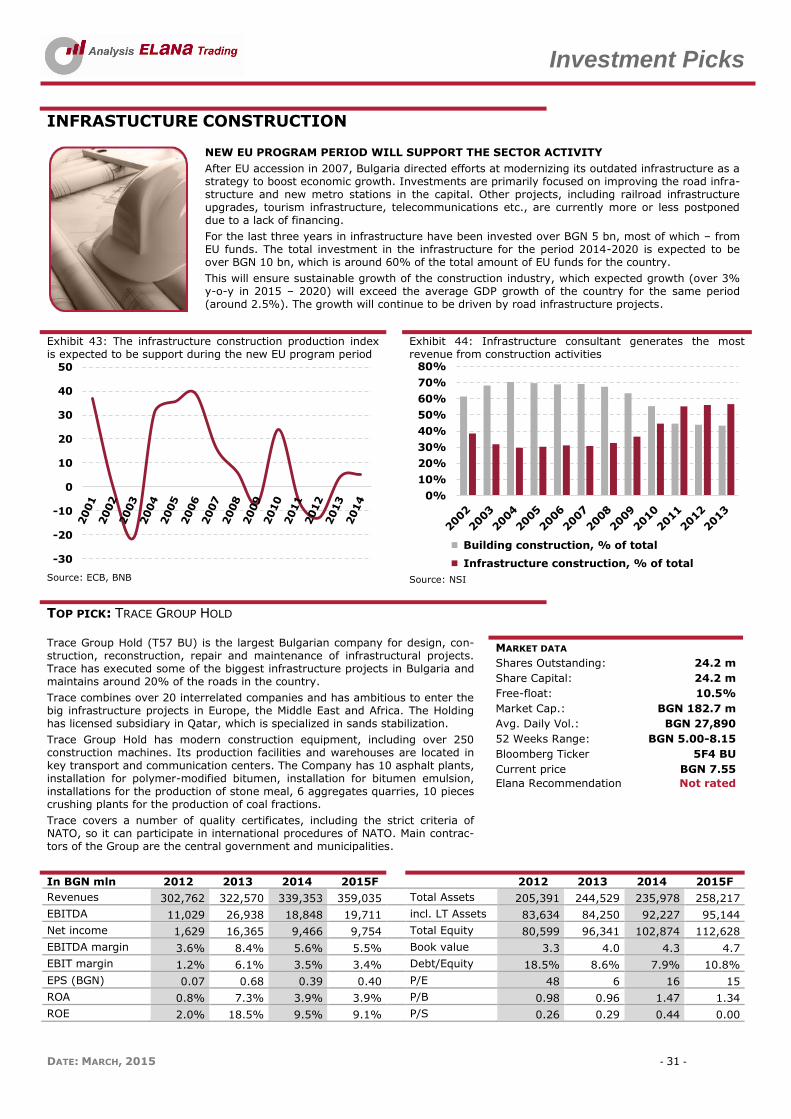
Investment Picks
DATE: MARCH, 2015 - 31 -
INFRASTUCTURE CONSTRUCTION
NEW EU PROGRAM PERIOD WILL SUPPORT THE SECTOR ACTIVITY
After EU accession in 2007, Bulgaria directed efforts at modernizing its outdated infrastructure as a strategy to boost economic growth. Investments are primarily focused on improving the road infra-structure and new metro stations in the capital. Other projects, including railroad infrastructure upgrades, tourism infrastructure, telecommunications etc., are currently more or less postponed due to a lack of financing.
For the last three years in infrastructure have been invested over BGN 5 bn, most of which – from EU funds. The total investment in the infrastructure for the period 2014-2020 is expected to be over BGN 10 bn, which is around 60% of the total amount of EU funds for the country.
This will ensure sustainable growth of the construction industry, which expected growth (over 3% y-o-y in 2015 – 2020) will exceed the average GDP growth of the country for the same period (around 2.5%). The growth will continue to be driven by road infrastructure projects.
Exhibit 43: The infrastructure construction production index is expected to be support during the new EU program period
Exhibit 44: Infrastructure consultant generates the most revenue from construction activities
Source: ECB, BNB
Source: NSI
TOP PICK: TRACE GROUP HOLD Trace Group Hold (T57 BU) is the largest Bulgarian company for design, con-struction, reconstruction, repair and maintenance of infrastructural projects. Trace has executed some of the biggest infrastructure projects in Bulgaria and maintains around 20% of the roads in the country.
Trace combines over 20 interrelated companies and has ambitious to enter the big infrastructure projects in Europe, the Middle East and Africa. The Holding has licensed subsidiary in Qatar, which is specialized in sands stabilization.
Trace Group Hold has modern construction equipment, including over 250 construction machines. Its production facilities and warehouses are located in key transport and communication centers. The Company has 10 asphalt plants, installation for polymer-modified bitumen, installation for bitumen emulsion, installations for the production of stone meal, 6 aggregates quarries, 10 pieces crushing plants for the production of coal fractions.
Trace covers a number of quality certificates, including the strict criteria of NATO, so it can participate in international procedures of NATO. Main contrac-tors of the Group are the central government and municipalities.
MARKET DATA
Shares Outstanding: 24.2 m
Share Capital: 24.2 m
Free-float: 10.5%
Market Cap.: BGN 182.7 m
Avg. Daily Vol.: BGN 27,890
52 Weeks Range: BGN 5.00-8.15
Bloomberg Ticker 5F4 BU
Current price BGN 7.55
Elana Recommendation Not rated
In BGN mln 2012 2013 2014 2015F 2012 2013 2014 2015F
Revenues 302,762 322,570 339,353 359,035 Total Assets 205,391 244,529 235,978 258,217
EBITDA 11,029 26,938 18,848 19,711 incl. LT Assets 83,634 84,250 92,227 95,144
Net income 1,629 16,365 9,466 9,754 Total Equity 80,599 96,341 102,874 112,628
EBITDA margin 3.6% 8.4% 5.6% 5.5% Book value 3.3 4.0 4.3 4.7
EBIT margin 1.2% 6.1% 3.5% 3.4% Debt/Equity 18.5% 8.6% 7.9% 10.8%
EPS (BGN) 0.07 0.68 0.39 0.40 P/E 48 6 16 15
ROA 0.8% 7.3% 3.9% 3.9% P/B 0.98 0.96 1.47 1.34
ROE 2.0% 18.5% 9.5% 9.1% P/S 0.26 0.29 0.44 0.00
-30
-20
-10
0
10
20
30
40
50
0%
10%
20%
30%
40%
50%
60%
70%
80%
Building construction, % of total
Infrastructure construction, % of total
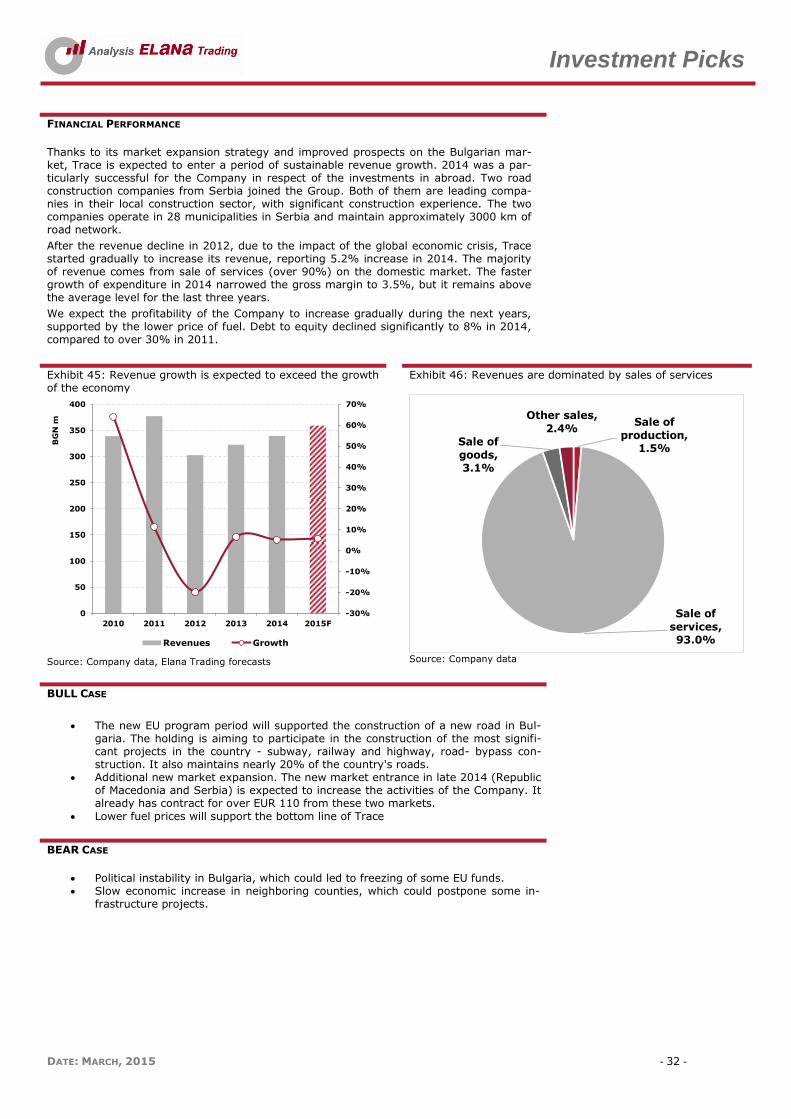
Investment Picks
DATE: MARCH, 2015 - 32 -
FINANCIAL PERFORMANCE
Thanks to its market expansion strategy and improved prospects on the Bulgarian mar-ket, Trace is expected to enter a period of sustainable revenue growth. 2014 was a par-ticularly successful for the Company in respect of the investments in abroad. Two road construction companies from Serbia joined the Group. Both of them are leading compa-nies in their local construction sector, with significant construction experience. The two companies operate in 28 municipalities in Serbia and maintain approximately 3000 km of road network.
After the revenue decline in 2012, due to the impact of the global economic crisis, Trace started gradually to increase its revenue, reporting 5.2% increase in 2014. The majority of revenue comes from sale of services (over 90%) on the domestic market. The faster growth of expenditure in 2014 narrowed the gross margin to 3.5%, but it remains above the average level for the last three years.
We expect the profitability of the Company to increase gradually during the next years, supported by the lower price of fuel. Debt to equity declined significantly to 8% in 2014, compared to over 30% in 2011.
Exhibit 45: Revenue growth is expected to exceed the growth of the economy
Exhibit 46: Revenues are dominated by sales of services
Source: Company data, Elana Trading forecasts
Source: Company data
BULL CASE
The new EU program period will supported the construction of a new road in Bul-garia. The holding is aiming to participate in the construction of the most signifi-cant projects in the country - subway, railway and highway, road- bypass con-struction. It also maintains nearly 20% of the country's roads.
Additional new market expansion. The new market entrance in late 2014 (Republic of Macedonia and Serbia) is expected to increase the activities of the Company. It already has contract for over EUR 110 from these two markets.
Lower fuel prices will support the bottom line of Trace
BEAR CASE
Political instability in Bulgaria, which could led to freezing of some EU funds. Slow economic increase in neighboring counties, which could postpone some in-
frastructure projects.
-30%
-20%
-10%
0%
10%
20%
30%
40%
50%
60%
70%
0
50
100
150
200
250
300
350
400
2010 2011 2012 2013 2014 2015F
BG
N m
Revenues Growth
Sale of
production, 1.5%
Sale of
services, 93.0%
Sale of
goods, 3.1%
Other sales,
2.4%
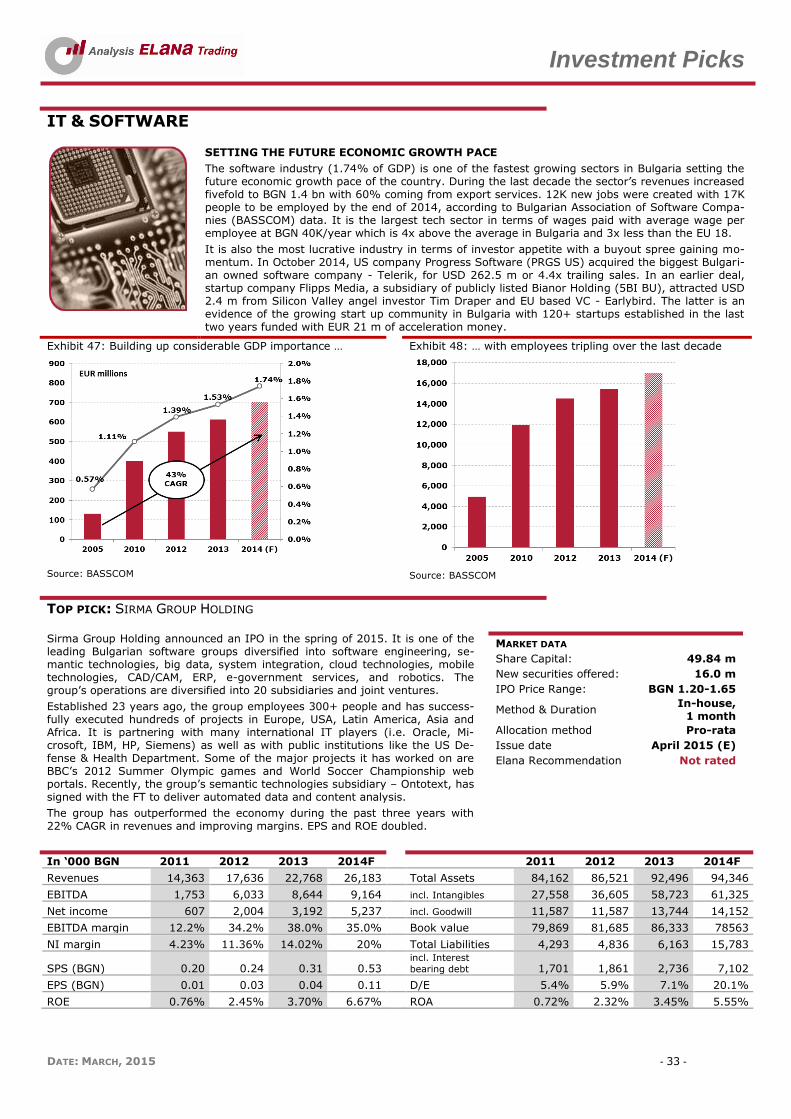
Investment Picks
DATE: MARCH, 2015 - 33 -
IT & SOFTWARE
SETTING THE FUTURE ECONOMIC GROWTH PACE
The software industry (1.74% of GDP) is one of the fastest growing sectors in Bulgaria setting the future economic growth pace of the country. During the last decade the sector’s revenues increased fivefold to BGN 1.4 bn with 60% coming from export services. 12K new jobs were created with 17K people to be employed by the end of 2014, according to Bulgarian Association of Software Compa-nies (BASSCOM) data. It is the largest tech sector in terms of wages paid with average wage per employee at BGN 40K/year which is 4x above the average in Bulgaria and 3x less than the EU 18.
It is also the most lucrative industry in terms of investor appetite with a buyout spree gaining mo-mentum. In October 2014, US company Progress Software (PRGS US) acquired the biggest Bulgari-an owned software company - Telerik, for USD 262.5 m or 4.4x trailing sales. In an earlier deal, startup company Flipps Media, a subsidiary of publicly listed Bianor Holding (5BI BU), attracted USD 2.4 m from Silicon Valley angel investor Tim Draper and EU based VC - Earlybird. The latter is an evidence of the growing start up community in Bulgaria with 120+ startups established in the last two years funded with EUR 21 m of acceleration money.
Exhibit 47: Building up considerable GDP importance … Exhibit 48: … with employees tripling over the last decade
Source: BASSCOM
Source: BASSCOM
TOP PICK: SIRMA GROUP HOLDING Sirma Group Holding announced an IPO in the spring of 2015. It is one of the leading Bulgarian software groups diversified into software engineering, se-mantic technologies, big data, system integration, cloud technologies, mobile technologies, CAD/CAM, ERP, e-government services, and robotics. The group’s operations are diversified into 20 subsidiaries and joint ventures.
Established 23 years ago, the group employees 300+ people and has success-fully executed hundreds of projects in Europe, USA, Latin America, Asia and Africa. It is partnering with many international IT players (i.e. Oracle, Mi-crosoft, IBM, HP, Siemens) as well as with public institutions like the US De-fense & Health Department. Some of the major projects it has worked on are BBC’s 2012 Summer Olympic games and World Soccer Championship web portals. Recently, the group’s semantic technologies subsidiary – Ontotext, has signed with the FT to deliver automated data and content analysis.
The group has outperformed the economy during the past three years with 22% CAGR in revenues and improving margins. EPS and ROE doubled.
MARKET DATA
Share Capital: 49.84 m
New securities offered: 16.0 m
IPO Price Range: BGN 1.20-1.65
Method & Duration In-house,
1 month
Allocation method Pro-rata
Issue date April 2015 (E)
Elana Recommendation Not rated
In ‘000 BGN 2011 2012 2013 2014F 2011 2012 2013 2014F
Revenues 14,363 17,636 22,768 26,183 Total Assets 84,162 86,521 92,496 94,346
EBITDA 1,753 6,033 8,644 9,164 incl. Intangibles 27,558 36,605 58,723 61,325
Net income 607 2,004 3,192 5,237 incl. Goodwill 11,587 11,587 13,744 14,152
EBITDA margin 12.2% 34.2% 38.0% 35.0% Book value 79,869 81,685 86,333 78563
NI margin 4.23% 11.36% 14.02% 20% Total Liabilities 4,293 4,836 6,163 15,783
SPS (BGN) 0.20 0.24 0.31 0.53 incl. Interest
bearing debt 1,701 1,861 2,736 7,102
EPS (BGN) 0.01 0.03 0.04 0.11 D/E 5.4% 5.9% 7.1% 20.1%
ROE 0.76% 2.45% 3.70% 6.67% ROA 0.72% 2.32% 3.45% 5.55%

Investment Picks
DATE: MARCH, 2015 - 34 -
PHARMACEUTICALS & HEALTH CARE
BOUND TO HEALTHY GROWTH
The pharmaceutical industry (3.1% of GDP) has been an outperformer in the economy in the past decade and is bound to continue growing in the coming years. FY 2014 growth accelerated to 8% but it includes re-export sales from Bulgaria to more expensive Western European countries. When we eliminate re-exports, we expect an average 5% CAGR in the coming years, while IMS health forecasts an accelerating growth from 2% to 5%.
Main growth engines are the aging and enriching population. Accordingly, the industry is growing both due to higher medicine and non-medicine (e.g. vitamins, cosmetics) consumption.
Additionally, the Bulgarian health care industry is facing imminent healthcare reform. Discussions have already started about it with paramedics, hospital’s management and medicine and medical consumables procurement to be reshuffled. We expect to see government spending on healthcare to increase as it is 80% below EU average, hospitals’ financial health improving and procurement procedures improving both in terms of transparence and efficiency.
Exhibit 49: Steady local market growth to continue … Exhibit 50:… with Sopharma Trading leading the wholesale segment
Source: IMS Health; Companies Data
Source: Companies data
TOP PICK: SOPHARMA TRADING Sopharma Trading (SO5 BU) is the leading Bulgarian pharmaceutical distribu-tor with a 22.4% market share. The company is part of the Sopharma group that integrates one of the leading generic pharmaceutical producer in the country – Sopharma (3JR BU), together with other supporting operations. It is a full-value healthcare solutions provider with 3000+ customers, 10,000+ diversified product portfolio and 400 local and international partners, including with exclusive contracts with GE Healthcare, Abbott, Carl Zeiss, etc. It holds 21% of the local pharmacy market and 38% of the local hospitals’ market thus, making it the partner of choice in the latter.
Has outperformed the economy with 11.8% CAGR for the last seven years and a record 2014 with 14% increase in sales and further improvement in profita-bility. Offered investors 7.15% 5yr average dividend yield.
MARKET DATA
Shares Outstanding: 32.9 m
Share Capital: 32.9 m
Free-float: 28%
Market Cap.: BGN 184.3 m
Avg. Daily Vol.: BGN 128,600
52 Weeks Range: BGN 3.82-5.73
Bloomberg Ticker SO5 BU
One year target price BGN 6.47
Elana Recommendation BUY
In ‘000 BGN 2012 2013 2014 2015F 2012 2013 2014 2015F
Revenues 462,529 507,027 576,674 641,389 Total Assets 216,493 234,563 251,182 308,252
EBITDA 11,052 12,770 17,073 19,520 Total Debt 52,236 98,475 113,117 138,728
EBIT 8,652 10,548 14,123 16,313 Book Value 58,702 59,369 64,905 66,292
Net Profit 7,349 9,490 13,104 15,279 Enterprise Value 58,620 105,391 174,507 174,528
EBITDA Margin 2.39% 2.52% 2.96% 3.04% Market Cap 58,571 105,296 174,397 174,397
EBIT Margin 1.87% 2.08% 2.45% 2.54% Current Price 1.78 3.2 5.3 5.3
Net Profit Margin 1.59% 1.87% 2.27% 2.38% P/E 7.97 11.10 13.31 11.41
ROE 12.52% 15.98% 20.19% 23.05% P/B 1.78 1.80 1.97 2.63
ROA 3.39% 4.05% 5.22% 4.96% EV/EBITDA 5.30 8.25 10.22 8.94
Dividend Payout 89.55% 79.75% 75.00% 75.00% Dividend Yield 7.69% 4.51% 5.64% 6.57%
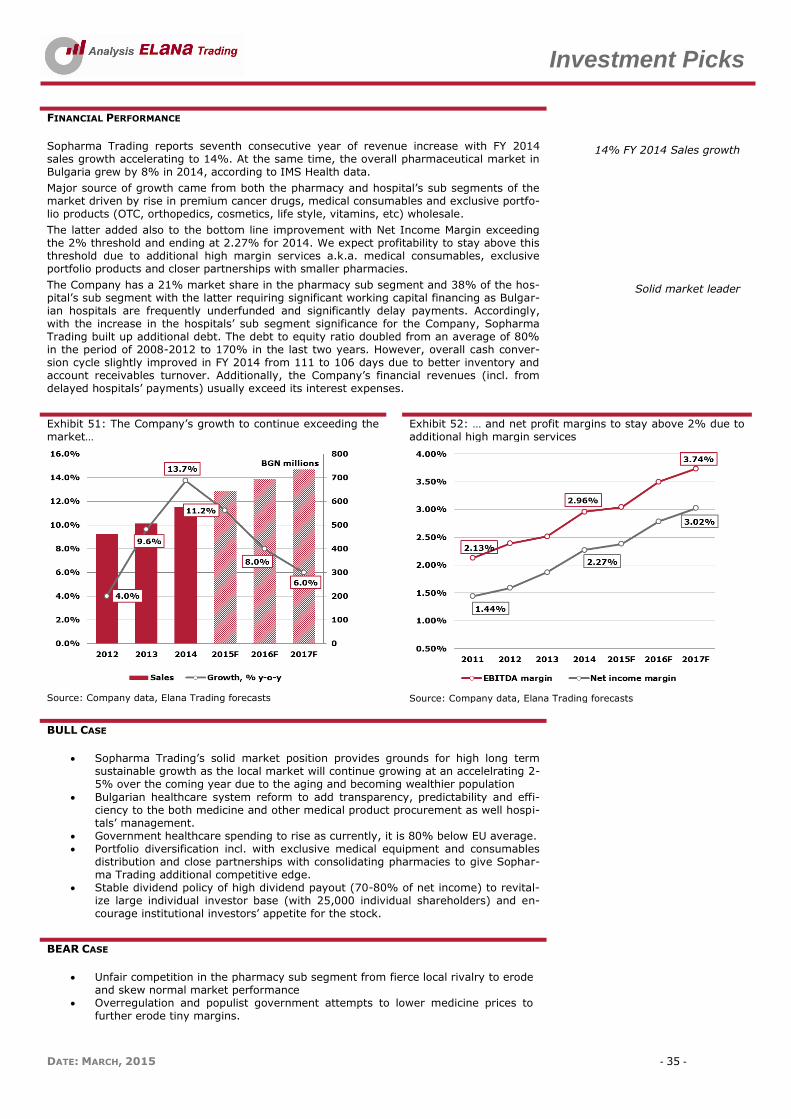
Investment Picks
DATE: MARCH, 2015 - 35 -
FINANCIAL PERFORMANCE
Sopharma Trading reports seventh consecutive year of revenue increase with FY 2014 sales growth accelerating to 14%. At the same time, the overall pharmaceutical market in Bulgaria grew by 8% in 2014, according to IMS Health data.
Major source of growth came from both the pharmacy and hospital’s sub segments of the market driven by rise in premium cancer drugs, medical consumables and exclusive portfo-lio products (OTC, orthopedics, cosmetics, life style, vitamins, etc) wholesale.
The latter added also to the bottom line improvement with Net Income Margin exceeding the 2% threshold and ending at 2.27% for 2014. We expect profitability to stay above this threshold due to additional high margin services a.k.a. medical consumables, exclusive portfolio products and closer partnerships with smaller pharmacies.
14% FY 2014 Sales growth
The Company has a 21% market share in the pharmacy sub segment and 38% of the hos-pital’s sub segment with the latter requiring significant working capital financing as Bulgar-ian hospitals are frequently underfunded and significantly delay payments. Accordingly, with the increase in the hospitals’ sub segment significance for the Company, Sopharma Trading built up additional debt. The debt to equity ratio doubled from an average of 80% in the period of 2008-2012 to 170% in the last two years. However, overall cash conver-sion cycle slightly improved in FY 2014 from 111 to 106 days due to better inventory and account receivables turnover. Additionally, the Company’s financial revenues (incl. from delayed hospitals’ payments) usually exceed its interest expenses.
Solid market leader
Exhibit 51: The Company’s growth to continue exceeding the market…
Exhibit 52: … and net profit margins to stay above 2% due to additional high margin services
Source: Company data, Elana Trading forecasts
Source: Company data, Elana Trading forecasts
BULL CASE
Sopharma Trading’s solid market position provides grounds for high long term
sustainable growth as the local market will continue growing at an accelelrating 2-5% over the coming year due to the aging and becoming wealthier population
Bulgarian healthcare system reform to add transparency, predictability and effi-ciency to the both medicine and other medical product procurement as well hospi-tals’ management.
Government healthcare spending to rise as currently, it is 80% below EU average. Portfolio diversification incl. with exclusive medical equipment and consumables
distribution and close partnerships with consolidating pharmacies to give Sophar-ma Trading additional competitive edge.
Stable dividend policy of high dividend payout (70-80% of net income) to revital-ize large individual investor base (with 25,000 individual shareholders) and en-courage institutional investors’ appetite for the stock.
BEAR CASE
Unfair competition in the pharmacy sub segment from fierce local rivalry to erode
and skew normal market performance Overregulation and populist government attempts to lower medicine prices to
further erode tiny margins.

Investment Picks
DATE: MARCH, 2015 - 36 -
Disclaimer
Regulatory Restrictions: No publication of ELANA Trading should be construed as an offer (or solicitation of an offer) to U.S.
persons to buy or sell financial instruments or any financial product, make any investment or participate in any particular trad-ing strategy (collectively “Offers”). No Publication of ELANA Trading should be construed as an Offer (or solicitation of an offer) in
any jurisdiction in which such Offer would be illegal. Any such perceived Offer will not be honoured by ELANA Trading.
Analyst Certification: The research analyst(s) certifies that: (1) all of the views expressed in this document accurately reflect
his or her personal views about any and all of the subject securities or issuers; (2) no part of any of the research analyst’s com-pensation was, is, or will be directly or indirectly related to the specific recommendations or views expressed by the research analyst(s) in this document.
Financial Interest: ELANA Trading may trade or own shares of the analyzed companies. The research analyst(s) is not holding shares of the analyzed companies, unless otherwise noted.
Regulatory Authority: Financial Supervisory Commission, Budapest Street 18, 1303 Sofia, Bulgaria
Information Disclosure: All reasonable care has been taken to ensure the facts stated are accurate and opinions given are fair and reasonable. Our recommendations are based on information available to the public that we consider to be reliable but for the completeness and accuracy of which we assume no liability. Neither ELANA Trading, nor its directors, officers or employees shall in any way be responsible for its contents. The views expressed may differ from the views of other firm departments or repre-sentatives. Additional information is available upon request. Unless otherwise noted, sources for all information in charts and tables are ELANA Trading’s calculations.
Risks for Investors: Information in this document should not be regarded as an offer to buy or sell any financial instruments. The investment possibilities discussed in this document may not be suitable for certain investors depending on their specific in-vestment objectives and time horizon or in the context of their overall financial situation. In particular, the risks associated with an investment in the securities or the financial instruments under discussion are not explained in its entirety.
The prices or values of the securities may go down as well as up and can fluctuate and fall against the investor. The securities or
investments may cause the investor to lose the amount invested. Past performance is not a guide to future performance. Chang-es in exchange rates may have an adverse effect on the value, price or income of the securities or investments.
Valuation Methods: Company valuations are based on the following methods: multiple-based (P/E, P/B, EV/EBITDA), historical
valuation approaches, peer comparisons, discount models (DCF, DDM) or asset-based evaluation methods. Valuation models are dependent on macroeconomic factors, including interest rates, foreign exchange rates, prices of raw materials, and any expecta-tions about the economy, the market sentiment. The valuation is based on expectations that might change rapidly and without notice, depending on developments specific to individual industries and countries. Recommendations and target prices derived from the models might therefore change accordingly. The application of models depends on forecasts of a range of economic variables, thus there is a range of reasonable variations within models. Any valuation is dependent upon inputs that are based on the subjective opinion of the analysts carrying out this valuation.
Recommendations: Analyst(s) recommendations are based on the specific factors for the company, sector, country and global
developments, as compared to market indices. Recommendations and opinions reflect ELANA Trading's expectations over the 12-month period following publication from the perspective of long-only investment clients. ELANA Trading reserves the right to express different or contrary recommendations and opinions for different timescales or for other types of investment client. Ex-cept as otherwise noted, expected performance over next 12 months vary for different recommendations for Bulgarian stocks as follows:
BUY More than 5% higher as compared to SOFIX and BG40 performance
HOLD Market performance, +/-5% as compared to SOFIX and BG40
SELL More than 5% lower as compared to SOFIX and BG40 performance
Frequency of Recommendations: No schedule of recommendations is available. The frequency of recommendations depends on specific factors to individual companies and the opinion of the analyst(s) for the necessity of minor or major changes.
Copyrights: The copyrights of ELANA Trading analyses belong to the Research Department of the brokerage and their content
cannot be used for commercial purposes. Replication and redistribution of ELANA Trading analyses content is expressly prohibited without the prior written consent of the appointed contacts listed below.
For more information, please contact:
Research analyst Phone: E-mail: Internet:
Tatyana Vasileva + 359 2 810 00 24 [email protected] www.elana.net
Tsvetoslav Tsachev +359 2 810 00 23 [email protected] www.elana.net
Lyubomir Peshev +359 2 810 00 27 [email protected] www.elana.net