Embed Size (px)
Citation preview
Effective Sourcing Strategies
forConstruction & Facilities
Management Services
Effective Sourcing Strategies
Typical Category Breakdown
Common Issues
Necessary tools
Strategies
Opportunity Identification Methods
Case Studies
Summary
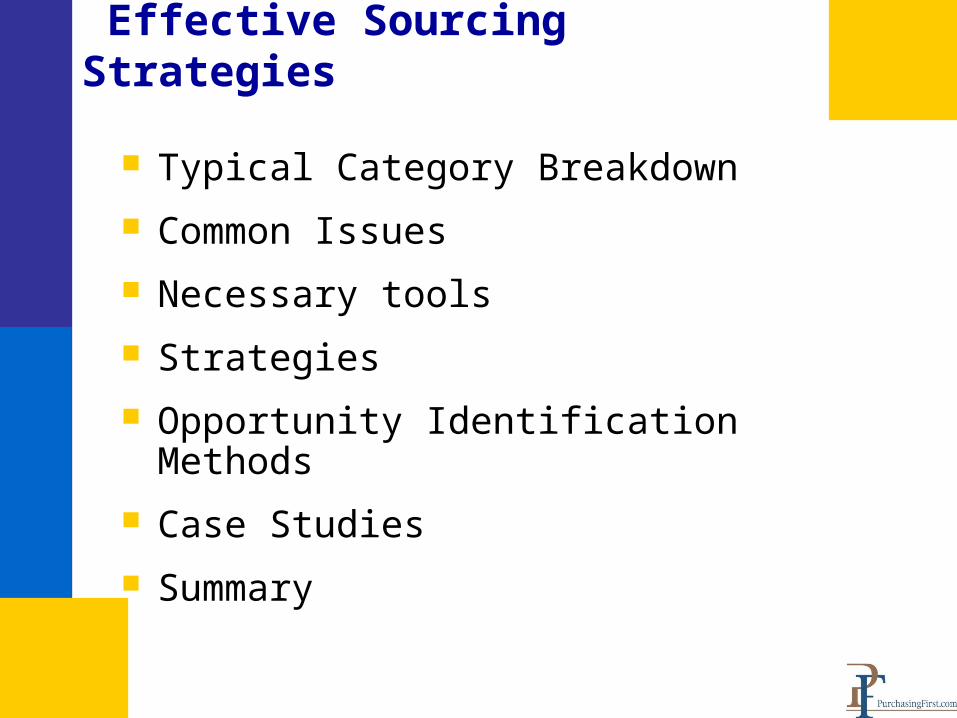
Construction & Facilities Management Categories
Major Projects – Typical new construction, large project in size and sq footage
Renovations - Renovate existing space
Minor Projects – New single room construction
Maintenance – Existing facilities operating and repair activities
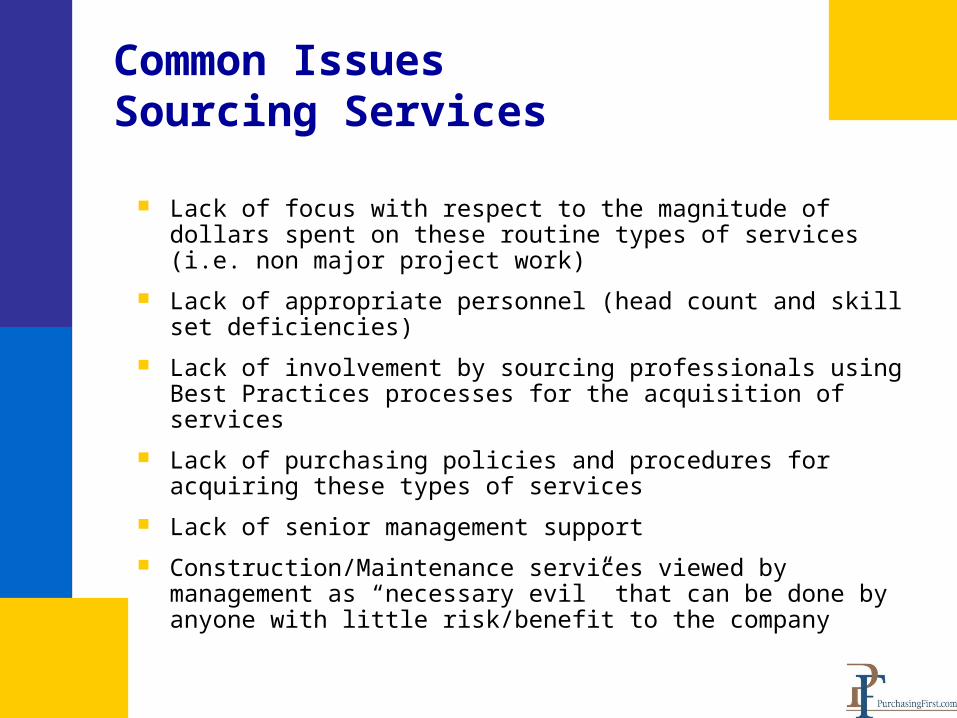
Common Issues Sourcing Services
Lack of focus with respect to the magnitude of dollars spent on these routine types of services (i.e. non major project work)
Lack of appropriate personnel (head count and skill set deficiencies)
Lack of involvement by sourcing professionals using Best Practices processes for the acquisition of services
Lack of purchasing policies and procedures for acquiring these types of services
Lack of senior management support
Construction/Maintenance services viewed by management as “necessary evil” that can be done by anyone with little risk/benefit to the company
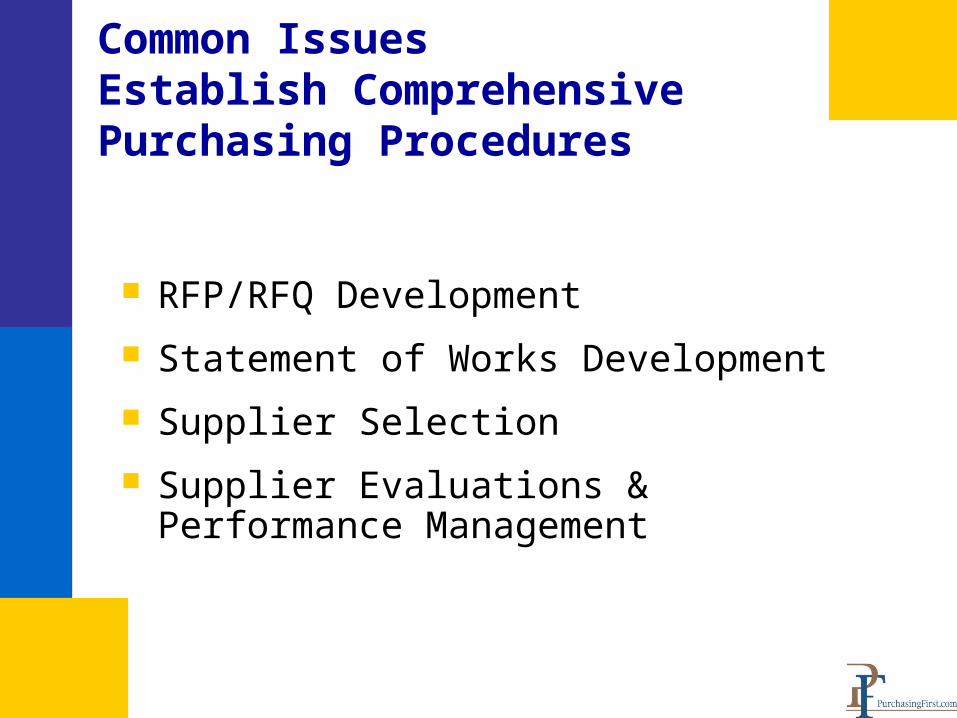
Common IssuesEstablish Comprehensive Purchasing Procedures
RFP/RFQ Development
Statement of Works Development
Supplier Selection
Supplier Evaluations & Performance Management
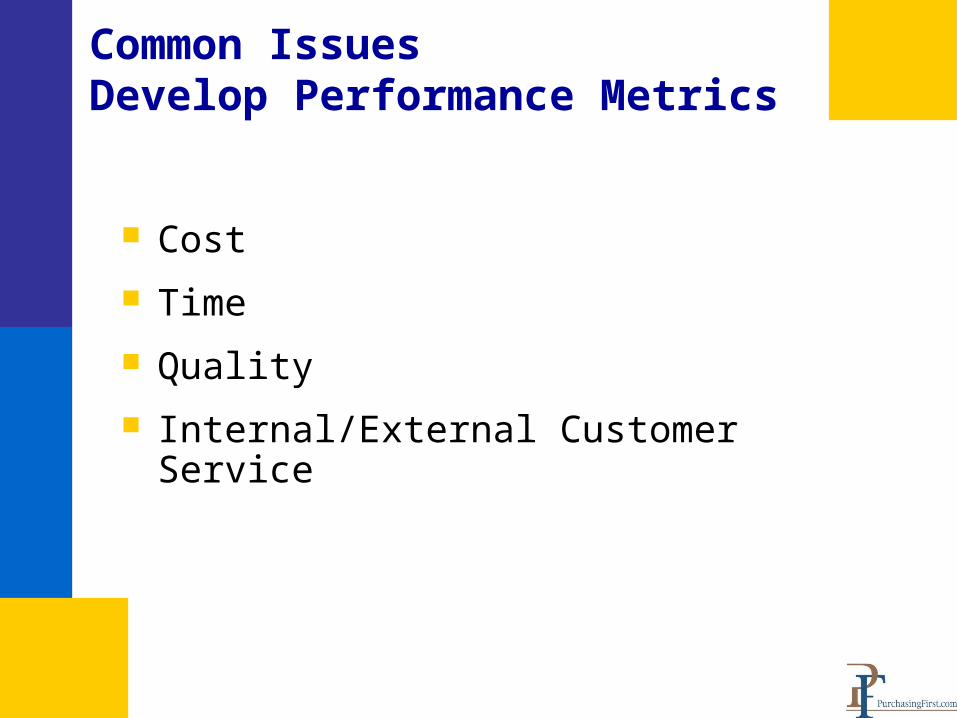
Common IssuesDevelop Performance Metrics
Cost
Time
Quality
Internal/External Customer Service

Major Projects
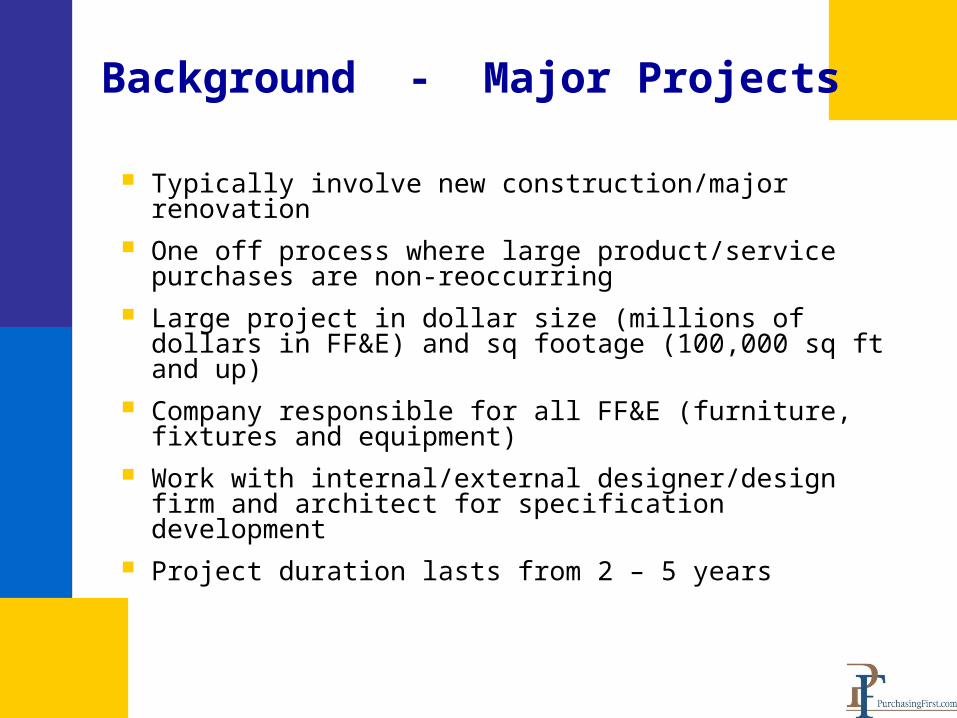
Background - Major Projects
Typically involve new construction/major renovation One off process where large product/service
purchases are non-reoccurring Large project in dollar size (millions of dollars in
FF&E) and sq footage (100,000 sq ft and up) Company responsible for all FF&E (furniture,
fixtures and equipment) Work with internal/external designer/design firm and
architect for specification development Project duration lasts from 2 – 5 years
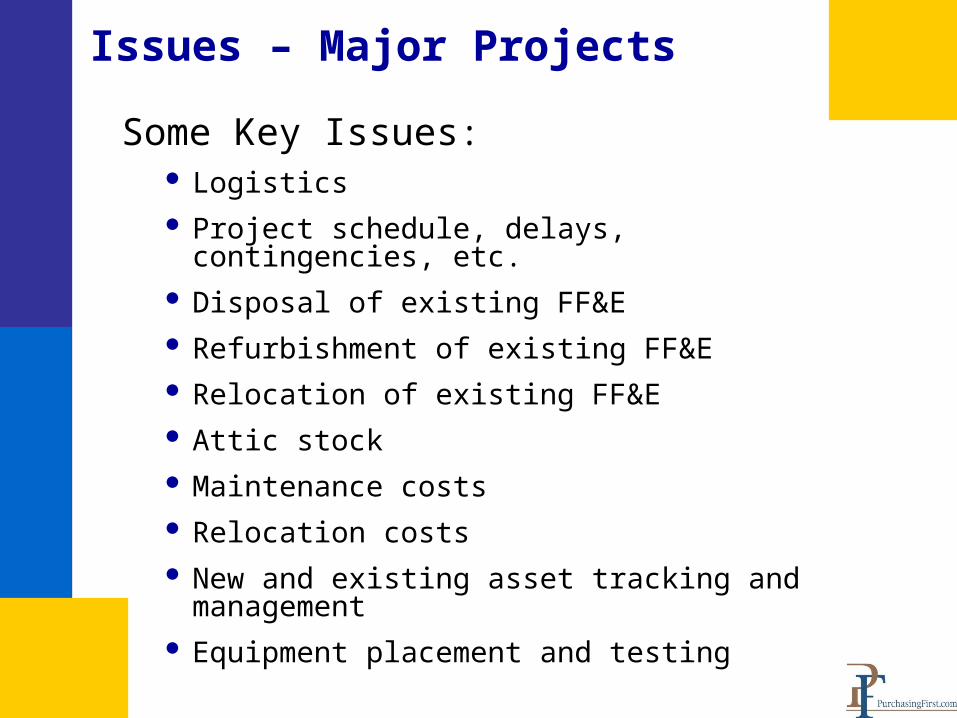
Issues – Major Projects
Some Key Issues: Logistics Project schedule, delays, contingencies, etc. Disposal of existing FF&E Refurbishment of existing FF&E Relocation of existing FF&E Attic stock Maintenance costs Relocation costs New and existing asset tracking and
management Equipment placement and testing
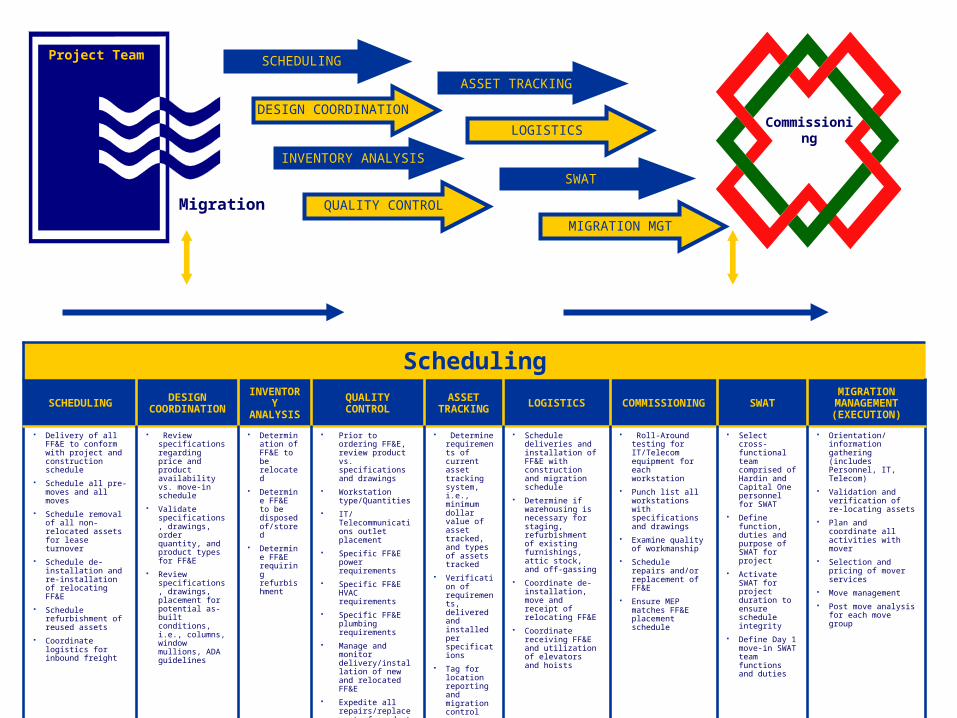
Hardin/Cap One
Commissioning
Project Team
Migration
SCHEDULING
DESIGN COORDINATION
SWAT
ASSET TRACKING
INVENTORY ANALYSIS
MIGRATION MGT
LOGISTICS
QUALITY CONTROL
Scheduling
SCHEDULINGDESIGN
COORDINATION
INVENTORY
ANALYSIS
QUALITY CONTROL
ASSET TRACKING LOGISTICS COMMISSIONIN
G SWATMIGRATION
MANAGEMENT (EXECUTION)
Delivery of all FF&E to conform with project and construction schedule
Schedule all pre-moves and all moves
Schedule removal of all non-relocated assets for lease turnover
Schedule de-installation and re-installation of relocating FF&E
Schedule refurbishment of reused assets
Coordinate logistics for inbound freight
Review specifications regarding price and product availability vs. move-in schedule
Validate specifications, drawings, order quantity, and product types for FF&E
Review specifications, drawings, placement for potential as-built conditions, i.e., columns, window mullions, ADA guidelines
Determination of FF&E to be relocated
Determine FF&E to be disposed of/stored
Determine FF&E requiring refurbishment
Prior to ordering FF&E, review product vs. specifications and drawings
Workstation type/Quantities
IT/Telecommunications outlet placement
Specific FF&E power requirements
Specific FF&E HVAC requirements
Specific FF&E plumbing requirements
Manage and monitor delivery/installation of new and relocated FF&E
Expedite all repairs/replacement of product
Determine requirements of current asset tracking system, i.e., minimum dollar value of asset tracked, and types of assets tracked
Verification of requirements, delivered and installed per specifications
Tag for location reporting and migration control
Schedule deliveries and installation of FF&E with construction and migration schedule
Determine if warehousing is necessary for staging, refurbishment of existing furnishings, attic stock, and off-gassing
Coordinate de-installation, move and receipt of relocating FF&E
Coordinate receiving FF&E and utilization of elevators and hoists
Roll-Around testing for IT/Telecom equipment for each workstation
Punch list all workstations with specifications and drawings
Examine quality of workmanship
Schedule repairs and/or replacement of FF&E
Ensure MEP matches FF&E placement schedule
Select cross-functional team comprised of Hardin and Capital One personnel for SWAT
Define function, duties and purpose of SWAT for project
Activate SWAT for project duration to ensure schedule integrity
Define Day 1 move-in SWAT team functions and duties
Orientation/information gathering (includes Personnel, IT, Telecom)
Validation and verification of re-locating assets
Plan and coordinate all activities with mover
Selection and pricing of mover services
Move management
Post move analysis for each move group
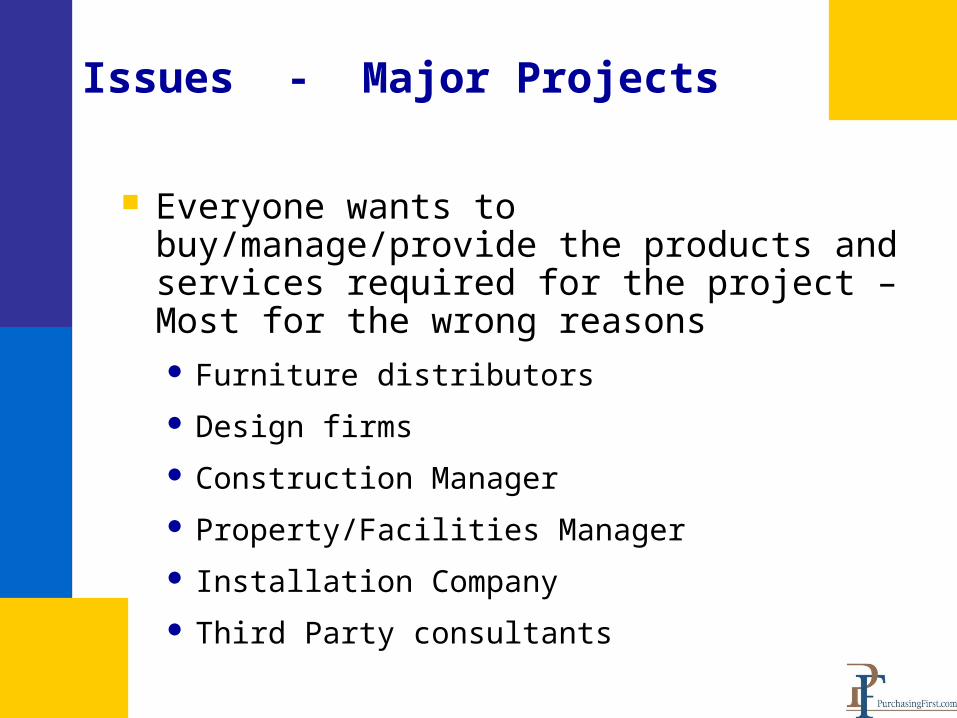
Issues - Major Projects
Everyone wants to buy/manage/provide the products and services required for the project – Most for the wrong reasons Furniture distributors
Design firms
Construction Manager
Property/Facilities Manager
Installation Company
Third Party consultants
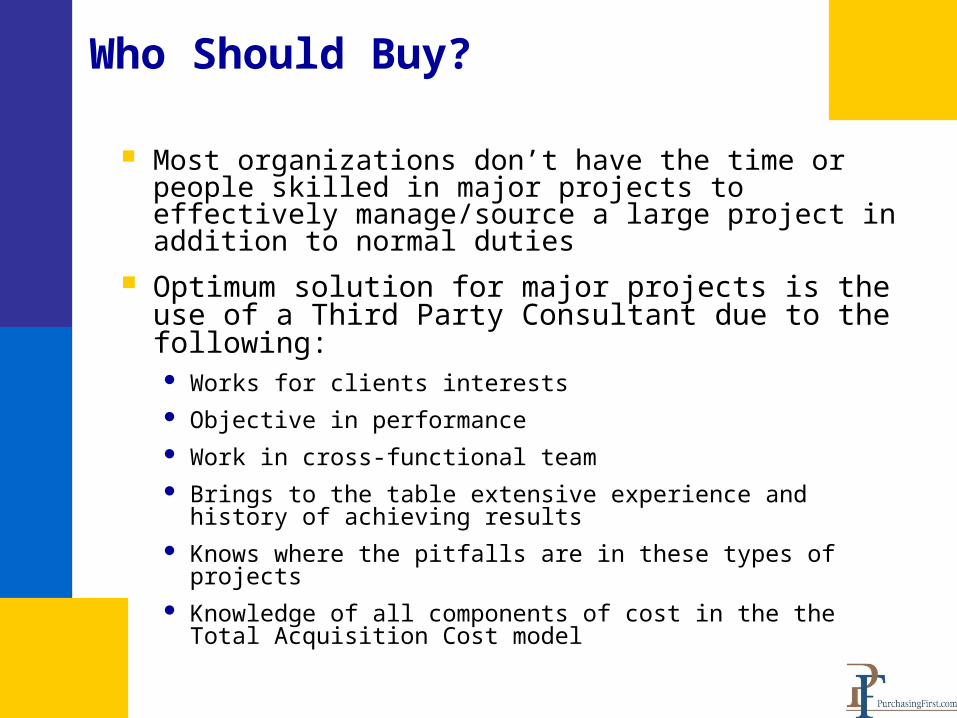
Who Should Buy?
Most organizations don’t have the time or people skilled in major projects to effectively manage/source a large project in addition to normal duties
Optimum solution for major projects is the use of a Third Party Consultant due to the following: Works for clients interests Objective in performance Work in cross-functional team Brings to the table extensive experience and history of
achieving results Knows where the pitfalls are in these types of projects Knowledge of all components of cost in the the Total
Acquisition Cost model
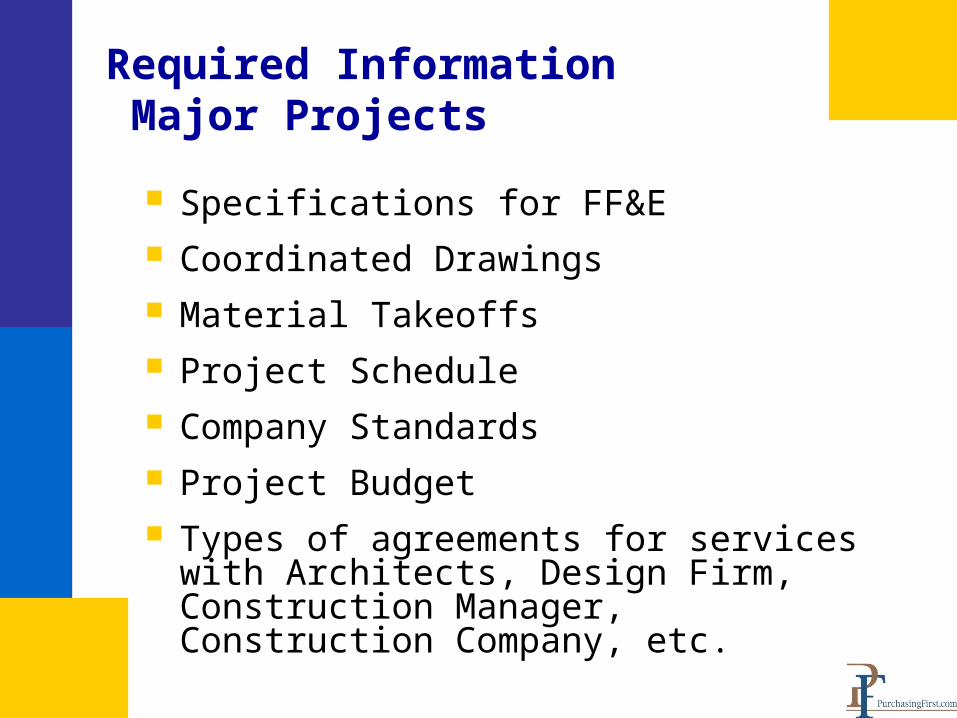
Required Information Major Projects
Specifications for FF&E Coordinated Drawings Material Takeoffs Project Schedule Company Standards Project Budget Types of agreements for services with
Architects, Design Firm, Construction Manager, Construction Company, etc.
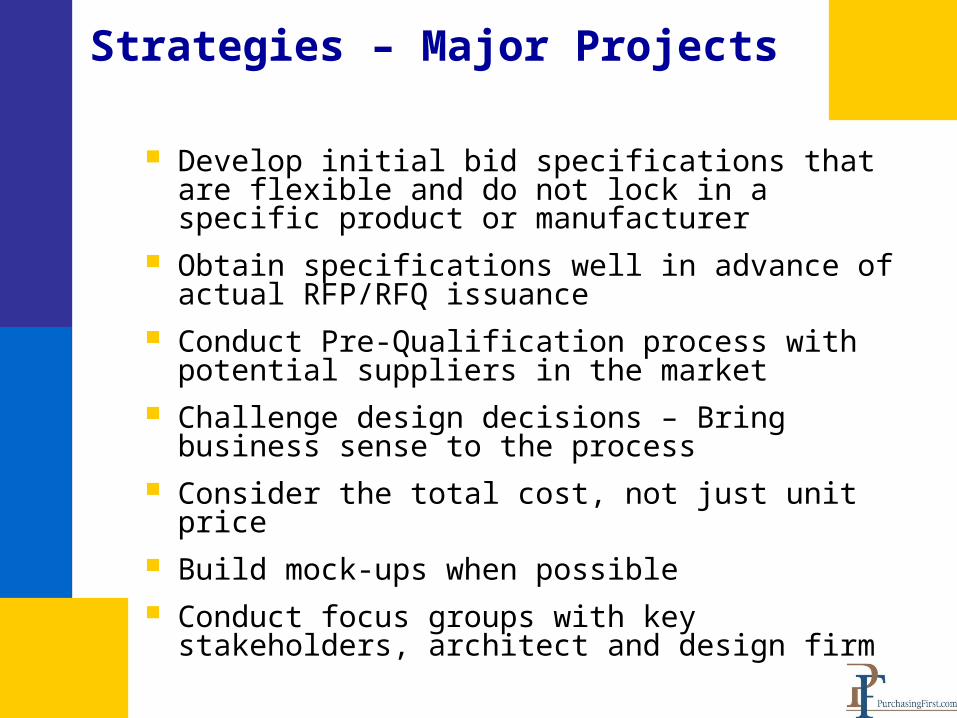
Strategies – Major Projects
Develop initial bid specifications that are flexible and do not lock in a specific product or manufacturer
Obtain specifications well in advance of actual RFP/RFQ issuance
Conduct Pre-Qualification process with potential suppliers in the market
Challenge design decisions – Bring business sense to the process
Consider the total cost, not just unit price Build mock-ups when possible Conduct focus groups with key stakeholders,
architect and design firm
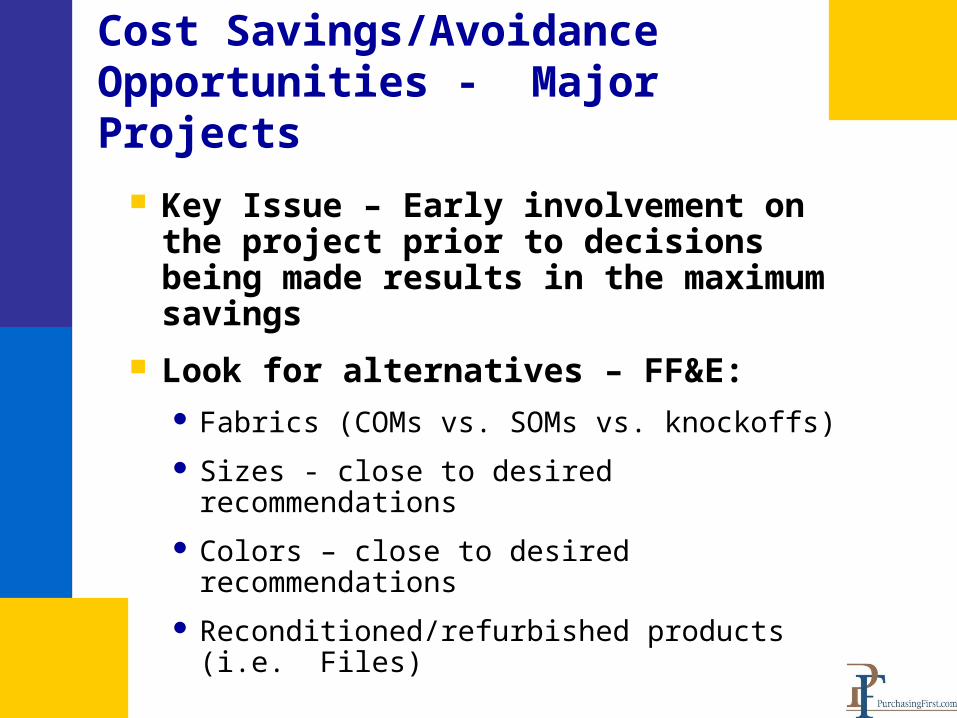
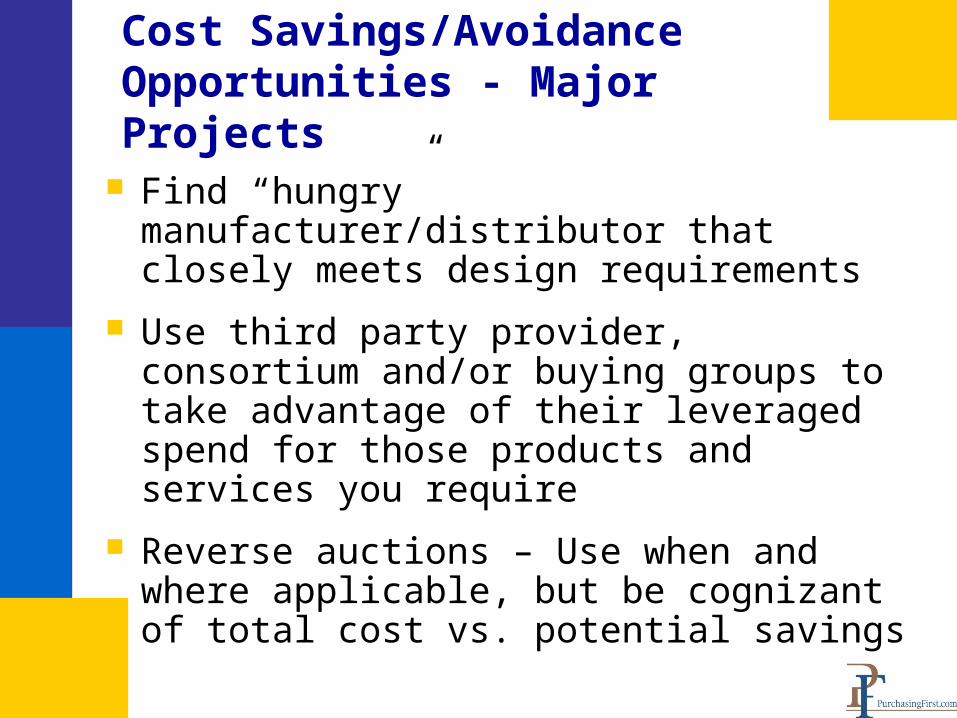
Cost Savings/Avoidance Opportunities - Major Projects
Key Issue – Early involvement on the project prior to decisions being made results in the maximum savings
Look for alternatives – FF&E: Fabrics (COMs vs. SOMs vs. knockoffs)
Sizes - close to desired recommendations
Colors – close to desired recommendations
Reconditioned/refurbished products (i.e. Files)
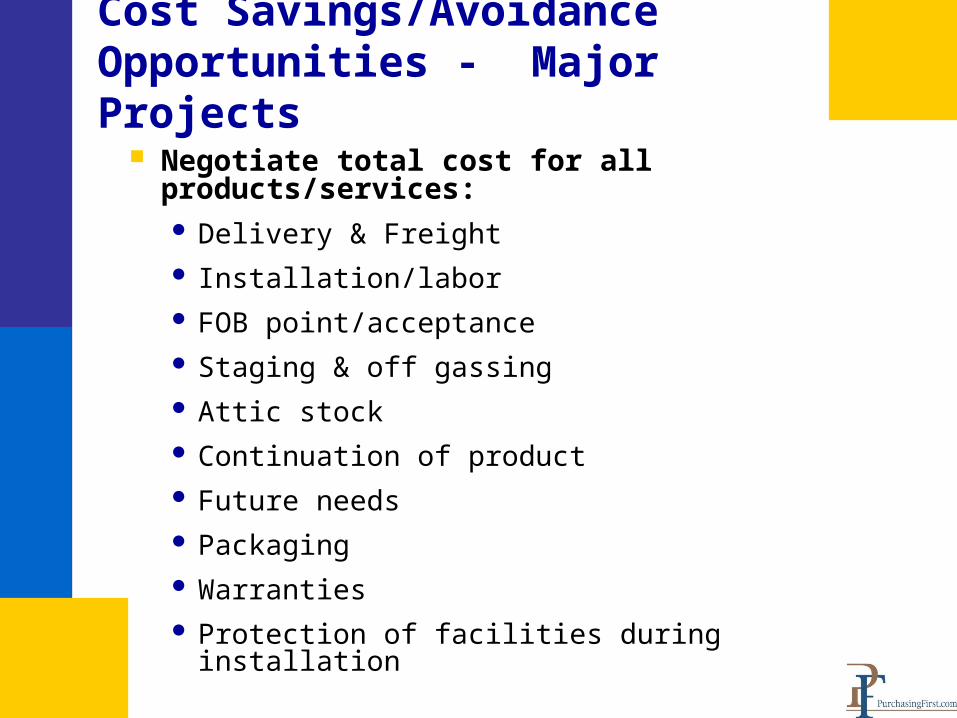
Cost Savings/Avoidance Opportunities - Major Projects
Negotiate total cost for all products/services: Delivery & Freight Installation/labor FOB point/acceptance Staging & off gassing Attic stock Continuation of product Future needs Packaging Warranties Protection of facilities during installation
Cost Savings/Avoidance Opportunities - Major Projects
Find “hungry” manufacturer/distributor that closely meets design requirements
Use third party provider, consortium and/or buying groups to take advantage of their leveraged spend for those products and services you require
Reverse auctions – Use when and where applicable, but be cognizant of total cost vs. potential savings
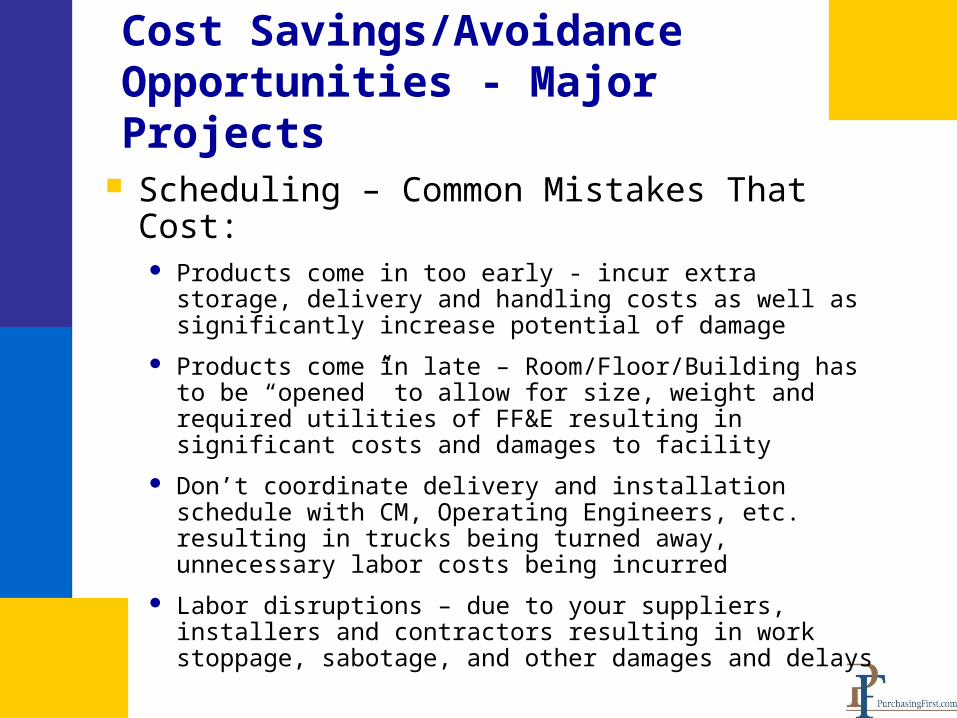
Cost Savings/Avoidance Opportunities - Major Projects
Scheduling – Common Mistakes That Cost: Products come in too early - incur extra storage, delivery
and handling costs as well as significantly increase potential of damage
Products come in late – Room/Floor/Building has to be “opened” to allow for size, weight and required utilities of FF&E resulting in significant costs and damages to facility
Don’t coordinate delivery and installation schedule with CM, Operating Engineers, etc. resulting in trucks being turned away, unnecessary labor costs being incurred
Labor disruptions – due to your suppliers, installers and contractors resulting in work stoppage, sabotage, and other damages and delays
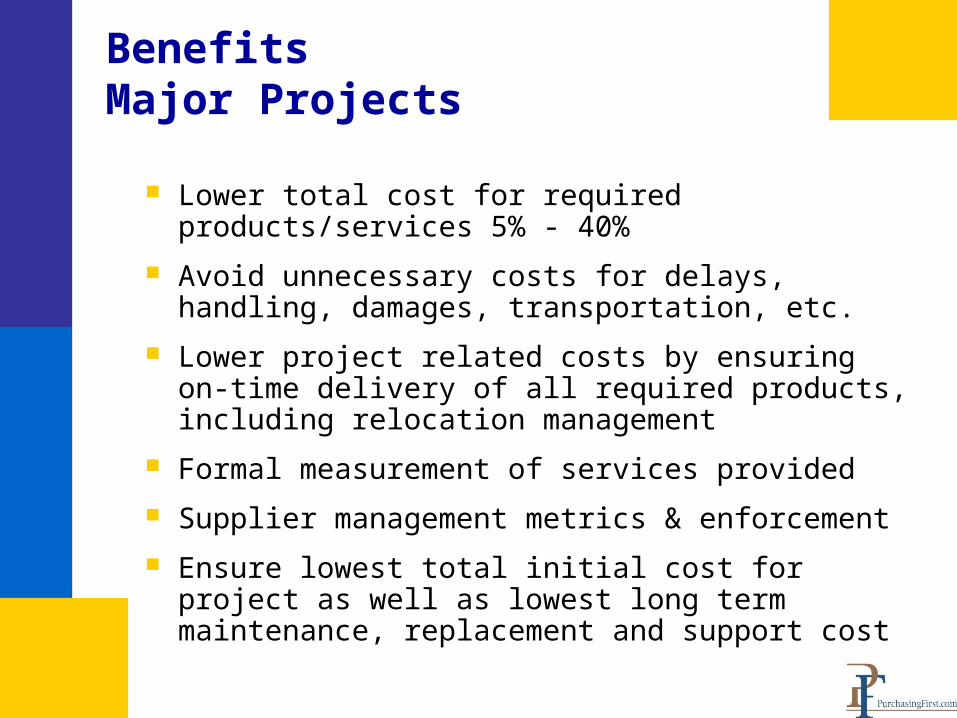
Benefits Major Projects
Lower total cost for required products/services 5% - 40%
Avoid unnecessary costs for delays, handling, damages, transportation, etc.
Lower project related costs by ensuring on-time delivery of all required products, including relocation management
Formal measurement of services provided
Supplier management metrics & enforcement
Ensure lowest total initial cost for project as well as lowest long term maintenance, replacement and support cost
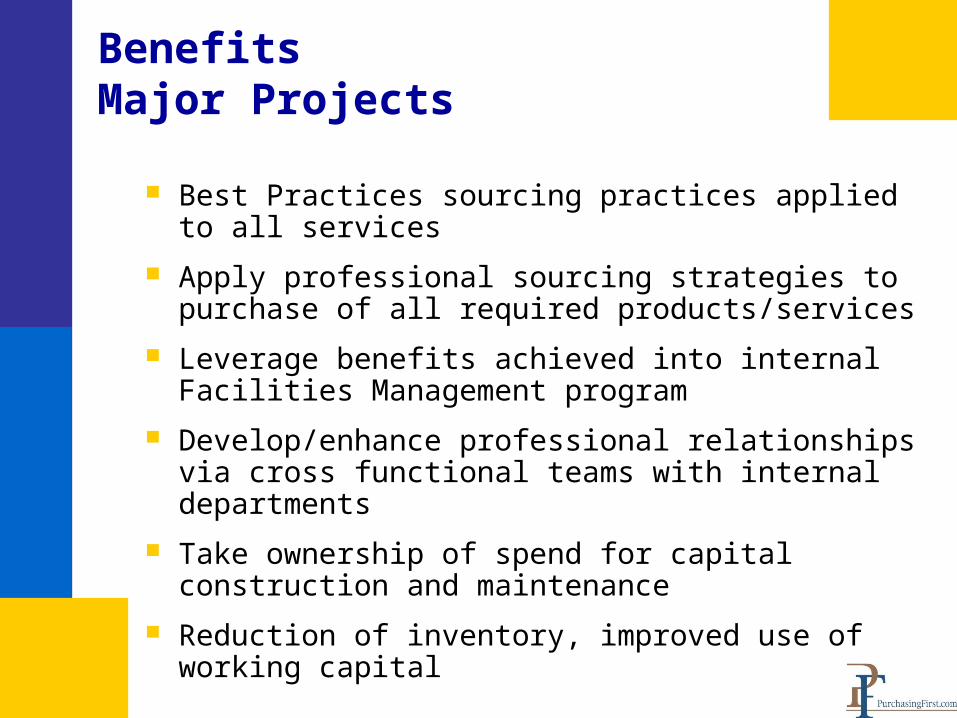
Benefits Major Projects
Best Practices sourcing practices applied to all services
Apply professional sourcing strategies to purchase of all required products/services
Leverage benefits achieved into internal Facilities Management program
Develop/enhance professional relationships via cross functional teams with internal departments
Take ownership of spend for capital construction and maintenance
Reduction of inventory, improved use of working capital
Facilities Management
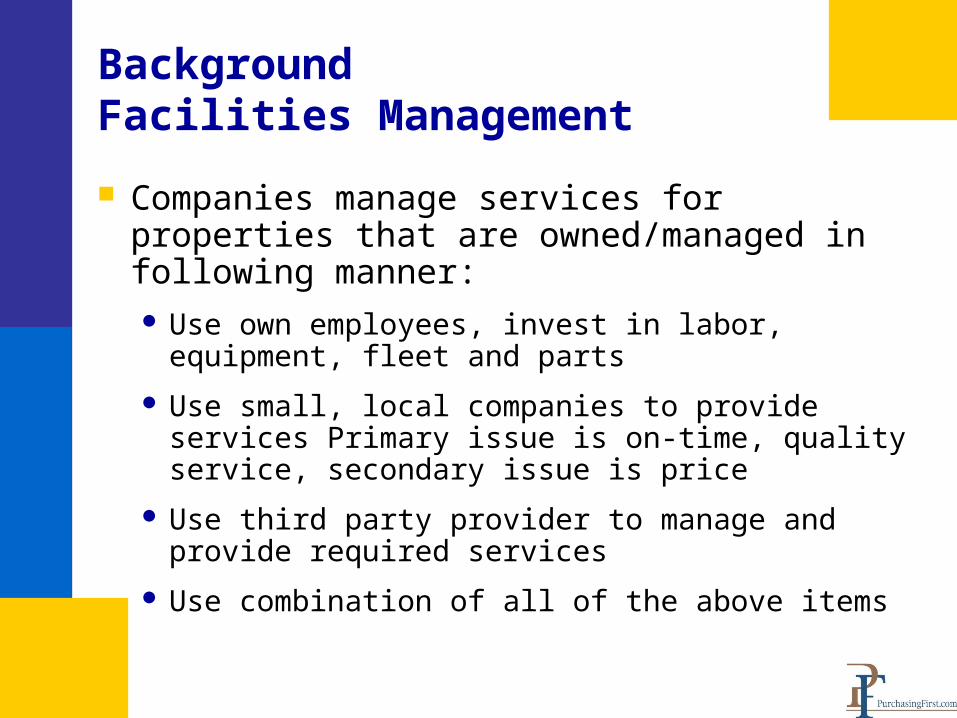
Background Facilities Management
Companies manage services for properties that are owned/managed in following manner: Use own employees, invest in labor, equipment,
fleet and parts
Use small, local companies to provide services Primary issue is on-time, quality service, secondary issue is price
Use third party provider to manage and provide required services
Use combination of all of the above items
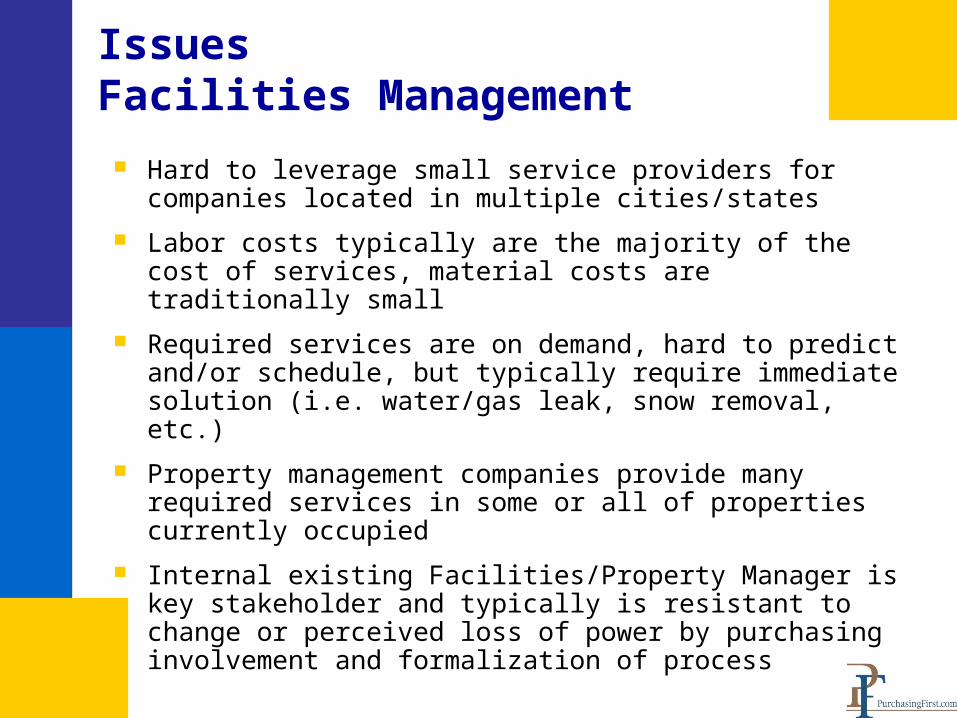
IssuesFacilities Management
Hard to leverage small service providers for companies located in multiple cities/states
Labor costs typically are the majority of the cost of services, material costs are traditionally small
Required services are on demand, hard to predict and/or schedule, but typically require immediate solution (i.e. water/gas leak, snow removal, etc.)
Property management companies provide many required services in some or all of properties currently occupied
Internal existing Facilities/Property Manager is key stakeholder and typically is resistant to change or perceived loss of power by purchasing involvement and formalization of process
Methodology
Opportunity Identification
Dedicate Resources
Establish Comprehensive Purchasing Procedures
Build Organizational Support
Develop Performance Metrics
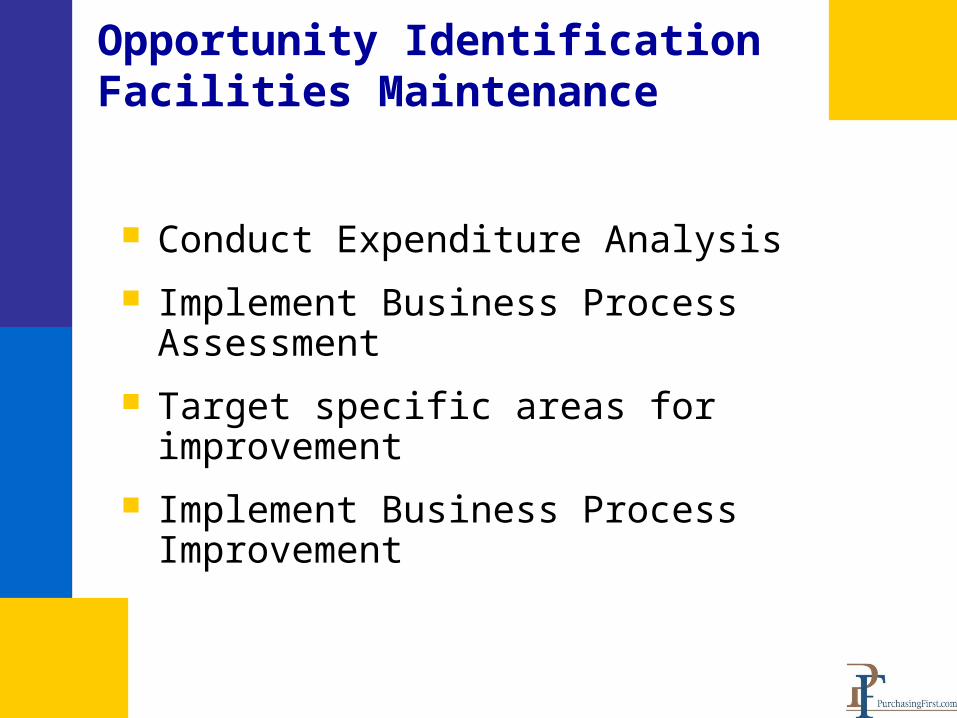
Opportunity IdentificationFacilities Maintenance
Conduct Expenditure Analysis
Implement Business Process Assessment
Target specific areas for improvement
Implement Business Process Improvement
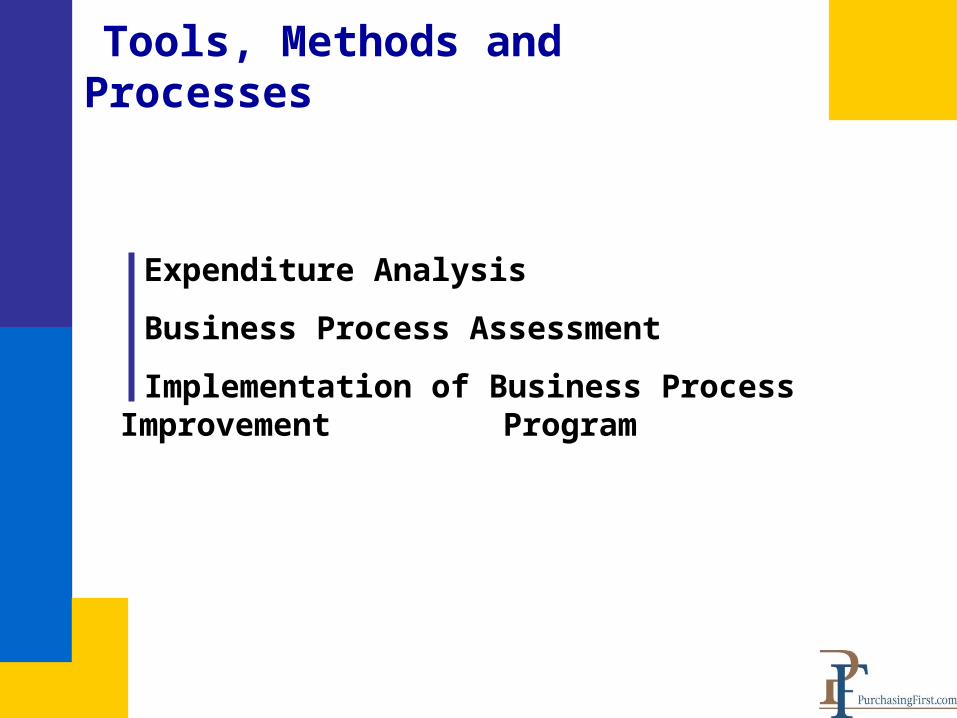
Tools, Methods and Processes
Expenditure Analysis
Business Process Assessment
Implementation of Business Process Improvement Program
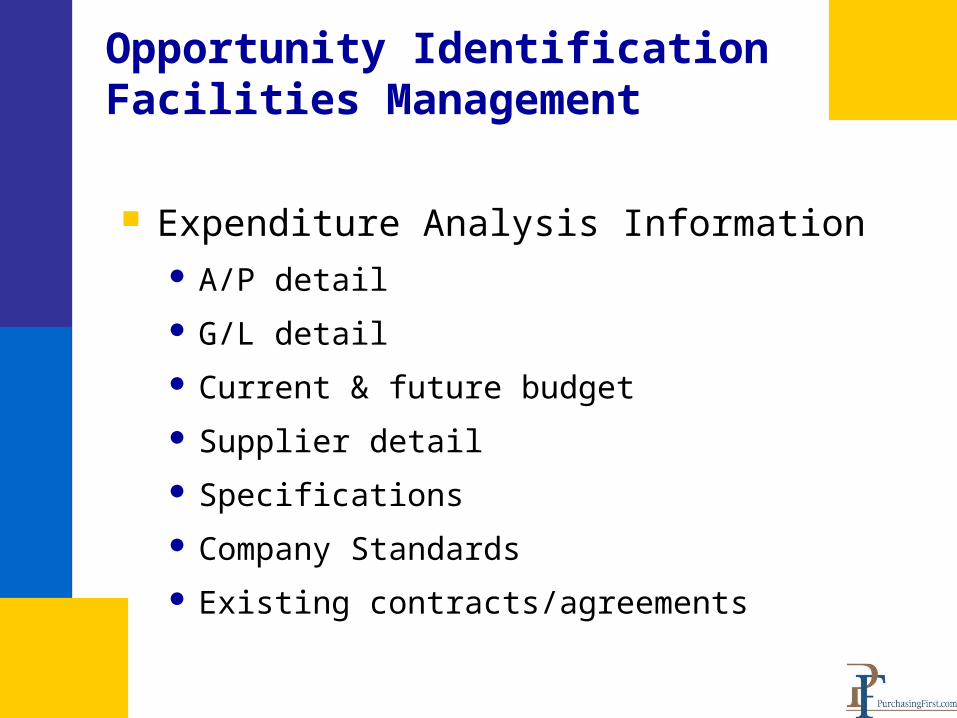
Opportunity IdentificationFacilities Management
Expenditure Analysis Information A/P detail
G/L detail
Current & future budget
Supplier detail
Specifications
Company Standards
Existing contracts/agreements

Expenditure Analysis
Conduct selective benchmarking and price validation for all products and services
Develop data base detailing the following:• Current unit price
• Product and service specifications
• Total cost spent per product and service
• Part numbers and/or other relevant identification of products currently utilized
• Spend by each supplier of similar product and service provided
• Identification of all providers of similar products and services
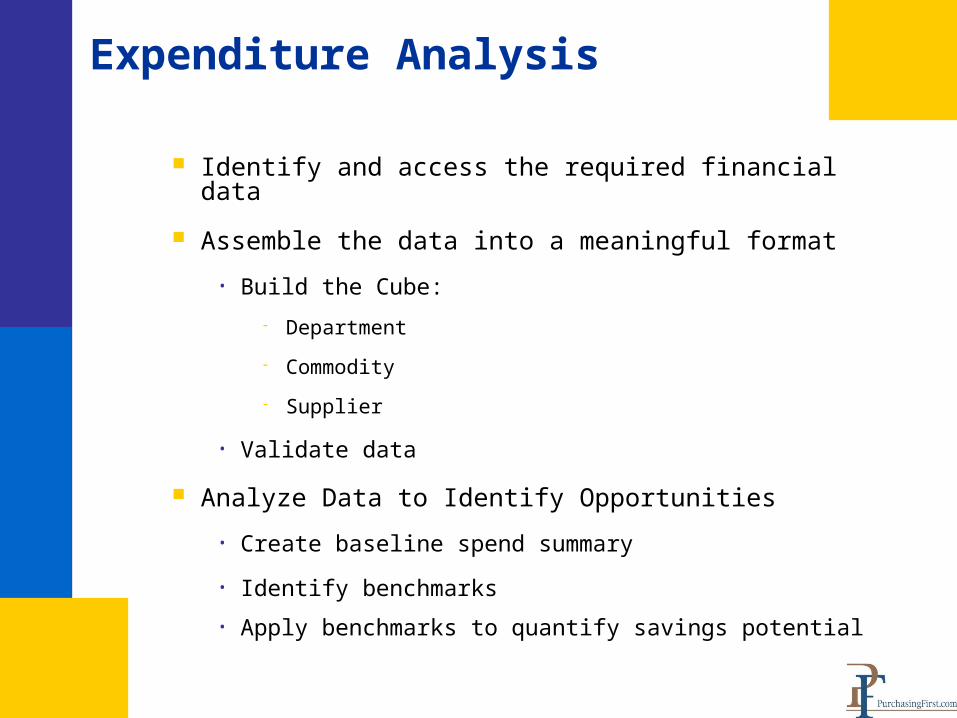
Identify and access the required financial data
Assemble the data into a meaningful format
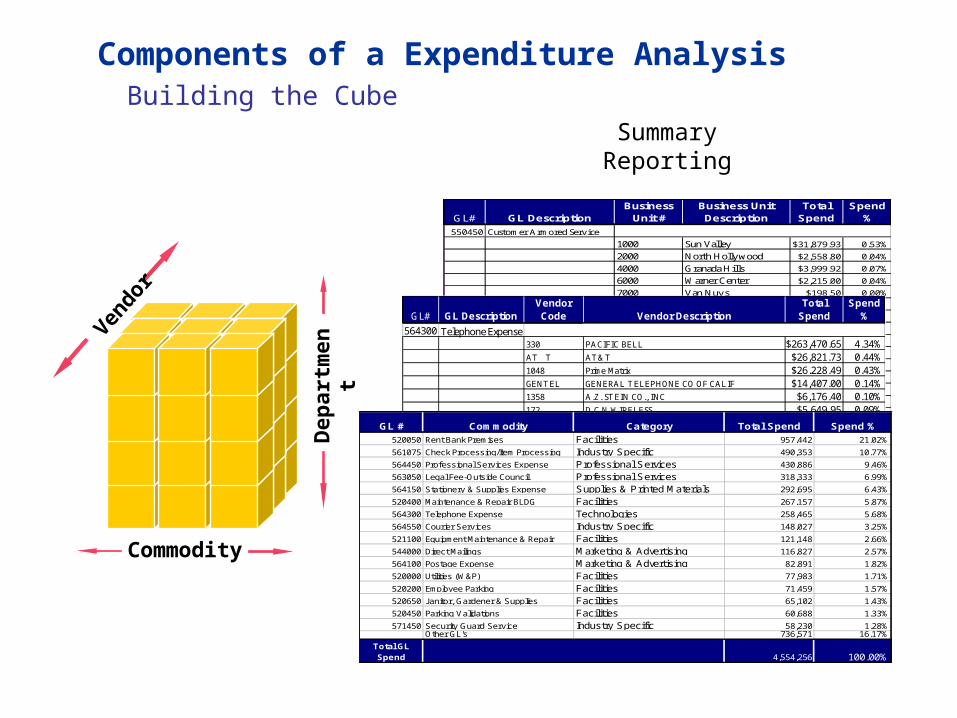
• Build the Cube:
Department
Commodity
Supplier
• Validate data
Analyze Data to Identify Opportunities
• Create baseline spend summary
• Identify benchmarks
• Apply benchmarks to quantify savings potential
Expenditure Analysis
Expenditure Analysis
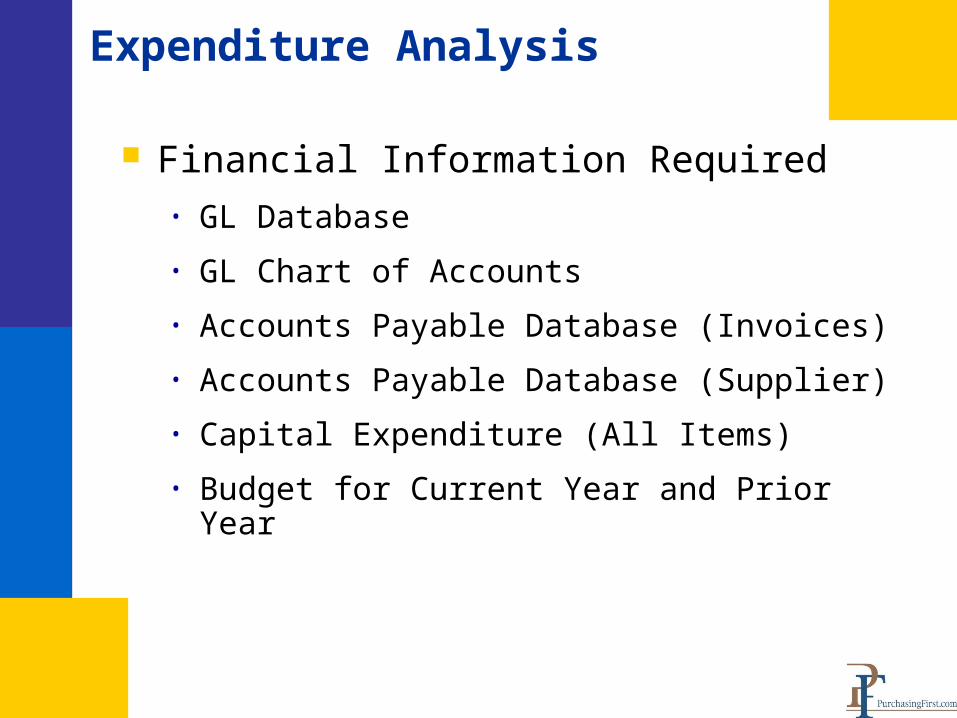
Financial Information Required• GL Database
• GL Chart of Accounts
• Accounts Payable Database (Invoices)
• Accounts Payable Database (Supplier)
• Capital Expenditure (All Items)
• Budget for Current Year and Prior Year
Building the Cube
Components of a Expenditure Analysis V
endo
r
Dep
artm
ent
Commodity
Summary Reporting
GL# GL DescriptionBusiness
Unit #Business Unit Description
Total Spend
Spend %
550450 Customer Armored Service
1000 Sun Valley $31,879.93 0.53%
2000 North Hollywood $2,558.80 0.04%
4000 Granada Hills $3,999.92 0.07%
6000 Warner Center $2,215.00 0.04%
7000 Van Nuys $198.50 0.00%
GL# GL DescriptionVendor Code Vendor Description
Total Spend
Spend %
564300 Telephone Expense330 PACIFIC BELL $263,470.65 4.34%AT T AT&T $26,821.73 0.44%1048 Prime Matrix $26,228.49 0.43%GENTEL GENERAL TELEPHONE CO OF CALIF $14,407.00 0.14%1358 A.Z. STEIN CO., INC $6,176.40 0.10%172 D.C.N WIRELESS $5,649.95 0.09%1355 DEPARTMENT OF WATER & POWER $1,000.00 0.02%GL # Commodity Category Total Spend Spend %
520050 Rent Bank Premises Facilities 957,442 21.02%
561075 Check Processing/Item Processing Industry Specific 490,353 10.77%
564450 Professional Services Expense Professional Services 430,886 9.46%
563050 Legal Fee-Outside Council Professional Services 318,333 6.99%
564150 Stationery & Supplies Expense Supplies & Printed Materials 292,695 6.43%
520400 Maintenance & Repair BLDG Facilities 267,157 5.87%
564300 Telephone Expense Technologies 258,465 5.68%
564550 Courier Services Industry Specific 148,027 3.25%
521100 Equipment Maintenance & Repair Facilities 121,148 2.66%
544000 Direct Mailings Marketing & Advertising 116,827 2.57%
564100 Postage Expense Marketing & Advertising 82,891 1.82%
520000 Utilities (W&P) Facilities 77,983 1.71%
520200 Employee Parking Facilities 71,459 1.57%
520650 Janitor, Gardener & Supplies Facilities 65,102 1.43%
520450 Parking Validations Facilities 60,688 1.33%
571450 Security Guard Service Industry Specific 58,230 1.28%Other GL's 736,571 16.17%
Total GL Spend 4,554,256 100.00%
Expenditure Analysis
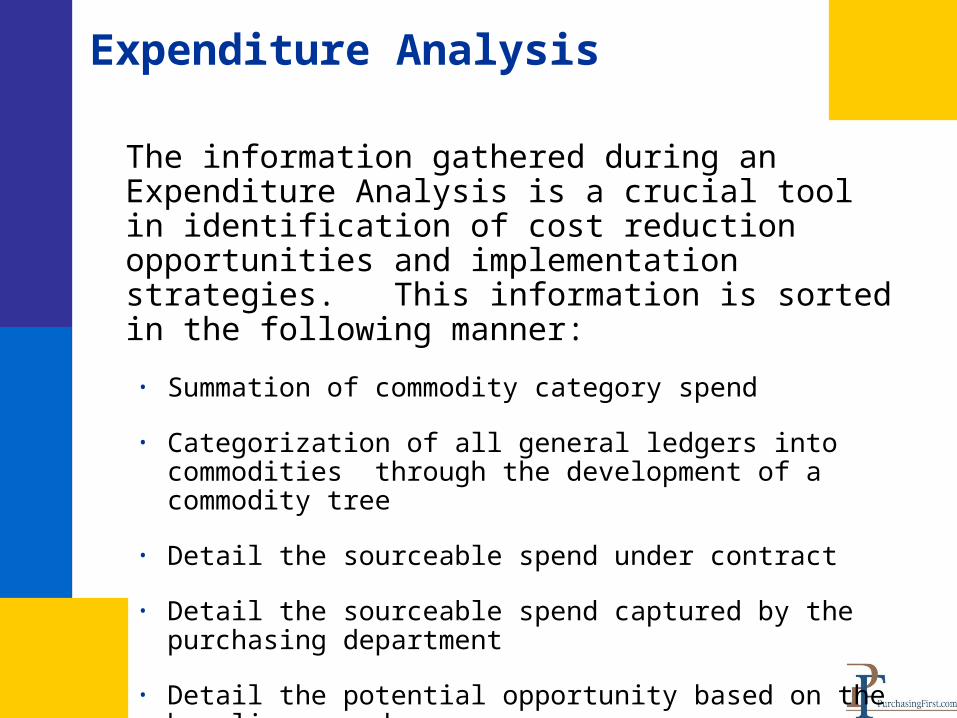
The information gathered during an Expenditure Analysis is a crucial tool in identification of cost reduction opportunities and implementation strategies. This information is sorted in the following manner:
• Summation of commodity category spend
• Categorization of all general ledgers into commodities through the development of a commodity tree
• Detail the sourceable spend under contract
• Detail the sourceable spend captured by the purchasing department
• Detail the potential opportunity based on the baseline spend
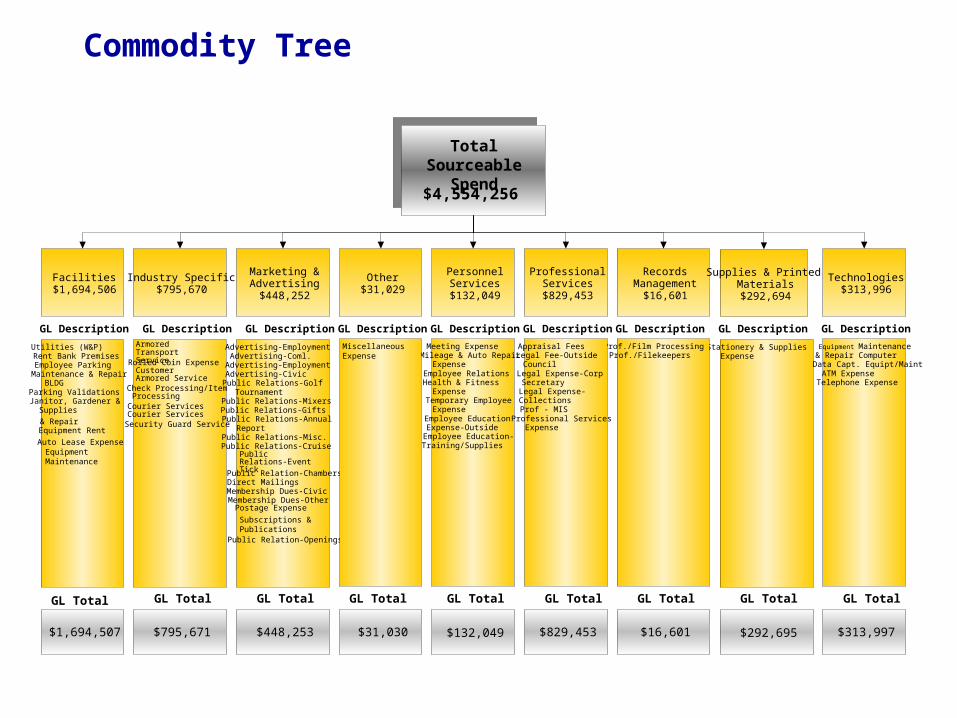
Total Sourceable Spend
$4,554,256
Facilities$1,694,506
Industry Specific$795,670
Marketing &Advertising$448,252
Other$31,029
PersonnelServices$132,049
ProfessionalServices$829,453
RecordsManagement
$16,601
Supplies & PrintedMaterials$292,694
Technologies$313,996
Armored Transport ServiceRolled Coin ExpenseCustomer Armored ServiceCheck Processing/ItemProcessingCourier ServicesCourier ServicesSecurity Guard Service
Advertising-EmploymentAdvertising-Coml.
Advertising-EmploymentAdvertising-CivicPublic Relations-GolfTournament
Public Relations-MixersPublic Relations-GiftsPublic Relations-AnnualReport
Public Relations-Misc.Public Relations-Cruise
Public Relations-Event Tick
Public Relation-Openings
Public Relation-ChambersDirect Mailings
Membership Dues-CivicMembership Dues-Other
Subscriptions & Publications
Postage Expense
Meeting ExpenseMileage & Auto RepairExpense
Employee RelationsHealth & FitnessExpense
Temporary EmployeeExpense
Employee EducationExpense-OutsideEmployee Education-Training/Supplies
Equipment Maintenance& Repair ComputerData Capt. Equipt/MaintATM ExpenseTelephone Expense
Stationery & SuppliesExpense
Prof./Film ProcessingProf./Filekeepers
Appraisal FeesLegal Fee-OutsideCouncil
Legal Expense-CorpSecretaryLegal Expense-CollectionsProf - MIS
Professional ServicesExpense
Miscellaneous Expense
$1,694,507 $795,671 $448,253 $31,030 $132,049 $16,601$829,453 $292,695 $313,997
Utilities (W&P)Rent Bank PremisesEmployee ParkingMaintenance & RepairBLDG
Parking ValidationsJanitor, Gardener &Supplies
Equipment Maintenance
& RepairEquipment Rent
Auto Lease Expense
GL Description
GL TotalGL TotalGL Total GL Total GL Total GL Total GL Total GL TotalGL Total
GL Description GL Description GL Description GL Description GL Description GL Description GL Description GL Description
Commodity Tree
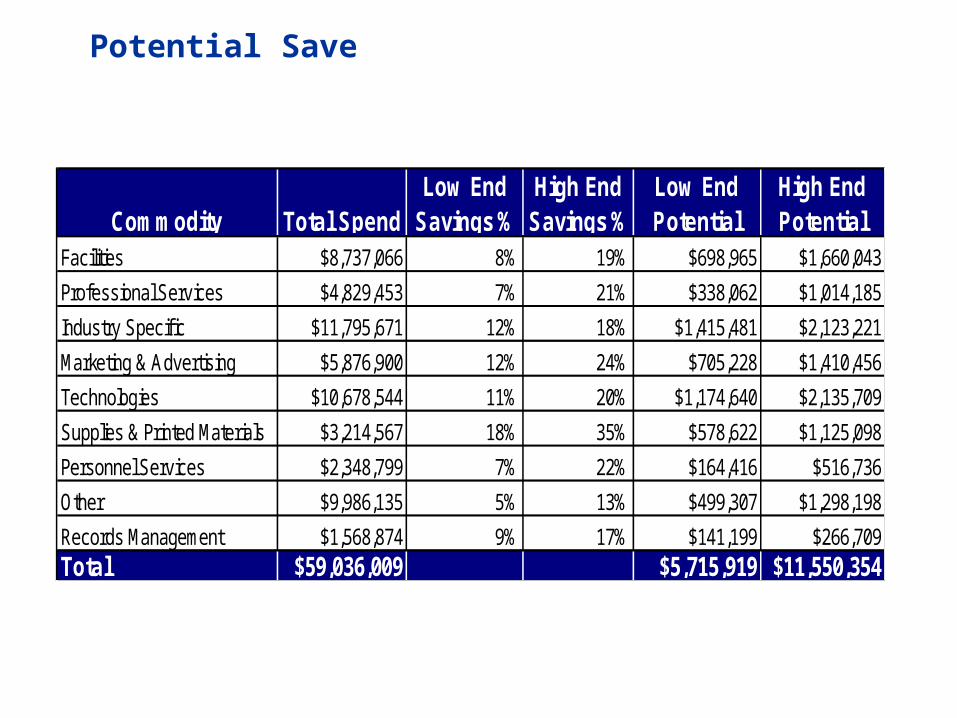
Potential Save
Commodity Total SpendLow End
Savings %High End
Savings %Low End Potential
High End Potential
Facilities $8,737,066 8% 19% $698,965 $1,660,043
Professional Services $4,829,453 7% 21% $338,062 $1,014,185
Industry Specif ic $11,795,671 12% 18% $1,415,481 $2,123,221
Marketing & Advertising $5,876,900 12% 24% $705,228 $1,410,456
Technologies $10,678,544 11% 20% $1,174,640 $2,135,709
Supplies & Printed Materials $3,214,567 18% 35% $578,622 $1,125,098
Personnel Services $2,348,799 7% 22% $164,416 $516,736
Other $9,986,135 5% 13% $499,307 $1,298,198
Records Management $1,568,874 9% 17% $141,199 $266,709Total $59,036,009 $5,715,919 $11,550,354
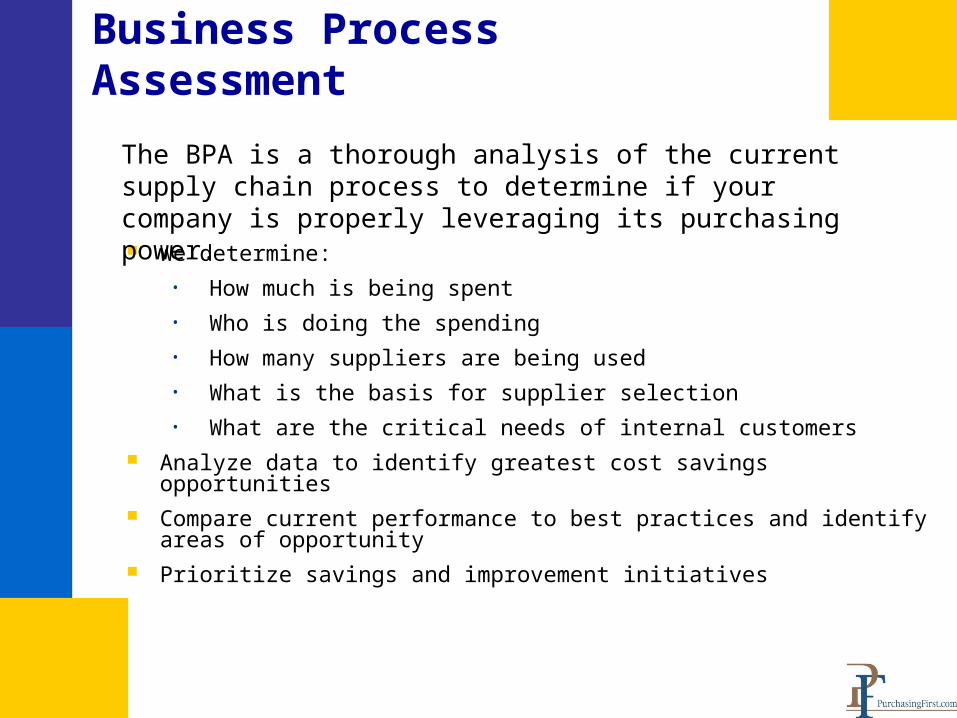
We determine:
• How much is being spent
• Who is doing the spending
• How many suppliers are being used
• What is the basis for supplier selection
• What are the critical needs of internal customers Analyze data to identify greatest cost savings opportunities Compare current performance to best practices and identify
areas of opportunity Prioritize savings and improvement initiatives
Business Process Assessment
The BPA is a thorough analysis of the current supply chain process to determine if your company is properly leveraging its purchasing power.
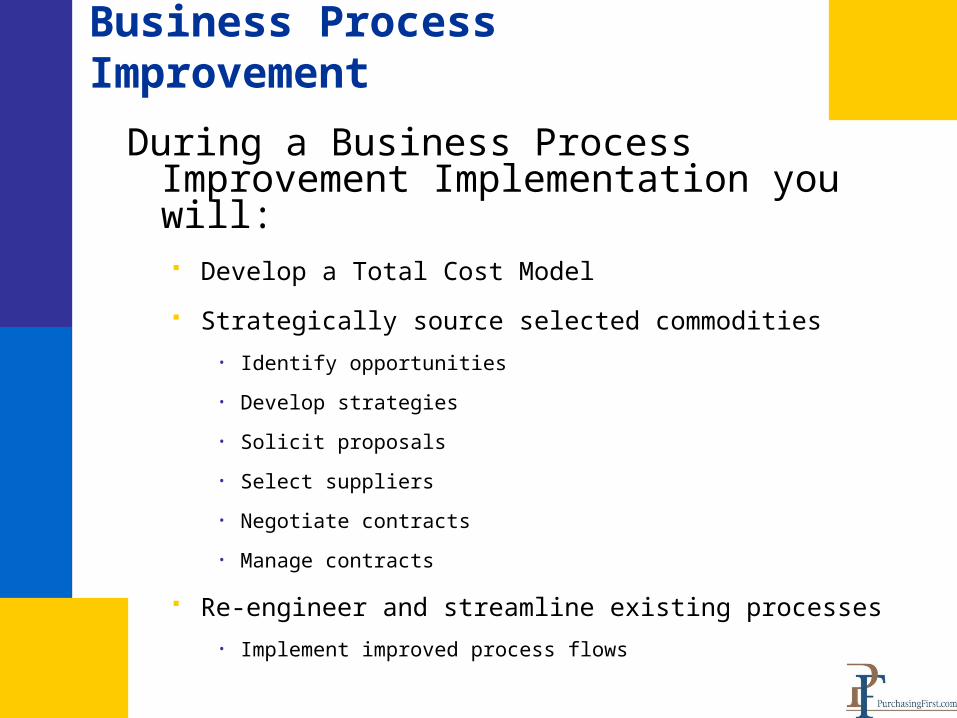
During a Business Process Improvement Implementation you will: Develop a Total Cost Model
Strategically source selected commodities
• Identify opportunities
• Develop strategies
• Solicit proposals
• Select suppliers
• Negotiate contracts
• Manage contracts
Re-engineer and streamline existing processes
• Implement improved process flows
Business Process Improvement
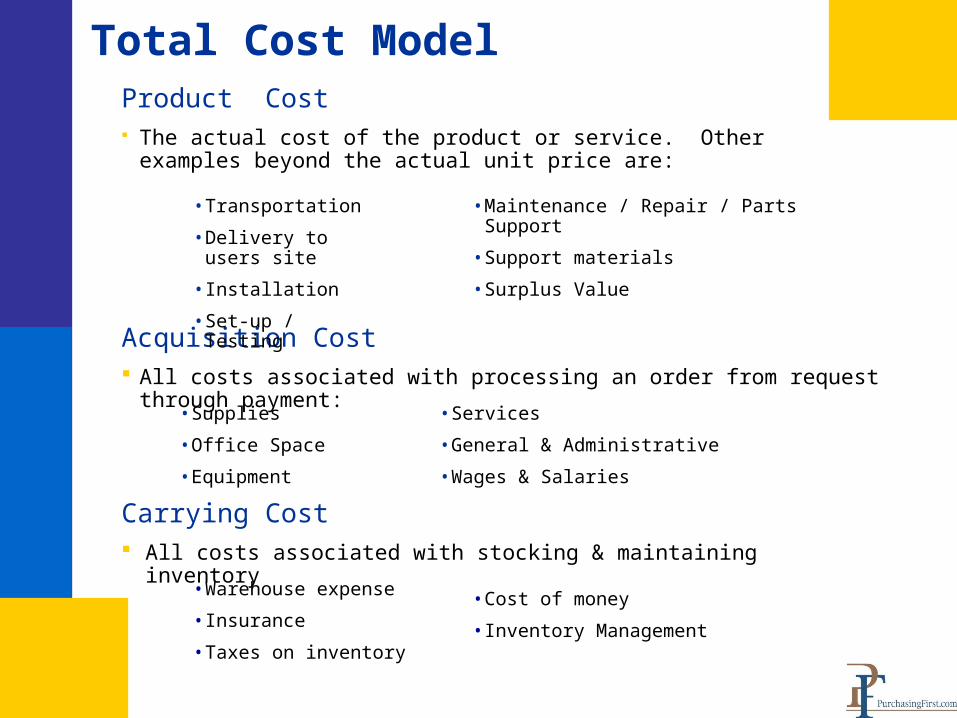
Acquisition Cost All costs associated with processing an order from request through payment:
Total Cost ModelProduct Cost The actual cost of the product or service. Other examples beyond the
actual unit price are:
• Maintenance / Repair / Parts Support
• Support materials
• Surplus Value
• Transportation
• Delivery to users site
• Installation
• Set-up / Testing
• Supplies
• Office Space
• Equipment
• Services
• General & Administrative
• Wages & Salaries
Carrying Cost All costs associated with stocking & maintaining inventory
• Cost of money
• Inventory Management
• Warehouse expense
• Insurance
• Taxes on inventory
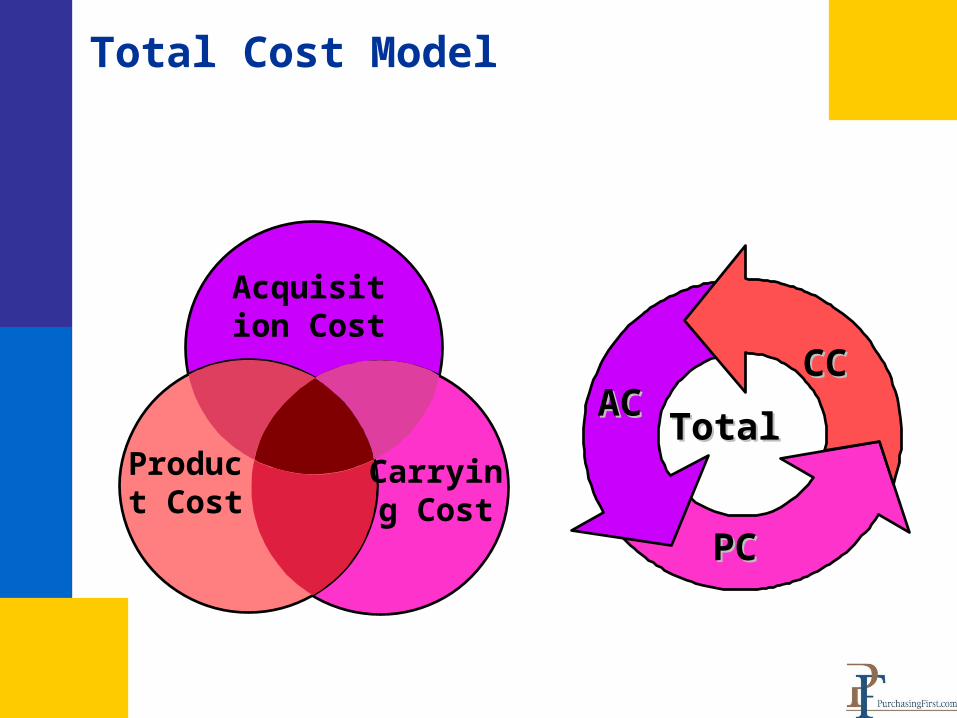
Total Cost Model
Acquisition Cost
Carrying Cost
Product Cost
ACACCCCC
PCPC
TotalTotal
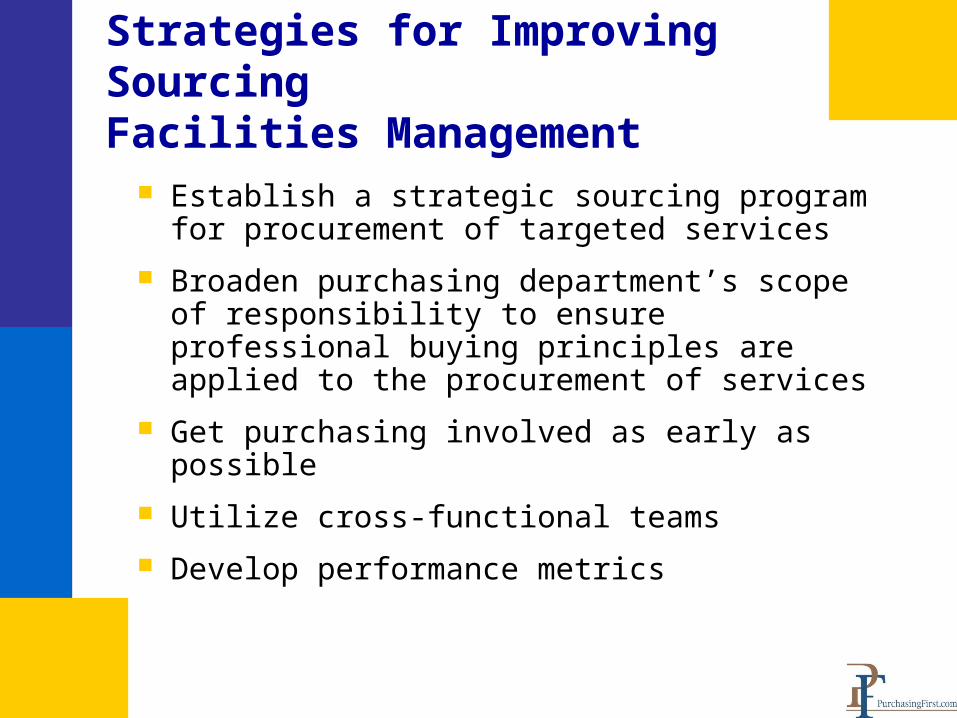
Strategies for Improving SourcingFacilities Management
Establish a strategic sourcing program for procurement of targeted services
Broaden purchasing department’s scope of responsibility to ensure professional buying principles are applied to the procurement of services
Get purchasing involved as early as possible
Utilize cross-functional teams
Develop performance metrics
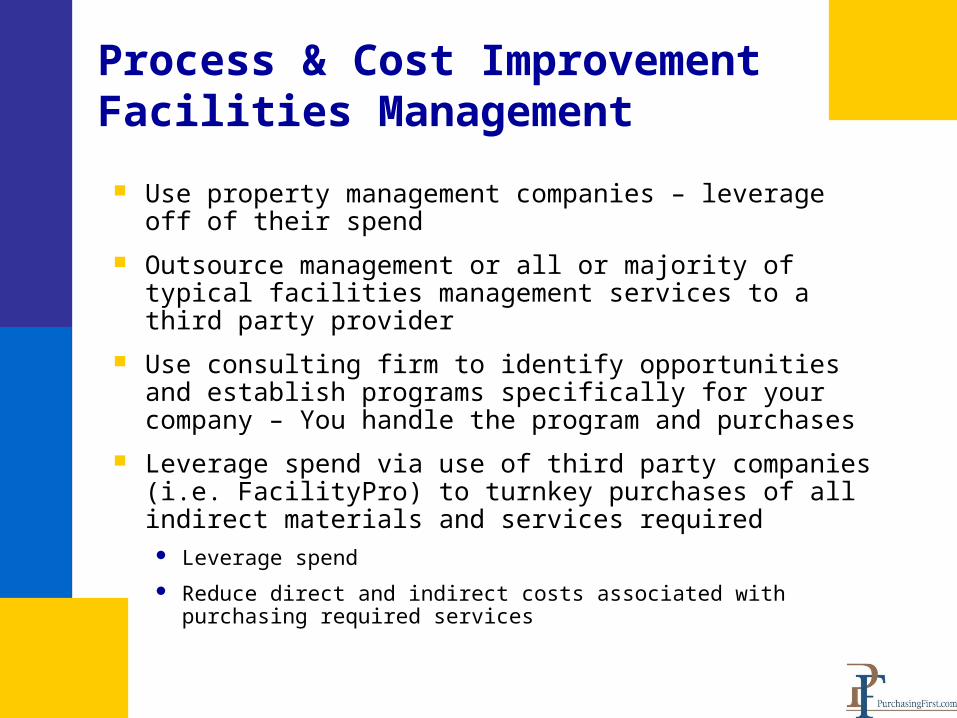
Process & Cost ImprovementFacilities Management
Use property management companies – leverage off of their spend
Outsource management or all or majority of typical facilities management services to a third party provider
Use consulting firm to identify opportunities and establish programs specifically for your company – You handle the program and purchases
Leverage spend via use of third party companies (i.e. FacilityPro) to turnkey purchases of all indirect materials and services required Leverage spend
Reduce direct and indirect costs associated with purchasing required services
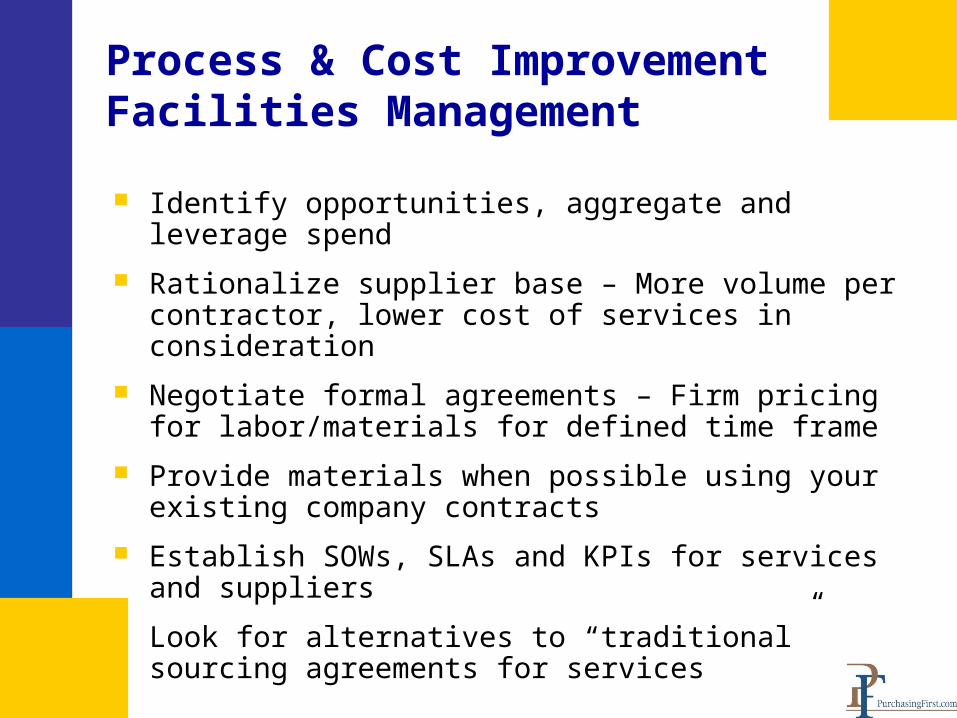
Process & Cost ImprovementFacilities Management
Identify opportunities, aggregate and leverage spend
Rationalize supplier base – More volume per contractor, lower cost of services in consideration
Negotiate formal agreements – Firm pricing for labor/materials for defined time frame
Provide materials when possible using your existing company contracts
Establish SOWs, SLAs and KPIs for services and suppliers
Look for alternatives to “traditional” sourcing agreements for services
OutsourcingFacilities Management
The IFMA Survey indicated that 35% of respondents say reducing costs and 30% say the focus on core competencies are the two primary drivers for outsourcing services
According to survey conducted by the International Facility Management Association (IFMA), the 10 services most often outsourced are:
Architectural design
Trash and waste removal
Housekeeping
Facility systems
Landscape maintenance
Property appraisals
Major Moves
Hazardous materials removed
Major redesigns
Furniture moves
Benefits Facilities Management
Lower total cost for required services – 10% - 30%
Formal measurement of services provided
Supplier management metrics & enforcement
Reduced A/P cost and FTEs – 5% - 20%
Rationalized supplier base – 50% reduction
Best Practices sourcing practices applied to all services
Move for reactive to proactive approach – contract administration vs. tactical buying
Reduction of inventory, improved use of working capital
Case Studies – Major ProjectsMerrill Lynch Global HeadquartersWorld Financial Center Project
$200 million procurement budget Documented savings totaling more than $40 million due
to analysis of proposed expenditures and development and implementation of recommended bidding and negotiation strategies
Managed and was responsible for purchasing, warehousing, receiving, installation, asset tracking and installation services
Negotiated contracts for all furniture, fixtures, floor covering, window treatment, capital equipment and services including television studio, audio visual systems, security systems, mail distribution systems, medical equipment, move and installation services
Challenges included moving 12,000 employees into the World Financial Center with minimal disruption to employees
Case StudiesState of Pennsylvania
The Keystone Building houses four state agencies and totals 940,000 square feet, $20 million budget. Responsibilities included:
Developed and verified specifications as well as the procurement, delivery, installation, and asset management of all new furniture, fixtures and equipment
Relocation management activities included development of the program materials, training and education, review of overall records retention policies, procedures and existing programs
Directed and coordinated the move of all personnel into the new facility from the nine facilities
Developed a procurement schedule, bid strategy and negotiating final pricing agreements and contract terms and conditions
Case StudiesState of Pennsylvania
Presented recommendations for award of contract
Scheduled and received all shipments of new furniture, fixtures and equipment into the new facility
Ensured all new materials were asset tagged, bar coded, and scanned into the project asset management system
Supervised and managed installations of all FF&E to ensure compliance with the installation specification – on schedule and free of defects
Savings for project FF&E totaled approximately 25% of project budget
Project completed almost eighteen months ahead of schedule resulting in significant cost avoidance in rent payments and associated costs
Case StudiesFacilities Management – Health Care
Consolidated facilities management services to single service provider
Reduced annual direct spend for services by approximately 8%
Reduced annual indirect spend in accounting, personnel, operating and overhead costs by approximately 5%
Maintained or improved quality of services provided
Established better control over process due to improved span of control