Embed Size (px)
Citation preview

AGENDA BOARD OF DIRECTORS REGULAR MEETING WEDNESDAY, JUNE 6, 2012 – 3:30 P.M.
Board Room, 9300 Fanita Parkway, Santee, CA
• CALL TO ORDER
• PLEDGE OF ALLEGIANCE
• OPPORTUNITY FOR PUBLIC COMMENT Opportunity for members of the public to address the Board (Gov. Code 54954.3)
• APPROVAL OF MINUTES There are no minutes to approve at this time.
• ITEMS TO BE ADDED, WITHDRAWN, OR REORDERED ON THE AGENDA
• CONSENT AGENDA Items are considered to be routine and will be acted upon by a single motion without discussion, unless a Board Member, staff, or the public request a specific item be removed from the consent agenda for discussion.
CONSENT ITEMS 1. RESOLUTION RECOGNIZING 30-YEAR EMPLOYEE CHARLIE E. SETTER
Recommendation: Adopt Resolution recognizing Charlie E. Setter, upon completion of 30 years of service with the District.
2. EMPLOYER PAID MEMBER CONTRIBUTIONS (EPMC) TO CALPERS FOR EMPLOYEES Recommendation:
1. Adopt Resolution applicable to all employees as follows: A. For all employees hired before July 1, 2012: Reducing the Employer Paid
Member Contribution to CalPERS to 3 percent effective with the first pay period of the fiscal year 12-13 and 1.5 percent, effective with the first pay period of the fiscal year 13-14 and 0 percent as of the first pay period of the fiscal year 14-15, at which time all employees will be paying the full 8 percent.
B. For new employees hired on or after July 1, 2012, the District will not pay any EPMC and employees will pay the full 8 percent. By fiscal year 14-15, all employees will be paying the full 8 percent.

[June 6, 2012] Page 2 of 4 [Agenda]
3. JOB CLASSIFICATIONS AND STANDARD RATES OF PAY FOR ALL EMPLOYEES
(EXCEPT THE GENERAL MANAGER)-FY 2012-13 Recommendation: Adopt a Resolution approving the amended Job Classifications and Standard Rates of Pay for Fiscal Year 2012-13 in accordance with the Memoranda of Understanding approved by the Board of Directors on April 18, 2012 and Standard Practices, Sections 11.8.2 and 11.8.8, as approved by the Board of Directors on April 18, 2012, effective with the first pay period of the 2012-2013 fiscal year (June 23, 2012).
4. DIESEL PARTICULATE FILTERS FOR FLEET VEHICLES
Recommendation: Approve purchase and installation of Diesel Particulate Filters from lowest bid.
5. RAY STOYER WATER RECYCLING FACILITY ACCESS ROAD AND SITE PAVING
REPAIR (JN 212002) AWARD OF CONSTRUCTION CONTRACT Recommendation: 1. Award the construction contract for the Ray Stoyer Water Recycling Facility
Access Road and Site Paving Repair project to the lowest responsive and responsible bidder, Anthony’s Grading and Paving for a not-to-exceed cost of $49,661.50.
2. Authorize the Director of Engineering and Planning to modify the contract up to 15 percent ($7,449.23) for unforeseen construction changes.
3. Authorize staff to administer construction management/inspection required for the successful completion of the project in the amount not to exceed $6,000.
• ACTION AGENDA Items on the Action Agenda call for discussion and action by the Board. All items are placed on the Agenda so that the Board may discuss and take action on the item if the Board is so inclined.
ACTION ITEMS 6. CONSIDERATION OF EAST COUNTY ECONOMIC DEVELOPMENT COUNCIL
MEMBERSHIP Recommendation: Hear presentation by John Minto, Santee City Councilman and Member of the ECEDC Board of Directors, regarding membership in the East County Economic Development Council and direct staff accordingly. 7. FIVE YEAR BUSINESS PLAN AND BUDGET FOR FISCAL YEARS 2012/2013-
2016/2017; SCHEDULING PUBLIC HEARING FOR WATER AND SEWER RATE ADJUSTMENTS
Recommendation: 1. Hear report from HDR on results of the Cost-of Service and Rate Design
analyses. 2. Adopt Resolution approving the Five Year Business Plan and Budget for fiscal
years 2012/13 through 2016/17. 3. Direct staff to set a public hearing date for August 15, 2012 at 6:00pm and
proceed with Prop 218. notice requirements for proposed rate adjustments. 4. Direct staff with any desired changes.

[June 6, 2012] Page 3 of 4 [Agenda]
• REPORTS The following items are reports and are placed on the Agenda to provide information to the Board and the public. There is no action called for on these items. The Board may engage in discussion upon which a specific subject matter is identified but may not take any action other than to place the matter on a future agenda.
8. BOARD REPORTS Recommendation: Hear report from Directors for the following meetings:
A. President’s Report B. County Water Authority (CWA) Board of Directors Meeting C. Metro Commission/Metro Wastewater JPA/Metro TAC Meeting D. Other meetings/conferences/events attended by Directors per AB1234
(Council of Water Utilities, CSDA San Diego Chapter, etc.)
• DIRECTORS’ COMMENTS Directors’ comments are to be related to District business which may be of interest to the Board. They are placed on the agenda to enable individual Board Members to convey information to the Board and the Public. There is to be no discussion or action taken on comments made by Board Members.
• DISTRICT COUNSEL’S REPORT 9. GENERAL MANAGER’S REPORT
Recommendation: Receive General Manager’s report covering the following: operations, finances, projects, legislation, and other information.
10. INFORMATIONAL REPORTS Recommendation: Review, note, and file the following reports:
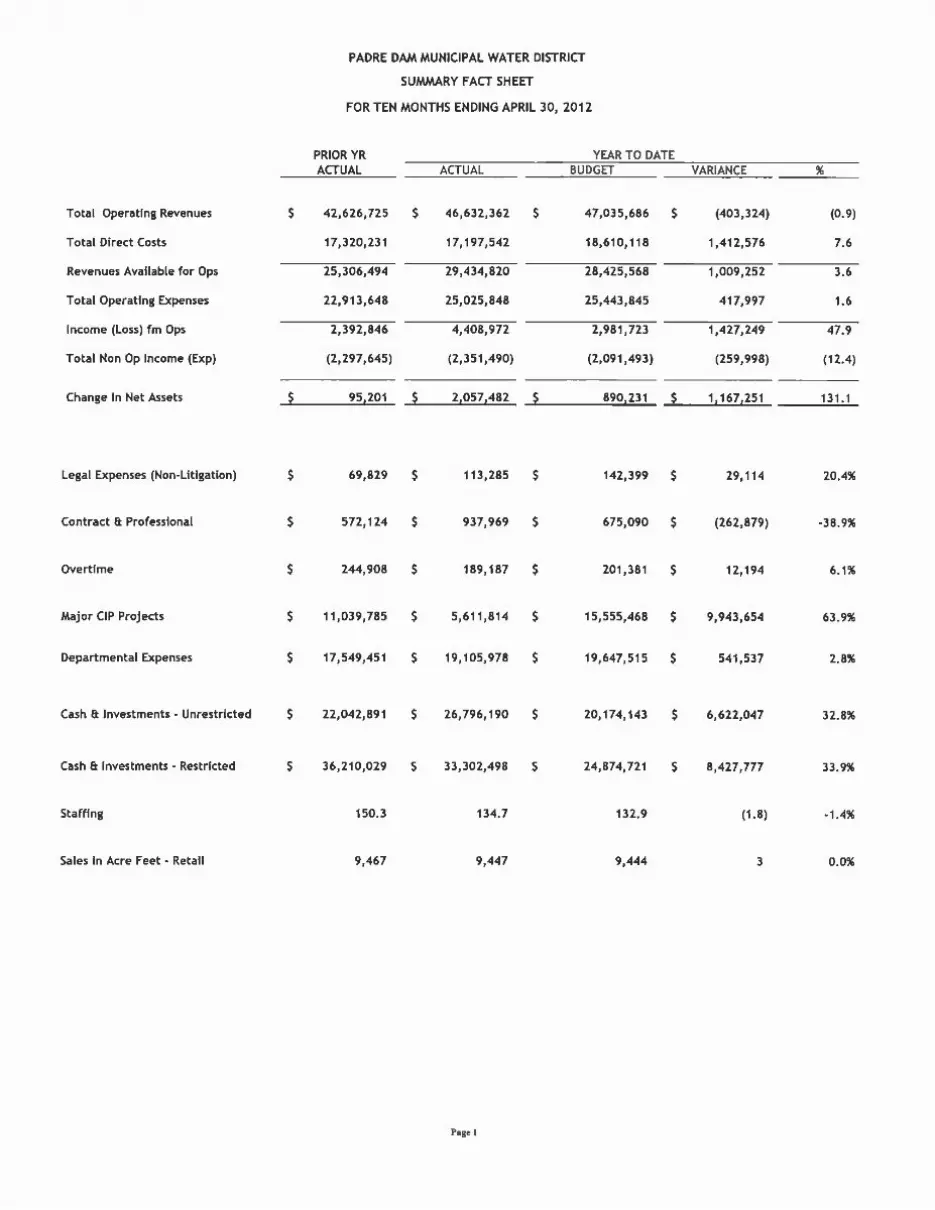
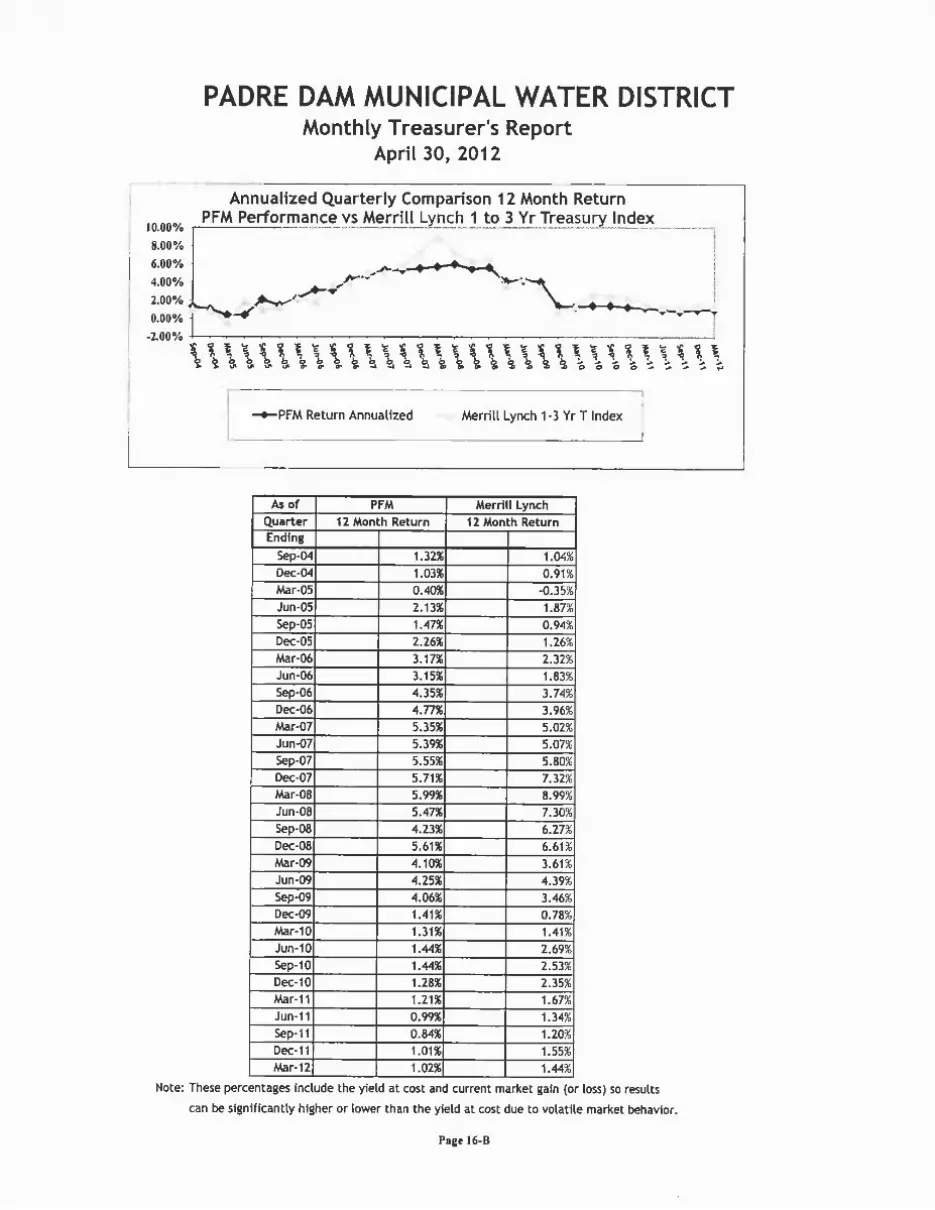
A. Monthly Finance & Treasurer’s Report for the ten months ended April 30, 2012
• CLOSED SESSION At any time during the regular session, the Board may adjourn to closed session to consider litigation, or discuss with Legal Counsel matters within the attorney-client privilege, subject to the appropriate disclosures.
11. CLOSED SESSION
A. Conference with Legal Counsel – Existing Litigation (Gov. Code 54956.9 (a)) 1) Viejas Band of Kumeyaay Indians v. Padre Dam Municipal Water District
San Diego Superior Court Case Number 37-2011-00093203 2) Native American Heritage Commission v. Padre Dam Municipal Water District San Diego Superior Court Case Number 37-2011-00094878
12. ADJOURNMENT

[June 6, 2012] Page 4 of 4 [Agenda]
This agenda was posted at least 72 hours before the meeting in a location freely accessible to the public. No action may be taken on any item not appearing on the posted agenda, except as provided by Gov. Code Section 54954.2. The complete agenda package is available for public review on the District’s website, www.PadreDam.org. Any written materials provided to a majority of the Board of Directors within 72 hours prior to the meeting regarding any item on this agenda will be made available for public inspection at the District’s office located at 9300 Fanita Parkway. For questions or request for information related to this agenda contact Amy Pederson, Board Secretary, at 619.258.4614 or [email protected].
PUBLIC COMMENT PROCEDURES
Members of the public may address the Board regarding items not appearing on the posted agenda, which are within the subject matter jurisdiction of the Board. Speakers are requested to state name, address and topic, and observe a time limit of 3 minutes each. Public comment on a single topic is limited to a total of 15 minutes. Anyone desiring to address the Board regarding an item listed on the agenda should fill out a “request to speak” form and present it to the Board Secretary. These forms are available in the Board Room on the counter near the entrance doors.
NEXT RESOLUTION NO. 2012-29 NEXT ORDINANCE NO. 2012-04
CERTIFICATION OF POSTING
I certify that on June 1, 2012, I posted a copy of the foregoing agenda near the regular meeting place of the Board of Directors of Padre Dam Municipal Water District, said time being at least 72 hours prior to the meeting, in accordance with Gov. Code Section 54954.2(a). ______________________________ Amy Pederson, Board Secretary
Padre Dam Municipal Water District does not discriminate on the basis of disability in admission to, access to, or operations of its programs, services or activities. This notice is available in alternate formats. Questions or requests for additional information or accommodations under the Americans with Disabilities Act (ADA) may be forwarded to our ADA Coordinator: Diana M. Levin at 619.258.4678 or [email protected]

1 6/1/2012 3:22 PMAgenda Calendar
S M T W T F S1 2
3 4 5 6 7 8 910 11 12 13 14 15 1617 18 19 20 21 22 2324 25 26 27 28 29 30
June 2012S M T W T F S1 2 3 4 5 6 78 9 10 11 12 13 14
15 16 17 18 19 20 2122 23 24 25 26 27 2829 30 31
July 2012June 2012
Monday Tuesday Wednesday Thursday Friday Sat/SunJune 1 2
3
4 5 63:30pm Board Mtg
(Boardroom)
77:30am Santee
Chamber Board Mtg
12:00pm Metro Commission/J
8 9
10
11 12 137:30am EIT 2012
Meetings (Boardroom)
14 15 16
17
188:30am Santee
Governance Cmte
197:30am COWU
20Metro TAC (staff mtg)3:30pm Board Mtg
(Boardroom)
21 22 23
24
251:30pm Finance &
Admin Svcs Cmte (Boardroom)
26 271:30pm Park
Committee (Park Club House)
289:00am CWA Board
29 30

2 6/1/2012 3:22 PMAgenda Calendar
S M T W T F S1 2 3 4 5 6 78 9 10 11 12 13 14
15 16 17 18 19 20 2122 23 24 25 26 27 2829 30 31
July 2012S M T W T F S
1 2 3 45 6 7 8 9 10 11
12 13 14 15 16 17 1819 20 21 22 23 24 2526 27 28 29 30 31
August 2012July 2012
Monday Tuesday Wednesday Thursday Friday Sat/Sun
July 1
2 33:30pm Updated:
Board Mtg (Boardroom)
4July 4 Holiday
57:30am Santee
Chamber Board Mtg
12:00pm Metro Commission/J
6 7
8
9 10 117:30am EIT 2012
Meetings (Boardroom)
12 13 14
15
168:30am Santee
Governance Cmte
177:30am COWU
18Metro TAC (staff mtg)3:30pm Board Mtg
(Boardroom)
19 209:30am LAFCO
Special Districts Advisory Cmte
21
22
231:30pm Security
Committee (Boardroom)
24 251:30pm Park
Committee (Park Club House)
269:00am CWA Board
27 28
29
30 31

3 6/1/2012 3:22 PMAgenda Calendar
S M T W T F S1 2 3 4
5 6 7 8 9 10 1112 13 14 15 16 17 1819 20 21 22 23 24 2526 27 28 29 30 31
August 2012S M T W T F S
12 3 4 5 6 7 89 10 11 12 13 14 15
16 17 18 19 20 21 2223 24 25 26 27 28 2930
September 2012August 2012
Monday Tuesday Wednesday Thursday Friday Sat/SunAugust 1
3:30pm Board Mtg (Boardroom)
27:30am Santee
Chamber Board Mtg
12:00pm Metro Commission/J
3 4
5
6 7 87:30am EIT 2012
Meetings (Boardroom)
9 10 11
12
13 14 15Metro TAC (staff mtg)3:30pm Board Mtg
(Boardroom)
166:00pm CSDA
Quarterly Mtg
17 18
19
208:30am Santee
Governance Cmte
217:30am COWU
221:30pm Park
Committee (Park Club House)
239:00am CWA Board
24 25
26
271:30pm Facilities
Dev. & Ops Cmte (Boardroom)
28 29 30 31

4 6/1/2012 3:22 PMAgenda Calendar
S M T W T F S1
2 3 4 5 6 7 89 10 11 12 13 14 15
16 17 18 19 20 21 2223 24 25 26 27 28 2930
September 2012S M T W T F S
1 2 3 4 5 67 8 9 10 11 12 13
14 15 16 17 18 19 2021 22 23 24 25 26 2728 29 30 31
October 2012September 2012
Monday Tuesday Wednesday Thursday Friday Sat/SunSeptember 1
2
3Labor Day
Office Closed
4 53:30pm Board Mtg
(Boardroom)
67:30am Santee
Chamber Board Mtg
12:00pm Metro Commission/J
7 8
9
10 11 127:30am EIT 2012
Meetings (Boardroom)
13 14 15
16
178:30am Santee
Governance Cmte
187:30am COWU
19Metro TAC (staff mtg)3:30pm Board Mtg
(Boardroom)
20 219:30am LAFCO
Special Districts Advisory Cmte
22
23
241:30pm Finance &
Admin Svcs Cmte (Boardroom)
25 261:30pm Park
Committee (Park Club House)
279:00am CWA Board
28 29
30

BOARD AGENDA REPORT
Meeting Date: June 06, 2012
Dept. Head: Debi Baczynski Submitted by: Kathi Monteith Department: Human Resources Approved by: Allen Carlisle, CEO/GM
SUBJECT: ADOPT RESOLUTION RECOGNIZING CHARLIE E. SETTER UPON COMPLETION OF THIRTY YEARS
OF SERVICE WITH PADRE DAM. RECOMMENDATION(S): 1. Adopt a resolution recognizing Charlie E. Setter upon completion of thirty years of service with Padre Dam
ALTERNATIVE(S): 1.
ATTACHMENT(S): 1. Draft Resolution
FUNDING: Requested amount: Budgeted amount: Are funds available? Yes No Project cost to date:
PRIOR BOARD/COMMITTEE CONSIDERATION: NONE
STRATEGIC PLAN IMPLEMENTATION: This agenda item is consistent with the Strategic Plan and meets one or more of the following Strategic Goals: Customer Service & Education; Employee Relations; Facilities Issues, Financial Health; Premier Park; Preventative & Predictive Maintenance; Water Resource Development.
Reviewed by: Dept Head Finance Legal Standard Form
Action Required: Motion Resolution Ordinance None
Policy Updates:
Rules & Regulations
Standard Practices & Policies
Action Taken: As Recommended ___________________ Reso/Ord. No. ______________________ Other _____________________________

#33860 v1 - 06/06/12 RESOLUTION FOR CHARLIE SETTER Page 2 of 3
EXECUTIVE SUMMARY: Charlie E. Setter celebrates his thirtieth year with Padre Dam Municipal Water District on June 19, 2012. Charlie was hired by Padre Dam as a Landscape Maintenance Worker I at Santee Lakes. In August 1982 he earned promotion to the position of Meter Reader. Charlie was reclassified to the position of Meter Repair/Store Worker I in October 1984 and was promoted to the position of Meter Repair/Store Worker II in August 1987. In January 1990 he was reclassified to Warehouse/Meter Worker II, and earned promotion to Utility Crew Supervisor in May 1995. In July 2005 he was reclassified to Construction & Maintenance Supervisor where he continues to serve the District. RECOMMENDATION(S): Adopt a resolution recognizing Charlie E. Setter upon completion of thirty years of service with Padre Dam

#33860 v1 - 06/06/12 RESOLUTION FOR CHARLIE SETTER Page 3 of 3
RESOLUTION 2012-XX RESOLUTION OF THE BOARD OF DIRECTORS OF PADRE DAM MUNICIPAL WATER DISTRICT
RECOGNIZING CHARLIE E. SETTER UPON COMPLETION OF THIRTY YEARS OF DISTRICT SERVICE
WHEREAS, Charlie E. Setter began his career with Padre Dam Municipal Water District on June, 19, 1982 as a Landscape Maintenance Worker at Santee Lakes Regional Park & Campground; and WHEREAS, Mr. Setter was promoted to the position of Meter Reader in August 1982 and promoted again to Meter Repair/Store Worker II in August 1987; and
WHEREAS, in May 1995 Mr. Setter earned another promotion to Utility Crew Supervisor, which was subsequently reclassified to Construction & Maintenance Supervisor, where he continues to serve the District; and
WHEREAS, Mr. Setter has contributed to the success of Padre Dam by exhibiting the Core Values of the District - Trust, Integrity, Competence, Accountability, and Service in performing his daily job responsibilities and through his dedication to the District; and
WHEREAS, Mr. Setter has been instrumental in developing the protocol and procedures for the District-wide Valve Replacement Program. Starting in fiscal year 1999 under Mr. Setter’s direction, western crews have replaced over 1300 valves as of April 2012; and
WHEREAS, in addition to his supervisory duties, Mr. Setter has become the unofficial weatherman for Field Operations, predicting the time of arrival and departure for various storm fronts affecting daily scheduling of projects, often with a high degree of success. NOW, THEREFORE, BE IT HEREBY RESOLVED, DETERMINED AND ORDERED by the Board of Directors of the Padre Dam Municipal Water District as follows:
1. That the Board does hereby recognize Charlie E. Setter upon completion of thirty years of dedicated and competent service to the District and its customers.
2. That the Board does further declare and extend the sincere appreciation and
gratitude of each of its Directors for a job well done. PASSED AND ADOPTED at the Regular Board Meeting of the Board of Directors of Padre Dam Municipal Water District held on June 6, 2012, by the following vote, to wit:
AYES: NOES: ABSENT:
ABSTAIN: ATTEST:
Secretary President

BOARD AGENDA REPORT
Meeting Date: June 6, 2012
Dept. Head: Debi Baczynski, Dir. H.R. Submitted by: Debi Baczynski, Dir. H.R. Department: Human Resources Approved by: Allen Carlisle, GM/CEO
SUBJECT: EMPLOYER PAID MEMBER CONTRIBUTIONS (EPMC) TO CALPERS FOR EMPLOYEES
RECOMMENDATION(S): 1. Adopt Resolution applicable to all employees as follows: A. For all employees hired before July 1, 2012: Reducing the Employer Paid Member Contribution to CalPERS to 3 percent effective with the first pay period of the fiscal year 12-13 and 1.5 percent, effective with the first pay period of the fiscal year 13-14 and 0 percent as of the first pay period of the fiscal year 14-15, at which time all employees will be paying the full 8 percent. B. For new employees hired on or after July 1, 2012, the District will not pay any EPMC and employees will pay the full 8 percent. By fiscal year 14-15, all employees will be paying the full 8 percent.
ALTERNATIVE(S):
ATTACHMENT(S): 1. Resolution No. 2012-XX, RESOLUTION OF THE BOARD OF DIRECTORS OF PADRE DAM MUNICIPAL WATER DISTRICT FOR EMPLOYER PAID MEMBER CONTRIBUTIONS TO CalPERS REGARDING MISCELLANEOUS EMPLOYEES
FUNDING: Requested amount: n/a Are funds budgeted? Yes No Are funds available? Yes No
PRIOR BOARD/COMMITTEE CONSIDERATION: April 18, 2012
STRATEGIC PLAN IMPLEMENTATION: This agenda item is consistent with the Strategic Plan and meets one or more of the following Strategic Goals: Customer Service & Education; Employee Relations; Facilities Issues, Financial Health; Premier Park; Preventative & Predictive Maintenance; Water Resource Development.
Reviewed by: Dept Head Finance Legal Counsel Standard Form
Action Required: Motion Resolution Ordinance None
Policy Updates:
Rules & Regulations
Standard Practices & Policies
Action Taken:
As Recommended ___________________
Reso/Ord. No. ______________________
Other _____________________________
Page 2 of 4
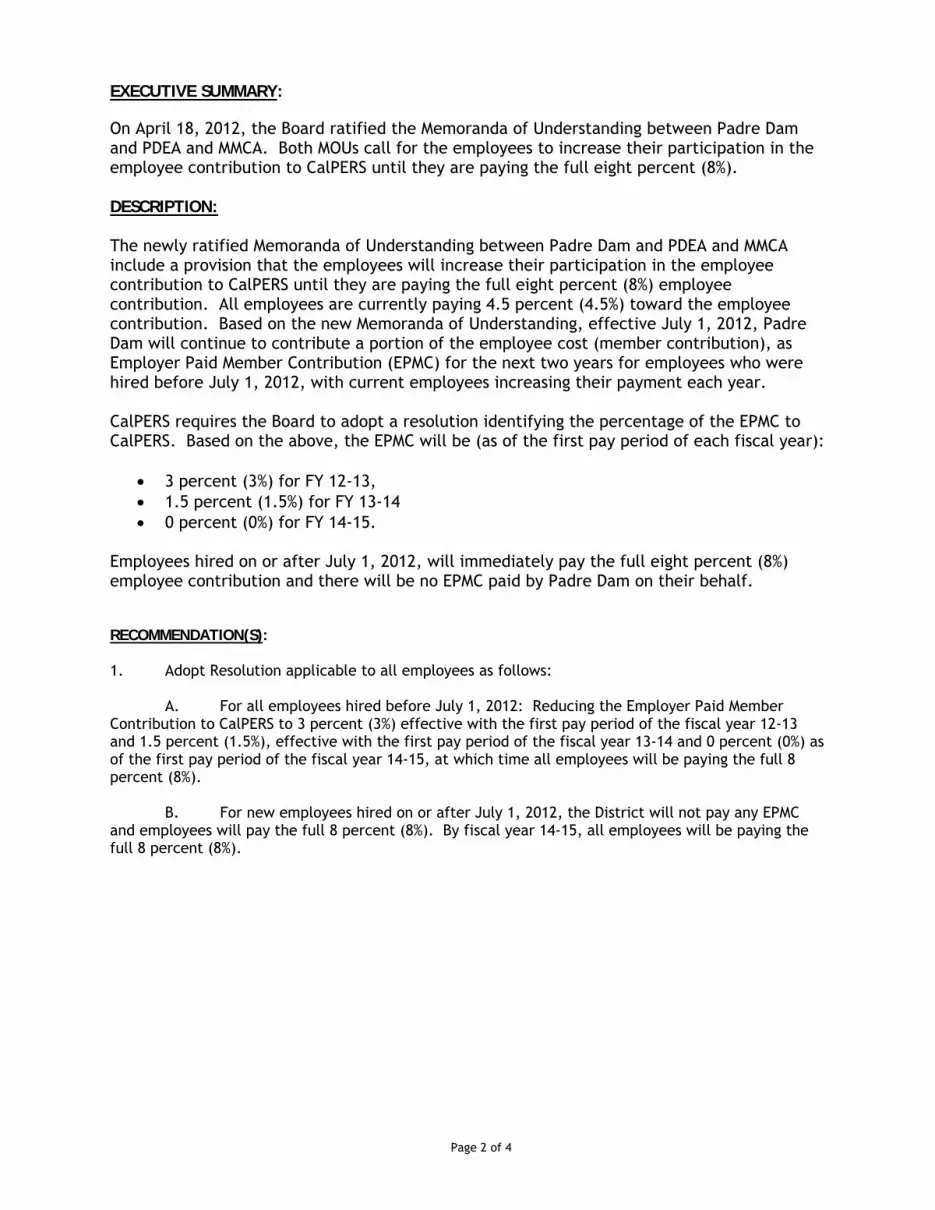
EXECUTIVE SUMMARY: On April 18, 2012, the Board ratified the Memoranda of Understanding between Padre Dam and PDEA and MMCA. Both MOUs call for the employees to increase their participation in the employee contribution to CalPERS until they are paying the full eight percent (8%). DESCRIPTION: The newly ratified Memoranda of Understanding between Padre Dam and PDEA and MMCA include a provision that the employees will increase their participation in the employee contribution to CalPERS until they are paying the full eight percent (8%) employee contribution. All employees are currently paying 4.5 percent (4.5%) toward the employee contribution. Based on the new Memoranda of Understanding, effective July 1, 2012, Padre Dam will continue to contribute a portion of the employee cost (member contribution), as Employer Paid Member Contribution (EPMC) for the next two years for employees who were hired before July 1, 2012, with current employees increasing their payment each year. CalPERS requires the Board to adopt a resolution identifying the percentage of the EPMC to CalPERS. Based on the above, the EPMC will be (as of the first pay period of each fiscal year):
• 3 percent (3%) for FY 12-13, • 1.5 percent (1.5%) for FY 13-14 • 0 percent (0%) for FY 14-15.
Employees hired on or after July 1, 2012, will immediately pay the full eight percent (8%) employee contribution and there will be no EPMC paid by Padre Dam on their behalf. RECOMMENDATION(S): 1. Adopt Resolution applicable to all employees as follows: A. For all employees hired before July 1, 2012: Reducing the Employer Paid Member Contribution to CalPERS to 3 percent (3%) effective with the first pay period of the fiscal year 12-13 and 1.5 percent (1.5%), effective with the first pay period of the fiscal year 13-14 and 0 percent (0%) as of the first pay period of the fiscal year 14-15, at which time all employees will be paying the full 8 percent (8%). B. For new employees hired on or after July 1, 2012, the District will not pay any EPMC and employees will pay the full 8 percent (8%). By fiscal year 14-15, all employees will be paying the full 8 percent (8%).

Page 3 of 4
ATTACHMENT 1 RESOLUTION 2012-XX
RESOLUTION OF THE BOARD OF DIRECTORS OF PADRE DAM MUNICIPAL WATER DISTRICT
FOR EMPLOYER PAID MEMBER CONTRIBUTIONS TO CALPERS REGARDING ALL MISCELLANEOUS EMPLOYEES
WHEREAS, the governing body of the Padre Dam Municipal Water District (“District”) has the authority to implement Government Code Section 20691; and
WHEREAS, the governing body of the Padre Dam Municipal Water District has a written labor policy which specifically provides for the normal member contributions to be paid in part by the employer and has in accordance with that policy paid Employer Paid Member Contributions (EPMC);
WHEREAS, the governing body of the Padre Dam Municipal Water District now desires to modify its election to pay EPMC;
WHEREAS, one of the steps in the procedures to implement Section 20691 is the adoption by the governing body of the Padre Dam Municipal Water District of a Resolution to modify said EPMC;
WHEREAS, the Padre Dam Municipal Water District has revised its written labor policy to provide for payment of EPMC; and
WHEREAS, the governing body of the District has identified the following conditions for the purpose of its election to pay:
• The District will continue to pay three and one-half percent (3.5%) of the
normal member contributions as EPMC for all employees until June 23, 2012.
• For all District employees who are members of PERS as part of the Local
Miscellaneous Member Category, hired before July 1, 2012:
o Effective the first pay period of fiscal year 2012-13, the District will pay three percent (3%) of the eight percent (8%) normal member contributions as EPMC and employees will pay the additional normal member contributions.
o Effective the first pay period of fiscal year 2013-14, the District will
pay one and one-half percent (1.5%) of the eight percent (8%) normal member contributions as EPMC and employees will pay the additional normal member contributions.
o Effective the first pay period of fiscal year 2014-15, the District will
no longer pay normal member contributions as EPMC for employees, and all employees will pay all normal member contributions.

Page 4 of 4
• For all District employees hired on or after July 1, 2012, the District will not pay any portion of the normal member contributions.
NOW, THEREFORE, BE IT HEREBY RESOLVED, DETERMINED AND ORDERED by the Board of Directors of Padre Dam Municipal Water District as follows:
1. That Padre Dam Municipal Water District elects to pay EPMC as set forth above.
2. That this Resolution shall take effect immediately upon its adoption.
PASSED AND ADOPTED at the Regular Board Meeting of the Board of Directors of Padre Dam Municipal Water District held on _________, 2012, by the following vote, to wit:
AYES: NOES: ABSENT: ABSTAIN:
ATTEST:
Board Secretary Board President

BOARD AGENDA REPORT
Meeting Date: June 6, 2012 Dept. Head: Debi Baczynski
Submitted by: Debi Baczynski
Department: Human Resources Approved by: Allen Carlisle, CEO/GM
SUBJECT: JOB CLASSIFICATIONS AND STANDARD RATES OF PAY FOR ALL EMPLOYEES (EXCEPT THE
GENERAL MANAGER)-FY 2012-13
RECOMMENDATION(S):
1. Adopt a Resolution approving the amended Job Classifications and Standard Rates of Pay for Fiscal Year 2012-13 in accordance with the Memoranda of Understanding approved by the Board of Directors on April 18, 2012 and Standard Practices, Sections 11.8.2 and 11.8.8, as approved by the Board of Directors on April 18, 2012, effective with the first pay period of the 2012-2013 fiscal year (June 23, 2012).
ALTERNATIVE(S): ATTACHMENT(S):
1. Job Classifications and Standard Rates of Pay for Fiscal Year 2012-13 reflecting a 3.3% increase in the rates of pay for all employees (other than the General Manager).
2. Resolution adopting job classifications and standard rates of pay for fiscal year 2012/2013.
FUNDING:
Requested amount:
Budgeted amount:
Are funds available? Yes No
Project cost to date:
PRIOR BOARD/COMMITTEE CONSIDERATION: April 18, 2012
STRATEGIC PLAN IMPLEMENTATION: This agenda item is consistent with the Strategic Plan and meets one or more of the following Strategic Goals: Customer Service & Education; Employee Relations; Facilities Issues, Financial Health; Premier Park; Preventative & Predictive Maintenance; Water Resource Development.
Reviewed by: Dept Head Finance Legal Counsel Standard Form
Action Required: Motion Resolution Ordinance None
Policy Updates:
Rules & Regulations
Standard Practices & Policies
Action Taken: As Recommended ___________________
Reso/Ord. No. ______________________
Other _____________________________

Salary Reso.docSalary Reso.doc Page 2 of 2
EXECUTIVE SUMMARY:
In April of 2012, this Board approved the Memoranda of Understanding with Padre Dam Employees Association (PDEA) and the Mid-Management & Confidential Association (MMCA). These contracts call for an annual wage adjustment based on the one-year San Diego CPI-W that comes out in February, with a minimum of 0% and a maximum of 3.5%. The CPI-W for this period was 3.3%. As Amended and approved by the Board of Directors on April 18, 2012, Standard Practices Section 11.8.2 provides the unrepresented employees (other than the General Manager) with the same salary adjustment as the negotiated cost-of-living increase for represented employees. DESCRIPTION:
In April of 2012, this Board approved the Memoranda of Understanding with Padre Dam Employees Association (PDEA) and the Mid-Management & Confidential Association (MMCA). These contracts call for an annual wage adjustment based on the one-year San Diego CPI-W that comes out in February, with a minimum of 0% and a maximum of 3.5%. The one-year San Diego CPI-W is 3.3%. As Amended and approved by the Board of Directors on April 18, 2012, Standard Practices Section 11.8.2 provides the unrepresented employees (other than the General Manager) with the same salary adjustment as the negotiated cost-of-living increase for represented employees. Past practice has been to provide the unrepresented employees with the same salary adjustment as provided for the represented employees. The unrepresented employees will be required to make the same increased contributions to CalPERS and to healthcare, as negotiated with the represented employees. In accordance with the terms of the Memoranda of Understanding and Standard Practices Section 11.8.2 and in accordance with legal requirements for the Board to publicly approve the pay rate for all positions, staff is requesting the Board to approve the new salary ranges for all positions, with the exception of the General Manager, for FY 2012-13. The 3.3% adjustment is reflected in Attachment 1. In addition, several changes have been made to the Job Classifications. Those changes are: 1. Elimination of Accounting Specialist/Technical Support, Director of Communication and Engineering Customer Service Representative; 2. Lower salary ranges for Cathodic Protection Program Coordinator, Human Resources Specialist, Safety & Risk Manager and Warehouse Specialist; 3. Inclusion of new positions of Communications Officer, Meter Services Administrator and Recycled Water Operator/Instrumentation Technician. All of these changes were in response to our needs based on the Deficit Elimination Plan and reorganization. The savings associated with these changes have been reflected in the forecasted budget numbers for FY 2011-12. RECOMMENDATION(S): 1. Adopt a Resolution approving the amended the Job Classifications and Standard Rates of Pay
for Fiscal Year 2012-13 in accordance with the Memoranda of Understanding approved by the Board of Directors on April 18, 2012 and Standard Practices, Section 11.8.2 effective with the first pay period of the 2012-2013 fiscal year (June 23, 2012).

STEP-GRADE Min. Mid. Max. STEP-GRADE Min. Mid. Max.
5 10.91$ 13.67$ 16.43$ 27 30.51$ 38.23$ 45.94$
6 11.78$ 14.76$ 17.74$ 28 30.84$ 38.64$ 46.44$
7 12.65$ 15.85$ 19.06$ 29 32.01$ 40.11$ 48.21$
8 13.53$ 16.95$ 20.37$ 30 33.13$ 41.51$ 49.89$
9 14.40$ 18.04$ 21.69$ 31 33.60$ 42.10$ 50.60$
10 15.15$ 18.98$ 22.81$ 32 34.47$ 43.19$ 51.91$
11 16.15$ 20.23$ 24.31$ 33 35.58$ 44.58$ 53.58$
12 17.16$ 21.51$ 25.85$ 34 36.22$ 45.38$ 54.54$
13 17.89$ 22.42$ 26.94$ 35 37.26$ 46.69$ 56.12$
14 18.85$ 23.62$ 28.39$ 36 38.22$ 47.90$ 57.57$
15 19.93$ 24.97$ 30.01$ 37 38.97$ 48.83$ 58.69$
16 20.59$ 25.80$ 31.01$ 38 39.71$ 49.75$ 59.80$
17 21.64$ 27.12$ 32.59$ 39 40.58$ 50.85$ 61.11$
18 22.61$ 28.32$ 34.04$ 40 41.14$ 51.54$ 61.95$
19 23.14$ 28.99$ 34.85$ 41 42.33$ 53.03$ 63.74$
20 24.40$ 30.58$ 36.75$ 42 43.20$ 54.13$ 65.06$
21 24.93$ 31.24$ 37.55$ 43 44.07$ 55.22$ 66.37$
22 25.42$ 31.85$ 38.28$ 44 44.94$ 56.31$ 67.68$
23 26.80$ 33.59$ 40.37$ 45 46.21$ 57.90$ 69.60$
24 27.42$ 34.36$ 41.30$ 46 46.30$ 58.01$ 69.73$
25 28.64$ 35.88$ 43.13$ 47 47.56$ 59.59$ 71.63$
26 29.25$ 36.65$ 44.05$ 48 48.12$ 60.29$ 72.46$
* This schedule is for Year 1 only. In accordance with the MOU each year will be based on the February San Diego CPI-W.
PADRE DAM MUNICIPAL WATER DISTRICT
Job Classifications and Salary Grades
Fiscal Year Budget 2012-2013
HOURLY WAGES BY GRADE*

PADRE DAM MUNICIPAL WATER DISTRICT
Fiscal Year Budget 2012-2013
Job Classification Schedule for All Employees
CLASSIFICATION
Min. Mid. Max. Min. Mid. Max. Min. Mid. Max.
Accountant 23 $26.80 - $33.59 - $40.37 $4,646 - $5,822 - $6,997 $55,752 - $69,858 - $83,965
Accountant, Senior 29 $32.01 - $40.11 - $48.21 $5,549 - $6,953 - $8,356 $66,589 - $83,433 - $100,277
Accounting Manager 38 $39.71 - $49.75 - $59.80 $6,883 - $8,624 - $10,365 $82,593 - $103,487 - $124,380
Accounting Specialist 13 $17.89 - $22.42 - $26.94 $3,101 - $3,886 - $4,670 $37,212 - $46,626 - $56,041
Accounting Specialist 15 $19.93 - $24.97 - $30.01 $3,455 - $4,329 - $5,203 $41,457 - $51,944 - $62,431
Accounting Specialist 17 $21.64 - $27.12 - $32.59 $3,751 - $4,700 - $5,649 $45,014 - $56,403 - $67,792
Administrative Assistant 11 $16.15 - $20.23 - $24.31 $2,798 - $3,506 - $4,214 $33,582 - $42,077 - $50,573
Administrative Assistant 13 $17.89 - $22.42 - $26.94 $3,101 - $3,886 - $4,670 $37,212 - $46,626 - $56,041
Administrative Assistant 15 $19.93 - $24.97 - $30.01 $3,455 - $4,329 - $5,203 $41,457 - $51,944 - $62,431
Administrative Assistant 18 $22.61 - $28.32 - $34.04 $3,918 - $4,910 - $5,901 $47,021 - $58,916 - $70,811
Assistant Operations Manager 35 $37.26 - $46.69 - $56.12 $6,459 - $8,093 - $9,727 $77,506 - $97,115 - $116,723
Board Secretary 27 $30.51 - $38.23 - $45.94 $5,288 - $6,626 - $7,964 $63,459 - $79,512 - $95,565
Cathodic Protection Program Coordinator 25 $28.64 - $35.88 - $43.13 $4,964 - $6,219 - $7,475 $59,563 - $74,632 - $89,701
Cathodic Protection Program Coordinator 27 $30.51 - $38.23 - $45.94 $5,288 - $6,626 - $7,964 $63,459 - $79,512 - $95,565
Cathodic Protection Program Coordinator 30 $33.13 - $41.51 - $49.89 $5,742 - $7,195 - $8,647 $68,905 - $86,335 - $103,766
Communications Coordinator 25 $28.64 - $35.88 - $43.13 $4,964 - $6,219 - $7,475 $59,563 - $74,632 - $89,701
Communications Manager 35 $37.26 - $46.69 - $56.12 $6,459 - $8,093 - $9,727 $77,506 - $97,115 - $116,723
Communications Officer 30 $33.13 - $41.51 - $49.89 $5,742 - $7,195 - $8,647 $68,905 - $86,335 - $103,766
Construction & Maintenance Supervisor 27 $30.51 - $38.23 - $45.94 $5,288 - $6,626 - $7,964 $63,459 - $79,512 - $95,565
Construction Equipment Operator 18 $22.61 - $28.32 - $34.04 $3,918 - $4,910 - $5,901 $47,021 - $58,916 - $70,811
Construction Equipment Operator 20 $24.40 - $30.58 - $36.75 $4,230 - $5,300 - $6,370 $50,757 - $63,598 - $76,438
Construction Inspector 18 $22.61 - $28.32 - $34.04 $3,918 - $4,910 - $5,901 $47,021 - $58,916 - $70,811
Construction Inspector 20 $24.40 - $30.58 - $36.75 $4,230 - $5,300 - $6,370 $50,757 - $63,598 - $76,438
Construction Inspector 23 $26.80 - $33.59 - $40.37 $4,646 - $5,822 - $6,997 $55,752 - $69,858 - $83,965
Construction Inspector 25 $28.64 - $35.88 - $43.13 $4,964 - $6,219 - $7,475 $59,563 - $74,632 - $89,701
Custodian 10 $15.15 - $18.98 - $22.81 $2,626 - $3,290 - $3,955 $31,508 - $39,481 - $47,455
Customer Service Manager 28 $30.84 - $38.64 - $46.44 $5,346 - $6,698 - $8,050 $64,150 - $80,376 - $96,603
Customer Service Representative 11 $16.15 - $20.23 - $24.31 $2,798 - $3,506 - $4,214 $33,582 - $42,077 - $50,573
Customer Service Representative 13 $17.89 - $22.42 - $26.94 $3,101 - $3,886 - $4,670 $37,212 - $46,626 - $56,041
Customer Service Representative 15 $19.93 - $24.97 - $30.01 $3,455 - $4,329 - $5,203 $41,457 - $51,944 - $62,431
Director of Engineering & Planning Uncl. $57.87 - $71.69 - $85.51 $10,031 - $12,427 - $14,823 $120,368 - $149,119 - $177,871
Director of Finance/Chief Financial Officer Uncl. $57.87 - $71.69 - $85.51 $10,031 - $12,427 - $14,823 $120,368 - $149,119 - $177,871
Director of Human Resources Uncl. $44.68 - $55.35 - $66.03 $7,744 - $9,594 - $11,444 $92,930 - $115,131 - $137,332
MONTHLY PAY RANGE ANNUAL PAY RANGESalary
GradeHOURLY PAY RANGE*
Page 1 of 4

PADRE DAM MUNICIPAL WATER DISTRICT
Fiscal Year Budget 2012-2013
Job Classification Schedule for All Employees
CLASSIFICATION
Min. Mid. Max. Min. Mid. Max. Min. Mid. Max.
MONTHLY PAY RANGE ANNUAL PAY RANGESalary
GradeHOURLY PAY RANGE*
Director of Operations & Water Quality Uncl. $52.04 - $65.04 - $78.04 $9,020 - $11,273 - $13,527 $108,239 - $135,280 - $162,321
Director of Park & Recreation Uncl. $45.99 - $57.63 - $69.26 $7,972 - $9,988 - $12,005 $95,659 - $119,861 - $144,062
Distribution Maintenance Supervisor 27 $30.51 - $38.23 - $45.94 $5,288 - $6,626 - $7,964 $63,459 - $79,512 - $95,565
Distribution Supervisor 30 $33.13 - $41.51 - $49.89 $5,742 - $7,195 - $8,647 $68,905 - $86,335 - $103,766
Electrician/Instrumentation & Control Supervisor 30 $33.13 - $41.51 - $49.89 $5,742 - $7,195 - $8,647 $68,905 - $86,335 - $103,766
Electrician/Instrumentation & Control Technician 18 $22.61 - $28.32 - $34.04 $3,918 - $4,910 - $5,901 $47,021 - $58,916 - $70,811
Electrician/Instrumentation & Control Technician 22 $25.42 - $31.85 - $38.28 $4,406 - $5,521 - $6,635 $52,871 - $66,247 - $79,622
Electrician/Instrumentation & Control Technician 26 $29.25 - $36.65 - $44.05 $5,071 - $6,353 - $7,636 $60,847 - $76,240 - $91,633
Engineer 29 $32.01 - $40.11 - $48.21 $5,549 - $6,953 - $8,356 $66,589 - $83,433 - $100,277
Engineer 33 $35.58 - $44.58 - $53.58 $6,167 - $7,727 - $9,287 $74,000 - $92,720 - $111,439
Engineer 36 $38.22 - $47.90 - $57.57 $6,626 - $8,302 - $9,978 $79,508 - $99,623 - $119,739
Engineer 41 $42.33 - $53.03 - $63.74 $7,336 - $9,192 - $11,048 $88,036 - $110,308 - $132,580
Engineering Manager 44 $44.94 - $56.31 - $67.68 $7,790 - $9,761 - $11,732 $93,482 - $117,132 - $140,781
Engineering Manager 48 $48.12 - $60.29 - $72.46 $8,341 - $10,450 - $12,560 $100,086 - $125,406 - $150,725
Engineering Staff Assistant 18 $22.61 - $28.32 - $34.04 $3,918 - $4,910 - $5,901 $47,021 - $58,916 - $70,811
Engineering Technician 18 $22.61 - $28.32 - $34.04 $3,918 - $4,910 - $5,901 $47,021 - $58,916 - $70,811
Engineering Technician 20 $24.40 - $30.58 - $36.75 $4,230 - $5,300 - $6,370 $50,757 - $63,598 - $76,438
Engineering Technician 23 $26.80 - $33.59 - $40.37 $4,646 - $5,822 - $6,997 $55,752 - $69,858 - $83,965
Engineering Technician 25 $28.64 - $35.88 - $43.13 $4,964 - $6,219 - $7,475 $59,563 - $74,632 - $89,701
Equipment Mechanic 20 $24.40 - $30.58 - $36.75 $4,230 - $5,300 - $6,370 $50,757 - $63,598 - $76,438
Equipment Mechanic 25 $28.64 - $35.88 - $43.13 $4,964 - $6,219 - $7,475 $59,563 - $74,632 - $89,701
Facilities Maintenance Crew Supervisor 25 $28.64 - $35.88 - $43.13 $4,964 - $6,219 - $7,475 $59,563 - $74,632 - $89,701
Facilities Maintenance Worker 12 $17.16 - $21.51 - $25.85 $2,975 - $3,728 - $4,480 $35,701 - $44,732 - $53,763
Facilities Maintenance Worker 14 $18.85 - $23.62 - $28.39 $3,267 - $4,094 - $4,921 $39,209 - $49,131 - $59,053
Facilities Maintenance Worker 17 $21.64 - $27.12 - $32.59 $3,751 - $4,700 - $5,649 $45,014 - $56,403 - $67,792
Field Engineering Supervisor 29 $32.01 - $40.11 - $48.21 $5,549 - $6,953 - $8,356 $66,589 - $83,433 - $100,277
GIS/Mapping Administrator 33 $35.58 - $44.58 - $53.58 $6,167 - $7,727 - $9,287 $74,000 - $92,720 - $111,439
GIS/Mapping Specialist 20 $24.40 - $30.58 - $36.75 $4,230 - $5,300 - $6,370 $50,757 - $63,598 - $76,438
GIS/Mapping Specialist 22 $25.42 - $31.85 - $38.28 $4,406 - $5,521 - $6,635 $52,871 - $66,247 - $79,622
GIS/Mapping Specialist 24 $27.42 - $34.36 - $41.30 $4,753 - $5,956 - $7,158 $57,038 - $71,467 - $85,896
Human Resources Specialist 20 $24.40 - $30.58 - $36.75 $4,230 - $5,300 - $6,370 $50,757 - $63,598 - $76,438
Human Resources Specialist 25 $28.64 - $35.88 - $43.13 $4,964 - $6,219 - $7,475 $59,563 - $74,632 - $89,701
Page 2 of 4

PADRE DAM MUNICIPAL WATER DISTRICT
Fiscal Year Budget 2012-2013
Job Classification Schedule for All Employees
CLASSIFICATION
Min. Mid. Max. Min. Mid. Max. Min. Mid. Max.
MONTHLY PAY RANGE ANNUAL PAY RANGESalary
GradeHOURLY PAY RANGE*
Industrial Code Compliance Specialist 20 $24.40 - $30.58 - $36.75 $4,230 - $5,300 - $6,370 $50,757 - $63,598 - $76,438
Industrial Code Compliance Specialist 23 $26.80 - $33.59 - $40.37 $4,646 - $5,822 - $6,997 $55,752 - $69,858 - $83,965
Information Systems Manager 46 $46.30 - $58.01 - $69.73 $8,025 - $10,055 - $12,086 $96,301 - $120,665 - $145,029
Information Systems Technicial Specialist 20 $24.40 - $30.58 - $36.75 $4,230 - $5,300 - $6,370 $50,757 - $63,598 - $76,438
Information Systems Technicial Specialist 24 $27.42 - $34.36 - $41.30 $4,753 - $5,956 - $7,158 $57,038 - $71,467 - $85,896
Information Systems Technicial Specialist 30 $33.13 - $41.51 - $49.89 $5,742 - $7,195 - $8,647 $68,905 - $86,335 - $103,766
Laboratory Analyst 14 $18.85 - $23.62 - $28.39 $3,267 - $4,094 - $4,921 $39,209 - $49,131 - $59,053
Laboratory Analyst 20 $24.40 - $30.58 - $36.75 $4,230 - $5,300 - $6,370 $50,757 - $63,598 - $76,438
Laboratory Analyst 22 $25.42 - $31.85 - $38.28 $4,406 - $5,521 - $6,635 $52,871 - $66,247 - $79,622
Laboratory Analyst, Senior 31 $33.60 - $42.10 - $50.60 $5,824 - $7,297 - $8,770 $69,884 - $87,562 - $105,240
Meter Services Administrator 29 $32.01 - $40.11 - $48.21 $5,549 - $6,953 - $8,356 $66,589 - $83,433 - $100,277
Meter Shop Supervisor 24 $27.42 - $34.36 - $41.30 $4,753 - $5,956 - $7,158 $57,038 - $71,467 - $85,896
Meter Technician 14 $18.85 - $23.62 - $28.39 $3,267 - $4,094 - $4,921 $39,209 - $49,131 - $59,053
Meter Technician 16 $20.59 - $25.80 - $31.01 $3,569 - $4,472 - $5,375 $42,831 - $53,668 - $64,504
Meter Technician 18 $22.61 - $28.32 - $34.04 $3,918 - $4,910 - $5,901 $47,021 - $58,916 - $70,811
Operations Manager 40 $41.14 - $51.54 - $61.95 $7,130 - $8,934 - $10,738 $85,562 - $107,208 - $128,854
Park & Recreation Coordinator 10 $15.15 - $18.98 - $22.81 $2,626 - $3,290 - $3,955 $31,508 - $39,481 - $47,455
Park & Recreation Coordinator 12 $17.16 - $21.51 - $25.85 $2,975 - $3,728 - $4,480 $35,701 - $44,732 - $53,763
Park & Recreation Coordinator 14 $18.85 - $23.62 - $28.39 $3,267 - $4,094 - $4,921 $39,209 - $49,131 - $59,053
Park & Recreation Manager 36 $38.22 - $47.90 - $57.57 $6,626 - $8,302 - $9,978 $79,508 - $99,623 - $119,739
Park & Recreation Supervisor 19 $23.14 - $28.99 - $34.85 $4,011 - $5,026 - $6,040 $48,135 - $60,310 - $72,484
Park & Recreation Aide 5 $10.91 - $13.67 - $16.43 $1,891 - $2,369 - $2,848 $22,692 - $28,432 - $34,172
Plant Manager 35 $37.26 - $46.69 - $56.12 $6,459 - $8,093 - $9,727 $77,506 - $97,115 - $116,723
Recycled Water Operations Supervisor 27 $30.51 - $38.23 - $45.94 $5,288 - $6,626 - $7,964 $63,459 - $79,512 - $95,565
Recycled Water Operator 14 $18.85 - $23.62 - $28.39 $3,267 - $4,094 - $4,921 $39,209 - $49,131 - $59,053
Recycled Water Operator 17 $21.64 - $27.12 - $32.59 $3,751 - $4,700 - $5,649 $45,014 - $56,403 - $67,792
Recycled Water Operator 20 $24.40 - $30.58 - $36.75 $4,230 - $5,300 - $6,370 $50,757 - $63,598 - $76,438
Recycled Water Operator 23 $26.80 - $33.59 - $40.37 $4,646 - $5,822 - $6,997 $55,752 - $69,858 - $83,965
Recycled Water Operator/Instrumentation Technician 25 $28.64 - $35.88 - $43.13 $4,964 - $6,219 - $7,475 $59,563 - $74,632 - $89,701
Recycled Water Technician 20 $24.40 - $30.58 - $36.75 $4,230 - $5,300 - $6,370 $50,757 - $63,598 - $76,438
Right of Way Agent 25 $28.64 - $35.88 - $43.13 $4,964 - $6,219 - $7,475 $59,563 - $74,632 - $89,701
Right of Way Agent 27 $30.51 - $38.23 - $45.94 $5,288 - $6,626 - $7,964 $63,459 - $79,512 - $95,565
Right of Way Agent 30 $33.13 - $41.51 - $49.89 $5,742 - $7,195 - $8,647 $68,905 - $86,335 - $103,766
Page 3 of 4

PADRE DAM MUNICIPAL WATER DISTRICT
Fiscal Year Budget 2012-2013
Job Classification Schedule for All Employees
CLASSIFICATION
Min. Mid. Max. Min. Mid. Max. Min. Mid. Max.
MONTHLY PAY RANGE ANNUAL PAY RANGESalary
GradeHOURLY PAY RANGE*
Safety & Risk Manager 31 $33.60 - $42.10 - $50.60 $5,824 - $7,297 - $8,770 $69,884 - $87,562 - $105,240
Safety & Risk Manager 40 $41.14 - $51.54 - $61.95 $7,130 - $8,934 - $10,738 $85,562 - $107,208 - $128,854
SCADA Technician 28 $30.84 - $38.64 - $46.44 $5,346 - $6,698 - $8,050 $64,150 - $80,376 - $96,603
SCADA Technician 30 $33.13 - $41.51 - $49.89 $5,742 - $7,195 - $8,647 $68,905 - $86,335 - $103,766
Staff Support (Minimum Wage) N/A $8.00 - * - * $1,387 - * - * $16,640 - * - *
Systems Operator/Technician 18 $22.61 - $28.32 - $34.04 $3,918 - $4,910 - $5,901 $47,021 - $58,916 - $70,811
Systems Operator/Technician 19 $23.14 - $28.99 - $34.85 $4,011 - $5,026 - $6,040 $48,135 - $60,310 - $72,484
Systems Operator/Technician 21 $24.93 - $31.24 - $37.55 $4,322 - $5,415 - $6,508 $51,860 - $64,980 - $78,101
Systems Operator/Technician 23 $26.80 - $33.59 - $40.37 $4,646 - $5,822 - $6,997 $55,752 - $69,858 - $83,965
Utility Worker 14 $18.85 - $23.62 - $28.39 $3,267 - $4,094 - $4,921 $39,209 - $49,131 - $59,053
Utility Worker 17 $21.64 - $27.12 - $32.59 $3,751 - $4,700 - $5,649 $45,014 - $56,403 - $67,792
Warehouse Specialist 18 $22.61 - $28.32 - $34.04 $3,918 - $4,910 - $5,901 $47,021 - $58,916 - $70,811
Warehouse Specialist 20 $24.40 - $30.58 - $36.75 $4,230 - $5,300 - $6,370 $50,757 - $63,598 - $76,438
Warehouse Worker 16 $20.59 - $25.80 - $31.01 $3,569 - $4,472 - $5,375 $42,831 - $53,668 - $64,504
Wastewater Collection Systems Worker 14 $18.85 - $23.62 - $28.39 $3,267 - $4,094 - $4,921 $39,209 - $49,131 - $59,053
Wastewater Collection Systems Worker 17 $21.64 - $27.12 - $32.59 $3,751 - $4,700 - $5,649 $45,014 - $56,403 - $67,792
Wastewater Collection Systems Worker 18 $22.61 - $28.32 - $34.04 $3,918 - $4,910 - $5,901 $47,021 - $58,916 - $70,811
Wastewater Collection Systems Worker 20 $24.40 - $30.58 - $36.75 $4,230 - $5,300 - $6,370 $50,757 - $63,598 - $76,438
Water Quality Compliance Specialist 23 $26.80 - $33.59 - $40.37 $4,646 - $5,822 - $6,997 $55,752 - $69,858 - $83,965
Water Quality Specialist 23 $26.80 - $33.59 - $40.37 $4,646 - $5,822 - $6,997 $55,752 - $69,858 - $83,965
After Hours Duty Pay: $231.56
* This schedule is for Year 1 only. In accordance with the MOU each year will be based on the February San Diego CPI-W.
Page 4 of 4
RESOLUTION 2012-XX
RESOLUTION OF THE BOARD OF DIRECTORS OF PADRE DAM MUNICIPAL WATER DISTRICT
ADOPTING JOB CLASSIFICATIONS AND STANDARD RATES OF PAY FOR FISCAL YEAR 2012/2013
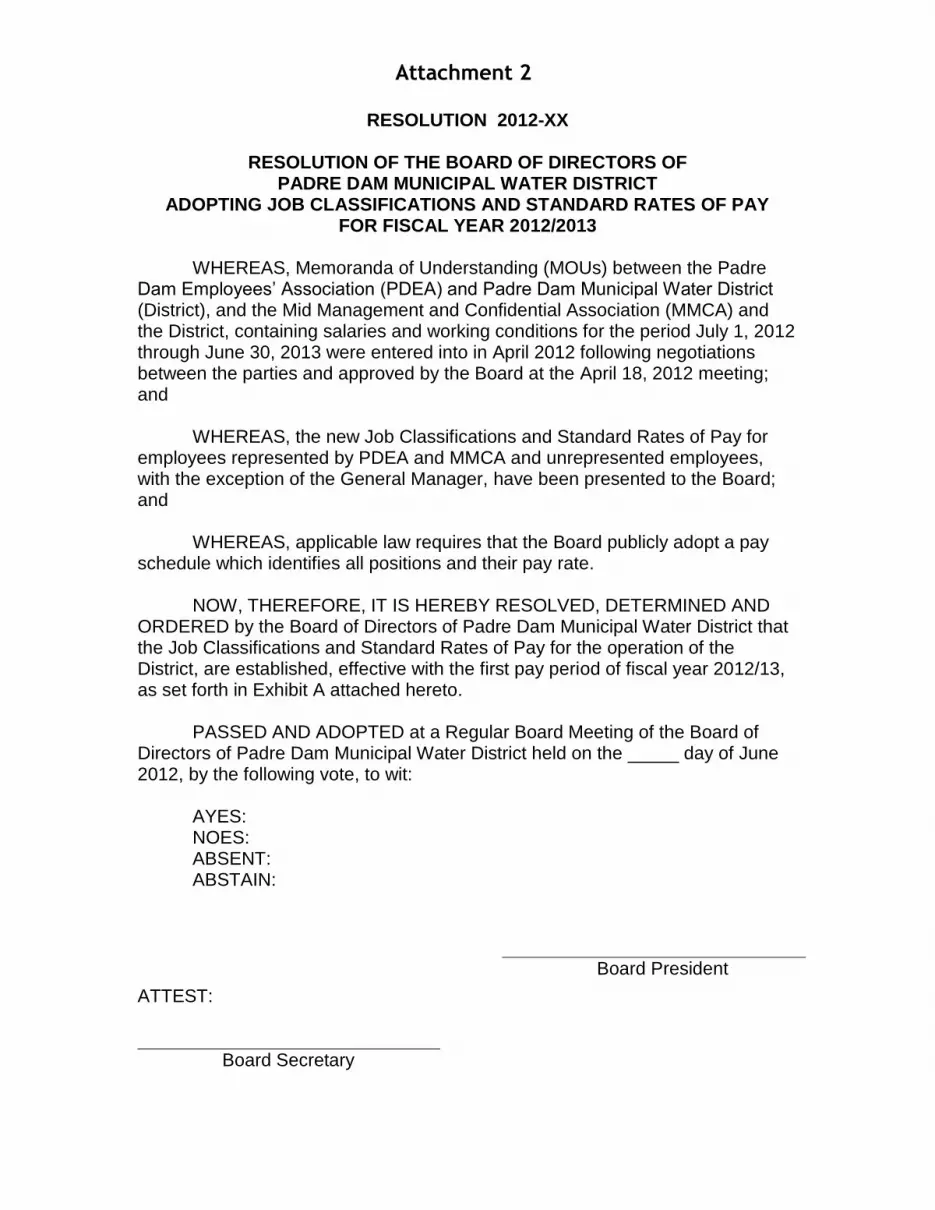
WHEREAS, Memoranda of Understanding (MOUs) between the Padre Dam Employees’ Association (PDEA) and Padre Dam Municipal Water District (District), and the Mid Management and Confidential Association (MMCA) and the District, containing salaries and working conditions for the period July 1, 2012 through June 30, 2013 were entered into in April 2012 following negotiations between the parties and approved by the Board at the April 18, 2012 meeting; and WHEREAS, the new Job Classifications and Standard Rates of Pay for employees represented by PDEA and MMCA and unrepresented employees, with the exception of the General Manager, have been presented to the Board; and WHEREAS, applicable law requires that the Board publicly adopt a pay schedule which identifies all positions and their pay rate. NOW, THEREFORE, IT IS HEREBY RESOLVED, DETERMINED AND ORDERED by the Board of Directors of Padre Dam Municipal Water District that the Job Classifications and Standard Rates of Pay for the operation of the District, are established, effective with the first pay period of fiscal year 2012/13, as set forth in Exhibit A attached hereto.
PASSED AND ADOPTED at a Regular Board Meeting of the Board of Directors of Padre Dam Municipal Water District held on the _____ day of June 2012, by the following vote, to wit: AYES: NOES: ABSENT: ABSTAIN:
Board President
ATTEST:
Board Secretary
Attachment 2


BOARD AGENDA REPORT
Meeting Date: June 6, 2012
Dept. Head: Al Lau, P.E. Submitted by: Arne Sandvik, P.E. / Mark Niemiec, P.E. Department: Engineering Approved by: Allen Carlisle, CEO/GM
SUBJECT: RAY STOYER WATER RECYCLING FACILITY ACCESS ROAD AND SITE PAVING REPAIR (JN
212002) AWARD OF CONSTRUCTION CONTRACT RECOMMENDATION(S): 1. Award the construction contract for the Ray Stoyer Water Recycling Facility Access Road and Site
Paving Repair project to the lowest responsive and responsible bidder, Anthony’s Grading and Paving for a not-to-exceed cost of $49,661.50.
2. Authorize the Director of Engineering and Planning to modify the contract up to 15 percent ($7,449.23) for unforeseen construction changes.
3. Authorize staff to administer construction management/inspection required for the successful completion of the project in the amount not to exceed $6,000.00.
ALTERNATIVE(S): 1. Reject all bids and do not award the construction contract at this time. 2. Reject all bids and re-advertise the Project for bid.
ATTACHMENT(S): 1. Figure 1 – Vicinity Map & Key Map 2. Figure 2 – Paving of Ray Stoyer Water Recycling Facility Access Road 3. Figure 3 – Paving at Ray Stoyer Water Recycling Facility Site
FUNDING: Requested amount: $63,110.73 Budgeted amount: $150,000.00 Are funds available? Yes No Project cost to date: $10,500.00
PRIOR BOARD/COMMITTEE CONSIDERATION: None.
STRATEGIC PLAN IMPLEMENTATION: This agenda item is consistent with the Strategic Plan and meets one or more of the following Strategic Goals: Customer Service & Education; Employee Relations; Facilities Issues, Financial Health; Premier Park; Preventative & Predictive Maintenance; Water Resource Development.
Reviewed by: Dept Head Finance Legal Standard Form
Action Required: Motion Resolution Ordinance None
Policy Updates:
Rules & Regulations
Standard Practices & Policies
Action Taken: As Recommended ___________________ Reso/Ord. No. ______________________ Other _____________________________
#33875v1

#33875v1 Page 2 of 3
EXECUTIVE SUMMARY: The asphalt access road and onsite paving around the Ray Stoyer Water Recycling Facility (WRF) has not had any improvement for over 15 years and is in need of repair. Cracks have developed in most areas of paving and other portions are in need of an overlay or replacement. The bid opening for the Ray Stoyer Water Recycling Facility Access Road and Site Paving Repair project was held on May 22, 2012, at 10:00 a.m., with Anthony’s Grading & Paving as the apparent low bidder in the amount of $49,661.50. Staff recommends the Board award the contract to Anthony’s Grading & Paving. DESCRIPTION: The proposed asphalt pavement improvements include approximately 0.5 miles of access road starting at the south end of Pond C and going north to the WRF as well as improvements to the paved road at the WRF. The work proposed is as follows:
A. Replacement of approximately 5,500 square feet of asphalt paving; B. Overlay (Skin Patch) Paving of approximately 23,000 square feet of asphalt paving; C. Crack Sealing of asphalt; D. Seal Coat application of approximately 141,450 square feet; E. Striping of designated areas; F. Traffic control; G. Restoration of all impacted sites to original condition.
Work is not proposed at this time between the start of the access road at Fanita Parkway to the south end of Pond C (approximately 0.6 miles). This length of access road is adjacent to the area where SDG&E is currently considering using Padre Dam land as a staging area for construction work. The staging area would be used by SDG&E for approximately one year. It is anticipated that some damage may occur to the access road in this area and that it would be better to improve this portion of the road after SDG&E is complete with the staging area in a potential participation agreement. The proposed work is considered to be a short term fix to prevent further structural damage to the existing pavement. The cost to replace the entire access road and WRF site paving was estimated to cost in excess of $250,000. However, due to budget and efficiency considerations, it was determined that major improvement/replacement of the pavement during the expansion of the WRF would be more cost effective.

#33875v1 Page 3 of 3
Bid Results The bid opening was held on May 22, 2012, at 10:00 a.m. with the following bid results:
Bidder/Contractor Bid Amount
1 Anthony’s Grading and Paving $49,661.50
2 Asphalt and Concrete Enterprises, Inc. $55,458.49
3 L.C. Paving & Sealing, Inc. $59,873.75
4 Kirk Paving, Inc. $60,218.75
5 Miller Paving Corporation $62,109.50
6 Angus Asphalt, Inc. $66,417.00
The Engineer’s estimate was $60,000. Anthony’s Grading and Paving is the apparent low bidder. RECOMMENDATION(S): Specifically, staff requests the Board take the following actions:
1. Award the construction contract for the Ray Stoyer Water Recycling Facility Access Road and Site Paving Repair project to the lowest responsive and responsible bidder, Anthony’s Grading and Paving, for a not to exceed cost of $49,661.50.
2. Authorize the Director of Engineering and Planning to modify the contract up to 15 percent ($7,449.23) for unforeseen construction changes.
3. Authorize staff to administer construction management/inspection required for the successful completion of the project in the amount not to exceed $6,000.00.


BOARD AGENDA REPORT
Meeting Date: June 6, 2012
Dept. Head: Allen Carlisle Submitted by: Amy Pederson Department: Administration Approved by: Allen Carlisle, CEO/GM
SUBJECT: MEMBERSHIP IN THE EAST COUNTY ECONOMIC DEVELOPMENT COUNCIL (ECEDC)
RECOMMENDATION(S): 1. Hear presentation by John Minto, Santee City Councilman and Member of the ECEDC Board of
Directors, regarding membership in the East County Economic Development Council and direct staff accordingly.
ALTERNATIVE(S): 1.
ATTACHMENT(S): 1. ECEDC Fact Sheet 2. ECEDC Membership Benefits and Levels 3. Current List of District Memberships
FUNDING: Requested amount: Budgeted amount: Are funds available? Yes No Project cost to date:
PRIOR BOARD/COMMITTEE CONSIDERATION:
STRATEGIC PLAN IMPLEMENTATION: This agenda item is consistent with the District’s Strategic Plan & meets one or more of the following Strategic Goals: Provide safe, reliable water, recycled water and sewer services; Ensure fiscal health and competitively sustainable rates; Enhance customer communications and education; Increase water, wastewater and energy independence; Maintain workforce excellence; Expand park and recreation opportunities.
Reviewed by: Dept Head Finance Legal Standard Form
Action Required: Motion Resolution Ordinance None
Policy Updates:
Rules & Regulations
Standard Practices & Policies
Action Taken: As Recommended ___________________ Reso/Ord. No. ______________________ Other _____________________________

ECEDC_MembershipPresentation Page 2 of 2
EXECUTIVE SUMMARY: Mr. Minto requested an opportunity to present the benefits to the District if it becomes a member of the ECEDC. He will give a brief presentation at the meeting. The ECEDC Fact Sheet and Membership information is attached for your review. DESCRIPTION: Padre Dam was a member of the ECEDC from 1994 to 2005. In 2006, the District withdrew membership from the ECEDC and other organizations as part of a Board directive to cut expenses by 5 percent without reducing service levels. A list of current District Members approved by the Board is attached. RECOMMENDATION(S): Hear presentation by John Minto, Santee City Councilman and Member of the ECEDC Board of Directors, regarding membership in the East County Economic Development Council and direct staff accordingly.

San Diego East County Economic Development Council/Foundation 1870 Cordell Court, Suite 202, El Cajon, CA 92020 P. (619) 258-3670 F. (619) 258-3674 www.eastcountyedc.org
The San Diego East County Economic Development Council (East County EDC) is a dynamic, award-winning, non-profit organization of leaders committed to fostering a healthy, vital economic climate and quality of life in the East County region. Founded in 1984, the East County EDC is an alliance of key representatives from business, industry, community, government, and education working together to promote successful business activity in the cities of El Cajon, La Mesa, Lemon Grove, Santee, and the unincorporated communities including, Alpine, Lakeside and Spring Valley. A Primary Industry Resource Our focus on economic growth in East County’s primary industry benefits the community at large and the entire buyer/supplier chain --- from the manufacturer to commercial and retail sectors. The East County EDC works with the CDC Small Business Finance Corporation and ACCION to offer local business workshops. We hold credit lending consultations at our East County EDC office for local businesses to receive technical assistance on how to obtain access to credit for equipment, tools, and materials. Serving our Communities East County EDC’s core goal is to encourage economic wealth in the East County region. We do this by bringing together numerous organizations and community leaders, forming committees with a specific focus. All East County EDC members have access to committees and forums with a particular focus to give their valuable input and have direct contact with the region’s leaders. Active ECEDC committees include:
Business Outreach Committee (BOC) The BOC consists of local bank investors who meet to discuss outreach to companies, review opportunities for economic, affordable housing, community investment in cities and communities, and to learn about programs/packages the investor organization may want to share with small businesses and their customers. Gillespie Field The East County EDC established the Gillespie Field Committee with representatives from the county of San Diego Airport, SANDAG, CalTrans, the Gillespie Field Development Council, the cities of El Cajon and Santee, the County of San Diego, and other interested individuals and organizations to focus on long range planning for the future development of this regional resource. We are actively looking at redevelopment on and around the airport, and encouraging aviation-related, high valued-added jobs for this critical asset.

San Diego East County Economic Development Council/Foundation 1870 Cordell Court, Suite 202, El Cajon, CA 92020 P. (619) 258-3670 F. (619) 258-3674 www.eastcountyedc.org
Supporting Education and Economic Development (SEED) The East County EDC and educators lead this effort to foster partnerships that connect and support high academic standards and the needs of the workplace. Because the East County EDC recognizes that developing a well-educated and well-trained workforce requires deliberate and continuous effort, we bring high schools, community colleges, universities, and business communities together to build a vital workforce by sharing information and resources. Cooperation and collaboration help identify required workplace skills, link students with the appropriate educational programs, and streamline the entire process from education to employment. Comprehensive Economic Development Strategy (CEDS) The East County EDC has partnered with the South County EDC to create a Comprehensive Economic Development Strategy (CEDS) Task Force designed to improve the prosperity of our businesses and residents. As part of the CEDS, our action plan is to collaboratively support, integrate, and expand business development and entrepreneurship, education and workforce development, infrastructure development, and quality of life in the CEDS area. A CEDS is required to qualify for Economic Development Administration (EDA) assistance under its public works, economic adjustment, and most planning programs, and is a prerequisite for designation by EDA as an Economic Development District (EDD). The EDA has approved our CEDS submission. ECEDC’s Connectory - A Local Resource Encouraging Growth of our Primary Industry Connectory.com, a project of East County EDC, has become the premier business-to-business information tool for the United States. The Connectory focuses on primary industry/technology companies and their buyers and suppliers of goods and services. The high quality Connectory database details company capabilities and capacities at every level of the supply chain. Substantial investment by Connectory supporters makes all of this unique and critical information available at no cost to participating companies. Expansion from the San Diego region to the State of California began in mid-2002 and expansion across the entire nation began in 2009. Given its birth in California, the Golden State still accounts for more than 80 percent of total profile population. Expansion continues as we develop regional economic development partnerships both in California and the U.S. Companies and agencies that are increasingly using the Connectory to locate businesses with specific manufacturing capabilities and capacity are benefitting from its efficiency and cost-effectiveness. Most recently, San Diego CONNECT has begun using the Connectory as its primary resource for their Nearsourcing Initiative, using the Connectory to link San Diego County’s innovation companies to the region’s rich population of local prototyping, manufacturing, engineering, and other relevant companies—many of which are located in San Diego’s East County.

East County Economic Development Council
Serving El Cajon, La Mesa, Lemon Grove, Santee, Alpine, Lakeside, Spring Valley
1870 Cordell Court / Suite 202 / El Cajon / CA / 92020 / Phone (619) 258-3670 / Fax (619) 258-3674
Web www.eastcountyedc.org / Email [email protected]
EAST COUNTY ECONOMIC DEVELOPMENT COUNCIL MEMBERSHIP BENEFITS AND LEVELS
AT ALL LEVELS:
• Subscription to the e-PIN, the monthly electronic newsletter Primary Industry News • First chance to participate in East County EDC-involved business development
opportunities • Invitation to participate in standing and ad hoc committees • Free Connectory profile for all primary industry members
DEFINED MEMBERSHIP LEVELS: SUSTAINING MEMBERSHIP - $1500
• Profiled as “Member of the Month” in our Primary Industry Newsletter • Access to East County EDC resource material • Personal consulting with East County EDC staff on business, and other special issues
of interest to members – four (4) hours • Listed as a Sustaining Member on the Membership Page of the East County EDC
website SUPPORTING MEMBERSHIP - $750
• Personal consulting with East County EDC staff on business, and other special issues of interest to members – two (2) hours
• Listed as a Supporting Member on the Membership Page of the East County EDC website
• Access to East County EDC resource material CONTRIBUTING MEMBERSHIP - $200
• This level of membership is for individuals and very small businesses only • Listed as a Contributing Member on the Membership Page of the East County EDC
website

East County Economic Development Council
Serving El Cajon, La Mesa, Lemon Grove, Santee, Alpine, Lakeside, Spring Valley
1870 Cordell Court / Suite 202 / El Cajon / CA / 92020 / Phone (619) 258-3670 / Fax (619) 258-3674
Web www.eastcountyedc.org / Email [email protected]
PARTNERS EAST!
YOU ARE INVITED TO JOIN THE
EAST COUNTY ECONOMIC DEVELOPMENT COUNCIL
EAST COUNTY EDC ANNUAL MEMBERSHIP SCHEDULE
$1,500 SUSTAINING $ 750 SUPPORTING $ 200 CONTRIBUTING
Name______________________________________________________ Company____________________________Title___________________ Address____________________________________________________ Telephone___________ Fax_____________Email__________________
PROMOTING ECONOMIC VITALITY IN SAN DIEGO'S EAST COUNTY

DISTRICT MEMBERSHIPS
FY 11/12 Forecast
FY 12/13 budget
FY 13/14 budget
FY 14/15 budget
FY 15/16 budget
FY 16/17 budget
Alpine Chamber of Commerce 800.00 800.00 800.00 800.00 800.00 800.00American Water Works Association (AWWA) 3,419.00 3,504.48 3,592.09 3,681.89 3,773.94 3,868.28Association of California Water Agencies (ACWA) 20,124.50 20,627.61 21,143.30 21,671.89 22,213.68 22,769.02California Special Districts Association (CSDA) 4,581.00 4,695.53 4,812.91 4,933.24 5,056.57 5,182.98CSDA San Diego Chapter 150.00 150.00 150.00 150.00 150.00 150.00Santee Chamber of Commerce 195.00 195.00 195.00 195.00 195.00 195.00
Urban Water Institute, Inc. 500.00 500.00 500.00 500.00 500.00 500.00Water Education Foundation 1000.00 1,000.00 1,000.00 1,000.00 1,000.00 1,000.00Water ReUse Association (San Diego Chapter) 75.00 75.00 75.00 75.00 75.00 75.00Water ReUse Association 2,378.61 2,414.29 2,450.50 2,511.77 2,574.56 2,638.92Water ReUse Research Foundation 6,000.00 6,000.00 6,000.00 6,000.00 6,000.00 6,000.00Total Membership Dues 39,223.11 39,961.90 40,718.81 41,518.78 42,338.75 43,179.21

BOARD AGENDA REPORT
Meeting Date: June 7, 2012
Submitted by: Allen Carlisle, CEO/GM Department: Administration Approved by: Allen Carlisle, CEO/GM
SUBJECT: FIVE YEAR BUSINESS PLAN AND BUDGET FOR FISCAL YEARS 2012/2013-2016/2017;
SCHEDULING PUBLIC HEARING FOR WATER AND SEWER RATE ADJUSTMENTS RECOMMENDATION(S): 1. Hear report from HDR on results of the Cost-of Service and Rate Design analyses. 2. Adopt Resolution approving the Five Year Business Plan and Budget for fiscal years 2012/13 through
2016/17. 3. Direct staff to set a public hearing date for August 15, 2012 at 6:00pm and proceed with Prop. 218
notice requirements for proposed rate adjustments. 4. Direct staff with any desired changes.
ALTERNATIVE(S): 1. Direct staff to make additional changes to be considered at the June 20 board meeting.
ATTACHMENT(S): 1. Draft Resolution and related Exhibits:
Exhibit A: Operating Budgets for Retail Water, Recycled Water, Sewer and Park Exhibit B: Capital Equipment Budget Exhibit C: Capital Improvement Budget Exhibit D: Five-Year Business Plan and Budget (previously distributed with May 30 Agenda)
2. Chapter 2, Water Resources Development – Revised to reflect changes suggested by the Board to be incorporated into the Five-Year Business Plan and Budget.
FUNDING: Requested amount: Budgeted amount: Are funds available? Yes No Project cost to date:
PRIOR BOARD/COMMITTEE CONSIDERATION: May 30, 2012 Board Meeting
STRATEGIC PLAN IMPLEMENTATION: This agenda item is consistent with the District’s Strategic Plan & meets one or more of the following Strategic Goals: Provide safe, reliable water, recycled water and sewer services; Ensure fiscal health and competitively sustainable rates; Enhance customer communications and education; Increase water, wastewater and energy independence; Maintain workforce excellence; Expand park and recreation opportunities.
Reviewed by: Dept Head Finance Legal Standard Form
Action Required: Motion Resolution Ordinance None
Policy Updates:
Rules & Regulations
Standard Practices & Policies
Action Taken: As Recommended ___________________ Reso/Ord. No. ______________________ Other _____________________________

Page 2 of 4
EXECUTIVE SUMMARY: At the May 30th special board meeting, staff presented the District’s Five Year Business Plan and Budget for FY ’13 – ’17 (Plan) including the operating budget, capital equipment budget, technology plan, preventive and predictive maintenance plan and capital improvement plan. The Board also heard a presentation from Atkins Consulting which helped to explain variances in water and sewer rates among agencies in the San Diego County region. Finally HDR consulting presented the results of the Revenue Requirements Analysis. Staff then asked the Board for its input and feedback on the draft Five Year Business Plan and Budget and recommended revenue adjustments to allow HDR to complete the cost of service and rate design studies. At this meeting HDR will present the findings of its study and recommend new rate structures and rates. The workshop dates and chapters reviewed are identified below: April 4, 2012 (Regular Board Meeting)
• Results of 2008-2012 Five-Year Business Plan and Budget and Board direction to proceed with preparation of the 2013-2017 Five-Year Business Plan & Budget.
May 23, 2012 (Park Committee Meeting)
• Park Five Year Business Plan and Budget (Chapter 12)
May 30, 2012 (Special Board Meeting) – Five-Year Business Plan & Budget Chapters 1-14. • Key Components of the Plan presented:
• Preventive & Predictive Maintenance Plan (Chapter 4) • Capital Improvement Plan (Chapter 5) • Technology Plan (Chapter 6)
• Five Year Budget Analysis (Chapter 13 and 14) • Rate Comparison Study Results (Atkins) • Revenue Requirements (HDR)
June 6, 2012 (Regular Board Meeting)
• Rate Design (HDR) • Cost of Service Study (HDR) • Five Year Water and Sewer Rate Plan (Chapter 11) – HDR will provide a handout with
recommended rates at the meeting
June 20, 2012 (Regular Board Meeting) • At the discretion of the Board
The Board may approve the Five Year Plan and Budget at the June 6 or June 20 meeting and direct staff to proceed with the Prop. 218 noticing process necessary for any proposed water and sewer rate adjustments. In addition to the Prop. 218, staff will hold two community meetings (eastern and western area) to educate customers on the new rate design and the value of water prior to the Public Hearing. DESCRIPTION: The District’s current water rate structure was designed to fairly allocate water to customers based on their lot size and purchased EDUs. There are 5 tiers and 7 residential types and other nonresidential types including commercial, multi-family, irrigation, governmental, industrial and agricultural. The District receives property tax revenue and a portion of those taxes relate only to amounts collected from Eastern Service Area customers; Eastern customers’ water rates are therefore slightly lower. The District’s current sewer rate structure was designed to fairly allocate the costs of sewer collection and treatment among its customers, and is generally consistent with/similar to methodologies used by entities providing sewer services. There is no exact method to bill sewer customers since flow is not metered. As a result, the methodology the District employs was created to arrive at a reasonable estimation of sewer flow by looking at a customer’s lowest 60-day water consumption from the

Page 3 of 4
previous calendar year. Their bill is then based on that water usage along with a fixed monthly fee. Customers are re-evaluated every January. HDR Consulting was engaged to review the District’s sewer and water rate structures, recommend potential changes or improvements to those structures and develop models for setting both fixed and variable rates. Staff will be able to use HDR’s models to assist them with long range financial analysis, planning and rate setting. In addition, HDR will assist in the development of the Prop. 218 notice, serve as a resource regarding the proposed rates at the 218 hearing and educate the Board and staff on utilized methodologies and assumptions. Staff selected HDR because of the team’s relevant experience, expertise, approach, and sophisticated rate and financial models. Staff’s key objectives for the project were as follows:
Develop rate models to evaluate and set fixed and variable water and sewer rates. Simplify the rate structures if appropriate by reducing the number of tiers and consolidating
customer classes, while still meeting Proposition 218 requirements. Ensure the District is receiving sufficient revenue to cover costs, provide adequate reserves,
and meet debt coverage requirements. Develop rate models that are straightforward and easy for the public to understand. Develop a long range financial plan to help guide the District in the future.
In addition, staff wanted to develop rates that addressed the retail water operation’s deficit and increase the level of CIP over the five years of the Plan while maintaining reserves at prudent levels. The following provides an overview of components of HDR’s rate study:
At the May 30th special board meeting, HDR presented the findings from its revenue requirements analysis. As part of the resulting financial plan, HDR developed projected revenue requirements to address reserve fund levels, bond coverage requirements, and funding sources for capital and operations and maintenance costs. HDR concluded that a 4.8% annual increase in water revenues and a 1.5% annual increase in sewer revenues would be necessary each year to accomplish the goals of the Plan. After hearing reports from staff, Atkins, and HDR, the Board conceptually approved the Five Year Business Plan and Budget and recommended revenue adjustments to allow HDR to complete the cost of service and rate design studies.

Page 4 of 4
At the June 6 meeting, HDR will present the findings from its Cost-of-Service and Rate Design analyses. The Cost-of-Service analysis was needed for HDR to ensure the appropriate amount of rate revenue is collected from each customer class, thereby fulfilling the Prop. 218 requirements for proportionality among customers. The Rate Design analysis was needed for HDR to recommend changes to the District’s current rate structure. Staff was interested in simplifying the District’s water rate structure including reducing the number of tiers, decreasing the number of customer service types and developing a single rate for each tier with a corresponding credit for Eastern service area customers. They were also interested in the appropriate allocation of costs to fixed and variable charges, within the California Urban Water Conservation Council guidelines. For the sewer operation, Staff was interested HDR’s opinion of the District’s current method of charging customers. Staff also wanted HDR to consider alternative methodologies and provide guidance on their recommended method. After HDR’s presentation, staff will ask the Board to approve the Plan, authorize staff to proceed with developing the Prop. 218 notice for the proposed rates to be presented at the August 15, 2012 public hearing. RECOMMENDATION(S): 1. Hear report on results of the costs of services and recommended rate design option. 2. Adopt Resolution approving the Five Year Business Plan and Budget for fiscal years 2012/13 through
2016/17. 3. Direct staff to set a public hearing date for August 15, 2012 at 6:00pm and proceed with Prop. 218
notice requirements for proposed rate adjustments. 4. Direct staff with any desired changes.

ATTACHMENT 1 RESOLUTION 2012-___
RESOLUTION OF THE BOARD OF DIRECTORS
OF THE PADRE DAM MUNICIPAL WATER DISTRICT ADOPTING A BUSINESS PLAN AND BUDGET FOR
FISCAL YEARS 2012/13 THROUGH 2016/17 WHEREAS, the Padre Dam Municipal Water District is organized and operates pursuant to the Municipal Water District Act of 1911 commencing with Section 71000 of the California Water Code; and WHEREAS, there has been presented to the Board of Directors a proposed five-year Business Plan and Budget for the Padre Dam Municipal Water District for the fiscal years 2012/13 through fiscal years 2016/17; and
WHEREAS, the proposed Business Plan and Budget has been reviewed and considered by the Board; and WHEREAS, the Board of Directors determined it to be in the best interest of the District adopt said Business Plan and Budget for the sound financial operation of the District; and NOW, THEREFORE, be it resolved, determined and ordered by the Board of Directors of the Padre Dam Municipal Water District, as follows:
Section 1. The matters set forth in the Recitals to this Resolution are true and correct statements.
Section 2. The Summary of the Operating Budgets for Retail Water, Recycled
Water, Sewer and Park, for the Padre Dam Municipal Water District, a copy of which is attached hereto as Exhibit “A,” is hereby incorporated into the District’s Business Plan and Budget for fiscal years 2012/13 through 2016/17.
Section 3. The Summary of the Capital Equipment Budget for the Padre Dam
Municipal Water District, a copy of which is attached hereto as Exhibit ”B,” is hereby incorporated into the District’s Business Plan and Budget for fiscal years 2012/13 through 2016/17.
Section 4. The Summary of the Capital Improvement Program Budget of the Padre
Dam Municipal Water District, a copy of which is attached hereto as Exhibit “C,” and it is hereby incorporated into the District’s Business Plan and Budget for fiscal years 2012/13 through 2016/17.
Section 5. The five-year Business Plan and Budget for the Padre Dam Municipal
Water District for fiscal years 2012/13 through 2016/17 is attached hereto as Exhibit ”D,” and it is hereby adopted as the District’s Business Plan and Budget for fiscal years 2012/13 through 2016/17.
Section 6. The Board shall adopt Resolutions before the commencement of each
fiscal year within the five-year plan affirming modifications and carry-overs as described in the Business Plan and Budget attached hereto as Exhibit “D.”

Section 7. This Resolution shall take effect on July 1, 2012.
PASSED AND ADOPTED at a regular meeting of the Board of Directors of the Padre Dam Municipal Water District held on June ____ , 2012, by the following vote:
AYES: NOES: ABSTAIN: ABSENT:
ATTEST:
Board President
Board Secretary

Padre Dam Municipal Water DistrictFive-Year Plan Budget
FY '13 - FY '17Combined Operations
2012/13 2013/14 2014/15 2015/16 2016/17
YEAR 1 YEAR 2 YEAR 3 YEAR 4 YEAR 5 TOTAL
Revenues:
Water Sales 23,565,296$ 24,685,106$ 25,857,320$ 27,084,103$ 28,369,089$ 129,560,915$
Infrastructure Access Charge ("IAC) 784,532 784,532 784,532 784,532 784,532 3,922,660
Energy Billings 1,575,392 1,669,915 1,770,110 1,876,317 1,988,896 8,880,630
CWA/Metro Water Purchase Credits 285,546 285,546 285,546 285,546 285,546 1,427,730
Padre Dam Sewer Processing Revenue 1,959,038 2,056,989 2,159,839 2,267,831 2,381,222 10,824,919
Sewer Revenues 14,477,786 14,700,502 14,926,645 15,156,266 15,389,419 74,650,618
System Charges 6,865,001 7,191,222 7,532,707 7,890,091 8,264,431 37,743,451
Park Fees 4,391,247 4,539,306 4,652,159 4,836,628 4,961,097 23,380,437
Property Tax Subvention 2,400,000 2,424,000 2,448,240 2,472,722 2,497,450 12,242,412
Other Revenues 807,602 782,340 921,202 928,768 930,929 4,370,840
Total Operating Revenues 57,111,439 59,119,459 61,338,300 63,582,804 65,852,610 307,004,612
Direct Costs:
Water Purchases 13,325,865 13,325,865 13,325,865 13,325,865 13,325,865 66,629,325
Infrastructure Access Charge ("IAC") 784,532 784,532 784,532 784,532 784,532 3,922,660
Energy Purchases 1,575,392 1,669,915 1,770,110 1,876,317 1,988,896 8,880,630
Sewer Metro Costs 3,900,000 3,900,000 3,900,000 3,900,000 3,900,000 19,500,000
Padre Dam Sewer Processing Fee 1,959,038 2,056,989 2,159,839 2,267,831 2,381,222 10,824,919
Fish Stocking 107,924 108,461 108,997 109,534 110,071 544,987
Park Purchases 144,836 144,836 144,836 144,836 144,836 724,180
Total Direct Costs 21,797,586 21,990,599 22,194,179 22,408,915 22,635,422 111,026,701
Revenues Available for Operating Expenses 35,313,853 37,128,860 39,144,121 41,173,889 43,217,188 195,977,911
Operating Expenses:
Salary & Wages 11,611,776 11,978,849 12,419,673 12,816,486 13,429,644 62,256,429
Employee Benefits 7,040,563 7,264,626 7,459,341 7,829,151 8,403,043 37,996,725
Professional Services 965,890 1,067,664 1,204,939 1,139,068 1,223,258 5,600,819
Materials, Supplies, Vehicle & Building 4,003,689 4,096,233 4,209,080 4,302,092 4,412,375 21,023,471
Administrative 1,143,921 1,147,205 1,195,712 1,232,865 1,238,214 5,957,917
Utilities 1,138,994 1,178,891 1,220,582 1,262,947 1,305,930 6,107,344
Billing Credits (2,910,995) (2,982,425) (3,076,448) (3,094,914) (3,187,462) (15,252,244)
Operating Expenses before Depreciation 22,993,838 23,751,044 24,632,880 25,487,696 26,825,002 123,690,460
Depreciation and Amortization 7,435,203 8,719,333 9,457,648 9,986,168 10,166,948 45,765,301
Operating Income (Loss) 4,884,812 4,658,483 5,053,593 5,700,025 6,225,237 26,522,150
Non-Operating Activity:
Interest Expense (3,009,982) (2,935,352) (2,837,962) (2,745,811) (2,632,290) (14,161,398)
Interest Income 102,042 102,154 219,260 243,730 402,474 1,069,660
Other Income - - - - - -
Other Expenses - - - - - -
Total Non-Operating Activity (2,907,940) (2,833,198) (2,618,702) (2,502,081) (2,229,816) (13,091,738)
Revenues Over (Under) Expenses 1,976,871 1,825,284 2,434,891 3,197,943 3,995,422 13,430,412
Interest Income - CEF 100,000 40,000 5,000 - - 145,000
Change in Net Assets 2,076,871$ 1,865,284$ 2,439,891$ 3,197,943$ 3,995,422$ 13,575,412$
Fund Balances
Add:
Depreciation and Amortization 7,435,203 8,719,333 9,457,648 9,986,168 10,166,948 45,765,301
Capacity Fees 700,000 700,000 700,000 700,000 700,000 3,500,000
2009 COP Transfers / Woodside 7,610,201 11,068,143 1,454,009 - - 20,132,353
Financing (Grants, SRF Loan, Other) 1,500,000 1,549,500 - - - 3,049,500
Deduct:
Capital Improvements & Equipment (19,629,075) (23,476,322) (11,516,572) (9,580,045) (10,665,253) (74,867,266)
Debt Principal (2,682,901) (2,800,256) (2,896,806) (2,978,697) (2,759,659) (14,118,318)
Financing (Grants, SRF Loan, Other) (7,610,201) (11,068,143) (1,454,009) - - (20,132,353)
Transfers between CEF and CRF - - - - - -
Cash Generated (Used) (10,599,902) (13,442,460) (1,815,838) 1,325,370 1,437,459 (23,095,371)
Beginning Fund Balance 45,385,493 34,785,591 21,343,131 19,527,293 20,852,663 45,385,493
Ending Fund Balance 34,785,591$ 21,343,131$ 19,527,293$ 20,852,663$ 22,290,122$ 22,290,122$

Padre Dam Municipal Water DistrictFive-Year Plan Budget
FY '13 - FY '17Retail Water Operations
2012/13 2013/14 2014/15 2015/16 2016/17
YEAR 1 YEAR 2 YEAR 3 YEAR 4 YEAR 5 TOTAL
Revenues:
Water Sales 22,435,688$ 23,501,819$ 24,617,832$ 25,785,808$ 27,009,198$ 123,350,346$
Infrastructure Access Charge ("IAC) 784,532 784,532 784,532 784,532 784,532 3,922,660
Energy Billings 1,575,392 1,669,915 1,770,110 1,876,317 1,988,896 8,880,630
CWA/Metro Water Purchase Credits - - - - - -
Padre Dam Sewer Processing Revenue - - - - - -
Sewer Revenues - - - - - -
System Charges 6,768,244 7,089,867 7,426,538 7,778,885 8,147,948 37,211,481
Park Fees - - - - - -
Property Tax Subvention 2,400,000 2,424,000 2,448,240 2,472,722 2,497,450 12,242,412
Other Revenues 792,602 767,340 906,202 913,768 915,929 4,295,840
Total Operating Revenues 34,756,457 36,237,473 37,953,455 39,612,032 41,343,952 189,903,369
Direct Costs:
Water Purchases 13,325,865 13,325,865 13,325,865 13,325,865 13,325,865 66,629,325
Infrastructure Access Charge ("IAC") 784,532 784,532 784,532 784,532 784,532 3,922,660
Energy Purchases 1,575,392 1,669,915 1,770,110 1,876,317 1,988,896 8,880,630
Sewer Metro Costs - - - - - -
Padre Dam Sewer Processing Fee - - - - - -
Fish Stocking - - - - - -
Park Purchases - - - - - -
Total Direct Costs 15,685,789 15,780,312 15,880,507 15,986,714 16,099,293 79,432,615
Revenues Available for Operating Expenses 19,070,669 20,457,161 22,072,947 23,625,318 25,244,659 110,470,754
Operating Expenses:
Salary & Wages 6,836,673 7,043,434 7,297,413 7,494,908 7,841,237 36,513,665
Employee Benefits 4,122,334 4,244,349 4,354,344 4,558,505 4,889,541 22,169,073
Professional Services 420,238 488,792 570,958 545,224 596,910 2,622,122
Materials, Supplies, Vehicle & Building 2,095,517 2,133,385 2,189,634 2,229,553 2,304,423 10,952,512
Administrative 586,271 585,516 615,450 635,446 645,688 3,068,371
Utilities 88,577 91,459 94,240 97,029 99,767 471,072
Billing Credits (1,785,641) (1,839,210) (1,894,387) (1,912,030) (1,969,391) (9,400,658)
Operating Expenses before Depreciation 12,363,969 12,747,725 13,227,653 13,648,636 14,408,174 66,396,158
Depreciation and Amortization 4,955,243 5,893,746 6,439,970 6,677,552 6,645,918 30,612,428
Operating Income (Loss) 1,751,457 1,815,690 2,405,324 3,299,130 4,190,568 13,462,169
Non-Operating Activity:
Interest Expense (2,044,905) (2,009,340) (1,877,568) (1,809,963) (1,751,722) (9,493,497)
Interest Income 24,105 25,429 60,091 70,844 108,549 289,018
Other Income - - - - - -
Other Expenses - - - - - -
Total Non-Operating Activity (2,020,800) (1,983,911) (1,817,477) (1,739,119) (1,643,173) (9,204,479)
Revenues Over (Under) Expenses (269,343) (168,221) 587,848 1,560,011 2,547,395 4,257,690
Interest Income - CEF - - - - - -
- - - - - -
Change in Net Assets (269,343)$ (168,221)$ 587,848$ 1,560,011$ 2,547,395$ 4,257,690$
Fund Balances
Add:
Depreciation and Amortization 4,955,243 5,893,746 6,439,970 6,677,552 6,645,918 30,612,428
Capacity Fees 379,534 379,534 379,534 379,534 379,534 1,897,670
2009 COP Transfers / Woodside 5,662,715 6,826,284 889,854 - - 13,378,852
Financing (Grants, SRF Loan, Other) - - - - - -
Deduct: - - - - - -
Capital Improvements & Equipment (9,626,002) (10,897,570) (5,739,067) (6,225,085) (8,788,599) (41,276,323)
Debt Principal (1,272,321) (1,332,791) (1,377,825) (1,410,930) (1,423,215) (6,817,082)
Financing (Grants, SRF Loan, Other) -
Transfers between CEF and CRF - - - (1,000,000) (1,000,000) (2,000,000)
Cash Generated (Used) (170,174) 700,982 1,180,313 (18,919) (1,638,967) 53,235
Beginning Fund Balance 4,918,134 4,747,960 5,448,942 6,629,255 6,610,336 4,918,134
Ending Fund Balance 4,747,960$ 5,448,942$ 6,629,255$ 6,610,336$ 4,971,369$ 4,971,369$

Padre Dam Municipal Water DistrictFive-Year Plan Budget
FY '13 - FY '17Recycled Water Operations
2012/13 2013/14 2014/15 2015/16 2016/17
YEAR 1 YEAR 2 YEAR 3 YEAR 4 YEAR 5 TOTAL
Revenues:
Water Sales 1,129,608$ 1,183,287$ 1,239,488$ 1,298,295$ 1,359,892$ 6,210,569$
Infrastructure Access Charge ("IAC) - - - - - -
Energy Billings - - - - - -
CWA/Metro Water Purchase Credits 285,546 285,546 285,546 285,546 285,546 1,427,730
Padre Dam Sewer Processing Revenue 1,959,038 2,056,989 2,159,839 2,267,831 2,381,222 10,824,919
Sewer Revenues - - - - - -
System Charges 96,757 101,355 106,169 111,206 116,482 531,970
Park Fees - - - - - -
Property Tax Subvention - - - - - -
Other Revenues - - - - - -
Total Operating Revenues 3,470,949 3,627,177 3,791,042 3,962,878 4,143,142 18,995,188
Direct Costs:
Water Purchases - - - - - -
Infrastructure Access Charge ("IAC") - - - - - -
Energy Purchases - - - - - -
Sewer Metro Costs - - - - - -
Padre Dam Sewer Processing Fee - - - - - -
Fish Stocking - - - - - -
Park Purchases - - - - - -
Total Direct Costs - - - - - -
Revenues Available for Operating Expenses 3,470,949 3,627,177 3,791,042 3,962,878 4,143,142 18,995,188
Operating Expenses:
Salary & Wages 836,255 861,545 892,612 916,769 959,132 4,466,312
Employee Benefits 506,263 521,247 534,756 559,829 600,483 2,722,579
Professional Services 33,474 38,935 45,479 43,430 47,547 208,864
Materials, Supplies, Vehicle & Building 246,117 250,564 257,171 261,859 270,652 1,286,363
Administrative 98,249 98,122 103,139 106,490 108,206 514,207
Utilities 159,516 164,707 169,716 174,739 179,669 848,346
Billing Credits (233,361) (240,361) (247,572) (249,878) (257,374) (1,228,547)
Operating Expenses before Depreciation 1,646,513 1,694,759 1,755,300 1,813,237 1,908,315 8,818,124
Depreciation and Amortization 633,735 758,718 843,428 897,822 969,603 4,103,306
Operating Income (Loss) 1,190,701 1,173,700 1,192,314 1,251,818 1,265,224 6,073,758
Non-Operating Activity:
Interest Expense (154,941) (132,243) (108,407) (83,029) (55,501) (534,120)
Interest Income 24,046 23,606 50,066 56,549 98,419 252,686
Other Income - - - - - -
Other Expenses - - - - - -
Total Non-Operating Activity (130,895) (108,637) (58,341) (26,480) 42,918 (281,434)
Revenues Over (Under) Expenses 1,059,806 1,065,064 1,133,973 1,225,338 1,308,142 5,792,323
Interest Income - CEF - - - - - -
Change in Net Assets 1,059,806$ 1,065,064$ 1,133,973$ 1,225,338$ 1,308,142$ 5,792,323$
Fund Balances
Add:
Depreciation and Amortization 633,735 758,718 843,428 897,822 969,603 4,103,306
Capacity Fees - - - - - -
2009 COP Transfers / Woodside 65,610 109,615 - - - 175,226
Financing (Grants, SRF Loan, Other) - - - - - -
Deduct: - - - - -
Capital Improvements & Equipment (1,166,122) (1,171,332) (561,499) (608,547) (445,763) (3,953,263)
Debt Principal (752,899) (778,674) (801,890) (825,664) (666,346) (3,825,473)
Financing (Grants, SRF Loan, Other) - - - - - -
Transfers between CEF and CRF - - - (250,000) (250,000) (500,000)
Cash Generated (Used) (159,870) (16,609) 614,012 438,950 915,637 1,792,119
Beginning Fund Balance 4,901,149 4,741,279 4,724,670 5,338,682 5,777,632 4,901,149
Ending Fund Balance 4,741,279$ 4,724,670$ 5,338,682$ 5,777,632$ 6,693,268$ 6,693,268$

Padre Dam Municipal Water DistrictFive-Year Plan Budget
FY '13 - FY '17Sewer Operations
2012/13 2013/14 2014/15 2015/16 2016/17
YEAR 1 YEAR 2 YEAR 3 YEAR 4 YEAR 5 TOTAL
Revenues:
Water Sales -$ -$ -$ -$ -$ -$
Infrastructure Access Charge ("IAC) - - - - - -
Energy Billings - - - - - -
CWA/Metro Water Purchase Credits - - - - - -
Padre Dam Sewer Processing Revenue - - - - - -
Sewer Revenues 14,477,786 14,700,502 14,926,645 15,156,266 15,389,419 74,650,618
System Charges - - - - - -
Park Fees - - - - - -
Property Tax Subvention - - - - - -
Other Revenues 15,000 15,000 15,000 15,000 15,000 75,000
Total Operating Revenues 14,492,786 14,715,502 14,941,645 15,171,266 15,404,419 74,725,618
Direct Costs:
Water Purchases - - - - - -
Infrastructure Access Charge ("IAC") - - - - - -
Energy Purchases - - - - - -
Sewer Metro Costs 3,900,000 3,900,000 3,900,000 3,900,000 3,900,000 19,500,000
Padre Dam Sewer Processing Fee 1,959,038 2,056,989 2,159,839 2,267,831 2,381,222 10,824,919
Fish Stocking - - - - - -
Park Purchases - - - - - -
Total Direct Costs 5,859,038 5,956,989 6,059,839 6,167,831 6,281,222 30,324,919
Revenues Available for Operating Expenses 8,633,749 8,758,513 8,881,806 9,003,435 9,123,197 44,400,699
Operating Expenses:
Salary & Wages 2,952,924 3,042,229 3,151,929 3,237,232 3,386,819 15,771,134
Employee Benefits 1,820,612 1,874,499 1,923,078 2,013,245 2,159,445 9,790,878
Professional Services 230,826 268,481 313,613 299,478 327,868 1,440,267
Materials, Supplies, Vehicle & Building 1,184,392 1,205,795 1,237,587 1,260,150 1,302,466 6,190,390
Administrative 292,110 291,734 306,649 316,612 321,715 1,528,819
Utilities 405,127 418,309 431,030 443,788 456,308 2,154,563
Billing Credits (861,994) (887,854) (914,489) (923,006) (950,696) (4,538,039)
Operating Expenses before Depreciation 6,023,998 6,213,194 6,449,397 6,647,498 7,003,925 32,338,011
Depreciation and Amortization 980,055 1,105,438 1,188,010 1,398,621 1,526,856 6,198,980
Operating Income (Loss) 1,629,696 1,439,880 1,244,400 957,317 592,415 5,863,708
Non-Operating Activity:
Interest Expense (46,608) (37,322) (27,758) (17,906) (7,287) (136,882)
Interest Income 49,153 48,449 97,518 102,550 170,023 467,693
Other Income - - - - - -
Other Expenses - - - - - -
Total Non-Operating Activity 2,545 11,127 69,760 84,644 162,736 330,811
Revenues Over (Under) Expenses 1,632,241 1,451,007 1,314,160 1,041,961 755,152 6,194,519
Interest Income - CEF - - - - - -
Change in Net Assets 1,632,241$ 1,451,007$ 1,314,160$ 1,041,961$ 755,152$ 6,194,519$
Fund Balances
Add:
Depreciation and Amortization 980,055 1,105,438 1,188,010 1,398,621 1,526,856 6,198,980
Capacity Fees 210,097 210,097 210,097 210,097 210,097 1,050,485
2009 COP Transfers / Woodside 226,976 379,210 - - - 606,186
Financing (Grants, SRF Loan, Other) - - - - - -
Deduct: - - - - - -
Capital Improvements & Equipment (2,886,247) (2,962,540) (2,075,146) (1,609,682) (715,291) (10,248,907)
Debt Principal (309,606) (318,891) (328,455) (338,307) (252,242) (1,547,501)
Financing (Grants, SRF Loan, Other) - - - - - -
Transfers between CEF and CRF - - - (800,000) (800,000) (1,600,000)
Cash Generated (Used) (146,484) (135,679) 308,665 (97,311) 724,572 653,763
Beginning Fund Balance 9,928,433 9,781,949 9,646,270 9,954,935 9,857,624 9,928,433
Ending Fund Balance 9,781,949$ 9,646,270$ 9,954,935$ 9,857,624$ 10,582,196$ 10,582,196$

Padre Dam Municipal Water DistrictFive-Year Plan Budget
FY '13 - FY '17Park Operations
2012/13 2013/14 2014/15 2015/16 2016/17
YEAR 1 YEAR 2 YEAR 3 YEAR 4 YEAR 5 TOTAL
Revenues:
Water Sales -$ -$ -$ -$ -$ -$
Infrastructure Access Charge ("IAC) - - - - - -
Energy Billings - - - - - -
CWA/Metro Water Purchase Credits - - - - - -
Padre Dam Sewer Processing Revenue - - - - - -
Sewer Revenues - - - - - -
System Charges - - - - - -
Park Fees 4,391,247 4,539,306 4,652,159 4,836,628 4,961,097 23,380,437
Property Tax Subvention - - - - - -
Other Revenues - - - - - -
Total Operating Revenues 4,391,247 4,539,306 4,652,159 4,836,628 4,961,097 23,380,437
Direct Costs:
Water Purchases - - - - - -
Infrastructure Access Charge ("IAC") - - - - - -
Energy Purchases - - - - - -
Sewer Metro Costs - - - - - -
Padre Dam Sewer Processing Fee - - - - - -
Fish Stocking 107,924 108,461 108,997 109,534 110,071 544,987
Park Purchases 144,836 144,836 144,836 144,836 144,836 724,180
Total Direct Costs 252,760 253,297 253,833 254,370 254,907 1,269,167
Revenues Available for Operating Expenses 4,138,487 4,286,009 4,398,326 4,582,258 4,706,190 22,111,270
Operating Expenses:
Salary & Wages 985,924 1,031,641 1,077,719 1,167,577 1,242,457 5,505,318
Employee Benefits 591,355 624,531 647,163 697,572 753,574 3,314,195
Professional Services 281,351 271,456 274,888 250,936 250,934 1,329,566
Materials, Supplies, Vehicle & Building 477,663 506,489 524,689 550,531 534,834 2,594,206
Administrative 167,291 171,832 170,475 174,318 162,605 846,521
Utilities 485,774 504,417 525,597 547,390 570,186 2,633,363
Billing Credits (30,000) (15,000) (20,000) (10,000) (10,000) (85,000)
Operating Expenses before Depreciation 2,959,358 3,095,366 3,200,530 3,378,324 3,504,589 16,138,168
Depreciation and Amortization 862,950 958,169 982,458 1,008,222 1,020,619 4,832,418
Operating Income (Loss) 316,179 232,474 215,338 195,712 180,982 1,140,684
Non-Operating Activity:
Interest Expense (250,043) (236,809) (222,615) (207,568) (191,615) (1,108,650)
Interest Income 4,738 4,670 11,585 13,787 25,483 60,263
Other Income - - - - - -
Other Expenses - - - - - -
Total Non-Operating Activity (245,305) (232,139) (211,030) (193,781) (166,132) (1,048,387)
Revenues Over (Under) Expenses 70,873 336 4,308 1,931 14,850 92,297
Interest Income - CEF - - - - - -
Change in Net Assets 70,873$ 336$ 4,308$ 1,931$ 14,850$ 92,297$
Fund Balances
Add:
Depreciation and Amortization 862,950 958,169 982,458 1,008,222 1,020,619 4,832,418
Capacity Fees - - - - - -
2009 COP Transfers / Woodside - - - - - -
Financing (Grants, SRF Loan, Other) - - - - - -
Deduct: - - - - - -
Capital Improvements & Equipment (904,400) (335,000) (447,500) (372,046) (258,887) (2,317,833)
Debt Principal (333,190) (346,700) (360,390) (374,291) (388,351) (1,802,922)
Financing (Grants, SRF Loan, Other) - - - - - -
Transfers between CEF and CRF - - - - - -
Cash Generated (Used) (303,767) 276,805 178,875 263,816 388,231 803,961
Beginning Fund Balance 1,101,784 798,017 1,074,822 1,253,697 1,517,513 1,101,784
Ending Fund Balance 798,017$ 1,074,822$ 1,253,697$ 1,517,513$ 1,905,745$ 1,905,745$

Salary & Employee Professional Materials & Admin. Billing Year 1Department Wages Benefits Services Supplies Expenses Utilities Credits Total Percent
Administration 515,333$ 334,361$ 196,255$ 65,733$ 166,066$ 130,188$ -$ 1,407,937$ 6.1%Finance 1,681,431 958,774 160,836 257,297 182,445 17,032 - 3,257,815 14.2%Human Resources 348,135 252,030 22,517 35,307 313,849 1,032 - 972,869 4.2%Engineering 1,702,217 870,604 73,396 82,116 49,685 8,240 (1,275,000) 1,511,258 6.6%Operations 6,442,680 4,072,919 235,220 3,087,664 268,320 503,238 (1,605,995) 13,004,046 56.6%Park 921,980 551,875 277,666 475,572 163,556 479,264 (30,000) 2,839,913 12.4%Total 11,611,776$ 7,040,563$ 965,890$ 4,003,689$ 1,143,921$ 1,138,994$ (2,910,995)$ 22,993,838$ 100.0%
Salary & Employee Professional Materials & Admin. Billing Year 1Division Wages Benefits Services Supplies Expenses Utilities Credits Total Percent
Retail Water 6,836,673$ 4,122,334$ 420,238$ 2,095,517$ 586,271$ 88,577$ (1,785,641)$ 12,363,969$ 53.8%Water Recycling 836,255 506,263 33,474 246,117 98,249 159,516 (233,361) 1,646,513 7.2%Sewer 2,952,924 1,820,612 230,826 1,184,392 292,110 405,127 (861,994) 6,023,998 26.2%Park 985,924 591,355 281,351 477,663 167,291 485,774 (30,000) 2,959,358 12.9%Total 11,611,776$ 7,040,563$ 965,890$ 4,003,689$ 1,143,921$ 1,138,994$ (2,910,995)$ 22,993,838$ 100.0%
PADRE DAM MUNICIPAL WATER DISTRICTDEPARTMENTAL ALLOCATIONS TO DIVISION BUDGETS
FY '13

Salary & Employee Professional Materials & Admin. Billing Year 2Department Wages Benefits Services Supplies Expenses Utilities Credits Total Percent
Administration 543,425$ 344,133$ 186,353$ 75,672$ 161,015$ 136,392$ -$ 1,446,990$ 6.1%Finance 1,678,875 961,522 147,486 307,815 178,420 17,263 - 3,291,379 13.9%Human Resources 344,733 206,108 34,032 42,375 332,083 1,682 - 961,013 4.0%Engineering 1,781,804 922,189 74,312 83,072 45,286 8,612 (1,313,250) 1,602,025 6.7%Operations 6,664,921 4,245,010 357,560 3,083,947 262,621 517,386 (1,654,175) 13,477,270 56.7%Park 965,091 585,665 267,922 503,352 167,780 497,556 (15,000) 2,972,367 12.5%Total 11,978,849$ 7,264,626$ 1,067,664$ 4,096,233$ 1,147,205$ 1,178,891$ (2,982,425)$ 23,751,045$ 100.0%
Salary & Employee Professional Materials & Admin. Billing Year 2Division Wages Benefits Services Supplies Expenses Utilities Credits Total Percent
Retail Water 7,043,434$ 4,244,349$ 488,792$ 2,133,385$ 585,516$ 91,459$ (1,839,210)$ 12,747,725$ 53.7%Water Recycling 861,545 521,247 38,935 250,564 98,122 164,707 (240,361) 1,694,759 7.1%Sewer 3,042,229 1,874,499 268,481 1,205,795 291,734 418,309 (887,854) 6,213,194 26.2%Park 1,031,641 624,531 271,456 506,489 171,832 504,417 (15,000) 3,095,366 13.0%Total 11,978,849$ 7,264,626$ 1,067,664$ 4,096,233$ 1,147,205$ 1,178,891$ (2,982,425)$ 23,751,045$ 100.0%
PADRE DAM MUNICIPAL WATER DISTRICTDEPARTMENTAL ALLOCATIONS TO DIVISION BUDGETS
FY '14

Salary & Employee Professional Materials & Admin. Billing Year 3Department Wages Benefits Services Supplies Expenses Utilities Credits Total Percent
Administration 565,514$ 358,624$ 197,185$ 64,312$ 178,746$ 142,923$ -$ 1,507,305$ 6.1%Finance 1,756,748 992,693 184,365 202,574 176,298 17,501 - 3,330,180 13.5%Human Resources 345,362 205,044 28,282 34,833 347,046 1,812 - 962,378 3.9%Engineering 1,863,523 947,483 77,052 80,727 55,417 9,020 (1,352,648) 1,680,574 6.8%Operations 6,879,516 4,348,013 446,867 3,304,115 271,846 530,926 (1,703,800) 14,077,483 57.1%Park 1,009,009 607,484 271,187 522,519 166,360 518,400 (20,000) 3,074,959 12.5%Total 12,419,673$ 7,459,341$ 1,204,939$ 4,209,080$ 1,195,712$ 1,220,582$ (3,076,448)$ 24,632,880$ 100.0%
Salary & Employee Professional Materials & Admin. Billing Year 3Division Wages Benefits Services Supplies Expenses Utilities Credits Total Percent
Retail Water 7,297,413$ 4,354,344$ 570,958$ 2,189,634$ 615,450$ 94,240$ (1,894,387)$ 13,227,653$ 53.7%Water Recycling 892,612 534,756 45,479 257,171 103,139 169,716 (247,572) 1,755,300 7.1%Sewer 3,151,929 1,923,078 313,613 1,237,587 306,649 431,030 (914,489) 6,449,397 26.2%Park 1,077,719 647,163 274,888 524,689 170,475 525,597 (20,000) 3,200,530 13.0%Total 12,419,673$ 7,459,341$ 1,204,939$ 4,209,080$ 1,195,712$ 1,220,582$ (3,076,448)$ 24,632,880$ 100.0%
PADRE DAM MUNICIPAL WATER DISTRICTDEPARTMENTAL ALLOCATIONS TO DIVISION BUDGETS
FY '15

Salary & Employee Professional Materials & Admin. Billing Year 4Department Wages Benefits Services Supplies Expenses Utilities Credits Total Percent
Administration 588,417$ 376,306$ 195,994$ 64,009$ 170,805$ 149,800$ -$ 1,545,331$ 6.1%Finance 1,835,566 1,050,155 153,248 207,370 190,068 17,747 - 3,454,154 13.6%Human Resources 360,545 217,069 25,464 35,549 364,033 1,812 - 1,004,473 3.9%Engineering 1,747,615 913,225 77,992 83,407 56,618 9,416 (1,330,000) 1,558,273 6.1%Operations 7,188,618 4,616,643 439,329 3,363,048 281,021 544,324 (1,754,914) 14,678,068 57.6%Park 1,095,725 655,752 247,042 548,709 170,320 539,848 (10,000) 3,247,396 12.7%Total 12,816,486$ 7,829,151$ 1,139,068$ 4,302,092$ 1,232,865$ 1,262,947$ (3,094,914)$ 25,487,696$ 100.0%
Salary & Employee Professional Materials & Admin. Billing Year 4Division Wages Benefits Services Supplies Expenses Utilities Credits Total Percent
Retail Water 7,494,908$ 4,558,505$ 545,224$ 2,229,553$ 635,446$ 97,029$ (1,912,030)$ 13,648,637$ 53.5%Water Recycling 916,769 559,829 43,430 261,859 106,490 174,739 (249,878) 1,813,237 7.1%Sewer 3,237,232 2,013,245 299,478 1,260,150 316,612 443,788 (923,006) 6,647,498 26.1%Park 1,167,577 697,572 250,936 550,531 174,318 547,390 (10,000) 3,378,324 13.3%Total 12,816,486$ 7,829,151$ 1,139,068$ 4,302,092$ 1,232,865$ 1,262,947$ (3,094,914)$ 25,487,696$ 100.0%
PADRE DAM MUNICIPAL WATER DISTRICTDEPARTMENTAL ALLOCATIONS TO DIVISION BUDGETS
FY '16

Salary & Employee Professional Materials & Admin. Billing Year 5Department Wages Benefits Services Supplies Expenses Utilities Credits Total Percent
Administration 612,299$ 404,705$ 228,616$ 68,349$ 185,727$ 157,040$ -$ 1,656,736$ 6.2%Finance 1,922,535 1,125,481 182,648 294,197 183,029 17,989 - 3,725,878 13.9%Human Resources 377,022 231,699 27,002 35,057 383,636 1,812 - 1,056,229 3.9%Engineering 1,832,660 981,423 81,464 84,747 58,136 9,800 (1,369,900) 1,678,331 6.3%Operations 7,517,837 4,950,988 456,737 3,397,301 269,566 557,009 (1,807,562) 15,341,876 57.2%Park 1,167,290 708,747 246,791 532,725 158,120 562,280 (10,000) 3,365,954 12.5%Total 13,429,644$ 8,403,043$ 1,223,258$ 4,412,375$ 1,238,214$ 1,305,930$ (3,187,462)$ 26,825,003$ 100.0%
Salary & Employee Professional Materials & Admin. Billing Year 5Division Wages Benefits Services Supplies Expenses Utilities Credits Total Percent
Retail Water 7,841,237$ 4,889,541$ 596,910$ 2,304,423$ 645,688$ 99,767$ (1,969,391)$ 14,408,174$ 53.7%Water Recycling 959,132 600,483 47,547 270,652 108,206 179,669 (257,374) 1,908,315 7.1%Sewer 3,386,819 2,159,445 327,868 1,302,466 321,715 456,308 (950,696) 7,003,925 26.1%Park 1,242,457 753,574 250,934 534,834 162,605 570,186 (10,000) 3,504,589 13.1%Total 13,429,644$ 8,403,043$ 1,223,258$ 4,412,375$ 1,238,214$ 1,305,930$ (3,187,462)$ 26,825,003$ 100.0%
PADRE DAM MUNICIPAL WATER DISTRICTDEPARTMENTAL ALLOCATIONS TO DIVISION BUDGETS
FY '17

Salary & Employee Professional Materials & Admin. Billing 5 YearDepartment Wages Benefits Services Supplies Expenses Utilities Credits Total Percent
Administration 2,824,989$ 1,818,130$ 1,004,403$ 338,075$ 862,359$ 716,343$ -$ 7,564,299$ 6.1%Finance 8,875,155 5,088,624 828,582 1,269,253 910,259 87,533 - 17,059,406 13.8%Human Resources 1,775,798 1,111,950 137,297 183,121 1,740,647 8,150 - 4,956,963 4.0%Engineering 8,927,820 4,634,924 384,216 414,069 265,142 45,088 (6,640,798) 8,030,460 6.5%Operations 34,693,572 22,233,573 1,935,713 16,236,076 1,353,374 2,652,882 (8,526,446) 70,578,744 57.1%Park 5,159,095 3,109,525 1,310,608 2,582,877 826,136 2,597,348 (85,000) 15,500,589 12.5%Total 62,256,429$ 37,996,725$ 5,600,819$ 21,023,471$ 5,957,917$ 6,107,344$ (15,252,244)$ 123,690,461$ 100.0%
Salary & Employee Professional Materials & Admin. Billing 5 YearDivision Wages Benefits Services Supplies Expenses Utilities Credits Total Percent
Retail Water 36,513,665$ 22,169,073$ 2,622,122$ 10,952,512$ 3,068,372$ 471,072$ (9,400,658)$ 66,396,158$ 53.7%Water Recycling 4,466,312 2,722,579 208,864 1,286,363 514,207 848,346 (1,228,547) 8,818,124 7.1%Sewer 15,771,134 9,790,878 1,440,267 6,190,390 1,528,819 2,154,563 (4,538,039) 32,338,011 26.1%Total Park 5,505,318 3,314,195 1,329,566 2,594,206 846,521 2,633,363 (85,000) 16,138,168 13.0%Total 62,256,429$ 37,996,725$ 5,600,819$ 21,023,471$ 5,957,917$ 6,107,344$ (15,252,244)$ 123,690,461$ 100.0%
PADRE DAM MUNICIPAL WATER DISTRICTDEPARTMENTAL ALLOCATIONS TO DIVISION BUDGETS
5 YEAR TOTAL

BUDGET BUDGET BUDGET BUDGET BUDGET 5-YEARADMINISTRATION YEAR 1 YEAR 2 YEAR 3 YEAR 4 YEAR 5 TOTALSSalary and Wages 515,333$ 543,425$ 565,514$ 588,417$ 612,299$ 2,824,989$ Employee Benefits 334,361 344,133 358,624 376,306 404,705 1,818,130 Professional Services 196,255 186,353 197,185 195,994 228,616 1,004,403 Materials and Supplies 65,733 75,672 64,312 64,009 68,349 338,075 Administrative Expenses 166,066 161,015 178,746 170,805 185,727 862,359 Utilities 130,188 136,392 142,923 149,800 157,040 716,343 Billing Credits - - - - - -
Total Expenditures 1,407,937$ 1,446,990$ 1,507,305$ 1,545,331$ 1,656,736$ 7,564,299$
FINANCE YEAR 1 YEAR 2 YEAR 3 YEAR 4 YEAR 5 TOTALSSalary and Wages 1,681,431$ 1,678,875$ 1,756,748$ 1,835,566$ 1,922,535$ 8,875,155$ Employee Benefits 958,774 961,522 992,693 1,050,155 1,125,481 5,088,624 Professional Services 160,836 147,486 184,365 153,248 182,648 828,582 Administrative Expenses 182,445 178,420 176,298 190,068 183,029 910,259 Utilities 17,032 17,263 17,501 17,747 17,989 87,533 Materials and Supplies 257,297 307,815 202,574 207,370 294,197 1,269,253 Billing Credits - - - - - -
Total Expenditures 3,257,815$ 3,291,379$ 3,330,180$ 3,454,154$ 3,725,878$ 17,059,406$
HUMAN RESOURCES YEAR 1 YEAR 2 YEAR 3 YEAR 4 YEAR 5 TOTALSSalary and Wages 348,135$ 344,733$ 345,362$ 360,545$ 377,022$ 1,775,798$ Employee Benefits 252,030 206,108 205,044 217,069 231,699 1,111,950 Professional Services 22,517 34,032 28,282 25,464 27,002 137,297 Materials and Supplies 35,307 42,375 34,833 35,549 35,057 183,121 Administrative Expenses 313,849 332,083 347,046 364,033 383,636 1,740,647 Utilities 1,032 1,682 1,812 1,812 1,812 8,150 Billing Credits - - - - - -
Total Expenditures 972,869$ 961,013$ 962,378$ 1,004,473$ 1,056,229$ 4,956,963$
ENGINEERING YEAR 1 YEAR 2 YEAR 3 YEAR 4 YEAR 5 TOTALSSalary and Wages 1,702,217$ 1,781,804$ 1,863,523$ 1,747,615$ 1,832,660$ 8,927,820$ Employee Benefits 870,604 922,189 947,483 913,225 981,423 4,634,924 Professional Services 73,396 74,312 77,052 77,992 81,464 384,216 Materials and Supplies 82,116 83,072 80,727 83,407 84,747 414,069 Administrative Expenses 49,685 45,286 55,417 56,618 58,136 265,142 Utilities 8,240 8,612 9,020 9,416 9,800 45,088 Billing Credits (1,275,000) (1,313,250) (1,352,648) (1,330,000) (1,369,900) (6,640,798)
Total Expenditures 1,511,258$ 1,602,025$ 1,680,574$ 1,558,273$ 1,678,331$ 8,030,460$
OPERATIONS YEAR 1 YEAR 2 YEAR 3 YEAR 4 YEAR 5 TOTALSSalary and Wages 6,442,680$ 6,664,921$ 6,879,516$ 7,188,618$ 7,517,837$ 34,693,572$ Employee Benefits 4,072,919 4,245,010 4,348,013 4,616,643 4,950,988 22,233,573 Professional Services 235,220 357,560 446,867 439,329 456,737 1,935,713 Materials and Supplies 3,087,664 3,083,947 3,304,115 3,363,048 3,397,301 16,236,076 Administrative Expenses 268,320 262,621 271,846 281,021 269,566 1,353,374 Utilities 503,238 517,386 530,926 544,324 557,009 2,652,882 Billing Credits (1,605,995) (1,654,175) (1,703,800) (1,754,914) (1,807,562) (8,526,446)
Total Expenditures 13,004,046$ 13,477,270$ 14,077,483$ 14,678,068$ 15,341,876$ 70,578,744$
PARK YEAR 1 YEAR 2 YEAR 3 YEAR 4 YEAR 5 TOTALSSalary and Wages 921,980$ 965,091$ 1,009,009$ 1,095,725$ 1,167,290$ 5,159,095$ Employee Benefits 551,875 585,665 607,484 655,752 708,747 3,109,525 Professional Services 277,666 267,922 271,187 247,042 246,791 1,310,608 Materials and Supplies 475,572 503,352 522,519 548,709 532,725 2,582,877 Administrative Expenses 163,556 167,780 166,360 170,320 158,120 826,136 Utilities 479,264 497,556 518,400 539,848 562,280 2,597,348 Billing Credits (30,000) (15,000) (20,000) (10,000) (10,000) (85,000)
Total Expenditures 2,839,913$ 2,972,367$ 3,074,959$ 3,247,396$ 3,365,954$ 15,500,589$
PADRE DAM MUNICIPAL WATER DISTRICTDEPARTMENTAL BUDGET SUMMARIES
FIVE YEAR PLAN

Padre Dam Municipal Water DistrictFive Year Business Plan and Budget
Organizational Staffing by DepartmentFY '13 - '17 with History
Prior Five Actual Budget Budget Budget Budget BudgetTITLE Year Plan Mar '12 FY '13 FY '14 FY '15 FY '16 FY '17
ADMINISTRATIONGENERAL MANAGER 1 1 1 1 1 1 1
ADMINISTRATIVE ASSISTANT (GM) (BOARD SECRETARY) 1 1.8 1.8 1.8 1.8 1.8 1.8
DIRECTOR OF COMMUNICATIONS 1 0 0 0 0 0 0
COMMUNICATIONS OFFICER/COORD (PUBLIC AFFAIRS ADMINISTRATOR) 1 1 1 1 1 1 1
TOTAL ADMINISTRATION 4 3.8 3.8 3.8 3.8 3.8 3.8
FINANCE DEPARTMENTDIRECTOR OF FINANCE 1 1 1 1 1 1 1
ACCOUNTING MANAGER 1 1 1 1 1 1 1
ACCOUNTANT 1 1 1 1 1 1 1
ACCOUNTING SPECIALIST 3 3 3 3 3 3 3
INFO SYSTEMS TECH SPECIALIST (SYSTEM ADMINISTRATOR) 1 2 2 2 2 2 2
INFO SYSTEMS TECH SPECIALIST 2 2 2 1 1 1 1
INFO SYSTEMS MANAGER 1 1 1 1 1 1 1
INFO SYSTEM TECH SPECIALIST (NETWORK SPECIALIST) 1 0 0 0 0 0 0
CUSTOMER SERVICE SUPERVISOR 1 1 1 1 1 1 1
CUSTOMER SERVICE REP 7 7 7 7 7 7 7
TOTAL FINANCE 19 19 19 18 18 18 18
ENGINEERING DEPARTMENTDIRECTOR OF ENGINEERING & PLANNING 1 1 1 1 1 1 1
ENGINEER MANAGER 2 2 2 2 2 1 1
ENGINEER STAFF ASSISTANT 1 1 1 1 1 1 1
ENGINEERING C/S TECH 1 0 0 0 0 0 0
ENGINEER 3 3 3 3 3 3 3
ENGINEER TECH 7 3 3 3 3 3 3
FIELD ENG SUPERVISOR 2 0 0 0 0 0 0
GIS/MAPPING ADMINISTRATOR 1 1 1 1 1 1 1
GIS/MAPPING SPECIALIST 3 1 1 1 1 1 1
RIGHT OF WAY AGENT-ENVIRONMENTAL 1 1 1 1 1 1 1
CATHODIC PROTECTION PROGRAM COORDINATOR 1 0 0 0 0 0 0
CONSTRUCTION INSPECTOR 1 2 2 2 2 2 2
ADMINISTRATIVE ASSISTANT 3 0 0 0 0 0 0
TOTAL ENGINEERING 27 15 15 15 15 14 14
OPERATIONS DEPARTMENTDIRECTOR OF OPS & WATER QUALITY 1 1 1 1 1 1 1
ADMINISTRATIVE ASSISTANT 2 1.2 1.2 1.2 1.2 1.2 1.2
DISTRIBUTION MAINTENANCE SUPERVISOR 1 1 1 1 1 1 1
CONSTRUCTION & MAINT. SUPERVISOR 4 4 4 4 4 4 4
UTILITY WORKER 21 14 14 14 14 14 14
EQUIPMENT MECHANIC 2 2 2 2 2 2 2
ASSISTANT OPS MANAGER 1 2 2 2 2 2 2
OERATIONS MANAGER 1 1 1 1 1 1 1
SYSTEMS OPERATOR TECHNICIAN 11 8 8 8 8 8 8
ELECTRICAL/INSTR CONTROL TECH 3 2 2 2 2 2 2
ELECTRICAL/INSTR CONTROL SPVSR 1 1 1 1 1 1 1
PLANT MANAGER 1 1 1 1 1 1 1
LAB ANALYST-SENIOR 1 1 1 1 1 1 1
LAB ANALYST 2 2 2 2 2 2 2
RECYCLED WATER PLANT SUPV 1 1 1 1 1 1 1
RECYCLED WATER PLANT OPERATOR 5 4 4 4 4 4 4
RECYCLED WATER TECHNICIAN 1 1 1 1 1 1 1
WATER QUALITY / COMPLIANCE SPECIALIST 2 2 2 2 2 2 2
CONSTRUCTION EQUIPMENT OPERATOR 9 7 7 7 6 6 6
WASTEWATER COLLECTION SYSTEMS WORKER 0 5 5 6 6 6 6
SCADA TECH 0 2 2 2 2 2 2
INDUSTRIAL CODE COMPLIANCE SPECIALIST 0 1 1 0 0 0 0
CATHODIC PROTECTECTION PG COORD 0 1 1 1 1 1 1
FACILITIES MAINTENANCE CREW SUPERVISOR 1 1 1 1 1 1 1
FACILITIES MAINTENANCE WORKER 5 2 2 2 2 2 2
CUSTODIAN (Contracted out since 3/12, eliminate position in FY '14) 0 1 1 0 0 0 0
METER SHOP SUPERVISOR 1 1 1 1 1 1 1
METER TECH 7 4 4 4 4 4 4
ENGINEERING TECH (AMR) 0 1 1 1 1 1 1
WAREHOUSE SPECIALIST 1 1 1 1 1 1 1
WAREHOUSE WORKER 1 1 0 0 0 0 0
TOTAL OPERATIONS 86 77.2 76.2 75.2 74.2 74.2 74.2
FIVE YEAR PLAN

Padre Dam Municipal Water DistrictFive Year Business Plan and Budget
Organizational Staffing by DepartmentFY '13 - '17 with History
Prior Five Actual Budget Budget Budget Budget BudgetTITLE Year Plan Mar '12 FY '13 FY '14 FY '15 FY '16 FY '17
FIVE YEAR PLAN
HUMAN RESOURCES DEPARTMENTDIRECTOR OF HUMAN RESOURCES 1 1 1 1 1 1 1
HUMAN RESOURCES SPECIALIST 1 1 1 1 1 1 1
SAFETY & RISK MANAGER 1 1 1 1 1 1 1
TOTAL HUMAN RESOURCES 3 3 3 3 3 3 3
PARK & CAMPGROUNDSDIRECTOR OF PARK & RECREATION 1 1 1 1 1 1 1
PARK & RECREATION SUPERVISOR 2 2 2 2 2 2 2
PARK & RECREATION COORINATOR 8 8 8 8 8 8.75 9
TOTAL PARK & CAMPGROUNDS 11 11 11 11 11 11.75 12
TOTAL DISTRICT APPROVED REGULAR EMPLOYEES 150.0 129.0 128.0 126.0 125.0 124.75 125.0
TEMPORARY & PART-TIME POSITIONS ENGINEERING TECH INTERN 1.0 0.0 0.0 0.0 0.0 0.0 0.0
OPERATIONS UTILITY WORKER - OPERATIONS 2.0 1.0 1.0 1.0 1.0 1.0 1.0
PARK REC AIDE 4.5 0.8 1.2 1.2 1.2 1.2 1.2
CUSTOMER SERVICE REP 0.0 1.0 1.0 1.0 1.0 1.0 1.0
PARK SUPPORT STAFF 0.4 2.9 3.4 3.4 3.4 3.4 3.4
COMMUNICATIONS STAFF SUPPORT 0.5 0.0 0.0 0.0 0.0 0.0 0.08.4 5.7 6.6 6.6 6.6 6.6 6.6
TOTAL STAFFING 158.4 134.7 134.6 132.6 131.6 131.4 131.6TOTAL STAFFING EXCLUDING PARK 142.5 120.0 119.0 117.0 116.0 115.0 115.0
REDUCTIONS (EXCLUDING PARK) 22.50 1.00 2.00 1.00 1.00 0.00CUMULATIVE REDUCTION (EXCLUDING PARK) 1.00 3.00 4.00 5.00 5.00
BOARD OF DIRECTORS 5 5 5 5 5 5 5
VOLUNTEER POSITIONS PARK 7.5 7.5 7.5 7.5 7.5 7.5 7.5
120
125
130
135
140
145
150
155
160
Staffing FY '13 - '17 with History

FIVE YEAR BUSINESS PLAN CAPITAL EQUIPMENT BUDGET
FY '13 - FY '17
Capital Equipment Life in Budget Budget Budget Budget Budget BudgetDescription Years Department CC Year 1 Year 2 Year 3 Year 4 Year 5 TOTAL
CSC Color Copier/Printer 5 ADMIN 69 17,000 - 17,000$ Replacement LCD for Backlit Projector 5 ADMIN 69 5,000 5,000 Board room streaming audio/video 5 ADMIN 69 - 15,000 15,000 2003 Ford F350 Supercab Truck 5 ENGINEERING 47 65,657 65,657 2003 Ford Explorer 5 ENGINEERING 34 30,303 30,303 2003 Ford Explorer 5 ENGINEERING 37 30,303 30,303 Copier 5 FINANCE 11 - - - - 15,000 15,000 Imaging System (desktop scanners) 5 FINANCE 11 20,000 - - - - 20,000 Printers 5 FINANCE 11 20,000 - - - - 20,000 Data backup and recovery improvement 5 FINANCE 16 - - 40,000 - - 40,000 Storage Area Network (SAN) expansion ($15k-$50K) 5 FINANCE 16 50,000 - - - - 50,000 VMware Host replacements 5 FINANCE 16 - - - - 31,000 31,000 Phone system $400-$1000 per user 5 FINANCE 16 - 110,000 - - - 110,000 Backup Tape Library/loader 5 FINANCE 16 - 11,000 - 11,000 Computer equipment 5 FINANCE 16 40,000 42,500 42,500 42,500 42,500 210,000 HUMA alert software upgrades for CS 5 FINANCE 12 - 25,000 - - - 25,000 Repeater hydrant caps 10 OPS 13 20,000 20,000 Construct Meter Retro 10 OPS 13 10,000 10,000 Metal Lathe (new building) 5 OPS 47 9,500 - - - - 9,500 Ball Valve Replacement - P4-PS 3 10 OPS 47 14,000 - - - - 14,000 A/C Units 5 OPS 51 5,000 5,000 - 5,000 15,000 Pumps 5 OPS 51 30,500 27,000 35,000 27,000 143,000 262,500 Filter Sand 5 OPS 51 35,000 35,000 35,000 35,000 140,000 Meters and Analyzers 5 OPS 51 26,000 25,000 11,000 12,000 6,000 80,000 Valves & Equipment 5 OPS 51 10,000 5,000 10,000 5,000 30,000 Rag removal belt and motor 5 OPS 51 - 5,000 5,000 Chlorine Scrubber rehab 5 OPS 51 - 28,000 28,000 Mixers 5 OPS 51 5,000 10,000 5,000 5,000 13,500 38,500 SCADA System 5 OPS 51 44,500 8,400 8,400 51,500 24,500 137,300 Motors & Equipment 5 OPS 51 5,500 35,000 13,000 15,000 21,500 90,000 Plate settlers 5 OPS 51 25,000 25,000 Solar panel upgrade(flow to lake # 7) 5 OPS 51 8,500 8,500 Auto sampler 5 OPS 52 12,000 12,000 Casework-Lab Cabinet 5 OPS 52 25,000 25,000 Painting the Laboratory 5 OPS 52 25,000 25,000 Lab Flooring 5 OPS 52 25,000 25,000 Atomic Adsorption (metals) 5 OPS 52 60,000 60,000 UV/VIS Spectrophotometer 5 OPS 52 15,000 15,000 Auto Analyzer 5 OPS 52 50,000 50,000 Gas Chromatograph 5 OPS 52 150,000 150,000 Autoclave 5 OPS 52 12,000 12,000 JD Gator 5 OPS 61 - 18,000 18,000 Laptop Computers (add to duty trucks) 5 OPS 71 11,000 - - - 11,000 Backhoe John Deere 5 OPS 71 - 95,000 - - 95,000 Backhoe John Deere 5 OPS 73 95,000 - - - 95,000 Autosampler 5 OPS 73 11,000 - - - - 11,000 Light Tower 5 OPS 73 9,000 9,000 18,000 Arrow Board 5 OPS 73 5,000 5,000 10,000 Emission Control Systems 5 OPS 71/73 90,000 40,000 40,000 170,000 Tremac pnuematic breaker 5 OPS 15,000 15,000 2000 L7501 Vactor Sewer Cleaning Truck 5 OPS 71 400,000 400,000 2003 Ford Explorer 5 OPS 37 30,808 30,808 1999 Ford F-150 Pickup 5 OPS 73 30,000 30,000 2000 Ford Ranger XLT supercab 4x2 5 OPS 73 30,000 30,000 2006 Ford Explorer 5 OPS 45 30,303 30,303 2008 DODGE DAKOTA (Lease - not disposed) 5 OPS 61 25,253 25,253 2001 Ford F250 Truck 5 OPS 43 44,444 44,444 2002 Ford F250 Truck 5 OPS 51 35,354 35,354 2003 Ford F-250 Truck 5 OPS 61 37,374 37,374 2003 Ford F-350 Truck 5 OPS 73 44,444 44,444 2004 Ford F250 Super Cab 5 OPS 47 44,444 44,444 2004 Ford F-150 supercab 5 OPS 79 31,313 31,313 2008 Ford Explorer Sporttrack 5 OPS 41 31,313 31,313 2008 Ford F-350 Duty Truck 5 OPS 73 50,000 50,000 1999 Ford F-150 Pickup 5 OPS 43 32,828 32,828 2004 Ford F-150 supercab 5 OPS 13 33,333 33,333 2004 Ford Explorer 5 OPS 79 30,808 30,808 2004 Ford Explorer 5 OPS 79 30,808 30,808 2004 Ford F-150 supercab 5 OPS 79 31,313 31,313 2003 Vactor 2110 Jet Rodder 5 OPS 71 420,000 420,000 1999 Ford Windstar Van 5 OPS 69 30,303 30,303 2000 Ford Taurus LX 4-Door Sedan 5 OPS 69 20,202 20,202 2004 Ford F-350 Super Duty 5 OPS 45 50,000 50,000 2006 Ford F-150 5 OPS 49 31,818 31,818 2006 Ford F-350 5 OPS 45 37,374 37,374 2010 Ford F-350 Duty Truck 5 OPS 73 50,000 50,000 2007 DODGE DAKOTA 5 OPS 13 26,263 26,263 2007 DODGE DAKOTA 5 OPS 13 25,758 25,758 2007 Ford F-350 5 OPS 61 35,859 35,859 2010 Ford F-350 5 OPS 47 70,707 70,707 1999 Ford F-550 Dumptruck 5 OPS 73 50,505 50,505 2001 Ford F650 Utility Truck 5 OPS 73 126,263 126,263

FIVE YEAR BUSINESS PLAN CAPITAL EQUIPMENT BUDGET
FY '13 - FY '17
Capital Equipment Life in Budget Budget Budget Budget Budget BudgetDescription Years Department CC Year 1 Year 2 Year 3 Year 4 Year 5 TOTAL
Ingersoll- Rand Air Compressor 5 OPS 18,000 - 18,000 Ingersoll- Rand Air Compressor (B-9) 5 OPS 18,000 - 18,000 Ingersoll Rand Air Compressor 5 OPS 18,000 - 18,000 Cat Forklift 5 OPS 60,000 - 60,000 Pump Control Valves PS 1, 3, 4, 5 50 OPS 47 9,200 13,000 19,000 32,000 73,200 Computer Server 5 PARK 62 10,000 7,500 - 7,500 - 25,000 Gator Maintenance Vehicle 5 PARK 62 - - 10,000 - - 10,000 Maintenance Yard Car Port 15 PARK 62 - - - - 10,000 10,000 Peddle Boats 5 PARK 62 10,000 10,000 10,000 10,000 10,000 50,000 Pontoon Boat 5 PARK 62 - - 20,000 - - 20,000 Tractor (John Deer) 5 PARK 62 - - - 35,000 - 35,000 WiFi Systems 5 PARK 62 7,500 7,500 7,500 7,500 7,500 37,500 AC -Park Buildings 5 PARK 62 - 20,000 20,000 40,000 Dock Lake 1 15 PARK 62 20,000 - 15,000 35,000 Trash Receptacle Lids 5 PARK 62 - 10,000 - - - 10,000 Storage Unit\Container 15 PARK 62 10,000 10,000 10,000 30,000 Radio System Upgrade 5 PARK 62 6,500 6,500 Golf Cart Replacement 5 PARK 62 7,500 7,500 5,000 5,000 5,000 30,000 Copiers 5 PARK 62 10,000 10,000 20,000 Generator Installation 15 PARK 62 75,000 75,000 Cabins AC Units 5 PARK 67 7,500 7,500 5,000 5,000 5,000 30,000 2002 Ford F150 Truck 5 PARK 62 30,000 30,000 2003 Ford F-150 Truck 5 PARK 62 30,000 30,000 1992 Dodge Caravan 5 PARK 62 20,000 20,000 2003 Ford Explorer 5 PARK 62 30,000 30,000
TOTAL 1,451,220$ 1,109,193$ 760,991$ 1,132,697$ 731,853$ 5,185,953$
TOTAL BY DEPARTMENTOPERATIONS 1,019,564$ 765,087$ 560,991$ 995,197$ 575,853$ 3,916,691$ ENGINEERING 65,657 60,606 - - - 126,263 PARK 214,000 80,000 117,500 95,000 67,500 574,000 FINANCE 130,000 188,500 82,500 42,500 88,500 532,000 ADMIN 22,000 15,000 - - - 37,000 TOTAL 1,451,220$ 1,109,193$ 760,991$ 1,132,697$ 731,853$ 5,185,953$
TOTAL BY OPERATIONRETAIL WATER 312,466$ 463,447$ 156,700$ 188,716$ 241,150$ 1,362,478$ SEWER 539,996 107,944 160,120 448,589 43,992 1,300,641 WATER RECYCLING 384,757 457,802 326,671 400,392 379,211 1,948,834 PARK 214,000 80,000 117,500 95,000 67,500 574,000 TOTAL 1,451,220$ 1,109,193$ 760,991$ 1,132,697$ 731,853$ 5,185,953$

12/13 13/14 14/15 15/16 16/17 5 YEARS
EXPENDITURESProject CostsCapitalized Operations 1,363$ 1,094$ 1,103$ 1,167$ 1,308$ 6,036$ Mandated by External Agencies 910$ 1,498$ 1,051$ 948$ 808$ 5,215$ CIP General 4,970$ 4,805$ 3,766$ 5,928$ 7,482$ 26,951$ Debt/External Financing Req'd 10,098$ 14,237$ 4,349$ 150$ 155$ 28,990$ Developer Driven 128$ 479$ 176$ ‐$ ‐$ 783$
Subtotal Project Costs 17,469$ 22,113$ 10,445$ 8,193$ 9,755$ 67,975$
Debt Service 878$ 917$ 921$ 912$ 908$ 4,537$
TOTAL EXPENDITURES 18,347$ 23,031$ 11,366$ 9,106$ 10,663$ 72,512$
FUNDING SOURCESCapital Replacement FundWater 4,477$ 4,461$ 5,548$ 6,886$ 9,394$ 30,766$ Sewer 2,114$ 2,476$ 1,919$ 1,161$ 672$ 8,342$ Recycled 698$ 605$ 250$ 209$ 67$ 1,829$
Subtotal CRF 7,289$ 7,542$ 7,717$ 8,256$ 10,133$ 40,938$
Capital Expansion Fund Water 1,273$ 2,134$ 1,699$ 519$ 258$ 5,884$ Sewer 356$ 553$ 351$ 215$ 171$ 1,646$ Recycled 314$ 169$ 63$ 10$ 4$ 561$
Subtotal CEF 1,944$ 2,856$ 2,114$ 745$ 433$ 8,091$
Grants and External FinancingCOP 6,775$ 9,673$ 1,454$ ‐$ ‐$ 17,902$ Grants, Sale of Woodside, Misc 2,335$ 2,945$ 80$ 83$ 85$ 5,528$ Park Participation 4$ ‐$ ‐$ 22$ 11$ 38$ Other ‐$ 15$ ‐$ ‐$ ‐$ 15$
Subtotal Other Funding 9,115$ 12,633$ 1,534$ 105$ 97$ 23,483$
TOTAL FUNDING 18,347$ 23,030$ 11,366$ 9,106$ 10,663$ 72,511$
COP REMAININGAnticipated start 12/13 17,902$ Anticipated end of year 11,127$ 1,454$
Notes:1) Unless otherwise noted, costs include an inflation factor of 3.3% per year beginning FY 13/14.2) 12/13 Costs are present value based on January 2012 ENR LA CCI of 10,092.3) Amounts are rounded which may affect footing.
PROPOSED CIP BUDGET 12/13 ‐ 16/17SUMMARY OF EXPENDITURES AND FUNDING SOURCES (THOUSANDS)
page 1 of 1

PROPOSED CIP BUDGET 12/13 THRU 16/17 PROJECT EXPENDITURES (THOUSANDS)
NOTES: 1) Unless otherwise noted, costs include an inflation factor of 3.3% per year beginning FY 13/14.2) 12/13 Costs are present value based on January 2012 ENR LA CCI of 10,092.3) SRF Loan assumes 3% interest for 20 year term.4) Amounts are rounded which may affect footing.
Project Name Job No.Estimated
CompletionEst. Cost to Date
6/30/12 12/13 13/14 14/15 15/16 16/17 FutureTotal Cost
(Incl. Inflation)
Capitalized OperationsOps - Annual Raise Air Vacs (ESA) 202033 2016 325$ 25$ 26$ 27$ 28$ -$ -$ 430$ Ops - Annual Raise Air Vacs (WSA) 98048 Annual 5$ 19$ 20$ 20$ 21$ 22$ 250$ 357$ Ops - Annual Sewer Rehab Annual -$ 30$ 31$ 32$ 33$ 68$ 497$ 691$ Ops - Blowoff Installation 208015 Annual 273$ 50$ 52$ 53$ 83$ 85$ 207$ 803$ Ops - ESA Poly Service Replacement 202032 Annual 55$ 45$ 46$ 48$ 50$ 68$ 799$ 1,112$ Ops - SCADA Network/Comm Upgrades 208009 2013 110$ 165$ -$ -$ -$ -$ -$ 275$ Ops - SCADA Software Upgrades (Ops) 208003 2013 1,190$ 229$ -$ -$ -$ -$ -$ 1,419$ Ops - Security System Upgrades Ph 2 205002 2017 318$ 50$ 52$ 53$ 55$ 57$ 314$ 900$ Ops - Sewer Manhole Rehabilitation 201004 Annual 10$ 50$ 52$ 53$ 55$ 85$ 984$ 1,290$ Ops - Site Paving As Needed Annual -$ 50$ 52$ 53$ 55$ 85$ 571$ 867$ Ops - Valve Replacement Program (ESA) 202034 Annual 100$ 100$ 129$ 133$ 138$ 165$ 1,387$ 2,152$ Ops - Valve Replacement Program (WSA) 99017 Annual 432$ 400$ 413$ 427$ 441$ 455$ 4,754$ 7,322$ Ops - Vault Lid Replacement 211023 2013 25$ 25$ 26$ -$ -$ -$ -$ 76$ Ops - WSA Poly Service Replacement 202008 Annual 167$ 75$ 52$ 53$ 55$ 57$ 2,583$ 3,042$ WRF Treatment Equipment Repl Program 207006 Annual 59$ 50$ 145$ 149$ 154$ 159$ 808$ 1,524$
Subtotal 3,068$ 1,363$ 1,094$ 1,103$ 1,167$ 1,308$ 13,154$ 22,258$
Mandated by External AgenciesCity of Santee Atlas View Sidewalks Service Reloc. 2013 -$ 25$ -$ -$ -$ -$ -$ 25$ City of Santee Bridge Retrofits Util. Reloc. 2014 -$ 50$ 52$ -$ -$ -$ -$ 102$ City of Santee Buena Vista/Railroad Impr. 2013 -$ 25$ -$ -$ -$ -$ -$ 25$ City of Santee Carlton Oaks Bridge Retrofit 2014 -$ 75$ 77$ -$ -$ -$ -$ 152$ City of Santee Cottonwood Ave Util. Reloc 2014 -$ -$ 26$ -$ -$ -$ -$ 26$ City of Santee Cuyamaca/Miss Gorge Rt Turn Lanes Not budgeted -$ -$ -$ -$ -$ -$ -$ -$ City of Santee Magnolia Widening Util. Reloc. 2015 -$ -$ -$ 27$ -$ -$ -$ 27$ City of Santee Magnolia/Palm Glen Util. Reloc. Not budgeted -$ -$ -$ -$ -$ -$ -$ -$ City of Santee Mission Gorge Drainage Conflicts 2015 -$ -$ -$ 107$ -$ -$ -$ 107$ City of Santee Mission Gorge Median Util. Reloc. 2013 -$ 25$ -$ -$ -$ -$ -$ 25$ City of Santee Olive Lane Util. Reloc. 2014 -$ -$ 26$ -$ -$ -$ -$ 26$ City of Santee Pavement Repair Util. Reloc. 2015 -$ 50$ 52$ 53$ -$ -$ -$ 155$ City of Santee Prospect Ave East Util. Reloc. 211003 2014 -$ 250$ 258$ -$ -$ -$ -$ 508$ City of Santee Prospect Ave Sidewalks W. Util. Reloc. 2016 -$ -$ 103$ 107$ 55$ -$ -$ 265$ City of Santee Prospect Ave West Util. Reloc. 2015 -$ -$ 258$ 267$ -$ -$ -$ 525$ City of Santee Riverwalk/Park Center Dr 2012 25$ -$ -$ -$ -$ -$ -$ 25$ City of Santee Storm Drain Conflicts 2016 -$ 75$ 77$ 80$ 55$ -$ -$ 288$ City of Santee Woodside/Shadow Hill Util Reloc. Not budgeted -$ -$ -$ -$ -$ -$ -$ -$ County Alpine Blvd Service Relocations 2014 -$ -$ 207$ -$ -$ -$ -$ 207$
page 1 of 5

PROPOSED CIP BUDGET 12/13 THRU 16/17 PROJECT EXPENDITURES (THOUSANDS)
Project Name Job No.Estimated
CompletionEst. Cost to Date
6/30/12 12/13 13/14 14/15 15/16 16/17 FutureTotal Cost
(Incl. Inflation)
County Wing Avenue Sewer Relocation 2013 -$ 220$ -$ -$ -$ -$ -$ 220$ Forester Creek Utility Relocation Participation 200006 2012 1,179$ -$ -$ -$ -$ -$ -$ 1,179$ Lakeside Interceptor Replacement Participation 206007 Annual 1,242$ 15$ 207$ 213$ 220$ 228$ 1,495$ 3,620$ Stage 2 DBPR System Improvements 206028 2022 33$ -$ -$ -$ -$ -$ 74$ 107$ Undefined External Mandates Annual -$ -$ -$ -$ 551$ 569$ 3,141$ 4,262$ Urban Water Management Plan 2015 2016 -$ -$ -$ 53$ 55$ -$ -$ 108$ WDR Sewer System Management Plan Update 2014 -$ 25$ 77$ -$ -$ -$ -$ 102$ WRF NPDES Permit Annual Updates Annual -$ 10$ 10$ 11$ 11$ 11$ 63$ 116$ WRF NPDES Permit Renewal 2014 2015 -$ 65$ 67$ 133$ -$ -$ -$ 266$
Subtotal 2,479$ 910$ 1,498$ 1,051$ 948$ 808$ 4,773$ 12,467$
CIP General5 Res Retrofit Ph 4 - Blossom Valley 208027 2017 132$ -$ -$ -$ 3,307$ 5,693$ -$ 9,132$ 5 Res Retrofit Ph 4 - Blossom Valley Permitting 2015 -$ -$ -$ 80$ -$ -$ -$ 80$ Annual Post-Project Engineering Annual -$ 10$ 5$ 5$ 6$ 6$ 31$ 63$ Annual Sewer Assessment/Repl/Rehab Annual -$ 300$ 258$ 213$ 110$ 57$ 628$ 1,567$ Asset Management System/CMMS 2050000 2017 -$ -$ -$ -$ 551$ 285$ -$ 836$ Blossom Valley Res Drainage & Site Impr. 2016 -$ 60$ -$ -$ 165$ -$ -$ 225$ Braverman Sewer Cured in Place Repairs Ph 2 2013 -$ 250$ -$ -$ -$ -$ -$ 250$ Capacity Fee Update 2014 2016 -$ -$ -$ 110$ 114$ -$ -$ 223$ Carlton Hills Diversion Structure Upgrade 2120000 2015 -$ 75$ -$ 534$ -$ -$ -$ 609$ CSC Elec Reliability & Consolidation 209004 2013 39$ 110$ -$ -$ -$ -$ -$ 149$ CSC Ph 2 - Verizon Relocation 2013 -$ 30$ -$ -$ -$ -$ -$ 30$ Emerg Generators Startup, Testing, and Permitting 2013 -$ 50$ -$ -$ -$ -$ -$ 50$ Emergency Interconn Trailer Mounted Pumps 2016 -$ -$ 21$ 213$ 52$ -$ -$ 286$ Eng System Data Updates (Annual) 211015 Annual 5$ 5$ 5$ 5$ 6$ 6$ 31$ 63$ ESA Sec. Supply Conn Legal Costs 203032 2013 1,156$ 75$ -$ -$ -$ -$ -$ 1,231$ Facility Condition Assessment Sewer 2015 -$ 15$ 15$ 16$ -$ -$ -$ 47$ Facility Condition Assessment Water 2015 -$ 35$ 36$ 37$ -$ -$ -$ 109$ Financial Computer Syst Upgrade 2014 1,000$ 1,500$ 1,550$ -$ -$ -$ -$ 4,050$ GIS Projects 209016 425$ 150$ 77$ 53$ 55$ -$ -$ 761$ I-8 Crossing - Labrador Lane 2016 -$ -$ 129$ 373$ 66$ -$ -$ 569$ I-8 Crossing - Viewside Lane 8" Replacement 207024 2013 -$ 50$ -$ -$ -$ -$ -$ 50$ IFP & Program EIR 2014 -$ 100$ 413$ -$ -$ -$ -$ 513$ IFP Annual Updates 2013-2022 Annual -$ 45$ 62$ 48$ 66$ 51$ 331$ 603$ IPS Chopper Pumps 209013 2014 106$ 50$ 52$ -$ -$ -$ -$ 208$ JWA NCCP Subarea Plan (PD + Otay share) 98046 2013 809$ 50$ -$ -$ -$ -$ -$ 859$ JWA NCCP Subarea Plan (Ph 2) 2090000 2020 -$ -$ 72$ 75$ 77$ 63$ 197$ 484$ Magnolia Ave South Relief Sewer - Segment 1 204030 2016 39$ 75$ -$ 320$ 55$ -$ -$ 489$ METRO Sewer Billing 210008 2014 200$ 30$ 15$ -$ -$ -$ -$ 246$ Mission Gorge Rd 36" Valves 2100000 2017 -$ -$ -$ -$ -$ 399$ -$ 399$ Northcote Pump Station Upgrade 2130000 2019 -$ -$ -$ -$ -$ 38$ 224$ 262$ Pipe Evaluations - Bridge Crossings 2014 -$ 50$ 103$ -$ -$ -$ -$ 153$ Reservoir Refurbishing Ph 5 210017 2017 7$ -$ -$ 320$ 110$ 114$ 96$ 648$ Rios Canyon PS Suction Rplc 211014 2014 150$ 650$ 258$ -$ -$ -$ -$ 1,058$ Santee Basin Aquifer Study & Env. (PD Share) 210020 2015 207$ 200$ 52$ 53$ -$ -$ -$ 512$
page 2 of 5

PROPOSED CIP BUDGET 12/13 THRU 16/17 PROJECT EXPENDITURES (THOUSANDS)
Project Name Job No.Estimated
CompletionEst. Cost to Date
6/30/12 12/13 13/14 14/15 15/16 16/17 FutureTotal Cost
(Incl. Inflation)
Sewer Flow Studies 5 Year Updates 2015 -$ -$ -$ 107$ -$ -$ 126$ 232$ Sewer Rehab Fanita Parkway 2015 -$ -$ 103$ 107$ -$ -$ -$ 210$ Sewer Trans-River Interceptor (Siphon) Assessment 2014 -$ 30$ 103$ -$ -$ -$ -$ 133$ Solar Energy Feasibility Study (CSC & WRF) 2014 -$ -$ 15$ -$ -$ -$ -$ 15$ Solar Power - Res/Ops/WRF Sites 211012 2022 35$ -$ 15$ 16$ 17$ 17$ 94$ 195$ Steel Pipe Condition Assessment 2022 -$ 150$ 155$ 213$ 220$ 228$ 1,256$ 2,223$ Steel Pipe Replacement Future -$ -$ -$ 320$ 386$ 455$ 3,141$ 4,303$ Sunrise Reservoir Verizon Relocation 2013 -$ 50$ -$ -$ -$ -$ -$ 50$ Sycamore Creek Flood Wall 2015 -$ -$ 258$ 267$ -$ -$ -$ 525$ Sycamore Creek Hydrology Study 2013 5$ 125$ -$ -$ -$ -$ -$ 130$ Walmart Sewer Diversion Structure 211022 2014 100$ 150$ 517$ -$ -$ -$ -$ 767$ Water Pump Replacement Program (2011-2015) 2015 -$ -$ 146$ 150$ -$ -$ -$ 296$ Willowgrove Sewer, Phase 2 Assessment 209006 2016 40$ 30$ 31$ 32$ 165$ -$ -$ 299$ WRF & Pond Valve Replacements 2090000 2016 -$ -$ 57$ 86$ 331$ -$ -$ 473$ WRF Aeration Panels 2110000 2017 -$ -$ -$ -$ 69$ 72$ -$ 141$ WRF Chlorine Trolley (CIP portion) 211025 2014 -$ 350$ 77$ -$ -$ -$ -$ 427$ WRF Demo Project RFP 2013 -$ 45$ -$ -$ -$ -$ -$ 45$ WRF Fence Replacement 2014 -$ -$ 103$ -$ -$ -$ -$ 103$ WRF Paving & Entry Gate 212002 2013 150$ 60$ -$ -$ -$ -$ -$ 210$ WRF SO2-Wet Scrubber 2060000 2015 -$ 15$ 99$ 11$ -$ -$ -$ 125$
Subtotal 4,606$ 4,970$ 4,805$ 3,766$ 5,928$ 7,482$ 6,157$ 37,714$
Debt & External Financing Required5 Res Retrofit Ph 3 - West Victoria 208026 2013 4,540$ 1,100$ -$ -$ -$ -$ -$ 5,640$ CSC Ph 2 - OPS 205014 2014 914$ 1,773$ 2,963$ -$ -$ -$ -$ 5,650$ El Monte GW / WRF Expansion Feasibility Study 205051 2012 338$ -$ -$ -$ -$ -$ -$ 338$ Emergency Generator - Flinn Springs PS 209014 2013 248$ 800$ -$ -$ -$ -$ -$ 1,048$ Emergency Generator - Rios Canyon PS 209019 2013 229$ 500$ -$ -$ -$ -$ -$ 729$ ESA Sec. Supply Conn (incl Los Coches PS) 203032 2013 10,021$ 50$ -$ -$ -$ -$ -$ 10,071$ ESA Sec. Supply Conn Alt Site 2015 15$ 3,000$ 9,673$ 4,268$ -$ -$ -$ 16,956$ ESA Sec. Supply Conn Land Acquisition (2011) 211009 2013 152$ 625$ -$ -$ -$ -$ -$ 777$ ESA Sec. Supply Conn Mitigation & Monitoring 210001 2020 1$ 250$ 1$ 1$ 68$ 70$ 97$ 486$ Ops Security Gates (funded by Cell Phone Revenues) 2019 -$ -$ -$ 80$ 83$ 85$ 137$ 385$ Sunrise Reservoir Retaining Wall / Site Impr. 210026 2013 110$ 450$ -$ -$ -$ -$ -$ 560$ WRF Demo Project 2014 -$ 1,500$ 1,550$ -$ -$ -$ -$ 3,050$ WRF Studies 210014 2014 634$ 50$ 52$ -$ -$ -$ -$ 736$
Subtotal 17,203$ 10,098$ 14,237$ 4,349$ 150$ 155$ 234$ 46,427$
Developer DrivenAlpine High School D/P 209021 2013 14$ 93$ -$ -$ -$ -$ -$ 107$ Alpine Ranch Estates West D/P 210012 2014 2$ -$ 309$ -$ -$ -$ -$ 311$ El Cap Pipeline D/P (Rios Canyon, Pecan Park 24-in) 2070000 2015 -$ -$ 170$ 176$ -$ -$ -$ 346$ Grossmont College Privatization 205021 2013 67$ 35$ -$ -$ -$ -$ -$ 102$ Pebble Beach Relief Sewer (Castlerock) (12-in upsize) 203033 Future -$ -$ -$ -$ -$ -$ 818$ 818$
Subtotal 83$ 128$ 479$ 176$ -$ -$ 818$ 1,684$
page 3 of 5

PROPOSED CIP BUDGET 12/13 THRU 16/17 PROJECT EXPENDITURES (THOUSANDS)
Project Name Job No.Estimated
CompletionEst. Cost to Date
6/30/12 12/13 13/14 14/15 15/16 16/17 FutureTotal Cost
(Incl. Inflation)
COP Financing5 Res Retrofit Ph 3 - West Victoria 208026 2013 (4,474)$ (1,100)$ -$ -$ -$ -$ -$ (5,574)$ Emergency Generator - Flinn Springs PS 2013 -$ (800)$ -$ -$ -$ -$ -$ (800)$ Emergency Generator - Rios Canyon PS 2013 -$ (500)$ -$ -$ -$ -$ -$ (500)$ ESA Sec. Supply Conn (incl Los Coches) 203032 2013 (10,416)$ (50)$ -$ -$ -$ -$ -$ (10,466)$ ESA Sec. Supply Conn Alt Site 2015 (15)$ (3,000)$ (9,673)$ (1,454)$ -$ -$ -$ (14,142)$ ESA Sec. Supply Conn Land Acquisition (2011) 211009 2013 (120)$ (625)$ -$ -$ -$ -$ -$ (745)$ ESA Sec. Supply Conn Mitigation & Monitoring 2013 -$ (250)$ -$ -$ -$ -$ -$ (250)$ Sunrise Reservoir Retaining Wall / Site Impr. 2013 -$ (450)$ -$ -$ -$ -$ -$ (450)$
Subtotal (15,025)$ (6,775)$ (9,673)$ (1,454)$ -$ -$ -$ (32,927)$
Grants & Other FinancingCSC Ph 2 - OPS (Sale of Woodside Property) 205014 2014 (486)$ (835)$ (1,395)$ -$ -$ -$ -$ (2,717)$ El Monte GW / WRF Study - ARRA grant (25%) 205051 2012 (84)$ -$ -$ -$ -$ -$ -$ (84)$ Financial Computer Syst Upgrade, Ops Conting Fund 2012 (100)$ -$ -$ -$ -$ -$ -$ (100)$ Ops - Security Gates, Cell Phone Revenues 2019 -$ -$ -$ (80)$ (83)$ (85)$ (137)$ (385)$ WRF Demo Project - Grants 2014 -$ (1,500)$ (1,550)$ -$ -$ -$ -$ (3,050)$ WRF Studies, ARRA Grants 210014 (17)$ -$ -$ -$ -$ -$ -$ (17)$
Subtotal (687)$ (2,335)$ (2,945)$ (80)$ (83)$ (85)$ (137)$ (6,352)$
Debt ServiceAMR Debt Service 207029 2020 1,759$ 704$ 704$ 704$ 704$ 704$ 1,759$ 7,037$ COP Debt Service (CIP Share) 2040 256$ 174$ 214$ 217$ 208$ 204$ 33,853$ 35,127$
Subtotal 878$ 917$ 921$ 912$ 908$ 35,612$ 42,164$
TOTAL BUDGETED 11,727$ 9,237$ 10,413$ 9,832$ 9,023$ 10,577$ 60,611$ 123,435$
page 4 of 5

PROPOSED CIP BUDGET 12/13 THRU 16/17 PROJECT EXPENDITURES (THOUSANDS)
Project Name Job No.Estimated
CompletionEst. Cost to Date
6/30/12 12/13 13/14 14/15 15/16 16/17 FutureTotal Cost
(Incl. Inflation)
BELOW THE LINE - UNBUDGETED, EXTERNAL FINANCING REQUIREDCuyamaca/Carlton Oaks Interconn Upsize 2019 8$ -$ -$ -$ -$ 618$ 1,494$ 2,120$ Willowgrove Sewer, Phase 2 Constr 209006 2018 -$ -$ -$ -$ -$ -$ 959$ 959$ WRF Ph 1 Design (incl IPS) 210014 2016 -$ -$ -$ 2,134$ 2,205$ -$ -$ 4,339$ WRF Ph 1 Constr (WRF & AWT) 210014 2018 -$ -$ -$ -$ -$ 25,279$ 26,113$ 51,392$ WRF Ph 1 Recycled Water Dist System 2018 -$ -$ -$ -$ -$ 882$ 912$ 1,794$ WRF Ph 1 Recycled Water Retrofit 2018 -$ -$ -$ -$ -$ 294$ 303$ 597$
Subtotal 8$ -$ -$ 2,134$ 2,205$ 27,073$ 29,781$ 61,201$
SRF FinancingCuyamaca/Carlton Oaks Interconnect 2019 -$ -$ -$ -$ -$ (618)$ (1,494)$ (2,112)$ Willowgrove Sewer, Ph 2 Construction 209006 2018 -$ -$ -$ -$ -$ -$ (959)$ (959)$ WRF Ph 1 Design (incl IPS) 210014 2016 -$ -$ -$ (2,134)$ (2,205)$ -$ -$ (4,339)$ WRF Ph 1 Constr 210014 2018 -$ -$ -$ -$ -$ (25,279)$ (26,113)$ (51,392)$ WRF Ph 1 Recycled Water Dist System 2018 -$ -$ -$ -$ -$ (882)$ (912)$ (1,794)$ WRF Ph 1 Recycled Water Retrofit 2018 -$ -$ -$ -$ -$ (294)$ (303)$ (597)$
Subtotal -$ -$ -$ (2,134)$ (2,205)$ (27,073)$ (29,781)$ (61,193)$
Title 16 Grants WRF Ph 1 Design 2019 -$ -$ -$ -$ -$ -$ (1,000)$ (1,000)$ WRF Ph 1 Constr. 2021 -$ -$ -$ -$ -$ -$ (11,100)$ (11,100)$ WRF Ph 1 Recycled Water Dist Syst 2021 -$ -$ -$ -$ -$ -$ (129)$ (129)$ WRF Ph 1 Recycled Water Retrofit 2021 -$ -$ -$ -$ -$ -$ (387)$ (387)$
Subtotal -$ -$ -$ -$ -$ -$ (11,616)$ (11,616)$
Debt ServiceCuyamaca/Carlton Oaks Interconnect 2040 -$ -$ -$ -$ -$ -$ 2,770$ 2,770$ Willowgrove Sewer, Phase 2 209006 2040 -$ -$ -$ -$ -$ -$ 1,280$ 1,280$ WRF Ph 1 Design (incl IPS) 210014 2038 -$ -$ -$ -$ -$ -$ 5,740$ 5,740$ WRF Ph 1 Constr, 210014 2040 -$ -$ -$ -$ -$ -$ 67,960$ 67,960$ WRF Ph 1 Recycled Water Dist System 2040 -$ -$ -$ -$ -$ -$ 2,380$ 2,380$ WRF Ph 1 Recycled Water Retrofit 2040 -$ -$ -$ -$ -$ -$ 790$ 790$
Subtotal -$ -$ -$ -$ -$ -$ 80,920$ 80,920$
TOTAL BELOW THE LINE 8$ -$ -$ -$ -$ 0$ 69,304$ 69,312$
page 5 of 5

PROPOSED CIP BUDGET 12/13 THRU 16/17UNBUDGETED AND FUTURE PROJECTS (THOUSANDS)
Costs are present value based on January 2012 ENR LA CCI of 10,092.
Project Name Job No.Total Project
BudgetEstimated Cost to Date 6/30/12
Estimated Remaining 6/30/12
FUTURE / BEYOND 5 YEARS - MOVE UP AS BUDGET ALLOWSCrest Pipeline Upsizes TBD $944 $0 $944Crest Reservoir #11, #12 Replacement (2 MG) 203020 $5,522 $39 $5,483East Victoria Interconnect (12-inch) D/P 2120000 $459 $0 $459El Capitan Liner Replacement Project 2200000 $19,376 $0 $19,376El Capitan Pipeline Purchase $600 $0 $600Engineering Data Access $50 $0 $50Galloway Valley Res. Inlet/Outlet Upsize $201 $0 $201Graves Ave Relief Sewer (10-, 12-, 15-in) 2080000 $1,425 $0 $1,425Harbison Canyon Trans. Upgrade - Section 1 (14-in) 211001 $111 $18 $92I-8 Crossing - 30-in abandonment and replacement $2,347 $0 $2,347I-8 Crossing - Old Hwy 80/Blossom Valley Rd Parallel 8-in $786 $0 $786IPS Grinders $350 $0 $350Mountain View Pipeline Repl (12-in) 211002 $1,508 $34 $1,474Oak Creek Pump Station Upgrade (625 gpm) 2090000 $169 $0 $169Ops - SCADA Upgrades IPS $375 $0 $375Ops - SCADA Upgrades Operations 2017 $1,000 $0 $1,000Ops - SCADA Upgrades WRF Hardware & PLC $375 $0 $375Quick Connect for Mobile Pump 2120000 $11 $0 $11Reservoir Refurbishing - Future 2080000 $2,508 $0 $2,508Undefined Replacement - Retail Water Mains (2015-2019) 2100000 $719 $0 $719Undefined Replacement - Sewer Mains (2015-2019) 2110000 $4,000 $0 $4,000Undefined Replacement - Sewer Pump Stations (2010-2014) 2070000 $407 $0 $407Undefined Replacement - Sewer Pump Stations (2015-2019) 2110000 $1,033 $0 $1,033Undefined Replacement - Water Pump Stations (2016-2020) 2100000 $4,747 $0 $4,747Undefined Replacement - Water Pumps( 2016-2020) $309 $0 $309Urban Water Management Plan 2020 $100 $0 $100Vulnerability Assessment Implementation 2030000 $2,109 $0 $2,109Water Pump Station Replacement (2011-2015) - El Capitan Booster 2160000 $1,136 $0 $1,136Wholesale Res Seismic Actuator 210025 $269 $19 $250WRF NPDES Permit Renewal 2019 $255 $0 $255
Subtotal $53,200 $110 $53,090
FUTURE / BEYOND 10 YEARSADA - Alpine 2140000 $35 $0 $35ADA - Operations 2140000 $46 $0 $46ADA - WRF 2140000 $59 $0 $59Alpine/Viejas Trans Main Extension (16-in) 2160000 $612 $0 $612Bend St Sewer Relief 2150000 $312 $0 $312East Mast/Riverford Relief Sewer (12- and 15-in) 2200000 $3,195 $0 $3,195East Mission Gorge Interceptor Participation 204008 $7,085 $41 $7,044ESA Reliability - Alpine Heights Pump Station (1600 gpm) 2110000 $2,464 $0 $2,464ESA Reliability - Alpine South Pump Station (1500 gpm) $2,859 $0 $2,859ESA Reliability - Alpine West Pump Station (5100 gpm) 2110000 $5,229 $0 $5,229ESA Reliability - Alpine West Reservoir (2 MG) 2110000 $5,498 $0 $5,498ESA Reliability - Alpine West Trans. Main (12- and 16-in) $343 $0 $343ESA Reliability - Harbison Canyon Trans. Upgrade - Section 2 (16-in) $1,150 $0 $1,150ESA Reliability - Mountain Top Interconnect (12-in) 2090000 $2,719 $0 $2,719ESA Reliability - Rios Canyon Pump Station #2 Upgrade 2200000 $1,017 $0 $1,017Flinn Springs Pump Station #3 Upgrade 2200000 $1,967 $0 $1,967Magnolia Ave North Relief Sewer - Segment 2 2080000 $1,289 $0 $1,289Magnolia Ave South Relief Sewer - Segment 2 2080000 $2,071 $0 $2,071Mission Gorge Rd Relief Sewer (12-, 15-, 18-in) 2080000 $1,273 $0 $1,273
page 1 of 2

PROPOSED CIP BUDGET 12/13 THRU 16/17UNBUDGETED AND FUTURE PROJECTS (THOUSANDS)
Project Name Job No.Total Project
BudgetEstimated Cost to Date 6/30/12
Estimated Remaining 6/30/12
Oak Creek East Pump Station (1400 gpm) 2200000 $0 $0 $0Oak Creek East Reservoir D/P (0.75 MG) 2200000 $504 $0 $504Oak Creek East Reservoir Trans. Main D/P (12-in) 2200000 $315 $0 $315Spanish Bit Reservoir North Loop (10-in) 2120000 $331 $0 $331Sunrise Conversion to Recycled Water $329 $0 $329Undefined Repl - Recycled Water Pumps (2020-2024) $396 $0 $396Undefined Repl - Retail Water Mains (2020-2029) $1,432 $0 $1,432Undefined Repl - Sewer Mains (2020-2024) $11,188 $0 $11,188Undefined Repl - Water Pump Stations (2021-2025) $3,441 $0 $3,441Viejas Mtn South Res Expansion & Repl $2,135 $0 $2,135Woodrose/Woodpark Sewer Relief 2130000 $2,302 $0 $2,302
Subtotal $61,596 $41 $61,556
TOTAL FUTURE $114,797 $151 $114,645
page 2 of 2

2013 Five Year Plan of 99 Draft - May 18, 2012 7
Chapter 2 – Water Resources Development
Introduction Padre Dam imports 100 percent of its potable water supply from the San Diego County Water Authority (SDCWA). SDCWA receives a substantial portion of its supply from the Metropolitan Water District of Southern California (MWD). The majority of MWD water comes from the State Water Project (SWP) and the Colorado River Aqueduct. Water travels through over 600 miles of aqueducts and 1,100 miles of pipeline to get to San Diego County. The Delta is at the center of the State Water Project (SWP). Since 2008, water deliveries from the Delta to Southern California have been limited by federal pumping restrictions enacted to protect the endangered Chinook Salmon, Delta Smelt and Longfin Smelt. In 2010, the Delta only supplied 18 percent of San Diego County’s water supply. Stakeholders are currently developing plans for new water conveyance systems that will protect and restore the Delta’s ecosystem. Another factor with the Delta and the SWP is the potential for a long interruption of service should any of the conveyance systems be damaged due to natural disasters. The Colorado River flows from the Rocky Mountains in Colorado to the Gulf of California and is a major water resource for Wyoming, Colorado, Utah, Nevada, California, Arizona and New Mexico. The river’s annual flow was allocated among the seven states in the 1922 Colorado River Compact. Ten consecutive years of drought in the Colorado River Basin, from 1999 to 2009, have reduced Lake Mead to 43 percent of its water storage capacity. In 2010, the Colorado River provided 61 percent of San Diego County’s water supply including allocations from the Quantification Settlement Agreement (QSA). In the past California has taken a higher percentage of water than allocated in the 1922 Compact because water was available. As other states in the Compact continue to use more water, California will receive less than past years. The San Diego County Water Authority was 95 percent reliant on MWD water during the 1990’s. This made San Diego County extremely vulnerable to water supply shortages. At that time, SDCWA launched a plan to develop a diversified portfolio of water resources by 2020. In 2011 the allocation from MWD was 47 percent of the SDCWA’s total demand; by 2020 it is anticipated the allocation will be further reduced to 29 percent of the total demand. Recycled water is an important part of San Diego County’s future water supply strategy. Every drop of recycled water used for non-potable use saves drinking water sources.
Water Supply, Demands and Recycled Water Opportunities The District’s water supply can be categorized as potable (which is all purchased from the SDCWA) and non-potable, which is produced at the Ray Stoyer Water Recycling Facility (WRF). Table 1 shows the volumes Padre Dam received in 2010 and the volumes required to meet future normal water year demands, assuming Padre Dam’s compliance with 2015 and 2020 water use targets mandated by Senate Bill X7-7.
Table 1
Padre Dam’s Water Supply (Source: Padre Dam’s Urban Water Management Plan)
Units are in Acre Feet
Source/Year 2010 2015 2020 2025 2030 2035 San Diego Co. Water Authority 15,772 14,810 15,910 17,215 17,967 18,881 Ray Stoyer WRF (Title 22 Water) 1,874 2,016 2,016 2,016 2,016 2,016

2013 Five Year Plan of 99 Draft - May 18, 2012 8
Currently, the District treats and recycles about 40 percent of its total wastewater flows. The WRF processes two million gallons per day (MGD) (2,240 AFY) of wastewater to provide Title 22 recycled water to support the Santee Lakes and up to 890 AFY (0.8 MGD) for irrigation use in Santee. Note there is an approximate 10 percent process loss of the influent wastewater through the treatment processes in the form of sludge & solids. Sludge & solids are pumped to Point Loma for treatment and disposal. Excess water is discharged into the Sycamore Creek. Currently, the District is the only entity in San Diego that is allowed to discharge effluent into an inland water body by the Regional Water Quality Control Board (RWQCB). The National Pollutant Discharge Elimination System Permit (NPDES) issued by the RWQCB is essential for the long term sustainability of Santee Lakes Recreational Preserve. Based on the available wastewater generated in the District’s service area (see Table 2), the WRF could be expanded from an influent flow from 2 MGD (2,240 AFY) up to 4.8 MGD (5,380 AFY). The expanded facility would provide approximately 2 MGD (2,240 AFY) of full advanced treated (FAT) recycled water to be used for indirect potable reused (IPR) and meet all projected future demands for non-potable reuse within Santee and the Santee Lakes Recreational Preserve (~2 MGD).
Table 2 Padre Dam’s Raw Wastewater Available in Service Area (Source: Padre Dam’s Urban Water Management Plan)
Units are in Acre Feet
Source/Year 2010 2015 2020 2025 2030 2035 Raw Waste Water Generated in Padre Dam Service Area 5,264 6,076 6,517 6,801 7,032 7,083
Water Resources Development FY 2013-2017 The proposed Capital Improvement Program (CIP) budget is structured to bridge the short term funding gap without undue burden to ratepayers while positioning the District to have a long term and sustainable infrastructure replacement plan. As it relates to the newly adopted 2012 Strategic Plan, the proposed CIP would facilitate multiple key success measures contained in Goal One – provide safe and reliable water, recycled water, and sewer services. In order to achieve the objectives of Goal Four of increasing water, sewer, and energy independence, additional funding is required above and beyond the budget presented within this business plan. Furthermore, it would be necessary for the District to develop strategic partnerships to solve these regional issues. With the continual uncertainties associated with regional water supply and wastewater treatment, it is envisioned that these goals will be tackled in a subsequent multi-year business plan. With the future of imported water & regional wastewater treatment becoming more expensive and/or more unreliable, increasing local controls of these valuable resources is an important initiative by the District. Current plans over the next five years are to:
1. Establish and Maintain Strategic Partnerships 2. Pursue Planning Projects maximizing existing grants
a. Demonstration of Full Advanced Treatment (FAT) technologies at the WRF b. Study of the Santee Basin Aquifer Groundwater Recharge & Replenishment
Project (Santee GRRP) 3. Secure grant funding for additional planned projects
a. Santee GRRP Demonstration Project
2013 Five Year Plan of 99 Draft - May 18, 2012 9
b. Combined Solids Handling Facilities With Enhanced Bio-gas Generation c. Establish Nitrification Reliability for Water Reuse
In order to develop a new recycled water project in the region, it is important to establish and maintain strategic relationships and partnerships with multiple agencies to gain support and regulatory approvals. Planned projects (listed above) over the next five years are intended to gain support and/or regulatory approvals from the following agencies:
1. California Department of Public Health (CDPH); 2. Regional Water Quality Control Board (RWQCB); 3. Bureau of Reclamation (BOR) ; 4. San Diego County Water Authority (CWA); 5. Department of Water Resources (DWR), State of California; 6. City of San Diego (CSD); 7. San Diego Metropolitan Wastewater Joint Power Authority (Metro JPA).
Other strategic partners include County of San Diego (County), City of El Cajon (El Cajon) and Helix Water District.
Pursue Planning Projects There is limited CIP budget available for development of a new water supply within the District over the next five years. However, in order to advance the use of recycled water during this period, two projects are planned to be accomplished utilizing existing grants: 1) Demonstration of FAT technologies at the WRF and 2) Study of the Santee GRRP. 1. Demonstration of FAT Technologies at the WRF The State of California is in the process of finalizing the recycled water regulations and will publish them later this year. The draft recycled water regulations reflect the CDPH’s current thinking on the regulation of recharge of groundwater with FAT recycled water. The draft recycled water regulations will require all future IPR projects utilizing groundwater aquifers to demonstrate the effectiveness of FAT processes utilizing the source water actually intended to be used for each project. The ultimate goals of this demonstration project are to reduce the regulatory requirements of recycled water contribution and residence time for the Santee GRRP. In the latest draft recycled water regulation, the CDPH requires an initial recycled water contribution of 50 percent and a minimum aquifer retention time of 6 months. However, if the demonstration project can prove sufficient log removal of crypto, giardia, and viruses, it could reduce the recycled water contribution and aquifer retention time requirements. Ultimately, this demonstration project could maximize the yield of the Santee Basin Aquifer and reduce initial operating costs of the Santee GRRP significantly. The current draft recycled water regulation contemplates a 10 log removal of crypto and giardia, and 12 log removal of viruses through the treatment processes. Table 3 shows pathogen log removals for a project that does not use FAT technology; therefore, a 6 month aquifer retention time is required representing 6 log removal of pathogens. Table 4 shows pathogen removals for a project that uses FAT technology where a 2 month aquifer retention time is possible.

2013 Five Year Plan of 99 Draft - May 18, 2012 10
Table 3
Pathogen Log Removal – For a Non-FAT Project
Organism Log
Reduction Required
Log Reduction Obtained
Biological and
Tertiary Treatment
Membrane Filtration
Reverse Osmosis
UV Disinfection
Advanced Oxidation
Aquifer Retention
Crypto 10 14 4 6 6 Giardia 10 14 2 6 6 Viruses 12 12 0 6 6
Table 4
Pathogen Log Removal – For a Project with FAT
Organism Log
Reduction Required
Log Reduction Obtained
Biological and
Tertiary Treatment
Membrane Filtration
Reverse Osmosis
UV Disinfection
Advanced Oxidation
Aquifer Retention
Crypto 10 17 2 4 3 6 2 Giardia 10 15 2 2 3 6 2 Viruses 12 15 2 0 3 6 2
The proposed project will provide planning, design, and construct a 0.1 MGD demonstration plant using FAT technologies (Microfiltration/Reverse Osmosis (MF/RO), advanced oxidation) at the WRF. The demonstration project will provide valuable information to gain regulatory acceptance that will support future expansion of the WRF. If the full expansion of the WRF up to 4.8 MGD is achieved, it could provide approximately 2,240 AFY (2 MGD) of local, drought-resistant water, representing approximately 15-20 percent of current potable demands. Implementation of this demonstration project will also address potential public concern over safety of indirect potable reuse and provide public education by demonstrating an innovative and efficient solution to the water supply issue. Figure 1 at the end of this chapter is a site map of the expanded WRF including the location of the proposed FAT facility. 2. Study of the Santee GRRP The purpose of this project is to evaluate the feasibility of injecting and extracting FAT recycled water into the Santee Basin aquifer and the development of the resource as a potable water source to lessen the District’s reliance on imported water. This project specifically targets characterization of the hydraulic capabilities of the basin for injection and extraction of water. Additionally, this study will evaluate the hydraulic connectivity of the basin with the San Diego River. This information will be valuable for assessing the influence of surface water on the groundwater basin, and for determining possible impacts on water rights. The proposed site of the Santee GRRP project lies within a portion of the Santee Basin aquifer generally bound on the west by Cuyamaca Street, on the north by Riverwalk Drive, on the east by Magnolia Avenue, and on the south by Riverview Office Park as depicted on Figure 2 at the end of this chapter. The study of the Santee GRRP is a joint partnership between the District and the BOR. To date, a table top study has been completed to show that there is a potential to use the proposed site for a GRRP. Additionally, several stakeholders’ meetings related to this project have been held.

2013 Five Year Plan of 99 Draft - May 18, 2012 11
The next phase of this study includes:
Perform geophysical investigation to determine the extent and thickness of the alluvium at the project site.
Install a test well and perform testing to determine local hydraulic conductivities of the aquifer.
The preliminary geophysical work using electrical resistivity to help define the alluvial thickness and extent, and underlying bedrock topography has been recently completed. The results of the test are expected to be available at the end of June 2012. Once the geophysical tests are completed, test and monitoring wells will be installed to assess groundwater quality and hydraulic conductivities. The information obtained from the test and monitoring wells will be used to develop a preliminary groundwater model in support of GRRP in the Santee Basin Aquifer. 3. Future Projects
Santee Aquifer GRRP Demonstration Project
This goal of this demonstration project is to determine actual retention time of the Santee Basin Aquifer. It is envisioned that this demonstration project would help with the development and refinement of the injection/extraction strategies that would optimize aquifer retention time and maximize yield of the aquifer.
Combined Solids Handling Facilities With Enhanced Bio-gas Generation The intent of this project is to study the viability of constructing a combined bio-gas generation facility within Sycamore Landfill. Sycamore Landfill is in the process of developing an extensive landfill gas extraction facility to maximize the energy potential from their off-gas recovery system. Additionally, Sycamore Landfill is evaluating the viability of separating its organic wastes and digest them to produce more bio-gas for energy recovery. With this project, the District could develop a partnership with the landfill where sludge and solids from the WRF could be co-digested with organic wastes from the landfill. The bio-gas would be recovered from the digesters and sold to SDG&E to be used as an energy source. If proven viable, this project could reduce the sludge and solids handling and reduce solids disposal costs for the District without constructing solids handling facility at the WRF as part of the future expansion.
Establish Nitrification Reliability for Water Reuse
When California developed the current Title 22 Recycling Criteria, the chlorine disinfection requirements were based on results of a not well understood and controlled nitrification processes. As a result, no regulatory distinction was made between disinfection with chloramine and chlorine gas. The intent of this study is to document the reliability of the nitrification process at the WRF giving the District proper credit for disinfecting with chlorine gas. Potentially, this study could lessen the chlorine gas needed to properly disinfect Title 22 water or reduce the need to expand the current disinfection facility in the future.

2013 Five Year Plan of 99 Draft - May 18, 2012 12
Funding for Planning Projects 1. FAT Demonstration Project at the WRF The demonstration project is projected to be funded by the Proposition 50 grant secured from DWR for $3 million via the Integrated Regional Water Management (IRWM) Program. This grant was originally awarded to expand the WRF from 2.0 MGD to 4.4 MGD including advanced treatment facilities for the joint project with Helix Water District. The grant is currently being amended with the DWR to cover the cost of the demonstration project at the WRF. 2. Study Santee GRRP The Santee GRRP Study is a joint venture with the BOR. Total cost of the project is $600,000 with BOR and Padre Dam sharing the costs equally through a planning grant funded by the Department of Interior.
3. Funding for additional studies related to WRF and Santee GRRP Funding for additional studies is planned to be fully or partially funded by Proposition 84 funding from DWR, WaterSmart Grant Program from BOR, and grants from Water Reuse Foundation. Currently, no CIP budget is allocated for the District’s matching portion of these grants because the matching percentage is unknown at this time and funding is limited. Future Regulatory Considerations 1. Padre Dam Live Stream Discharge (NPDES) Permit This permit was last renewed in 2009. The purpose of the permit is to continue to allow Padre Dam to discharge recycled water from the Santee Lakes to the adjacent Sycamore Creek, a tributary of the San Diego River. Padre Dam is the only agency in San Diego County with an inland live stream discharge permit due largely in part to our impeccable compliance record and excellence in water recycling facility operations. During the last permit renewal, the RWQCB included performance goals for several contaminants of emerging concern. To date, Padre Dam is able to meet these performance goals; however, additional future regulatory requirements may become more stringent where the existing treatment processes will be unable to meet the compliance requirements and significant investments in the treatment processes will be required. Funding for these potential compliance related capital investments is not included in 2013/17 Five Year Plan due to the limited knowledge of the future permit requirements. 2. Upgrades at City of San Diego Point Loma Wastewater Treatment Plant The waiver to upgrade Point Loma to a full secondary treatment plant in compliance with EPA’s Clean Water Act is up for review and consideration in 2015. Earlier this year, the City of San Diego completed their recycled water study which evaluated several options to offload wastewater from Point Loma in order to meet the EPA compliance requirements. This study is the first step outlining strategies to reuse the wastewater currently discharged into the Pacific Ocean to increase local water supply. The cost of this plan is currently estimated to be in the range of 1 to 2 billion dollars. Padre Dam’s portion of this upgrade cost is approximately 3%. Funding for this potential liability is not included in the 2013/17 Five Year Plan as the City is in the process of preparing an implementation strategy and cost allocation model for the proposed upgrade. Staff will continue to monitor the progress and status of the potential costs to Padre Dam and when appropriate will develop and provide recommended strategies that minimize the financial impacts to Padre Dam's ratepayers.

2013 Five Year Plan of 99 Draft - May 18, 2012 13

2013 Five Year Plan of 99 Draft - May 18, 2012 14


10,255 10,042 213 11,471 10,334 -79
Annual Budget
CURRENT YEAR
Padre Dam MWD Water Deliveries: FY 2011/12 (acre feet)
PRIOR YEAR
YTD Actual YTD ActualVariance to
Current Year Actual
YTD BudgetVariance to
Current Year Actual
10,255 10,04210,334
0
2,000
4,000
6,000
8,000
10,000
12,000
Acr
e Fe
et
Current Year Actual YTD
Current Year Budget YTD
Prior Year Actual YTD