Embed Size (px)
Citation preview
ARTICLE IN PRESS
Available at www.sciencedirect.com
journal homepage: www.elsevier.com/locate/he
I N T E R N AT I O N A L J O U R N A L O F H Y D R O G E N E N E R G Y 3 3 ( 2 0 0 8 ) 3 6 7 6 – 3 6 8 7
0360-3199/$ - see frodoi:10.1016/j.ijhyden
�Corresponding autE-mail address: v
Electrodeposition of Ni–Mo alloy coatings and theircharacterization as cathodes for hydrogen evolution insodium hydroxide solution
N.V. Krstajica, V.D. Jovicb,�, Lj. Gajic-Krstajicc, B.M. Jovicb, A.L. Antozzid, G.N. Martellid
aFaculty of Technology and Metallurgy University of Belgrade, 11000 Belgrade, Karnegijeva 4, SerbiabInstitute for Multidisciplinary Research, 11030 Belgrade, P.O. Box 33, SerbiacInstitute of Technical Sciences SASA, 11000 Belgrade, Knez Mihajlova 35, SerbiadDe Nora Industries, Via Bistolfi 35, 20134 Milan, Italy
a r t i c l e i n f o
Article history:
Received 4 September 2007
Received in revised form
13 February 2008
Accepted 20 April 2008
Available online 4 June 2008
Keywords:
Electrodeposition
Ni–Mo alloy
Coatings
Hydrogen evolution
Stability
EIS measurements
nt matter & 2008 Internae.2008.04.039
hor. Tel.: +381 11 [email protected]
a b s t r a c t
The hydrogen evolution reaction on the electrodeposited Ni–Mo alloy coatings, as well as
their electrochemical properties in the NaOH solutions, have been investigated by the
polarization measurements, cyclic voltammetry and EIS technique. It was shown that the
Ni–Mo alloy coatings electrodeposited from the pyrophosphate-sodium bicarbonate bath
possess high catalytic activity for hydrogen evolution in the NaOH solutions. Their stability
in the 1 M NaOH at 25 1C under the condition of the reverse polarization was shown to be
very good, while in the 33% NaOH at 85 1C (conditions of the industrial electrolysis) the
electrodeposited Ni–Mo alloy coatings exhibited also high catalytic activity, but low
stability, as a consequence of a deterioration of the alloy coatings.
& 2008 International Association for Hydrogen Energy. Published by Elsevier Ltd. All rights
reserved.
1. Introduction
The hydrogen evolution reaction (HER) is one of the most
frequently investigated reactions. The reason for this is that
the HER proceeds through a limited number of steps with the
only one type of intermediate. The kinetic of the HER in
alkaline solutions have been mainly investigated on Ni [1,2],
due to the relatively good catalytic activity and high corrosion
stability of this substrate.
According to the theory of electrocatalysis, the electrocata-
lytic activity depends on the heat of adsorption of the
intermediate on the electrode surface defined by the well-
known ‘‘volcano’’ curve [3]. It is clear that beside the precious
metals, there is practically no way to find the new materials
tional Association for Hy
; fax: +381 11 3055289.(V.D. Jovic).
among pure metals, which would possess high catalytic
activity for the HER.
The alloying of two (or more) metals has long appeared as
the most straightforward approach to achieve electrocatalytic
activity for the HER. Miles [4] suggested that a combination of
two metals from the two branches of the ‘‘volcano’’ curve
could result in enhanced activity for the HER. Thus, the Mo-
based alloys either electrodeposited [5], or thermally prepared
[6], or added in situ [7], became the main objective of the
research during the past 30 years, with the Ni–Mo alloy
showing superior qualities.
The investigation of the kinetics and the mechanism of the
HER at the Ni–Mo alloys of various compositions, obtained
by the electrodeposition from suitable baths, has been the
drogen Energy. Published by Elsevier Ltd. All rights reserved.
ARTICLE IN PRESS
Table 1 – Electrolytes used for the Ni–Mo alloy coatingselectrodeposition
Solution pH Electrolyte composition
S1 9.0 10 g dm�3 NiCl2 � 6H2O; 40 g dm�3
Na2MoO4 � 2H2O; 45 g dm�3 K4P2O7; 75 g dm�3
NaHCO3
S2 8.5 10 g dm�3 NiCl2 � 6H2O; 40 g dm�3
Na2MoO4 � 2H2O; 100 g dm�3 K4P2O7; 40 g dm�3
NH4Cl
S3 8.5 10 g dm�3 NiCl2 � 6H2O; 40 g dm�3
Na2MoO4 � 2H2O; 45 g dm�3 K4P2O7; 75 g dm�3
NaHCO3; 10 g dm�3 NaCl
S4 9.0 10 g dm�3 NiCl2 � 6H2O; 40 g dm�3
Na2MoO4 � 2H2O; 45 g dm�3 K4P2O7; 10 g dm�3
Na2B4O7
S5 7.5 10 g dm�3 NiCl2 � 6H2O; 40 g dm�3
Na2MoO4 � 2H2O; 45 g dm�3 K4P2O7; 75 g dm�3
NaHCO3; 10 g dm�3 NaCl; 5 g dm�3 HCl
S6 7.6 10 g dm�3 NiCl2 � 6H2O; 40 g dm�3
Na2MoO4 � 2H2O; 45 g dm�3 K4P2O7; 10 g dm�3
Na2B4O7; 5 g dm�3 HCl
I N T E R N A T I O N A L J O U R N A L O F H Y D R O G E N E N E R G Y 3 3 ( 2 0 0 8 ) 3 6 7 6 – 3 6 8 7 3677
subject of numerous studies [8–19]. Chialvo et al. [18]
investigated the dependence of the electrocatalytic activity
of the bulk Ni–Mo alloys for the HER as a function of their
composition, varying atomic percentage of molybdenum
from 0 to 25 at%.
However, the activity enhancement has recently been
found to be mainly due to an increased surface area [12,17]
and synergetic effects has been ruled out.
If the Ni–Mo mixed layers are prepared by thermal
decomposition of suitable precursors, clear synergetic effects
were observed. The Tafel slope decreased to 40 mV dec�1 and
extended to very high current densities [19].
A change in the mechanism with respect to the bulk Ni has
also been observed with the electrodeposited Ni–Mo alloys
containing only 1% of Cd. The origin of the activity of the
Ni–Mo–Cd alloy coatings has been investigated by Conway
and co-workers [12]. They have found that the cathodic
behavior can be explained in terms of the formation of a
hydride phase at low overpotentials [2].
Most of the papers concerning electrodeposition of the
Ni–Mo alloys are dealing with the mechanism of the deposi-
tion process (mechanism of induced co-deposition), mainly
reported by Landolt and coworkers [20,21]. Only a few papers
were devoted to their morphological and the phase composi-
tion characterization [22–28]. It was found by XRD analysis
that the Ni–Mo alloys electrodeposited from a citrate bath (pH
8.5–9.5) contain Ni–Mo solid solution, with the diffraction
peaks being sharp at the lower content of Mo (up to 12 wt%)
and wide at the high content of Mo (30 wt%) [22]. In the same
paper the TEM revealed the same solid solution with the grain
size ranging between 4 and 17 nm (average 5 nm), indicating
that the electrodeposited Ni–Mo alloy is almost amorphous. A
similar conclusion was made by the XRD analysis of the
Ni–Mo alloys electrodeposited from the pyrophosphate-am-
monium chloride bath (pH 8.5) [23,24]. In the papers of
Sanches et al. [26,27] for the first time it was demonstrated by
the energy dispersive X-ray spectroscopy (EDS) analysis that
the electrodeposited Ni–Mo alloys with higher amount of Mo
contain up to about 50 at% of oxygen. XRD showed sharp
diffraction peaks corresponding to the Ni–Mo solid solution
and the Ni4Mo intermetallic compound [27], while XPS
analysis revealed that in the alloy with higher amount of
Mo, among the metallic Mo, a mixture of polyvalent
molybdenum oxides or hydroxides, mainly in the form of
Mo(V) and Mo(IV) was present in the deposit. It was also
concluded in this work that the increase of Ni(II) concentra-
tion in the citrate bath (pH 4) favors deposition of the metallic
molybdenum.
Despite the large amount of data collected in this field, it
should be emphasized that for the technological applications
besides the electrocatalytic activity, the stability of the
electrode materials in strongly alkaline solutions at the
elevated temperature is even more crucial. Hence, in this
report the results of the investigation of the HER in
concentrated NaOH solutions at the elevated temperatures
(the working conditions as in the membrane Chlor-Alkali
technology) on the Ni–Mo alloys electrodeposited from the
different baths were presented. The main purpose of this
study was to investigate the mechanism of the deactivation
process as a result of the reverse polarization.
2. Experimental
2.1. Electrodeposition of the Ni–Mo coatings
The electrodeposition of the Ni–Mo alloys was performed in a
beaker at 60 1C with the counter electrode being Ni foil placed
close to the walls of the beaker. The working electrodes (Ni
meshes) were placed in the middle of the electrolyte and the
electrolyte was stirred with the magnetic stirrer during the
alloy electrodeposition.
Two types of meshes, supplied by DeNora Industries were
used: the expanded Ni mesh (1), sand blasted with alumina,
standard for cathodic activation (Chlor Alkali) and the Ni ‘‘Fly-
Net’’ uncoated (25 mesh, opening type) used for cathodic
activation (Chlor Alkali) in the ZERO GAP configuration cells
(2). The Ni surface was first etched in 2:1 HNO3 for 2 min. and
then immersed in the 25 wt% H2SO4 where the cathodic
current density of 5 mA cm�2 was applied for 5 min [29]. After
this treatment the electrode was washed with the Milli-Q
water and transferred in the electrolyte for the Ni–Mo alloy
electrodeposition under the conditions of a constant current
density to the thickness of approximately 10mm (except for
the samples 1 and 2, see Table 2). When the deposition was
finished, the electrode was again washed with the Milli-Q
water and transferred into the cell for the polarization curve
measurements. Seven electrolytes of different compositions
were used for the Ni–Mo alloy electrodeposition. Their
compositions are given in Table 1. The dimensions of the
meshes 1 and 2 exposed to the deposition of the Ni–Mo alloy
was 2�1 cm, with the total electrode area of 3.348 cm2 for
mesh 1 and 1.76 cm2 for mesh 2.
ARTICLE IN PRESS
I N T E R N AT I O N A L J O U R N A L O F H Y D R O G E N E N E R G Y 3 3 ( 2 0 0 8 ) 3 6 7 6 – 3 6 8 73678
2.2. Electrochemical measurements
The polarization curves for hydrogen evolution on these
electrodes were measured in the standard electrochemical
(three electrodes) cell at the temperature of 25 1C in 1 M NaOH
and at 85 1C in 33% NaOH. Saturated calomel electrode (SCE)
was used as the reference electrode. The counter electrode
was a Pt mesh. Only 1 cm2 of the total mesh area was exposed
to the solution. The polarization diagrams were recorded on a
Gamry potentiostat Reference 600 with automatic IR drop
compensation (current interrupt technique), using Corrosion
Techniques Software DC 105. Before recording polarization
diagrams electrodes were exposed to hydrogen evolution in
the same solution at j ¼ �0.1 A cm�2 for the time needed to
establish reproducible polarization curve. In the case of the
anodic treatment (recording of CV’s or oxygen evolution)
polarization diagrams were recorded immediately after the
anodic treatment. The electrochemical impedance spectro-
scopy (EIS) experiments were performed with the same
potentiostat using Electrochemical Impedance Spectroscopy
software EIS 300.
All solutions were made from the analytical grade chemi-
cals and the Milli-Q water.
2.3. Characterization
To characterize the as-deposited surfaces and to determine
the alloy composition a scanning electron microscope (JEOL
JSM 6460LV) with EDS was used. Selected deposits were
mounted in a cross-section, polished and examined by the
optical microscopy.
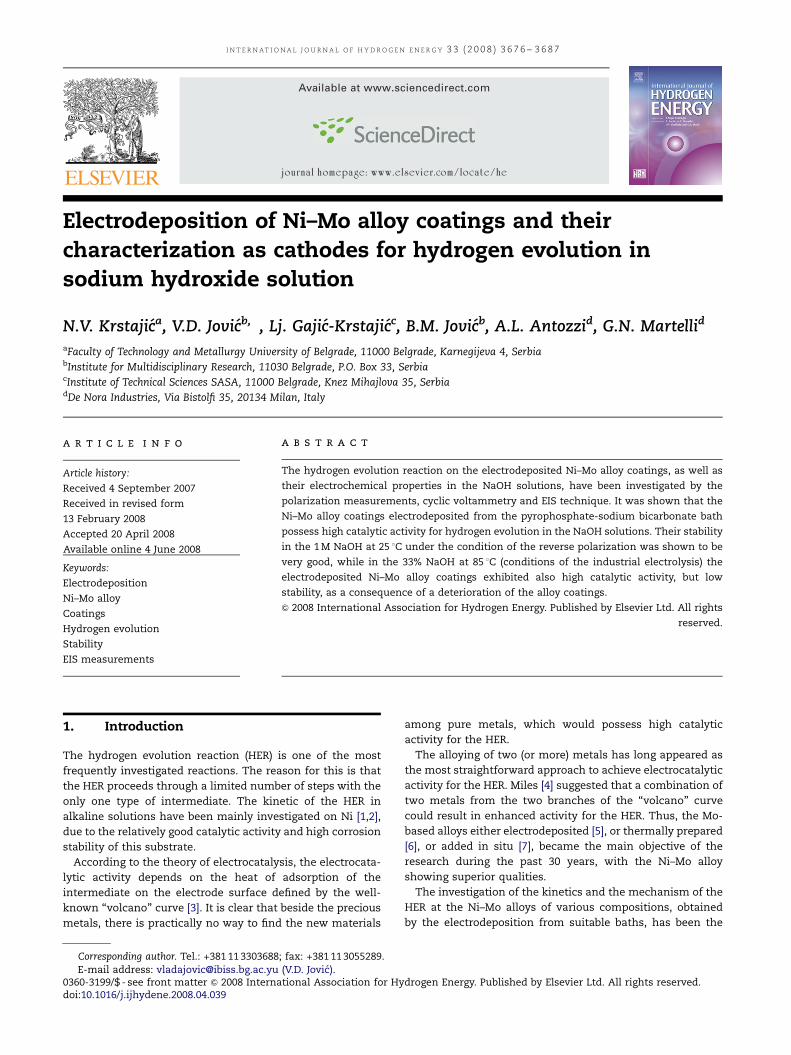
Fig. 1 – The polarization characteristics of different Ni–Mo
alloy samples electrodeposited onto mesh 1 (given in Table
1) and a pure Ni mesh 1, recorded in 1 M NaOH at 25 1C.
Polarization curve for 20 lm Ni deposited onto mesh 1 is
3. Results and discussion
3.1. Electrodeposition of the Ni–Mo alloy coatings andtheir characterization
All the electrolytes used for the Ni–Mo alloy electrodeposition
are presented in Table 1. As can be seen K4P2O7 was used as a
Table 2 – Conditions of the Ni–Mo alloy samples electrodepositievolution at j ¼ �0.3 A cm�2
Alloy sample jd (mA cm�2) Solution T (1C)
1 �100 S1 60
2 �50 S1 60
3 �20 S1 60
4 �100 S3 60
5 �100 S2 60
6 �100 S4 60
7 �100 S5 60
8 �100 S6 60
Ni mesh
20 mm Ni �250 Sulfamate 45
complexing agent, since it was found that higher percentage of
the Mo could be co-deposited with the Ni from such type of the
electrolyte [23–25] in comparison with the citrate containing
electrolytes [26,27]. According to our previous work [28] the
percentage of Mo in the deposit increases with increasing
deposition current density (jd) from about 28 at% at
�20 mA cm�2 to about 41 at% at �100 mA cm�2. It is important
to note that in all the electrodeposited samples significant
atomic percentage of the oxygen has been detected, varying
between 30 and 50 at%, while for calculation of the Ni–Mo alloy
composition only the Ni and the Mo were taken into account,
neglecting oxygen [28]. According to certain literature [27],
alloys containing high amount of Mo represent mixture of Ni
and some polyvalent Mo(IV) and/or Mo(V) oxides.
All alloy coatings for this investigation were electrodepos-
ited on mesh 1. In order to obtain the Ni–Mo alloys with the
highest amount of Mo, all samples (except samples 2
and 3—Table 1) were electrodeposited at jd ¼ �100 mA cm�2.
on onto Ni mesh (1); corresponding potentials for hydrogen
Deposition time (min) E vs. SCE (V) at j ¼ �0.3 A cm�2
15 �1.353
60 �1.545
120 �1.580
120 �1.339
120 �1.499
120 �1.445
120 �1.435
120 �1.348
�1.672
10 �1.660
presented by dotted line.
ARTICLE IN PRESS
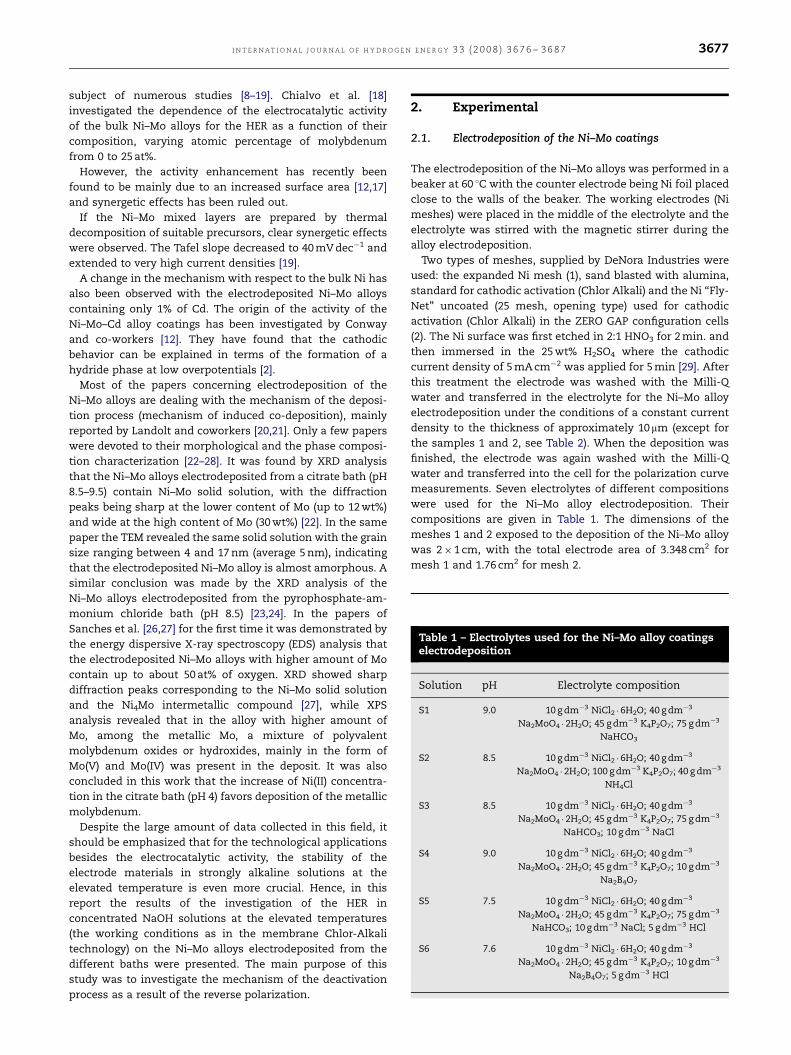
Fig. 2 – (a) A cross-section of the as deposited Ni–Mo alloy coating (sample 4, Table 2). (b) A cross-section of the same coating
after 1 h of hydrogen evolution in 33% NaOH at the current density of �0.1 A cm�2.
I N T E R N A T I O N A L J O U R N A L O F H Y D R O G E N E N E R G Y 3 3 ( 2 0 0 8 ) 3 6 7 6 – 3 6 8 7 3679
The composition of electrolytes for the Ni–Mo alloys electro-
deposition used in this work represents the combination of
some electrolytes presented in the literature [23–25,28].
It is important to note that the components of the bath
should be dissolved in Milli-Q water by the following order:
first, 45 g dm�3 K4P2O7 should be dissolved at elevated
ARTICLE IN PRESS
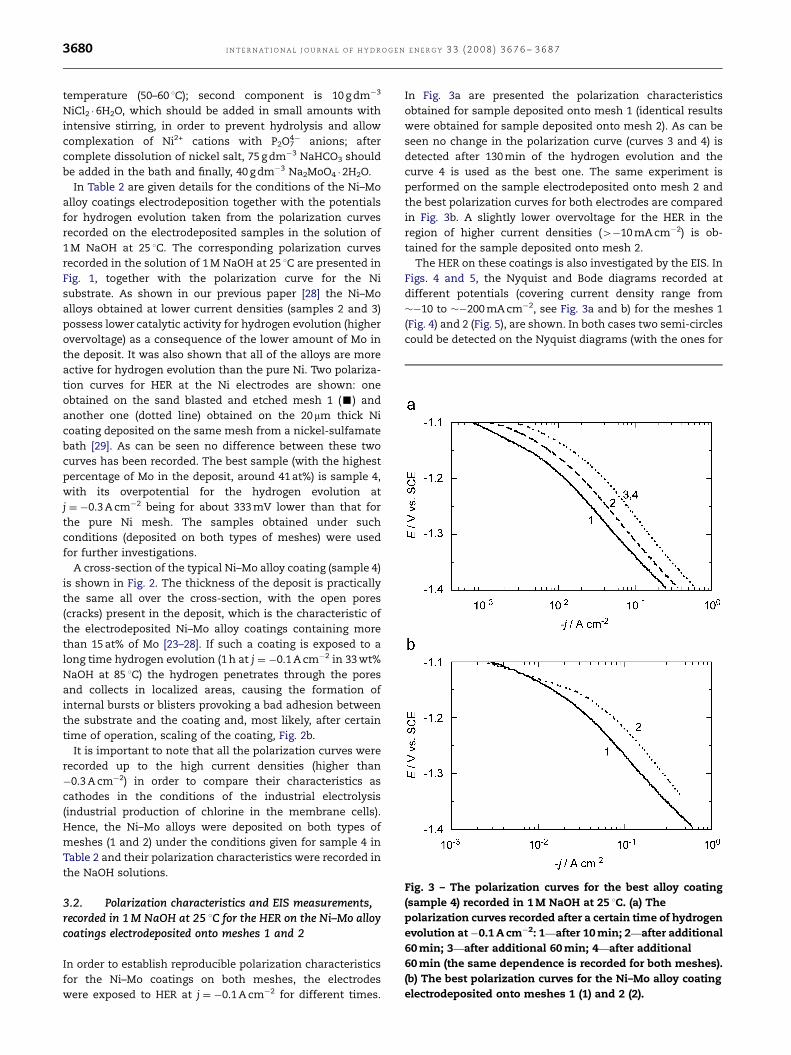
Fig. 3 – The polarization curves for the best alloy coating
(sample 4) recorded in 1 M NaOH at 25 1C. (a) The
polarization curves recorded after a certain time of hydrogen
evolution at �0.1 A cm�2: 1—after 10 min; 2—after additional
60 min; 3—after additional 60 min; 4—after additional
60 min (the same dependence is recorded for both meshes).
(b) The best polarization curves for the Ni–Mo alloy coating
electrodeposited onto meshes 1 (1) and 2 (2).
I N T E R N AT I O N A L J O U R N A L O F H Y D R O G E N E N E R G Y 3 3 ( 2 0 0 8 ) 3 6 7 6 – 3 6 8 73680
temperature (50–60 1C); second component is 10 g dm�3
NiCl2 � 6H2O, which should be added in small amounts with
intensive stirring, in order to prevent hydrolysis and allow
complexation of Ni2+ cations with P2O74� anions; after
complete dissolution of nickel salt, 75 g dm�3 NaHCO3 should
be added in the bath and finally, 40 g dm�3 Na2MoO4 �2H2O.
In Table 2 are given details for the conditions of the Ni–Mo
alloy coatings electrodeposition together with the potentials
for hydrogen evolution taken from the polarization curves
recorded on the electrodeposited samples in the solution of
1 M NaOH at 25 1C. The corresponding polarization curves
recorded in the solution of 1 M NaOH at 25 1C are presented in
Fig. 1, together with the polarization curve for the Ni
substrate. As shown in our previous paper [28] the Ni–Mo
alloys obtained at lower current densities (samples 2 and 3)
possess lower catalytic activity for hydrogen evolution (higher
overvoltage) as a consequence of the lower amount of Mo in
the deposit. It was also shown that all of the alloys are more
active for hydrogen evolution than the pure Ni. Two polariza-
tion curves for HER at the Ni electrodes are shown: one
obtained on the sand blasted and etched mesh 1 (’) and
another one (dotted line) obtained on the 20mm thick Ni
coating deposited on the same mesh from a nickel-sulfamate
bath [29]. As can be seen no difference between these two
curves has been recorded. The best sample (with the highest
percentage of Mo in the deposit, around 41 at%) is sample 4,
with its overpotential for the hydrogen evolution at
j ¼ �0.3 A cm�2 being for about 333 mV lower than that for
the pure Ni mesh. The samples obtained under such
conditions (deposited on both types of meshes) were used
for further investigations.
A cross-section of the typical Ni–Mo alloy coating (sample 4)
is shown in Fig. 2. The thickness of the deposit is practically
the same all over the cross-section, with the open pores
(cracks) present in the deposit, which is the characteristic of
the electrodeposited Ni–Mo alloy coatings containing more
than 15 at% of Mo [23–28]. If such a coating is exposed to a
long time hydrogen evolution (1 h at j ¼ �0.1 A cm�2 in 33 wt%
NaOH at 85 1C) the hydrogen penetrates through the pores
and collects in localized areas, causing the formation of
internal bursts or blisters provoking a bad adhesion between
the substrate and the coating and, most likely, after certain
time of operation, scaling of the coating, Fig. 2b.
It is important to note that all the polarization curves were
recorded up to the high current densities (higher than
�0.3 A cm�2) in order to compare their characteristics as
cathodes in the conditions of the industrial electrolysis
(industrial production of chlorine in the membrane cells).
Hence, the Ni–Mo alloys were deposited on both types of
meshes (1 and 2) under the conditions given for sample 4 in
Table 2 and their polarization characteristics were recorded in
the NaOH solutions.
3.2. Polarization characteristics and EIS measurements,recorded in 1 M NaOH at 25 1C for the HER on the Ni–Mo alloycoatings electrodeposited onto meshes 1 and 2
In order to establish reproducible polarization characteristics
for the Ni–Mo coatings on both meshes, the electrodes
were exposed to HER at j ¼ �0.1 A cm�2 for different times.
In Fig. 3a are presented the polarization characteristics
obtained for sample deposited onto mesh 1 (identical results
were obtained for sample deposited onto mesh 2). As can be
seen no change in the polarization curve (curves 3 and 4) is
detected after 130 min of the hydrogen evolution and the
curve 4 is used as the best one. The same experiment is
performed on the sample electrodeposited onto mesh 2 and
the best polarization curves for both electrodes are compared
in Fig. 3b. A slightly lower overvoltage for the HER in the
region of higher current densities (4�10 mA cm�2) is ob-
tained for the sample deposited onto mesh 2.
The HER on these coatings is also investigated by the EIS. In
Figs. 4 and 5, the Nyquist and Bode diagrams recorded at
different potentials (covering current density range from
��10 to ��200 mA cm�2, see Fig. 3a and b) for the meshes 1
(Fig. 4) and 2 (Fig. 5), are shown. In both cases two semi-circles
could be detected on the Nyquist diagrams (with the ones for
ARTICLE IN PRESS
I N T E R N A T I O N A L J O U R N A L O F H Y D R O G E N E N E R G Y 3 3 ( 2 0 0 8 ) 3 6 7 6 – 3 6 8 7 3681
the mesh 1 being better defined), indicating the presence of
two time constants. The Bode plots also display two relaxa-
tion time constants with the high-frequency relaxation time
constant being almost the same at all overpotentials. In order
to fit impedance spectra obtained on the Ni–Mo coatings a
two constant phase elements (CPE’s) serial model was applied
(shown in the inset of the Nyquist diagram in Fig. 4). It
consists of the solution resistance, Rs, in series with two
parallel CPE-R elements (2-CPE model) [30,31] and is used for
the analysis of the EIS results of HER recorded on the Ni–Mo
alloys obtained by different procedure. According to this
model the high-frequency time constant, independent of the
potential, described by the Rp and CPEp connected in parallel,
is related to the electrode porosity, whereas the potential
dependent time constant is related to the kinetics of the HER
(Rct and CPEdl connected in parallel). The Bode plots (Figs. 4
and 5) confirm the above mentioned statement that the first
Fig. 4 – The Nyquist and Bode diagrams recorded in 1 M
NaOH at 25 1C at different potentials (marked in the figure in
volts) for the HER on the Ni–Mo alloy coating
electrodeposited onto mesh 1 in the frequency range from
0.1 Hz to 10 kHz: squares, circles and triangles represent
experimental points, while solid lines represent fitting
results. The equivalent circuit used for fitting EIS results is
presented in the inset of the Nyquist diagram: Rs—solution
resistance; Rp—resistance of pores; CPEp—constant phase
element corresponding to the capacitance of pores;
CPEdl—constant phase element corresponding to the double
layer capacitance; Rct—charge transfer resistance [30,31].
(high-frequency) semi-circle is independent of the potential
and related to the electrode porosity (Ni–Mo coatings display
deep narrow pores, Fig. 2). The capacitance parameter Tdl is
related to the average double layer capacitance Cdl by the
relation: Cdl ¼ {Tdl/[(Rs+Rp)�1+Rct�1](1�F)}1/F, where F represents
a factor of homogeneity [31]. In the case of pure Ni mesh 1, or
Ni coated Ni mesh 1, the capacitance parameter Tdl is also
related to the average double layer capacitance Cdl by slightly
different relation: Cdl ¼ [Tdl/(Rs�1+Rct
�1)(1�F)]1/F [31], because the
corresponding Nyquist diagrams exhibit only one semi-circle.
The values of the capacitance, Cdl, determined for the Ni–Mo
coatings are almost independent of overpotential and are up
to two orders of magnitude larger than those for the Ni coated
mesh 1 (see Table 3). The results obtained by the NLLS fitting
procedure are given in Table 3, while the fitting curves are
presented by the solid lines in Figs. 4 and 5.
The intrinsic activity (j/Rf) could be estimated as a ratio of
the current density for the HER at a constant potential E, and
the roughness factor expressed as Rf ¼ Cdl/20mF cm�2 [32]
(20mF cm�2 being an ideal value for the double layer capaci-
tance). These parameters are displayed in Table 3. According
Fig. 5 – The Nyquist and Bode diagrams recorded in 1 M
NaOH at 25 1C at different potentials (marked in the figure in
volts) for the HER on the Ni–Mo alloy coating
electrodeposited onto mesh 2 in the frequency range from
0.1 Hz to 10 kHz: squares, circles and triangles represent
experimental points, while solid lines represent fitting
results.
ARTICLE IN PRESS
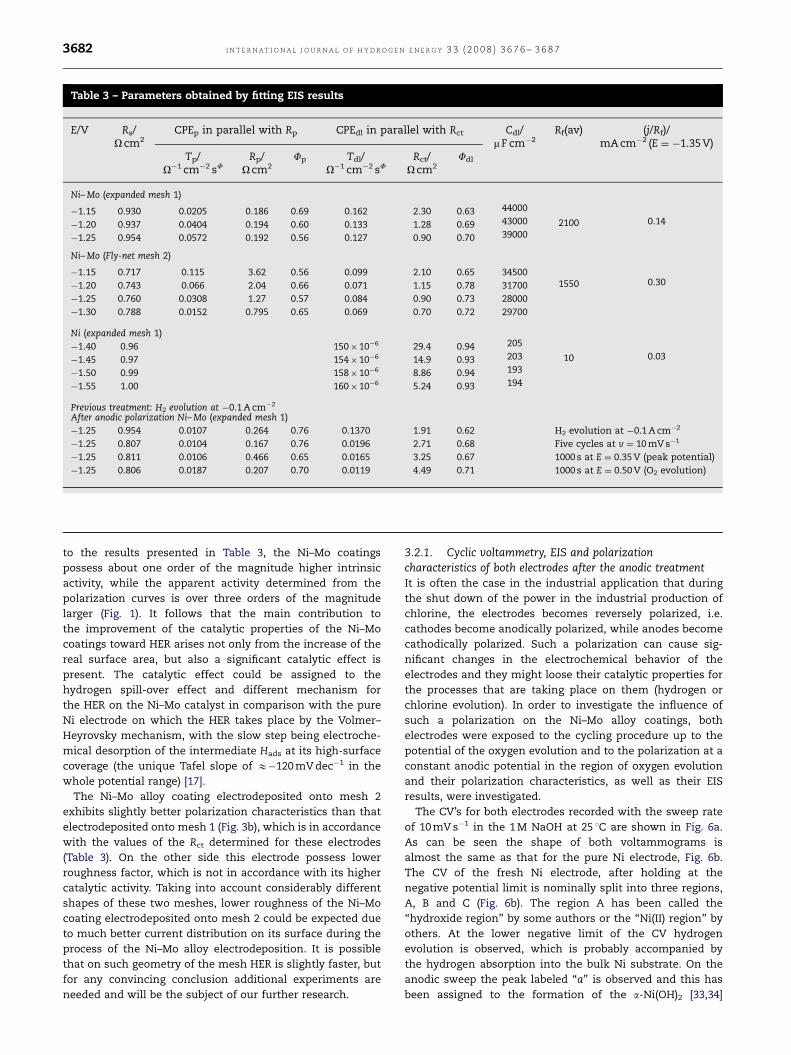
Table 3 – Parameters obtained by fitting EIS results
E/V Rs/O cm2
CPEp in parallel with Rp CPEdl in parallel with Rct Cdl/mF cm�2
Rf(av) (j/Rf)/mA cm�2 (E ¼ �1.35 V)
Tp/O�1 cm�2 sF
Rp/O cm2
Fp Tdl/O�1 cm�2 sF
Rct/O cm2
Fdl
Ni– Mo (expanded mesh 1)
�1.15 0.930 0.0205 0.186 0.69 0.162 2.30 0.63 44000
�1.20 0.937 0.0404 0.194 0.60 0.133 1.28 0.69 43000 2100 0.14
�1.25 0.954 0.0572 0.192 0.56 0.127 0.90 0.70 39000
Ni– Mo (Fly-net mesh 2)
�1.15 0.717 0.115 3.62 0.56 0.099 2.10 0.65 34500
�1.20 0.743 0.066 2.04 0.66 0.071 1.15 0.78 31700 1550 0.30
�1.25 0.760 0.0308 1.27 0.57 0.084 0.90 0.73 28000
�1.30 0.788 0.0152 0.795 0.65 0.069 0.70 0.72 29700
Ni (expanded mesh 1)
�1.40 0.96 150�10�6 29.4 0.94 205
�1.45 0.97 154�10�6 14.9 0.93 203 10 0.03
�1.50 0.99 158�10�6 8.86 0.94 193
�1.55 1.00 160�10�6 5.24 0.93 194
Previous treatment: H2 evolution at �0.1 A cm�2
After anodic polarization Ni– Mo (expanded mesh 1)
�1.25 0.954 0.0107 0.264 0.76 0.1370 1.91 0.62 H2 evolution at �0.1 A cm�2
�1.25 0.807 0.0104 0.167 0.76 0.0196 2.71 0.68 Five cycles at v ¼ 10 mV s�1
�1.25 0.811 0.0106 0.466 0.65 0.0165 3.25 0.67 1000 s at E ¼ 0.35 V (peak potential)
�1.25 0.806 0.0187 0.207 0.70 0.0119 4.49 0.71 1000 s at E ¼ 0.50 V (O2 evolution)
I N T E R N AT I O N A L J O U R N A L O F H Y D R O G E N E N E R G Y 3 3 ( 2 0 0 8 ) 3 6 7 6 – 3 6 8 73682
to the results presented in Table 3, the Ni–Mo coatings
possess about one order of the magnitude higher intrinsic
activity, while the apparent activity determined from the
polarization curves is over three orders of the magnitude
larger (Fig. 1). It follows that the main contribution to
the improvement of the catalytic properties of the Ni–Mo
coatings toward HER arises not only from the increase of the
real surface area, but also a significant catalytic effect is
present. The catalytic effect could be assigned to the
hydrogen spill-over effect and different mechanism for
the HER on the Ni–Mo catalyst in comparison with the pure
Ni electrode on which the HER takes place by the Volmer–
Heyrovsky mechanism, with the slow step being electroche-
mical desorption of the intermediate Hads at its high-surface
coverage (the unique Tafel slope of E�120 mV dec�1 in the
whole potential range) [17].
The Ni–Mo alloy coating electrodeposited onto mesh 2
exhibits slightly better polarization characteristics than that
electrodeposited onto mesh 1 (Fig. 3b), which is in accordance
with the values of the Rct determined for these electrodes
(Table 3). On the other side this electrode possess lower
roughness factor, which is not in accordance with its higher
catalytic activity. Taking into account considerably different
shapes of these two meshes, lower roughness of the Ni–Mo
coating electrodeposited onto mesh 2 could be expected due
to much better current distribution on its surface during the
process of the Ni–Mo alloy electrodeposition. It is possible
that on such geometry of the mesh HER is slightly faster, but
for any convincing conclusion additional experiments are
needed and will be the subject of our further research.
3.2.1. Cyclic voltammetry, EIS and polarizationcharacteristics of both electrodes after the anodic treatmentIt is often the case in the industrial application that during
the shut down of the power in the industrial production of
chlorine, the electrodes becomes reversely polarized, i.e.
cathodes become anodically polarized, while anodes become
cathodically polarized. Such a polarization can cause sig-
nificant changes in the electrochemical behavior of the
electrodes and they might loose their catalytic properties for
the processes that are taking place on them (hydrogen or
chlorine evolution). In order to investigate the influence of
such a polarization on the Ni–Mo alloy coatings, both
electrodes were exposed to the cycling procedure up to the
potential of the oxygen evolution and to the polarization at a
constant anodic potential in the region of oxygen evolution
and their polarization characteristics, as well as their EIS
results, were investigated.
The CV’s for both electrodes recorded with the sweep rate
of 10 mV s�1 in the 1 M NaOH at 25 1C are shown in Fig. 6a.
As can be seen the shape of both voltammograms is
almost the same as that for the pure Ni electrode, Fig. 6b.
The CV of the fresh Ni electrode, after holding at the
negative potential limit is nominally split into three regions,
A, B and C (Fig. 6b). The region A has been called the
‘‘hydroxide region’’ by some authors or the ‘‘Ni(II) region’’ by
others. At the lower negative limit of the CV hydrogen
evolution is observed, which is probably accompanied by
the hydrogen absorption into the bulk Ni substrate. On the
anodic sweep the peak labeled ‘‘a’’ is observed and this has
been assigned to the formation of the a-Ni(OH)2 [33,34]
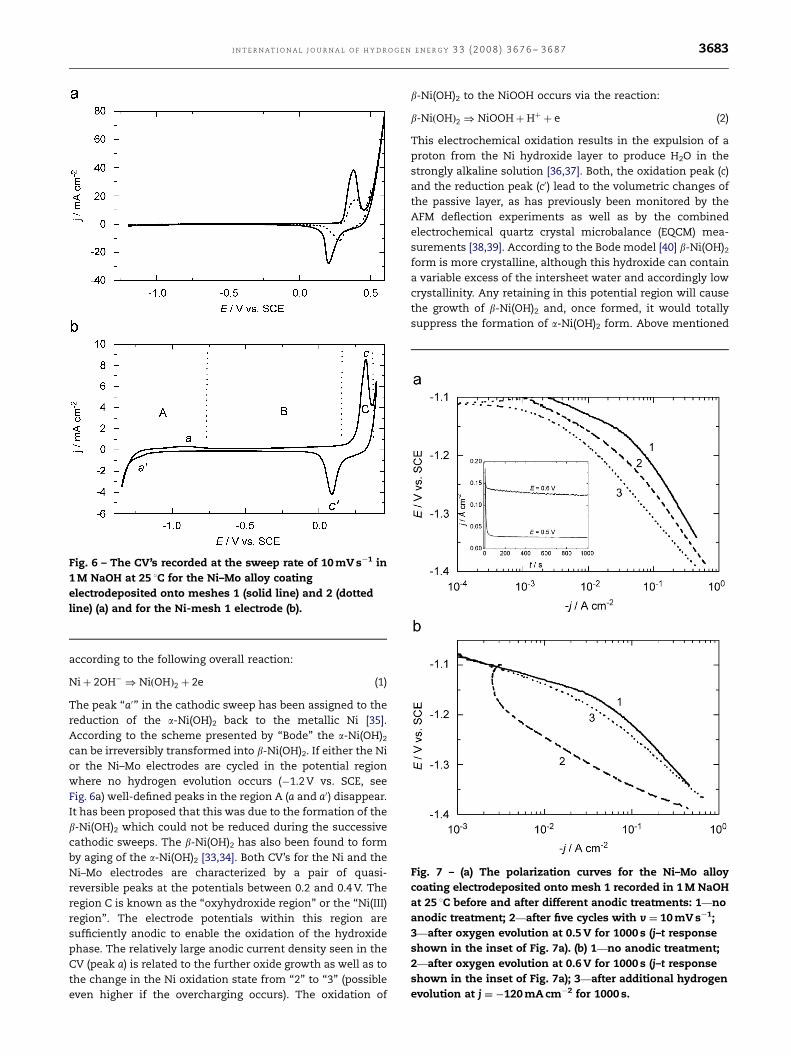
ARTICLE IN PRESS
Fig. 6 – The CV’s recorded at the sweep rate of 10 mV s�1 in
1 M NaOH at 25 1C for the Ni–Mo alloy coating
electrodeposited onto meshes 1 (solid line) and 2 (dotted
line) (a) and for the Ni-mesh 1 electrode (b).
Fig. 7 – (a) The polarization curves for the Ni–Mo alloy
coating electrodeposited onto mesh 1 recorded in 1 M NaOH
at 25 1C before and after different anodic treatments: 1—no
anodic treatment; 2—after five cycles with v ¼ 10 mV s�1;
3—after oxygen evolution at 0.5 V for 1000 s (j–t response
shown in the inset of Fig. 7a). (b) 1—no anodic treatment;
2—after oxygen evolution at 0.6 V for 1000 s (j–t response
shown in the inset of Fig. 7a); 3—after additional hydrogen
evolution at j ¼ �120 mA cm�2 for 1000 s.
I N T E R N A T I O N A L J O U R N A L O F H Y D R O G E N E N E R G Y 3 3 ( 2 0 0 8 ) 3 6 7 6 – 3 6 8 7 3683
according to the following overall reaction:
Niþ 2OH� ) NiðOHÞ2 þ 2e (1)
The peak ‘‘a0’’ in the cathodic sweep has been assigned to the
reduction of the a-Ni(OH)2 back to the metallic Ni [35].
According to the scheme presented by ‘‘Bode’’ the a-Ni(OH)2can be irreversibly transformed into b-Ni(OH)2. If either the Ni
or the Ni–Mo electrodes are cycled in the potential region
where no hydrogen evolution occurs (�1.2 V vs. SCE, see
Fig. 6a) well-defined peaks in the region A (a and a0) disappear.
It has been proposed that this was due to the formation of the
b-Ni(OH)2 which could not be reduced during the successive
cathodic sweeps. The b-Ni(OH)2 has also been found to form
by aging of the a-Ni(OH)2 [33,34]. Both CV’s for the Ni and the
Ni–Mo electrodes are characterized by a pair of quasi-
reversible peaks at the potentials between 0.2 and 0.4 V. The
region C is known as the ‘‘oxyhydroxide region’’ or the ‘‘Ni(III)
region’’. The electrode potentials within this region are
sufficiently anodic to enable the oxidation of the hydroxide
phase. The relatively large anodic current density seen in the
CV (peak a) is related to the further oxide growth as well as to
the change in the Ni oxidation state from ‘‘2’’ to ‘‘3’’ (possible
even higher if the overcharging occurs). The oxidation of
b-Ni(OH)2 to the NiOOH occurs via the reaction:
b-NiðOHÞ2 ) NiOOHþHþ þ e (2)
This electrochemical oxidation results in the expulsion of a
proton from the Ni hydroxide layer to produce H2O in the
strongly alkaline solution [36,37]. Both, the oxidation peak (c)
and the reduction peak (c0) lead to the volumetric changes of
the passive layer, as has previously been monitored by the
AFM deflection experiments as well as by the combined
electrochemical quartz crystal microbalance (EQCM) mea-
surements [38,39]. According to the Bode model [40] b-Ni(OH)2form is more crystalline, although this hydroxide can contain
a variable excess of the intersheet water and accordingly low
crystallinity. Any retaining in this potential region will cause
the growth of b-Ni(OH)2 and, once formed, it would totally
suppress the formation of a-Ni(OH)2 form. Above mentioned
ARTICLE IN PRESS
I N T E R N AT I O N A L J O U R N A L O F H Y D R O G E N E N E R G Y 3 3 ( 2 0 0 8 ) 3 6 7 6 – 3 6 8 73684
behavior points out the irreducible nature of b-Ni(OH)2 form.
Similar and reproducible shapes of the CV curves for the Ni
and the Ni–Mo electrodes confirm that at the electrochemi-
cally deposited Ni–Mo the same surface reactions (1) and (2)
take place without clear evidence for further oxidation of
molybdenum oxides present in the fresh electrode or their
anodic dissolution to MoO42� species.
Already after recording CV’s, the polarization characteris-
tics for the HER on both electrodes change, as can be seen in
Fig. 7a (curve 2) for mesh 1. If this electrode is exposed to
oxygen evolution at 0.5 V for 1000 s (j– t response shown in the
inset of Fig. 7a) and the polarization curve is recorded
immediately after oxygen evolution, the overvoltage for the
HER becomes higher (curve 3). After the additional oxygen
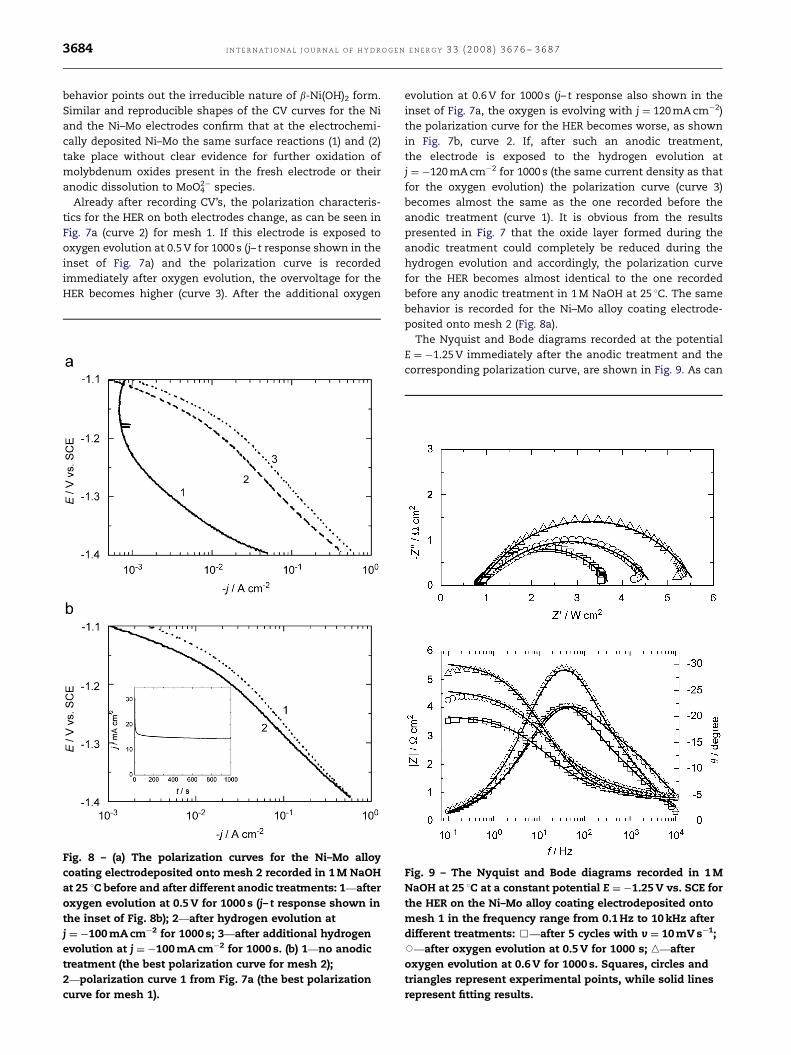
Fig. 8 – (a) The polarization curves for the Ni–Mo alloy
coating electrodeposited onto mesh 2 recorded in 1 M NaOH
at 25 1C before and after different anodic treatments: 1—after
oxygen evolution at 0.5 V for 1000 s (j– t response shown in
the inset of Fig. 8b); 2—after hydrogen evolution at
j ¼ �100 mA cm�2 for 1000 s; 3—after additional hydrogen
evolution at j ¼ �100 mA cm�2 for 1000 s. (b) 1—no anodic
treatment (the best polarization curve for mesh 2);
2—polarization curve 1 from Fig. 7a (the best polarization
curve for mesh 1).
evolution at 0.6 V for 1000 s (j– t response also shown in the
inset of Fig. 7a, the oxygen is evolving with j ¼ 120 mA cm�2)
the polarization curve for the HER becomes worse, as shown
in Fig. 7b, curve 2. If, after such an anodic treatment,
the electrode is exposed to the hydrogen evolution at
j ¼ �120 mA cm�2 for 1000 s (the same current density as that
for the oxygen evolution) the polarization curve (curve 3)
becomes almost the same as the one recorded before the
anodic treatment (curve 1). It is obvious from the results
presented in Fig. 7 that the oxide layer formed during the
anodic treatment could completely be reduced during the
hydrogen evolution and accordingly, the polarization curve
for the HER becomes almost identical to the one recorded
before any anodic treatment in 1 M NaOH at 25 1C. The same
behavior is recorded for the Ni–Mo alloy coating electrode-
posited onto mesh 2 (Fig. 8a).
The Nyquist and Bode diagrams recorded at the potential
E ¼ �1.25 V immediately after the anodic treatment and the
corresponding polarization curve, are shown in Fig. 9. As can
Fig. 9 – The Nyquist and Bode diagrams recorded in 1 M
NaOH at 25 1C at a constant potential E ¼ �1.25 V vs. SCE for
the HER on the Ni–Mo alloy coating electrodeposited onto
mesh 1 in the frequency range from 0.1 Hz to 10 kHz after
different treatments: &—after 5 cycles with v ¼ 10 mV s�1;J—after oxygen evolution at 0.5 V for 1000 s; n—after
oxygen evolution at 0.6 V for 1000 s. Squares, circles and
triangles represent experimental points, while solid lines
represent fitting results.
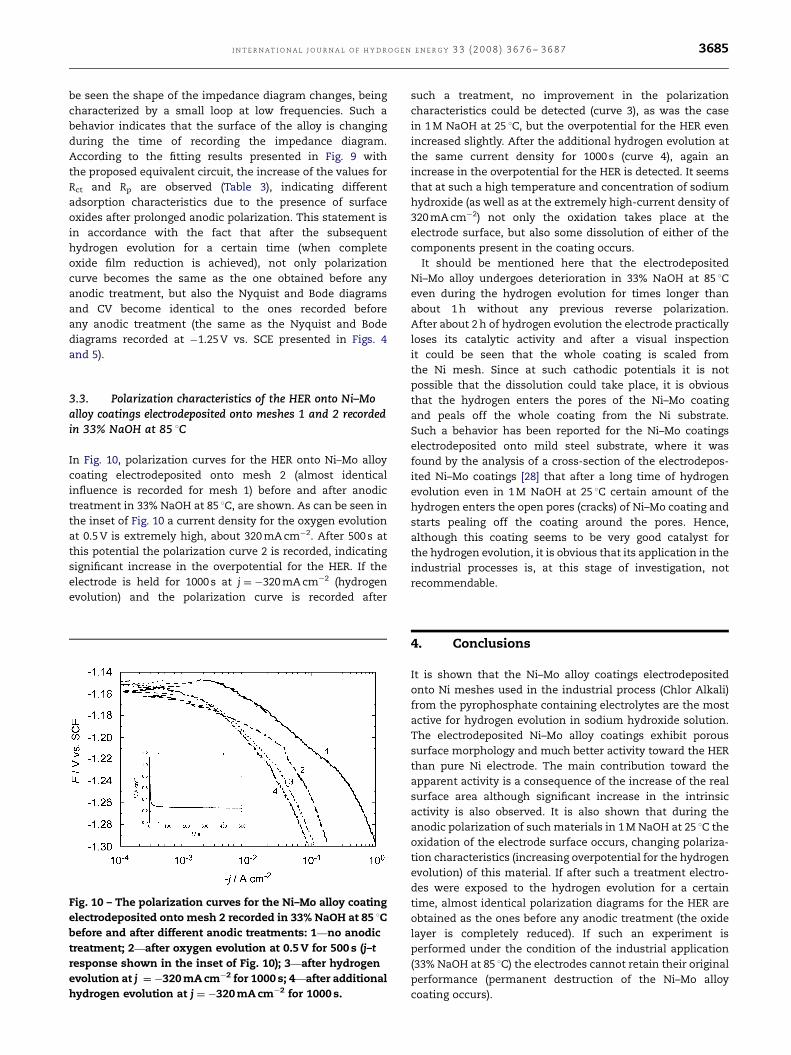
ARTICLE IN PRESS
I N T E R N A T I O N A L J O U R N A L O F H Y D R O G E N E N E R G Y 3 3 ( 2 0 0 8 ) 3 6 7 6 – 3 6 8 7 3685
be seen the shape of the impedance diagram changes, being
characterized by a small loop at low frequencies. Such a
behavior indicates that the surface of the alloy is changing
during the time of recording the impedance diagram.
According to the fitting results presented in Fig. 9 with
the proposed equivalent circuit, the increase of the values for
Rct and Rp are observed (Table 3), indicating different
adsorption characteristics due to the presence of surface
oxides after prolonged anodic polarization. This statement is
in accordance with the fact that after the subsequent
hydrogen evolution for a certain time (when complete
oxide film reduction is achieved), not only polarization
curve becomes the same as the one obtained before any
anodic treatment, but also the Nyquist and Bode diagrams
and CV become identical to the ones recorded before
any anodic treatment (the same as the Nyquist and Bode
diagrams recorded at �1.25 V vs. SCE presented in Figs. 4
and 5).
3.3. Polarization characteristics of the HER onto Ni–Moalloy coatings electrodeposited onto meshes 1 and 2 recordedin 33% NaOH at 85 1C
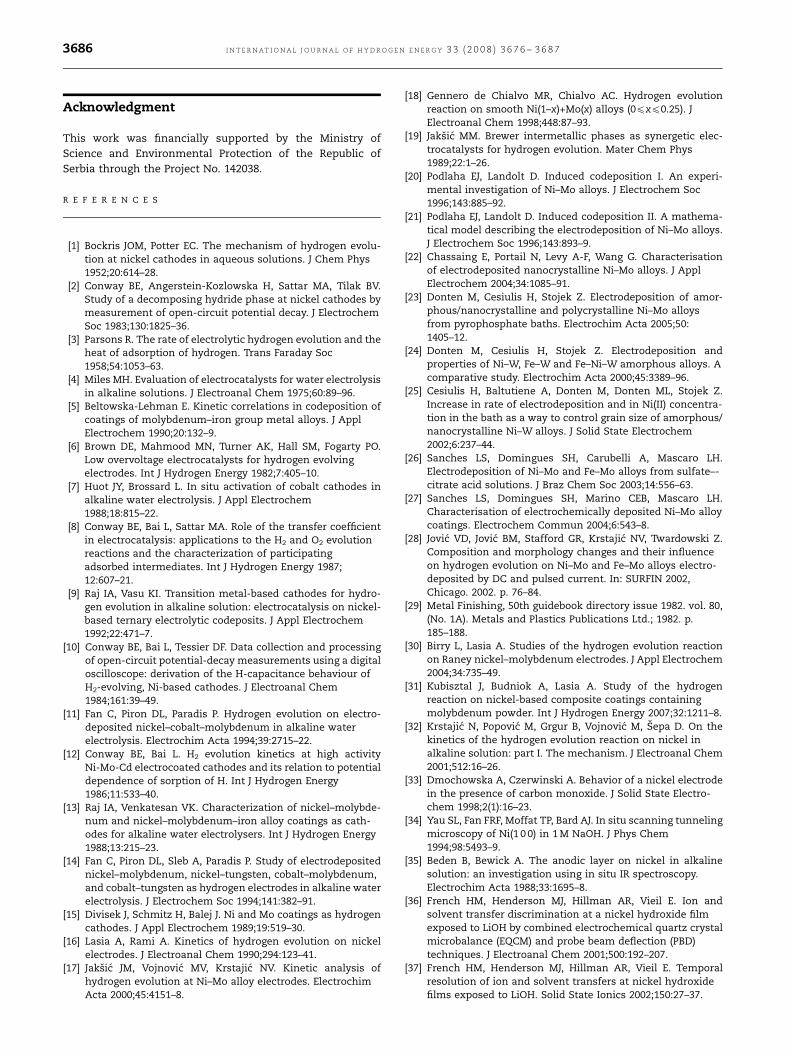
In Fig. 10, polarization curves for the HER onto Ni–Mo alloy
coating electrodeposited onto mesh 2 (almost identical
influence is recorded for mesh 1) before and after anodic
treatment in 33% NaOH at 85 1C, are shown. As can be seen in
the inset of Fig. 10 a current density for the oxygen evolution
at 0.5 V is extremely high, about 320 mA cm�2. After 500 s at
this potential the polarization curve 2 is recorded, indicating
significant increase in the overpotential for the HER. If the
electrode is held for 1000 s at j ¼ �320 mA cm�2 (hydrogen
evolution) and the polarization curve is recorded after
Fig. 10 – The polarization curves for the Ni–Mo alloy coating
electrodeposited onto mesh 2 recorded in 33% NaOH at 85 1C
before and after different anodic treatments: 1—no anodic
treatment; 2—after oxygen evolution at 0.5 V for 500 s (j–t
response shown in the inset of Fig. 10); 3—after hydrogen
evolution at j ¼ �320 mA cm�2 for 1000 s; 4—after additional
hydrogen evolution at j ¼ �320 mA cm�2 for 1000 s.
such a treatment, no improvement in the polarization
characteristics could be detected (curve 3), as was the case
in 1 M NaOH at 25 1C, but the overpotential for the HER even
increased slightly. After the additional hydrogen evolution at
the same current density for 1000 s (curve 4), again an
increase in the overpotential for the HER is detected. It seems
that at such a high temperature and concentration of sodium
hydroxide (as well as at the extremely high-current density of
320 mA cm�2) not only the oxidation takes place at the
electrode surface, but also some dissolution of either of the
components present in the coating occurs.
It should be mentioned here that the electrodeposited
Ni–Mo alloy undergoes deterioration in 33% NaOH at 85 1C
even during the hydrogen evolution for times longer than
about 1 h without any previous reverse polarization.
After about 2 h of hydrogen evolution the electrode practically
loses its catalytic activity and after a visual inspection
it could be seen that the whole coating is scaled from
the Ni mesh. Since at such cathodic potentials it is not
possible that the dissolution could take place, it is obvious
that the hydrogen enters the pores of the Ni–Mo coating
and peals off the whole coating from the Ni substrate.
Such a behavior has been reported for the Ni–Mo coatings
electrodeposited onto mild steel substrate, where it was
found by the analysis of a cross-section of the electrodepos-
ited Ni–Mo coatings [28] that after a long time of hydrogen
evolution even in 1 M NaOH at 25 1C certain amount of the
hydrogen enters the open pores (cracks) of Ni–Mo coating and
starts pealing off the coating around the pores. Hence,
although this coating seems to be very good catalyst for
the hydrogen evolution, it is obvious that its application in the
industrial processes is, at this stage of investigation, not
recommendable.
4. Conclusions
It is shown that the Ni–Mo alloy coatings electrodeposited
onto Ni meshes used in the industrial process (Chlor Alkali)
from the pyrophosphate containing electrolytes are the most
active for hydrogen evolution in sodium hydroxide solution.
The electrodeposited Ni–Mo alloy coatings exhibit porous
surface morphology and much better activity toward the HER
than pure Ni electrode. The main contribution toward the
apparent activity is a consequence of the increase of the real
surface area although significant increase in the intrinsic
activity is also observed. It is also shown that during the
anodic polarization of such materials in 1 M NaOH at 25 1C the
oxidation of the electrode surface occurs, changing polariza-
tion characteristics (increasing overpotential for the hydrogen
evolution) of this material. If after such a treatment electro-
des were exposed to the hydrogen evolution for a certain
time, almost identical polarization diagrams for the HER are
obtained as the ones before any anodic treatment (the oxide
layer is completely reduced). If such an experiment is
performed under the condition of the industrial application
(33% NaOH at 85 1C) the electrodes cannot retain their original
performance (permanent destruction of the Ni–Mo alloy
coating occurs).
ARTICLE IN PRESS
I N T E R N AT I O N A L J O U R N A L O F H Y D R O G E N E N E R G Y 3 3 ( 2 0 0 8 ) 3 6 7 6 – 3 6 8 73686
Acknowledgment
This work was financially supported by the Ministry of
Science and Environmental Protection of the Republic of
Serbia through the Project No. 142038.
R E F E R E N C E S
[1] Bockris JOM, Potter EC. The mechanism of hydrogen evolu-tion at nickel cathodes in aqueous solutions. J Chem Phys1952;20:614–28.
[2] Conway BE, Angerstein-Kozlowska H, Sattar MA, Tilak BV.Study of a decomposing hydride phase at nickel cathodes bymeasurement of open-circuit potential decay. J ElectrochemSoc 1983;130:1825–36.
[3] Parsons R. The rate of electrolytic hydrogen evolution and theheat of adsorption of hydrogen. Trans Faraday Soc1958;54:1053–63.
[4] Miles MH. Evaluation of electrocatalysts for water electrolysisin alkaline solutions. J Electroanal Chem 1975;60:89–96.
[5] Beltowska-Lehman E. Kinetic correlations in codeposition ofcoatings of molybdenum–iron group metal alloys. J ApplElectrochem 1990;20:132–9.
[6] Brown DE, Mahmood MN, Turner AK, Hall SM, Fogarty PO.Low overvoltage electrocatalysts for hydrogen evolvingelectrodes. Int J Hydrogen Energy 1982;7:405–10.
[7] Huot JY, Brossard L. In situ activation of cobalt cathodes inalkaline water electrolysis. J Appl Electrochem1988;18:815–22.
[8] Conway BE, Bai L, Sattar MA. Role of the transfer coefficientin electrocatalysis: applications to the H2 and O2 evolutionreactions and the characterization of participatingadsorbed intermediates. Int J Hydrogen Energy 1987;12:607–21.
[9] Raj IA, Vasu KI. Transition metal-based cathodes for hydro-gen evolution in alkaline solution: electrocatalysis on nickel-based ternary electrolytic codeposits. J Appl Electrochem1992;22:471–7.
[10] Conway BE, Bai L, Tessier DF. Data collection and processingof open-circuit potential-decay measurements using a digitaloscilloscope: derivation of the H-capacitance behaviour ofH2-evolving, Ni-based cathodes. J Electroanal Chem1984;161:39–49.
[11] Fan C, Piron DL, Paradis P. Hydrogen evolution on electro-deposited nickel–cobalt–molybdenum in alkaline waterelectrolysis. Electrochim Acta 1994;39:2715–22.
[12] Conway BE, Bai L. H2 evolution kinetics at high activityNi-Mo-Cd electrocoated cathodes and its relation to potentialdependence of sorption of H. Int J Hydrogen Energy1986;11:533–40.
[13] Raj IA, Venkatesan VK. Characterization of nickel–molybde-num and nickel–molybdenum–iron alloy coatings as cath-odes for alkaline water electrolysers. Int J Hydrogen Energy1988;13:215–23.
[14] Fan C, Piron DL, Sleb A, Paradis P. Study of electrodepositednickel–molybdenum, nickel–tungsten, cobalt–molybdenum,and cobalt–tungsten as hydrogen electrodes in alkaline waterelectrolysis. J Electrochem Soc 1994;141:382–91.
[15] Divisek J, Schmitz H, Balej J. Ni and Mo coatings as hydrogencathodes. J Appl Electrochem 1989;19:519–30.
[16] Lasia A, Rami A. Kinetics of hydrogen evolution on nickelelectrodes. J Electroanal Chem 1990;294:123–41.
[17] Jaksic JM, Vojnovic MV, Krstajic NV. Kinetic analysis ofhydrogen evolution at Ni–Mo alloy electrodes. ElectrochimActa 2000;45:4151–8.
[18] Gennero de Chialvo MR, Chialvo AC. Hydrogen evolutionreaction on smooth Ni(1–x)+Mo(x) alloys (0pxp0.25). JElectroanal Chem 1998;448:87–93.
[19] Jaksic MM. Brewer intermetallic phases as synergetic elec-trocatalysts for hydrogen evolution. Mater Chem Phys1989;22:1–26.
[20] Podlaha EJ, Landolt D. Induced codeposition I. An experi-mental investigation of Ni–Mo alloys. J Electrochem Soc1996;143:885–92.
[21] Podlaha EJ, Landolt D. Induced codeposition II. A mathema-tical model describing the electrodeposition of Ni–Mo alloys.J Electrochem Soc 1996;143:893–9.
[22] Chassaing E, Portail N, Levy A-F, Wang G. Characterisationof electrodeposited nanocrystalline Ni–Mo alloys. J ApplElectrochem 2004;34:1085–91.
[23] Donten M, Cesiulis H, Stojek Z. Electrodeposition of amor-phous/nanocrystalline and polycrystalline Ni–Mo alloysfrom pyrophosphate baths. Electrochim Acta 2005;50:1405–12.
[24] Donten M, Cesiulis H, Stojek Z. Electrodeposition andproperties of Ni–W, Fe–W and Fe–Ni–W amorphous alloys. Acomparative study. Electrochim Acta 2000;45:3389–96.
[25] Cesiulis H, Baltutiene A, Donten M, Donten ML, Stojek Z.Increase in rate of electrodeposition and in Ni(II) concentra-tion in the bath as a way to control grain size of amorphous/nanocrystalline Ni–W alloys. J Solid State Electrochem2002;6:237–44.
[26] Sanches LS, Domingues SH, Carubelli A, Mascaro LH.Electrodeposition of Ni–Mo and Fe–Mo alloys from sulfate–-citrate acid solutions. J Braz Chem Soc 2003;14:556–63.
[27] Sanches LS, Domingues SH, Marino CEB, Mascaro LH.Characterisation of electrochemically deposited Ni–Mo alloycoatings. Electrochem Commun 2004;6:543–8.
[28] Jovic VD, Jovic BM, Stafford GR, Krstajic NV, Twardowski Z.Composition and morphology changes and their influenceon hydrogen evolution on Ni–Mo and Fe–Mo alloys electro-deposited by DC and pulsed current. In: SURFIN 2002,Chicago. 2002. p. 76–84.
[29] Metal Finishing, 50th guidebook directory issue 1982. vol. 80,(No. 1A). Metals and Plastics Publications Ltd.; 1982. p.185–188.
[30] Birry L, Lasia A. Studies of the hydrogen evolution reactionon Raney nickel–molybdenum electrodes. J Appl Electrochem2004;34:735–49.
[31] Kubisztal J, Budniok A, Lasia A. Study of the hydrogenreaction on nickel-based composite coatings containingmolybdenum powder. Int J Hydrogen Energy 2007;32:1211–8.
[32] Krstajic N, Popovic M, Grgur B, Vojnovic M, Sepa D. On thekinetics of the hydrogen evolution reaction on nickel inalkaline solution: part I. The mechanism. J Electroanal Chem2001;512:16–26.
[33] Dmochowska A, Czerwinski A. Behavior of a nickel electrodein the presence of carbon monoxide. J Solid State Electro-chem 1998;2(1):16–23.
[34] Yau SL, Fan FRF, Moffat TP, Bard AJ. In situ scanning tunnelingmicroscopy of Ni(1 0 0) in 1 M NaOH. J Phys Chem1994;98:5493–9.
[35] Beden B, Bewick A. The anodic layer on nickel in alkalinesolution: an investigation using in situ IR spectroscopy.Electrochim Acta 1988;33:1695–8.
[36] French HM, Henderson MJ, Hillman AR, Vieil E. Ion andsolvent transfer discrimination at a nickel hydroxide filmexposed to LiOH by combined electrochemical quartz crystalmicrobalance (EQCM) and probe beam deflection (PBD)techniques. J Electroanal Chem 2001;500:192–207.
[37] French HM, Henderson MJ, Hillman AR, Vieil E. Temporalresolution of ion and solvent transfers at nickel hydroxidefilms exposed to LiOH. Solid State Ionics 2002;150:27–37.

ARTICLE IN PRESS
I N T E R N A T I O N A L J O U R N A L O F H Y D R O G E N E N E R G Y 3 3 ( 2 0 0 8 ) 3 6 7 6 – 3 6 8 7 3687
[38] Hu YN, Scherson DA. Potential-induced plastic deformationsof nickel hydrous electrodes in alkaline electrolytes: an in situatomic force microscopy study. J Phys Chem B 1997;101:5370–6.
[39] Haring P, Kotz R. Nanoscale thickness changes of nickelhydroxide films during electrochemical oxidation/reduction
monitored by in situ atomic force microscopy. J ElectroanalChem 1995;385:273–7.
[40] Bode H, Dehmelt K, Witte J. Zur kenntnis der nickelhydrox-idelektrode—I. Uber das nickel (II)-hydroxidhydrat. Electro-chim Acta 1966;11:1079–87.


