Embed Size (px)
Citation preview
2011 Annual Report
Wyoming Game and Fish
Department
2011 ANNUAL REPORT
Wyoming Game and Fish Department
2011 ANNUAL REPORT Table of Contents
PAGE
Director’s Office and Commission Photographs ............................................................................. i Organizational Chart ...................................................................................................................... iii Director’s Summary ....................................................................................................................... iv INTRODUCTION AND DIVISION REPORTS Introduction ..........................................................................................................................1 Fiscal Division .....................................................................................................................2 Fish Division ........................................................................................................................4 Services Division .................................................................................................................7 Wildlife Division ...............................................................................................................12 PROGRAM-LEVEL REPORTS Aquatic Wildlife Management ...........................................................................................18 Bird Farms .........................................................................................................................24 Conservation Education .....................................................................................................26 Conservation Engineering ..................................................................................................30 Customer Services .............................................................................................................34 Department Administration ...............................................................................................41 External Research ..............................................................................................................48 Feedgrounds .......................................................................................................................52 Financial Management .......................................................................................................55 Habitat ................................................................................................................................61 Habitat and Access Management .......................................................................................72 Habitat Protection ..............................................................................................................79 Information ........................................................................................................................83 Information Technology ....................................................................................................88 Legislatively Mandated Expenses....................................................................................100 Personnel Management ....................................................................................................102 Property Rights (Lands) Management .............................................................................106 Regional Information and Education Specialist ..............................................................112 Regional and Terrestrial Wildlife Management ..............................................................118 Specialized Statewide Law Enforcement.........................................................................124 Statewide Terrestrial Wildlife Management ..............................................................130 Strategic Management .....................................................................................................145 Support Facilities and Personnel ......................................................................................148 Wildlife Health Laboratory Services ...............................................................................152
APPENDIX A INDIVIDUAL MANAGEMENT REPORTS BIG GAME Pronghorn ............................................................................................................ A-1 Elk ....................................................................................................................... A-2 Mule Deer ........................................................................................................... A-3 White-tailed Deer ................................................................................................ A-4 Moose .................................................................................................................. A-5 Bighorn Sheep ..................................................................................................... A-6 Rocky Mountain Goat ......................................................................................... A-7 Bison ................................................................................................................... A-8 TROPHY GAME Black Bear ........................................................................................................... A-9 Grizzly Bear ...................................................................................................... A-10 Mountain Lion .................................................................................................. A-11 SMALL GAME
Cottontail........................................................................................................... A-12 Snowshoe Hare ................................................................................................. A-13 Squirrel .............................................................................................................. A-14
UPLAND GAME Pheasant ............................................................................................................ A-15 Gray Partridge ................................................................................................... A-16 Chukar ............................................................................................................... A-17 Sage-Grouse ...................................................................................................... A-18 Sharp-tailed Grouse .......................................................................................... A-19 Blue Grouse ...................................................................................................... A-20 Ruffed Grouse ................................................................................................... A-21 Mourning Dove ................................................................................................. A-22 Turkey ............................................................................................................... A-23
WATERFOWL Duck .................................................................................................................. A-24 Goose ................................................................................................................ A-25 Sandhill Crane ................................................................................................... A-26 Rail, Snipe, Coot ............................................................................................... A-27
FISHERIES Sport Fisheries .................................................................................................. A-28 Commercial Fisheries ....................................................................................... A-29
FURBEARERS Bobcat ............................................................................................................... A-30 Other Furbearers ............................................................................................... A-31
RAPTORS..................................................................................................................... A-32
NONGAME AND NON-LICENSED USES PROGRAMS ........................................ A-33
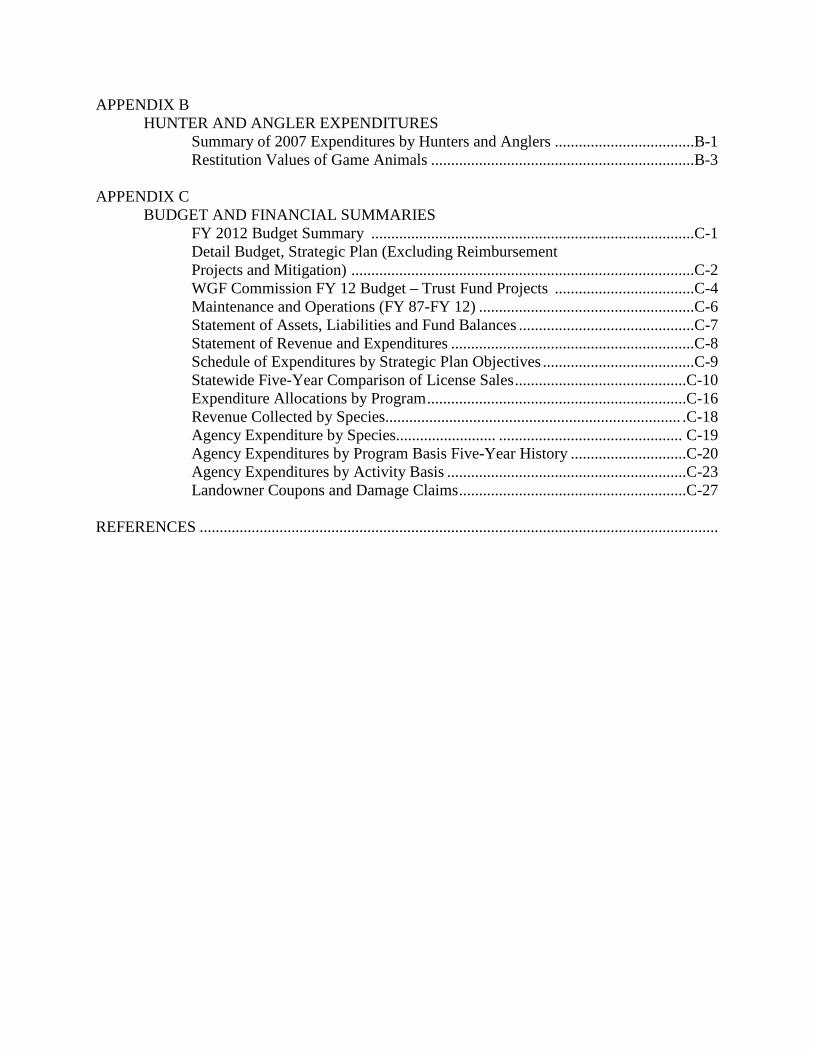
APPENDIX B HUNTER AND ANGLER EXPENDITURES
Summary of 2007 Expenditures by Hunters and Anglers ...................................B-1 Restitution Values of Game Animals ..................................................................B-3
APPENDIX C BUDGET AND FINANCIAL SUMMARIES
FY 2012 Budget Summary .................................................................................C-1 Detail Budget, Strategic Plan (Excluding Reimbursement Projects and Mitigation) ......................................................................................C-2 WGF Commission FY 12 Budget – Trust Fund Projects ...................................C-4 Maintenance and Operations (FY 87-FY 12) ......................................................C-6 Statement of Assets, Liabilities and Fund Balances ............................................C-7 Statement of Revenue and Expenditures .............................................................C-8 Schedule of Expenditures by Strategic Plan Objectives ......................................C-9 Statewide Five-Year Comparison of License Sales ...........................................C-10 Expenditure Allocations by Program .................................................................C-16 Revenue Collected by Species.......................................................................... .C-18 Agency Expenditure by Species......................... .............................................. C-19 Agency Expenditures by Program Basis Five-Year History .............................C-20 Agency Expenditures by Activity Basis ............................................................C-23 Landowner Coupons and Damage Claims .........................................................C-27
REFERENCES ..................................................................................................................................

Scott Talbott
Director
John Emmerich
Deputy Director
External Operations
John Kennedy
Deputy Director
Internal Operations
i
WYOMING GAME AND FISH DEPARTMENT
ADMINISTRATION

WYOMING GAME AND FISH COMMISSION
Fred Lindzey
Commission President Retired Biologist. Professor Emeritus,
University of Wyoming.
Member of Governor’s Brucellosis Task Force.
Represents Sweetwater, Carbon and Albany Counties.
Aaron Clark
Commission Vice President Retired and rancher. Active in energy
development issues around the state.
Represents Platte, Goshen and Laramie Counties.
ii
Charles Price Rancher from Daniel and holds a PhD in Nuclear
Engineering. Member of several cattle associations,
Wyoming Community Foundation and Grizzly Bear
Working Group. Represents Teton, Sublette, Lincoln and
Uinta Counties.
T. Carrie Little Wyoming Territory Manager for
Colorado Casualty Insurance Co.,
alumnus of University of Wyoming
and rancher. Represents Sheridan,
Johnson and Campbell Counties.
Richard Klouda Retired: Wyoming Highway Patrol and
Homeland Security. Represents Fremont,
Natrona and Converse Counties.
Michael Healy Rancher from Worland.
Represents Park, Big Horn, Hot
Springs and Washakie Counties.
Ed Mignery Retired: Electric Utility Engineering Support
Supervisor. Represents Crook, Weston and
Niobrara Counties.
iii
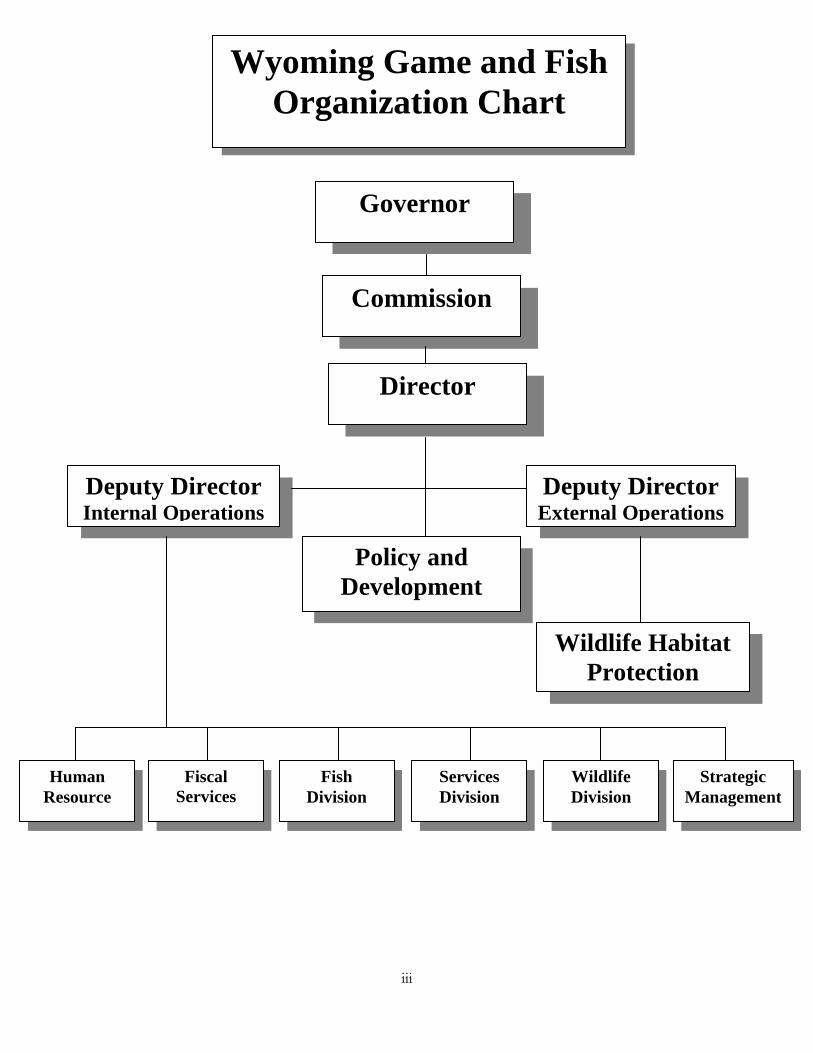
Wyoming Game and Fish Organization Chart
Governor
Commission
Director
Deputy Director Internal Operations
Deputy Director External Operations
Policy and Development
Strategic Management
Human Resource
Wildlife Division
Services Division
Fish Division
Fiscal Services
Wildlife Habitat Protection
iv
Director’s Summary New Director Appointed Scott Talbott, a 26-year veteran of the Wyoming Game and Fish Department (WGFD), was appointed as Director by Governor Matt Mead. Scott began his career as a laborer at the Ocean Lake Wildlife Habitat Management Area in April 1985. He worked his way up the chain-of-command to be named Assistant Chief Game Warden in January 2004, the last position he held prior to being appointed as director.
Scott replaced Steve Ferrell, who joined the Governor’s staff as a policy advisor.
New Chief Game Warden Selected Brian Nesvik, a 16-year veteran of the WGFD, was named chief game warden, effective May 1, 2011. He is the Department’s third Chief Game Warden in 39 years. Brian most recently was the Cody region Wildlife Supervisor, and he also serves as a colonel in the Wyoming Army National Guard, commanding the 115th Fires Brigade.
Brian replaces Jay Lawson who retired after 33 years of service, including 22 years as Chief Game Warden.
New Commissioners Appointed Three new commissioners have been appointed by Governor Matt Mead. T. Carrie Little was appointed on March 1, 2011. Her term will run through March 1, 2017. Commissioner Little is from Leiter, Wyoming, and represents District 4, which includes Sheridan, Johnson, and Campbell Counties. Charles C. Price was appointed on March 1, 2011. His term will run through March 1, 2017. Commissioner Price is from Daniel, Wyoming, and represents District 3, which includes Teton, Sublette, Lincoln, and Uinta Counties. Richard Klouda was appointed on May 9, 2011. His term will run through March 1, 2017. Commissioner Klouda is from Lander, Wyoming, and represents District 7, which includes Fremont, Natrona, and Converse Counties.
Legislative Session The 2011 Wyoming Legislature considered 420 pieces of legislation. The WGFD actively tracked 25 bills and 2 resolutions and monitored 39 bills and 1 resolution. Ten of the bills actively tracked were signed into law, while fifteen died. The following are synopses of eight of the enacted bills that have significant impacts or interest to the Department. Bill Number: HB0076 Title: Game and fish-turkey pioneer licenses. Bill Summary: This bill makes turkey licenses available for purchase by resident applicants eligible to purchase pioneer licenses for a fee of $2.00 and applicants eligible to purchase heritage
v
pioneer licenses for a fee set by the Commission between 60% and 65% ($9 to $10) of a resident turkey license ($15). Bill Number: HB100 Title: Game & Fish – Land Acquisition Bill Summary: This bill prohibits the acquisition of lands by the Game and Fish Commission through adverse possession or prescriptive easement with exception. 03/02/2011: Passed both houses with this conference committee language (in italics): (b) Notwithstanding subsection (a) of this section: “(iii) The commission shall not assert any claim based upon adverse possession or a prescriptive easement as a basis to acquire any interest in real property. Provided, however, that the commission may assert a claim of adverse possession or prescriptive easement as a basis for correcting or interpreting a defect in a written grant of an interest in real property.” Bill Number: HB133 Title: Special Limited Fishing Permits Bill Summary: This bill allows Special Limited Fishing Permits to be issued to accredited schools in Wyoming. The permit would allow students under the age of 18, who are participating in a curriculum based program, to fish during normal school days and hours while under the direct supervision of the school. Bill Number: HB0252 Title: Executive Department Positions Bill Summary: This bill directs the Department of A&I to conduct a study of job classification of directors, executive secretaries, and deputy directors employed by boards and commissions in Wyoming. The study will review those positions classified as at-will or that serve at the pleasure of the governor. The position levels to be reviewed will range from director to division administrator, and may go down to program manager or equivalent. Study results shall be presented to the Joint Labor, Health and Social Services Interim Committee and the Joint Appropriations Committee. The study will estimate costs associated with converting positions to an at-will status, and the process or timeline involved with these changes. The committees will review the study to determine if more at-will status positions in the executive branch agencies and boards and commissions will be more effective and efficient than the current system for citizens of Wyoming. Bill Number: SF0039 Title: Aquatic invasive species-reciprocity Bill Summary: An act relating to Game and Fish, providing for reciprocal agreements with adjoining states recognizing aquatic invasive species program fees, and providing for an effective date. The purpose of this bill is to provide a method whereby the boating opportunities afforded upon artificial impoundments of water forming the boundary between this state and adjoining states may be mutually enjoyed by the residents of Wyoming and the residents of adjoining states that both have AIS decal programs. Bill Number: SF0063 Title: Game & fish-donation of hunting licenses Bill Summary:
vi
This bill provides the holders of a valid big game hunting licenses to surrender said licenses to the Department for reissuance to veterans with disabilities. The veteran to whom a license will be reissued shall be selected and sponsored by a nonprofit charitable organization dedicated to providing hunting opportunities to disabled veterans. Licenses donated under the provisions of this subsection shall not be sold, traded, auctioned, or offered for any monetary value and shall not be issued to any person other than a disabled veteran. The provisions of this section shall not be subject to residency, drawing, or fee requirements. The bill allows a nonresident disabled veteran to hunt on a donated resident license. Bill Number: SF0085 Title: Game and fish violations-penalties Bill Summary: Under the proposed bill, “A third or subsequent conviction within ten (10) years for a violation of this subsection shall constitute a felony punishable by a fine of not less than five thousand dollars ($5,000.00) nor more than ten thousand dollars ($10,000.00), imprisonment for not more than two (2) years, or both. For the purposes of determining whether a violation of this subsection is a felony, convictions resulting from the same occurrence shall be considered a single conviction even if the result of the occurrence is more than one (1) misdemeanor conviction. The provisions of W.S. 6-8-101(a) shall not apply to convictions under this section.” Bill Number: SJ0001 Title: Right to hunt, fish and trap Bill Summary: A JOINT RESOLUTION proposing to amend the Wyoming Constitution by recognizing and preserving the heritage of Wyoming citizens' opportunity to fish, hunt and trap wildlife. BE IT RESOLVED BY THE LEGISLATURE OF THE STATE OF WYOMING, two-thirds of all the members of the two houses, voting separately, concurring therein:
Section 1. The following proposal to amend Wyoming Constitution, by creating Article 1, Section 38 is proposed for submission to the electors of the State of Wyoming at the next general election for approval or rejection to become valid as a part of the Constitution if ratified by a majority of the electors at the election:
Article 1. Section 38. Opportunity to hunt, fish and trap. The opportunity to fish, hunt, and trap wildlife is a heritage that shall forever be preserved to the individual citizens of the state, subject to regulation as prescribed by law, and does not create a right to trespass on private property, diminish other private rights, or alter the duty of the state to manage wildlife.
Section 2. That the Secretary of State shall endorse the following statement on the proposed amendment: The adoption of this amendment will recognize and preserve the heritage of Wyoming citizens' opportunity to fish, hunt and trap wildlife, subject to regulation as prescribed by law.
Leadership Development In summer 2007, WGFD initiated its internal Leadership Development Program. Beginning that fall, the first phase of this program was implemented. Since that first class, 84 WGFD employees have participated in the first level of the program. There have been 12 Action Teams formed during the four classes dealing with issues ranging from improving internal
vii
communication to developing additional ways to increase recruitment of young hunters and anglers. In 2009, the first session of the second level of WGFD’s Leadership Development Program was offered. To date, 37 employees have participated in the second level of the program, which is designed to enhance integrated leadership skills at all levels of the agency. Mule Deer Initiative In FY 2010, WGFD implemented a public participation process to develop management plans for the Wyoming Range and Platte Valley mule deer herds as part of the Department’s statewide Mule Deer Initiative (WMD). In the Wyoming Range, this process began with a series of public surveys to solicit input on the issues most important in managing this herd and to assess attitudes towards various aspects of deer management. Once that information was collected, a series of public meetings in Big Piney, Afton, Kemmerer, and Green River were held. These meetings, conducted through a process called “collaborative learning”, were designed to share information and ideas between the public and the WGFD on the important issues or considerations affecting this herd. Two rounds of meetings were held and the WGFD, using the information from the meetings, has developed a draft management plan for this herd. A third round of meetings in these communities occurred in 2011 to discuss the draft plan in a collaborative manner with the public. In both herd units, surveys revealed the public is aware that habitat is of primary concern to sustain deer numbers. The Department is planning a similar process in the Platte Valley area of southern Wyoming. Department personnel will conduct the initial round of public meetings in August 2011. Additional meetings are planned for fall and winter of 2011 and 2012. WGFD completed “Habitat Assessments” in both herds with the help of the Teton Science School. Nearly a half million acres of deer habitat have been assessed in the Wyoming Range and 400,000 acres in the Platte Valley. These assessments are being used to identify and prioritize needed habitat improvement/management projects. Habitat enhancement projects in both herd units and others throughout the state are being implemented or are ongoing. Estimating wildlife numbers, including mule deer, is a growing science and an aspect of wildlife management that causes uncertainty and suspicion among some constituents. The Department is constantly exploring new methods and techniques to improve its ability to estimate wildlife population size. In the Platte Valley, the WGFD is evaluating a new survey technique to estimate population size. This winter the WGFD will embark on a large-scale mule deer study in this herd unit to evaluate deer movements, habitat use, predation, and the new technique for estimating deer numbers. Work on the MDI throughout the state is ongoing including Chronic Wasting Disease research, habitat evaluations and enhancements, predator management, conservation easements, etc. With the MDI in place, the WGFD is confident that it can sustain and enhance Wyoming’s mule deer populations. Wildlife managers recognize the most fundamental aspect of mule deer management is to maintain deer numbers within the capability of their habitats. Ultimately, the goal of the MDI is to continue to focus the future of mule deer management in Wyoming on those critical aspects indentified to sustain this species at optimum levels.
viii
Hunter and Angler Access In 2011, the Hunter Management Area program enrolled 1,099,125 private acres on 49 management areas. The Walk-in Hunting Program provided 681,683 private acres as well as 43 stream miles and 27 lake acres for waterfowl hunting. In addition to the private acres enrolled in the Walk-in and Hunter Management Areas, the Department’s access work provided access to more than 1,687,000 public acres that otherwise may have been landlocked and inaccessible for public use. The Walk-in Fishing program currently has 58 fishing areas covering 11 drainages. These access areas contain 4,944 lake acres, 299 pond acres, and 97 stream miles available for public fishing. Walk-in programs are funded to a large extent through the Game and Fish AccessYes program. AccessYes contributions from anglers and hunters usually occur at the time of license purchases and applications for limited quota licenses. Brucellosis Each year the WGFD monitors the distribution of brucellosis within the state’s elk populations by requesting that hunters collect blood samples from their harvested animal. Surveillance efforts were again focused on the northwestern herd units. Intensified efforts were centered on hunt areas (HA) that surrounded two domestic livestock herds that experienced brucellosis outbreaks in the fall. Targeted areas included HA 61, 62, 63, and 67, whereas blood, teeth, and tissue samples were collected from hunter-harvested elk in these areas to determine prevalence, age data, as well as to acquire B. abortus isolates for epidemiological investigations. Surveillance outside of the Designated Surveillance Area (DSA) included the South Wind River herd unit (HA 25, 28, and 99), the West Green River herd unit (HA 103), the Wind River Indian Reservation (HA 127), and the Laramie Peak herd unit (HA 7). A total of 1,028 elk blood samples were received, with 616 (60%) being suitable for testing. Overall, seroprevalence in the combined northern herd units was 15.4%; which was very similar to last year’s level of 15.2%. Seroprevalence levels in many of the targeted hunt areas surrounding the positive domestic livestock herds were much higher than the herd unit as a whole; where levels averaged 24% between the four hunt areas and ranged from 20% to 32%. Tissues were collected from 114 hunter-killed adult female elk harvested within the target area, resulting in over 227 tissues for brucella culture. Eight B. abortus isolates were identified, with five of those isolates from elk harvested in HA 61, and one isolate was identified from each the remaining target areas (HA 62, 63, and 67). In the southern herd units, sixty-three suitable samples were received from cows harvested from either the South Wind River or the West Green River herd units. Seroprevalence increased to 3.2%, a level that has not been observed since 1995. Natural oscillations in prevalence of this disease are not uncommon and at this point do not rise to the level of concern. Surveillance was also conducted outside of the known brucellosis endemic area, with no positives identified on serological testing. Over the past 20 years, 1,925 samples from the nonendemic area have been analyzed. To date, this disease has not been documented outside of western corner of the state. No samples were received from the Wind River Indian Reservation (HA 127).
ix
Aquatic Invasive Species The first season following adoption of Wyoming’s Aquatic Invasive Species legislation in 2010 was deemed a success based on the numbers of boats inspected, AIS decal sales, and overall cooperation from boaters. During its 2010 session, the Wyoming Legislature appropriated $1.5 million to the WGFD to implement new programs aimed at preventing introduction of invasive quagga and zebra mussels. Following the session, the Wyoming Game and Fish Commission passed an emergency regulation enabling the Department to take immediate action to deal with the threat. The emergency regulation gave the Commission authority to deal with the issue and also provided for an AIS decal required for boaters before launching in Wyoming. The decal program took effect May 17 and requires all watercraft using Wyoming waters to display the annually required decal. Fees are $10 for motorized watercraft registered in Wyoming and $30 for motorized watercraft registered in other states. The fee for non-motorized watercraft for residents is $5 and $15 for non-residents. Inflatable watercraft 10 feet and less are exempt. The decal is a funding mechanism for the AIS program. In 2010, over 35,000 decals were sold raising over $420,000. In 2010, WGFD personnel inspected 42,169 watercraft at 36 different waters. An estimated 28 percent of the inspections involved nonresident watercraft from 46 states and Canada. In addition, 52 waters were sampled for invasive mussels and to date, all waters have tested negative. In 2011, the Wyoming Legislature appropriated a reduced supplemental allocation of $1,060,976. This reduction will result in a reduced coverage of 10%. Check station interviews in 2010 revealed an unexpected level of vulnerability that was not expected. Boat owners stated they had previously boated on over 800 waters in 45 states, five Canadian provinces, and Mexico within 30 days prior to inspections. Online License Sales Hunters and anglers continue to embrace the online sale of licenses. Especially significant is the increasing numbers of hunters who choose to apply online versus mail-in applications. For the 2011 application period, 80 percent of applications were done online. The Department is moving towards a system in which only paperless applications will be accepted. This will result in more cost savings, reductions in temporary personnel, and greater efficiency in processing licenses. Online sales of stamps and hunting and fishing licenses include antelope, deer, fall turkey, bird/small game, black bear, mountain lion, and fishing. Stamps and permits are also available online including the conservation stamp, pheasant, and elk special management permit. Licenses that have carcass coupons can be purchased online and a receipt of the sale can be printed on the home computer. The actual license is mailed the next business day from the Cheyenne headquarters. Hunters who need the license immediately can purchase it at any of Wyoming’s license agents on the Internet Point of Sale (IPOS) system. The Department is trying to get more license agents involved with the IPOS system. Currently, approximately 170 out of 300-plus agents are on the IPOS system. This is the second year in which the Department has not conducted a supplemental drawing to issue licenses remaining after the initial drawing. Instead of a second drawing, licenses are purchased first come, first served on the Department’s website or from license agents on the IPOS system. As licenses with quotas are purchased online, the computerized system automatically deducts licenses from the
x
quota. This provides hunters with a running tally of areas with leftover licenses and the number of licenses still available in the quota. Grizzly Bear Incidents/Relocations Grizzly bears emerged early from their dens during spring 2010. There were 252 grizzly bear conflicts in 2010 involving 65 management captures of 61 individual bears (4 bears were captured twice). Fifty bears were relocated, 13 removed from the population, and two were released on site. Last year there were 140 conflicts resulting in 28 captures, 19 relocations, and seven being euthanized. Incidents in 2010 include 101 involving livestock damage, 5 involving human injuries with one fatality, and 12 human-caused bear mortality investigations. The Commission made payment to producers in the amount of $106,070.88 for damage to livestock by grizzly bears. This damage included 135 cattle and calves, 298 sheep and lambs, 4 pigs, and 1 horse. Multiple factors are attributed to the increase in bear-human conflicts. Along with the growing population in abundance and distribution of bears, persistent cold temperatures and winter conditions may have negatively affected bear vegetal food phenology and shrub and tree fruiting resulting in poor spring, summer, and fall food conditions. In addition, the whitebark pine crop was one of the poorest on record, exasperating the poor fall foods conditions and probably contributing to the high number of conflicts. Long-term bear numbers and distribution has expanded to fill most suitable habitat. As a result, bears are being found in locations where the potential for conflict is high. These include rural housing areas and farmlands. State Wildlife Action Plan The revised State Wildlife Action Plan (SWAP) was approved by the Wyoming Game and Fish Commission in January 2011 and submitted to the US Fish and Wildlife Service (USFWS) for review in February. The WGFD is currently working to enhance implementation of the plan through investigating performance indicators, revising State Wildlife Grant funding criteria, and better integrating the SWAP into agency-wide strategic planning. WGFD representatives are participating on a project advisory group which is helping to design the USFWS Tracking and Reporting on Action for Conservation of Species system (TRACS). This system is intended to be a web-based, GIS information management system for monitoring and reporting on State Wildlife Grant projects. Strategic Plan The Department is planning to revise its strategic plan and strategic planning process. The last time a similar process was undertaken was in 1994 which resulted in the document Wildlife 2010. Many wildlife and natural resource issues have changed in the last 17 years, and more changes are certain to be a part of Wyoming’s future. Shifts in wildlife and habitat threats, constituent’s interests, regulatory requirements, conservation partners, communication methods, as well as political and economic conditions require state wildlife agencies to be increasingly focused and responsive in how they apply their resources. Goals for the strategic plan’s revision include ensuring Department resources are addressing the greatest future challenges and opportunities for wildlife conservation and recreation, increasing coordination between divisions and work units, enhancing public involvement and political support, improving employee unity and job satisfaction, and providing a mechanism to evaluate the effectiveness of Department
xi
activities. Revision components include reviewing of the Department’s current planning and reporting documents, state and federal statutory and financial reporting requirements, and other wildlife agencies strategic plans. Additionally, agency-wide employee and public surveys on wildlife interests and the role of the Department will be used at a facilitated workshop to help to identify Department priorities and implementation strategies. The strategic plan revision process is expected to take 12 to 18 months. Wolf Management Wyoming continues to argue in court that the state should be given control over the wolves within its boundaries. Calling the U.S. Fish and Wildlife Service’s rejection of Wyoming’s wolf management plan arbitrary and capricious, Wyoming argued that numbers of wolves exceed the baseline populations established by the federal government. Estimates put Wyoming’ wolf population at more than 340 individuals including at least 27 breeding pairs. The federal recovery plan requires that Wyoming, Idaho, and Montana each have a minimum of 10 breeding pairs and 100 wolves to consider the populations recovered. The wolf population for Wyoming, Idaho, and Montana is estimated at more than 1,650 animals. Concerns with Wyoming’s plan center around dual classification, which classifies the wolf as a trophy game species in the northwest portion of the state and as a predatory species in other areas. In Wyoming, trophy game species, which include mountain lions and black bears, have hunting seasons and licensing requirements. Grizzly bears are also classified as trophy game, but have not been hunted since the early 1970s. Animals legally classified as predatory animals do not have closed hunting seasons or license requirements. Governor Matt Mead and representatives from the USFWS have finalized a proposed plan that will ensure a stable and sustainable population of wolves in Wyoming. Under the proposed plan Wyoming will maintain at least 100 wolves and 10 breeding pairs outside of Yellowstone National Park. The Trophy Game Management Area would extend about 50 miles to the south from its current location near the Wyoming/Idaho border. The expansion area would be managed as a Trophy Game Management area from October 15th to the end of February. For all other months wolves would be manages as predators in the extension area. The proposed plan requires approval of the State Legislature, and Governor Mead would like Congressional approval as well. Energy Issues There have been few large scale development projects prepared in the past year. Several of the oil and gas fields are being considered for infill drilling. There has been a keen interest in permitting in situ uranium mines. There has also been significant activity as the implementation of the Jonah Field Record of Decision (ROD), the Pinedale Supplemental Environmental Impact Statement (SEIS) ROD, and the Atlantic Rim ROD are being reviewed. The USFWS has affirmed that Wyoming’s core sage-grouse management strategy provides an adequate regulatory mechanism, if implemented as outlined in Executive Order 2011-5, to prevent any decline in sage-grouse numbers caused by various development activities including mining, oil and gas, and wind energy.
xii
Wind Energy The WGFD finalized the “Wildlife Protection Recommendations for Wind Energy Development in Wyoming.” There were two projects that have been permitted using the recommendations. Sage-Grouse Governor Mead reissued a Sage Grouse Executive Order (SGEO). The 2011-5 SGEO follows previous Executive Orders issued by Governor Freudenthal although there are a few variances. The main focus has been on the interpretation, implementation, and documentation of decisions related to the SGEO. The state is creating an online web application that can be used to determine projects impacts to the SGEO density and disturbance thresholds. To date, the SGEO has been accepted by all state agencies and is being reviewed by the BLM in their Resource Management Plan Sage-Grouse Revision
Chronic Wasting Disease Testing continued for Chronic Wasting Disease (CWD) in white-tailed and mule deer, elk, and moose in various locations of the state. WGFD divides the state into eight administrative regions with the goal to test 500-600 deer from each region utilizing hunter harvest, road killed, and targeted animals. Although the 2011 surveillance efforts are still underway, as of December 1st, 2,911 deer, elk, and moose samples had been analyzed. Of these, 103 tested positive for CWD, representing 79 mule deer, 14 white-tailed deer, and 10 elk. In 2005, the Department included moose in the CWD surveillance program. During FY 2011, 136 hunter-killed, 37 targeted and 18 road-killed moose were surveyed with no moose testing positive for CWD. Bark Beetle A mixture of roads and campgrounds were closed this past hunting season in areas affected by pine beetles. However, while access was limited in a few areas, alternate routes still allowed most hunters to get into preferred hunting locations. Road and campground closures were mostly due to Forest Service operations to remove dead trees that were deemed hazardous on a few roads and specific campgrounds. The Forest Service will be continuing their tree removal programs, but to date there, has not been a major overall impact to limiting forest use by hunters and anglers. Wyoming Hunting & Fishing Heritage Expo The Expo is a free educational event for all ages and skill levels featuring outdoor activities including shooting, fishing, canoeing, and archery. The Expo has many activities geared towards school-age youth and is held on a Thursday-Friday-Saturday as many schools have day-long field trips to the Expo during school days. The 2010 Expo attracted 8,701 students during the two school days, an increase of 324 students from 2009. Total attendance was 12,565, an increase of nearly 600 from 2009. Wyoming Hunter Mentor Program Wyoming’s Hunter Mentor program continues strong for both youth and adults. The number of hunters that have been mentored is now at 2,532. So far this year, 879 hunters have been mentored. In 2010, 1,124 hunters participated in the Hunter Mentor program. A wide range
xiii
of ages are represented. The Hunter Mentor program provides a means to go hunting for those who have yet to complete a hunter education class. A person can be mentored for one year. After that, hunter education certification is required. Most of the mentees enroll in a hunter safety class after their mentor year. Mentors are required to be at least 18 years of age and have hunter safety certification and a valid Wyoming hunting license. Hunter and Angler Recruitment and Retention While participation in hunting and angling has been declining nationally, Wyoming’s sale of hunting licenses has remained relatively steady since the early 1990s. The sale of fishing licenses since the early 1990s has been on the rise. However, it is important for Wyoming to take action now to avoid following the national trend. Hunters and anglers not only pay for conservation efforts and wildlife management through the sale of licenses and excise taxes on equipment, but they also contribute to national and local economies. In 2006, hunters and anglers contributed $76 billion to the national economy and $684 million to Wyoming’s economy (2006 National Survey of Fishing, Hunting and Wildlife-Associated Recreation). The WGFD has developed a statewide plan and working group to oversee and implement a wide variety of hunter and angler recruitment and retention programs. WGFD also organized and hosted a Hunter and Angler Recruitment and Retention Summit for Wyoming in the summer of 2010. This summit was attended by other state and federal agencies in Wyoming, as well as NGOs and other groups to develop programs that all of the participants could work on together towards the shared goal of hunter and angler recruitment and retention.

INTRODUCTION
DIVISION REPORT NARRATIVES
1
INTRODUCTION This report covers the progress and financial status of the Wyoming Game and Fish Department during Fiscal Year 2011. The information documents progress toward objectives stated in the Wyoming Game and Fish Department’s Four-Year Plan (FY 07-FY 11), September 2011. During calendar year 2010 a total of 3,665,862 hunting and fishing recreation days were provided to the public. Based on hunting and fishing expenditure surveys conducted in Wyoming, since 2006, hunters, anglers, and trappers expended approximately $684,109,000 in pursuit of their sport. At the end of the period covered by this report (June 30, 2011), the Department was comprised of 401 permanent full-time employees and 148 temporary or seasonal workers. A summary of Department activities by respective division follows.
2
FISCAL DIVISION Rich Reynders, Chief
In FY 11 the Fiscal Division concentrated on implementing much of the remaining functionality needed for the Department’s licensing programs in addition to continuing to be involved in the implementation of the Aquatic Invasive Species program along with securing additional legislative funding for this program. The Division oversees all financial operations of the Department, including budget development, financial reporting, accounts payable, purchasing, asset management, federal funds (grant) management, contract management, revenue collection, and licensing. Additionally, the Division is responsible for the operation and maintenance of various automated systems for licensing, revenue reporting, cost accounting, vehicle management, credit card payments and other accounts payables, landowner coupons, and time reporting. During FY 11, the Fiscal Division, working with Services Division IT personnel, was able to complete several additional components of the ELS (electronic licensing system). Due to changes in federal legislation on the use of social security numbers, the Department oversaw the conversion of approximately 600,000 sportsperson identification numbers to random generated numbers, in addition to capturing the last four digits of social security numbers and maintaining this information in a secure, non public section of the Department’s licensing database. This conversion and capture of data required programming enhancements by the IT section in addition to testing and fiscal proofing of these records. Modifications in the Commission’s license regulations for big game species, allowed applicants to apply for and receive a second license for certain hunt areas and types within the state. This change, which was put into place both to increase harvest and to move the Department closer to population objectives as well as to provide additional hunting opportunities for sportspersons, required programming changes and testing, before this update could be put into production. Expansion in the number of individuals applying for and purchasing licenses through the internet has increased to almost 80% of all limited quota applicants. This change in application method has allowed the Department to reduce use of temporary staff by over 75% from FY 06 in addition to being able to conduct draws earlier. The Department continues to move forward toward more automated methods for both collecting and disseminating licensing information. It hopes to move to having application information available only through the internet in the future to reduce printing and mailing costs. The Department currently manages and maintains its licensing systems in-house, a trend that reflects the majority of other state wildlife agencies, who either have or are in the process of pulling their systems in-house due to escalating vendor rates and instability with external vendors of licensing systems. The Division was also tasked with issuance of the new Aquatic Invasive Species decal approved during the 2010 Legislative session. The Department prepared an initial budget for this program in 2010 and then appeared before the Legislature requesting a supplemental appropriation in February 2011 to continue general funds for this program for its second season, 2011. As part of the inspection and decontamination program, the Department was authorized to issue and charge a fee for decals to partially offset the cost of operating the program. In the fall of 2010, the Department captured information on those watercraft owners who had received temporary decals, and followed the data capture with billings to those individuals. Additionally, the
3
Department worked with IT to stream-line the second season of decal issuance and fulfillment, including the elimination of the manually issued decal by field personnel. In the first two seasons of the program, the Department has collected slightly over $800,000 through decal issuance to offset approximately 1/3 of the cost of operating this program. For the 2011 Legislative session, the Department also prepared and presented a supplemental budget request for capital construction projects and received $932,000 to fund four Department projects - water treatment work at the Wigwam Rearing Station, continued ADA comfort station replacements/additions, development at public access areas, and replacement of elk fences. At the end of FY 11, the Department began the process of developing the 2013-2014 biennium general fund budget request for the five existing general fund programs - Vet Services, Sensitive Species (SWAP), Sage-Grouse Management, Aquatic Invasive Species, and Wolf Management (damage). General funds now provide approximately 7% of the Department’s operating budget. The Division also continues to prepare the Commission budget, which is developed on an annual basis and presented to the Commission for review and authorization each April. The number of grants that the Division administers has continued to grow, with the Department now receiving approximately 31 percent of its revenue from federal, state, and private grants. During FY 11, the Department expended over $5.8 million from competitive grants. Just five years previously, that figure was $1.3 million, equating to an almost 400% growth during that period. This figure does not include federal funding from PR/DJ funds or State Wildlife Grants (SWG), which are formula-based grants (non-competitive) from US Fish and Wildlife Service (USFWS). The Department receives grants from more than ten federal agencies (USFWS, USDA Forest Service, Bureau of Land Management, Bureau of Reclamation, Natural Resource Conservation Service, U.S. Coast Guard, Department of Homeland Security, Environmental Protection Agency, U.S. Geological Survey, and USDA Animal and Plant Inspection Service) in addition to a number of state and local government entities and non-for-profit organizations. An important new source of grant funds since 2008 has been the Wyoming Wildlife and Natural Resource Trust, a state agency, whose board reviews and approves grant applications for wildlife projects, and has provided funding to the Department in addition to other conservation entities, such as local conservation districts. During FY 11, over $2.3 million was received from grants funded by this entity to the Department for work completed on wildlife projects. In summary, the Fiscal Division is the primary source of financial information for the Department and the point of contact for all internal and external state government financial audits.
4
FISH DIVISION Mike Stone, Chief
The Fish Division is responsible for the management of all aquatic wildlife including fish, mollusks, crustaceans, amphibians, and reptiles. We continue to strive to meet the dual purpose of conserving native species and maintaining high quality, sportfishing opportunities. The Aquatic Invasive Species (AIS) program first initiated in FY 10 emphasized watercraft inspection, monitoring, and outreach. In addition the program was tasked with initiating a new user fee, the AIS watercraft decal. Over 42,000 watercraft inspections were performed at 36 waters. Monitoring for Quagga and zebra mussel veligers (juvenile) and adult forms was conducted at 44 waters; all tests proved negative for their presence. Outreach was successful as the boating public adopted the “Drain, Clean, Dry” message and practices. Decal receipts that totaled just under $450,000 were disappointing as we estimated receipts would total $750,000. The expedited roll out for the program was enabled by full participation from the Fish Management Section. All told, personnel from that section contributed more than 11,000 hours to the program. A report was prepared for a joint committee of the Travel, Recreation, Wildlife, and Cultural Resources Wyoming Legislative Committee (TRW) that reviewed the inaugural AIS inspection season and made recommendations for long-term funding. Requests for additional permanent personnel, though supported by the TRW, were not funded in the $1.06 million supplemental budget appropriation approved by the Legislature in March. The budget did include sufficient funds to hire an additional 10 temporary positions to maintain comparable levels of boat inspections and lake monitoring for invasive mussels. Six of these positions were hired as crew leaders that took over supervision and direction of the AIS technicians. The TRW chose AIS program funding as an interim study topic following the 2011 legislative session. This legislative body continued to express support for additional AIS program funding and personnel in order to increase program capacity, consistency, and effectiveness. All state reservoirs filled and even spilled for a second consecutive year. River flows also ran at unprecedented levels through June. The unfavorable spring weather that led to the huge water year diminished angler participation somewhat. High fuel prices and the miserable economic conditions experienced in the region may have also contributed to the downturn in angler participation and license revenue. Angling participation was estimated at nearly 2,331,500 angler days or about two percent less than last year. The fishing regulations approved for 2011-2012 included many consolidations and revisions meant to reduce regulatory impediments that may have hindered angling participation in the past. Revision of our basic planning documents, Basin Management Plans (BMP) was completed in FY 11. Completion of these was delayed one year due to initial implementation of the AIS program last year. The State Wildlife Action Plan (SWAP) revision was completed in 2010.
5
Division efforts to implement actions noted in these plans were hindered by the start-up of the AIS program in FY 11. Consequently, we surveyed 608 streams and lakes or 142 fewer waters than in FY 10. Many of those surveys were designed to monitor sport fish management strategies. Others were designed to survey native species of concern as identified in the State Wildlife Action Plan (SWAP) for the Big Horn, Powder, Belle Fourche, Niobrara, Little Missouri, Cheyenne, and Green River basins. Work continued for our native herptiles especially in areas where increased sampling was warranted due to potential impacts associated with natural gas-field development. Funding through the State Wildlife Grants (SWG), the Governor’s Endangered Species Office, and General Fund appropriations fueled these efforts. Intensive population estimates were also conducted most notably on the North Platte, Green, Bear, Snake, Salt, Greys, Hoback, Wind, Bighorn, Shoshone, and Tongue Rivers for both wild and stocked fishes. Enhanced water conditions this year provided better opportunities to survey sport fisheries on our major rivers and tailwaters. Population trends showed our sport fisheries greatly benefited from the very favorable water years we have recently experienced. Aquatic Habitat Section continued to demonstrate increased productivity on many fronts this year. On-the-ground projects implemented in FY 11 included improvements on Crow Creek and Spread Creek in the Jackson Region, stream bank and fish habitat improvements on the East Fork Wind River in the Lander Region, the Encampment River in the Laramie Region, Thomas Fork Creek in the Pinedale Region, and the completion of the Tongue River Diversion rehabilitation in Ranchester. Maintenance and tuning work at the Kendrick fish passageway on Clear Creek was also accomplished in order to ensure that the fishway passes all native fishes. Fish passage accomplishments included initiation of a diversion and screen modification on Bear Creek and dedication of the fishway on Bitter Creek at Sidon Canal. We continued to populate our Fish Passage Database in a manner that allows us to better prioritize where work should be conducted on waterways throughout the state. This has led us to continue to provide block grants to several Conservation Districts that incorporated fish passage into irrigation diversion structures on the Powder and Tongue Rivers. We also continued a very productive fish passage partnership with the Trout Unlimited; together great work was accomplished for Bear River cutthroat trout in tributaries to the Smiths Fork River, while projects in the Greybull River drainage improved habitat connectivity for Yellowstone cutthroat trout. In FY 11, instream flow water rights field studies were completed on nine different stream segments. This will culminate in the filing of instream flow water rights for up to 14 stream segments in FY 12. Water Management also provided technical support and direction to the Commission’s efforts to acquire additional water rights for the benefit of fisheries in Pine Creek and the New Fork River. Fish Culture operations produced and stocked a total of 408,748 pounds of trout, kokanee, and grayling. Fish production setbacks were suffered due to Myxobolus cerebralis (Mc)
6
infections in the spring water sources at the Ten Sleep Hatchery and Wigwam Rearing Station were offset by increased production at the Speas Rearing Station. Overall, fish production increased by 21,322 pounds (5.5 percent increase) compared to FY 10. This is the highest production level achieved over the past seven years. Since FY 09 total fish production has increased nearly 30%. The expansion and modernization of the Speas Rearing Station was the primary reason for this increase. Warm or cool water sport fishes not available in Wyoming are received in trade for surplus grayling and trout eggs. This year we stocked seven coolwater and warmwater fish species including: bluegills, black crappie, sunfish hybrid, largemouth bass, northern pike, shovelnose sturgeon, and walleye. These totaled 903,336 fish with the majority being walleye fingerlings (525,504) stocked to maintain our walleye sport fisheries. Of special note this year was the success seen with our California golden trout (GDT) brood stock. This brood stock is held at the recently renovated Story Hatchery. Numbers of eggs produced far exceeded expectations; the final count totaled 104,289 eyed eggs. This fully met Department requests for the first time since 1993. Egg availability was sufficient to provide 20,000 GDT eggs to the state of Idaho. Because this is the first successful captive GDT brood stock in the nation, we anticipate it will play an increasingly important role in many states’ golden trout programs in the coming years. While fish production is most easily reported in terms of quantity, the primary concern for our Fish Culture Program is to grow and release high quality fish. This is done by not overstocking facilities and incorporating modern fish health practices that emphasizes optimum, not maximum, production levels. In this fashion we achieve a greater return on our stocking investment regardless of whether we were trying to improve a sport fishery or restore a native trout fishery. Although adjustments were needed in FY 11 to address whirling disease losses, the Fish Culture Program continued to adequately meet fish stocking requests. Coupled with the most favorable reservoir pools in a decade, the stocking of more than 21,000 additional pounds of trout this last year should produce very good fishing in the future.
7
SERVICES DIVISION Brian Foster, Chief
The Services Division is committed to achieving the Department’s mission by increasing public awareness of all Wyoming’s wildlife issues, strengthening support for the Department, conserving and enhancing wildlife habitat, providing increased access for recreational opportunities, maintaining healthy wildlife populations, and providing technical support critical to the success of the Department. The Division is administered by the Division Chief, Assistant Division Chief for Habitat/Technical Support, and Assistant Division Chief for Information and Education. The Assistant Division Chiefs are responsible for the administration of nine work units through two distinct sections. The Division’s Habitat/Technical Support Section includes Lands Administration (acquisition program), Conservation Engineering, Game and Fish Laboratory, Habitat and Access Maintenance, and Information Technology/GIS. The Information & Education Section includes Conservation Education Regional Information and Education (I&E), Information/Publications, and the Customer Service (Telephone Information) Center. During FY 11, the Services Division Administration continued to focus on providing consistent leadership and improving communications within the Division and between the Division and other work units in the agency. Priorities and expectations for each work unit in the Division continue to be established through formal planning processes that involve all work units in the agency. The Division Administrators and Program Supervisors continued to attend other division and regional coordination meetings to improve communications, discuss priorities and expectations, and communicate management strategies specific to the Division. Division Administration will continue to focus on improving internal communications, developing priorities and expectations that are responsive to the other work units and consistent with the Director’s goals/objectives and the agency’s mission.
FY 11 Services Division priorities: • Continue to recruit and promote the best-qualified candidates for positions within the
Division; administration will be directly involved in all hiring processes. • Work with the regions, Property Rights Team, and Commission on high-priority access
projects and conservation easements; continue with acquisition process improvements. • Continue work with the Fiscal Division on defining priorities for the Electronic Licensing
Service (ELS) Online Licensing System and working to move the system to maintenance status.
• Improve agency credibility and public support through information, education, and outreach. • Work with the Property Rights Team and Commission on proactive fee title and less than fee
title land acquisitions. • Implement goals, objectives, and strategies of the Strategic Habitat Plan. • Continue work on Department television programs and/or documentaries. • Improve processes and individual work unit performance in the Division. • Coordinate major conservation education efforts and agency programs, including the Hunting
and Fishing Heritage Exposition (Expo).
8
• Participate on committees of the Association of Fish and Wildlife Agencies and Western Association of Fish and Wildlife Agencies.
• Develop and implement hunter and angler recruitment and retention programs. During FY 11, Services Division accomplished several major projects including: • Coordinated with the Director’s Office, other division administrators, and the regions to
discuss and establish priorities for Services Division Administration and all work units in the Division.
• Worked with the regions, Property Rights Team, and Commission to further streamline the process for acquiring fee title and less than fee title property rights; coordinated and facilitated Property Rights Team meetings on a regular basis.
• Completed Information and Education (I&E) work planning/prioritization processes and established priorities; continued work to improve coordination and communications among all the I&E work units through the I&E Leadership Team.
• Continued to coordinate and implement strategic information/media plans for a variety of high-priority issues including the agency’s mission, funding constraints, chronic wasting disease, brucellosis, wolves, grizzly bears, and energy development.
• Developed alternative funding proposals and plans for capital construction projects. • Completed oversight of a new building addition and coordinated moves that brought all
employees back to the headquarters office. • Worked with the Wildlife Division to complete implementation of the Wyoming Mule Deer
Initiative through the Human Dimensions program and prepared a draft plan for the herd unit. The major portion of this work resulted in a public participation process called “Collaborative learning”.
• Initiated work to develop a hunter and angler recruitment and retention program. During FY 11, the Division’s Habitat/Technical Support Section accomplished several major projects including: • The IT/GIS Branch continued direct involvement on State IT committees that are responsible
for the oversight, policy development, and overall IT business processes for all State government; migrated the entire Department from our old GroupWise to a new statewide Gmail e-mail system; were heavily involved in technology aspects of the Cheyenne Headquarters Office renovation project, which included working closely with engineers, architects, and contractors to design a modern data center complete with a temperature controlled and conditioned power environment; continued migration of database systems at the Cheyenne Headquarters to a server farm for improved performance, security, and implementation of our critical business systems; continued to provide substantial support to the development of the agency’s ELS Online Licensing System (over $65 million processed through our e-commerce systems in 2010); enhanced and streamlined the Internet Point of Sale System (IPOS), which services over 210 license selling agents throughout Wyoming; incorporated a new Boats Issuance and Renewal System into the IPOS application this past year, which included all inventory/accounting functionality needed for the Fiscal Division as well as our license selling agents; developed an Internet content management system with new Web site design incorporated and readied it for implementation; installed new Web application firewalls and continued to update security practices to address Payment Card Industry Data Security Standards (PCI DSS) e-commerce
9
compliance requirements; initiated the re-design and re-development of our GIS-based Decision Support System to an online application with a publicly accessible component within the larger context of the Western Governors Association efforts to develop Crucial Habitat Assessment Tools; and coordinated technology and network needs for the Cheyenne Headquarters Office renovation and new construction project.
• The Cheyenne Headquarters Addition and Renovation Project was completed. The overall $14.5 million project was made possible by funding from the Wyoming Legislature. Approximately $10.2 million of work was completed by the end of the project which included major renovations to the existing building along with the construction of a new 38,000 square foot addition. All employees were moved into their permanent offices by the end of May 2011.
• Boundary surveys were completed at the Lusby access easement, Tom Thorne/Beth Williams Unit, and the Kemmer Easement and Parking Areas, along with engineering surveys for the Wick and Horse Creek WHMA and the North Cody Access partnership with the Bureau of Reclamation. Numerous legal descriptions for conservation easements were prepared. Water right applications and petitions were processed for the Department.
• The Drafting Section designed construction plans for the Cody Pole Building, Laramie Loft, and the Headquarters new Wildlife Display Area. Maps were drafted for the Regional Office Crisis Plans, PLPW Walk-in Hunting Atlas, Hunter Management Area brochures, and Upper North Platte River Float Map. All internet maps were updated for Department Administered lands. Signs and banners were designed and created for the Hunting & Fishing Heritage Expo, Old West Invitational Turkey Shoot, and the Youth Camp and Hunter Education Camp. The Drafting Section also designed and ordered over 3,900 informational, regulatory, and guide signs for the Department.
• Habitat and Access personnel accomplished projects at the following areas: At Table Mountain WHMA, 50 acres of food plots were planted, including 10 acres of Roundup®- ready corn, 10 acres of irrigated sunflowers, and 20 acres of a seed mix, which contained foxtail millet, sorghum/sudangrass hybrid, alfalfa, sunflowers, and buckwheat. At Springer/Bump Sullivan WHMA, 173 acres of dense nesting cover was planted with 168 acres on the new Thaler property section. One hundred and twenty acres of warm season grasses were planted under the irrigation pivot on the north side of the Thaler property. Sixty-six acres of cool season grasses were planted on the remainder of the property outside of the irrigation pivot.
• At Rawhide WHMA, the branch formed a coalition of interested parties to develop and implement plans to remove the state-designated noxious weed Russian olive (Elaeagnus angustifolia), which displays invasive characteristics in riparian areas. The coalition includes Goshen County Weed and Pest, 2-Shot Goose Hunt, Pheasants Forever, National Wild Turkey Federation (NWTF), NRCS, and members of the Goshen County Weed Coordinated Resource Management group.
• The Diamond Creek Wetland was completed in November 2010. This involved replacing a washed out earthen dam with a steel piling/rock structure designed with a gate for future wetland maintenance. Approximately 2,500 cubic yards of accumulated silt was also removed and placed at an upland barrow site. At Yellowtail WHMA, the Bigfork Canal Final Phase began in December to reconstruct the steep hillside portion of the Bigfork canal and install a 48” pipeline to transport water to a siphon. This canal provides all of the
10
irrigation and pond filling water for ~640 acres of crops and cover fields, and three large ponds.
• At Renner Russian WHMA, Russian olive trees were mechanically removed from Zeisman canyon utilizing a tracked excavator with a mulching head. Re-growth was chemically treated in the fall and will be monitored and treated in following years.
• At Horse Creek WHMA, the lower meadow was irrigated in 2010. Approximately 60 acres on the elk feedground received multiple coverings of water from June through August. The meadow was then mowed with the goal of removing the tall and decadent grasses and having fresh protein-rich new growth come up in the fall for elk before feeding operations begin. At South Park WHMA the eastern developed wetland was restored in 2010. The islands and shoreline were excavated in 2009. In 2010, over 10,000 bare root sedges and rushes were planted in the newly excavated areas. Native seed was also planted on the upland excavated areas. Also, 36 pieces of wetland sod were set in place that had a mix of rushes and sedges.
• Over 98 miles of elk fence was maintained on Soda Lake WHMA, Greys River WHMA, South Park WHMA, Muddy Creek Feedground, Horse Creek WHMA, Kerns WHMA, Amsden WHMA, and Bud Love WHMA.
• At the Spence Moriarty WHMA, 200 ft. of bank was restored with 25 yards of rock and 20 trees were used to increase overhead cover for fish and provide bank protection during high flows. At the Inberg/Roy WHMA, a conifer removal project began along Bear Creek to enhance riparian deciduous vegetation, increase soil moisture and invertebrate biomass, and thereby improve aquatic habitat. Twenty-five acres of conifers were removed and over 80 trees were cut and hauled out of Bear Creek. At the Wick WHMA, seven miles of electric fence was installed to manage the one-year livestock grazing treatment as required on the 2,880-acres of State lands inside the WHMA. Nine hundred acres of hay meadows were irrigated, 20 miles of crucial winter range fence were maintained, 107 acres of noxious weed were controlled, and 180 acres of hay meadow were grazed as a fall vegetative treatment.
• The Wyoming Game and Fish Wildlife Forensic and Fish Health Laboratory has a second American Fisheries Society certified Aquatic Animal Health Inspector. The laboratory’s Fish Health Program Manager finished his year of required experience and then was allowed to take (and pass) the nationally certifying test. This puts him in an elite group of less than 80 individual nationwide that are certified. The Laboratory Director continues to serve in the capacity of President for the Society for Wildlife Forensic Science and the Forensic Analyst serves as the Society’s Director of Communication. During this last year, the Society created a new Scientific Working Group for Wildlife Forensics (SWGWILD). This was in response to the National Research Council’s publication on the need to increase the quality of forensic science and the Congressional bill that was introduced “Criminal Justice and Forensic Science Reform Act of 2011”. SWGWILD will be responsible for a certification scheme and best practices document. The Department’s Forensic Program manager is the Executive Secretary of this group and the Laboratory Director is the Chair of the White-Paper subcommittee. The documents from SWGWILD will go through a consensus process with the membership of the Society and then will be voted on by the Board of Directors. It is goal of this group to have a Certification and Best Practices program on-line before it is mandated by the Federal Government. The WGFD Wildlife Forensic Laboratory is also working on hosting the second meeting of the Society in May of 2012.
• The Lands Administration Program completed acquisitions for the new Pinedale Game Warden Station, the new Cody Game Warden Station, water rights in Fremont Lake, a 30-
11
year lease with US Forest Service for the Ten Sleep Fish Hatchery, a parking area at the Salt River Diversion Dam Public Access Area, and an easement for Bitter Creek Fish Bypass. The Lands Administration Program also completed the sale of the Como Bluffs Fish Hatchery and worked on several high-priority conservation easements throughout the State.
During FY 11, the Division’s I&E Section accomplished several major projects including: • Implemented new processes for establishing I&E program priorities that are consistent with
the Director’s goals and objectives and the Department’s mission. The Division’s I&E Leadership Team continued to work on improving communications and coordinating work plans among all the I&E work units.
• The Conservation Education Program continued work on several important programs and activities, including Hunter Education (including bowhunter education), Hunter Education Instructor Academy, Wyoming Hunter Mentor Program, 4-H shooting sports, Cooperative North American Shotgunning Education Program (CONSEP), shooting workshops, Becoming an Outdoors Woman, Youth Conservation Camp, aquatic education programs, Wild Times publication, Educator’s Camp, Outdoor Recreation Education Opportunities (O.R.E.O.), Project WILD, National Archery in the Schools Program, kids fishing clinics, teacher workshops, school and community programs, Aquatic Invasive Species education and outreach, hunter and angler recruitment and retention, and the Wyoming Hunting & Fishing Heritage Expo. During the 2010 Expo, 8,701 students and teachers attended from around the State, this was an increase of 581 students from 2009. A total of 12,565 people participated in the 2010 Expo. The Regional I&E Program implemented regional I&E work plans that were responsive to the agency’s priorities. It also assisted the Conservation Education Program with the Expo, Hunter Education, Project WILD, WILD About Outdoor Recreation Education Opportunities youth and teacher camps, 4-H shooting sports, and aquatic education programs throughout the State.
• The Regional I&E program continued the processes for establishing I&E program priorities that are consistent with the Director’s goals and objectives and the Department’s mission.
• The Telephone Information Center answered over 85,000 incoming calls. The postal cleansing and sorting software allows the Department to benefit from USPS postage cost reductions by sorting and applying a barcode to mail pieces. This software saved the agency approximately $10,000 in postage costs.
• The Human Dimensions program worked on public input processes and opinion surveys including surveys on internal and external client satisfaction, and is planning for a survey of hunter satisfaction with elk hunting in Wyoming. The Human Dimensions program worked with the Wildlife Division to complete implementation of the Wyoming Mule Deer Initiative and preparation of a draft plan for the herd unit. The major portion of this work resulted in a public participation process called “collaborative learning”. The final two of three rounds of public meetings were held in communities throughout western Wyoming. After having shared perspectives on major issues affecting the herd, and receiving information on what the Department is currently doing in relation to identified issues, members of the public brainstormed solutions to address those issues. WGFD personnel prioritized the solutions presented and incorporated public input into the Wyoming Range management plan. A survey was conducted to assess attitudes and opinions of Platte Valley mule deer hunters, and the collaborative learning process for that herd unit was initiated.
12
WILDLIFE DIVISION Brian Nesvik, Chief
The Wildlife Division is responsible for the management of terrestrial wildlife, human/wildlife conflict management, wildlife law enforcement, and watercraft safety. The Division is committed to the agency mission statement, “Conserving Wildlife, Serving People.” During FY 11, there was an increase in precipitation for a third year, filling many major reservoirs and stimulating increased growth of key shrub species. Mule deer and pronghorn fawn survival/recruitment was impacted in some portions of the state by cold and wet conditions late into spring. Over winter adult and fawn survival was lower than normal in some parts of the state particularly in the Pinedale, Green River, and portions of the Casper Regions due to increased snow levels and long periods of cold temperatures. Hunter satisfaction in these areas may decrease this fall. Hunter satisfaction in other areas of the state should remain high. The Division continued to place significant effort into completing the development of the mule deer management plan as a result of the Wyoming Mule Deer Initiative (MDI). Accomplishments within the initiative include:
Wyoming Range Herd: • A collaborative learning process was utilized to gather input for a long-term
management plan. This involved a series of public information meetings, and a second round of meetings to solicit ideas for actual plan development. This process was facilitated by Dr. Jessica Clement of Colorado State University.
• The last phase of the habitat assessment for this herd, with a total inventory of 180,489 acres.
• Major fence modifications have been completed in key migration corridors to facilitate the safe passage of deer.
• New legislation restricting the collection of shed antlers on winter ranges has gone into effect, and drastically reduced winter range disturbance in this herd unit.
• Deer underpasses at Nugget Canyon have reduced mortality by 90 percent. Platte Valley Herd:
• The habitat assessment is now completed, totaling nearly 200,000 acres. • A complete trend count of this herd was completed, and that data is currently
being analyzed. • A large research project is complete. The project evaluated deer movement in this
herd and also deer sightability from aircraft in these habitat types. • A public attitude survey, similar to the Wyoming Range survey, was completed. • Regional personnel attended collaborative learning training and plans to conduct
public workshops throughout southeast and central Wyoming. Sage-grouse continue to receive a high level of management emphasis. In September 2007, an implementation team made up of representatives from federal and state agencies, conservation groups, industry, and landowners presented the Governor with a list of recommendations they
13
believed would contribute to the stabilization of sage-grouse populations and the long-term conservation of sagebrush habitat in Wyoming. These efforts would preclude the need for the U.S. Fish and Wildlife Service to list sage-grouse as threatened or endangered. Accomplishments during FY 11 include:
• Statewide sage-grouse seasonal habitat mapping is underway. The results of this effort will enhance management of sage-grouse by better indentifying locations that would or would not benefit from habitat protection and/or enhancement.
• The legislature approved funds for the local working group process and sage-grouse projects for the FY11-12 biennium budget. The local working groups approved 18 projects.
• The Department initiated a research project designed to answer questions about sagebrush habitat treatments and the response of sage-grouse, and ultimately other sagebrush-dependant wildlife based on potential synergistic efforts focused on other sensitive species at overlapping sites.
• The Department’s sage-grouse database is currently being revised and upgraded in order to improve accuracy of the data and efficiency for those collecting, entering, reporting, and utilizing the data. This revision should be complete and in use in 2011.
Three domestic livestock herds in Park County tested positive for brucellosis. The suspected source in all three cases was wild and free ranging elk. The Department initiated an emergency regulation and extended hunting seasons in portions of the Cody and Gooseberry elk herd units in an effort to increase the quality of elk sero-prevalence data. The effort was successful in obtaining over 130 additional blood samples and over 300 tissue samples. These samples increased the reliability of the Department’s elk sero-prevalence data. The Department continued to participate in the Brucellosis Coordination Team and with affected livestock producers to mitigate transmission risks. The Division began work to develop Brucellosis Management Action Plans for Cody area elk herds. Human/wildlife conflict management continues to be a major part of division operations. In FY 11, Division personnel expended 2,023 man-days and drove 233,118 miles on activities to prevent wildlife from causing damage to private property. Personnel expended 605 man-days and drove 35,746 miles investigating, processing, and handling damage claims and landowner coupon redemptions. A total of 206 damage claims in the amount of $773,154 were filed and the Department paid $682,993 in claims. In addition, personnel spent 837 man-days and drove 112,462 miles responding to nuisance wildlife issues that were not considered wildlife damage under W.S. 23-1-901. FY 11 marked a significant increase in human/grizzly bear conflicts with over 65 bears captured as a result of conflict situations. Research efforts during FY 11 included the following:
• Absaroka Front Elk Ecology Project - A Coop study looking at elk ecology and movements in the Cody region outside Yellowstone National Park.
• Evaluation of the influence of climate and bear predation on moose – The study looks at the current status of moose population performance, calf production, harvest, and
14
evaluates the influence of climate versus predation on declining trends in moose calf production.
• Noble Basin pre-development moose project – Study will provide baseline information on the survival of cow moose and the habitat selection of moose prior to energy development.
• Pinedale Elk Habitat Study – Study to evaluate the habitat use patterns, movement, and interchange among fed and non-fed elk wintering along the Wind River and Wyoming Range fronts and focus on migration routes, habitat use, forage utilization, winter distribution, seasonal ranges, and brucellosis status.
• Elk Pop-II Synthesis – Quantitative evaluation of survey and data collection efforts used to model, monitor, and manage elk populations.
• Platte Valley Mule Deer Population Estimate - Test, and if necessary, modify, the Idaho sightability model for deer populations and apply it to Platte Valley deer, evaluate timing of seasonal migrations and characterize summer range habitat use and response to beetle-killed portions of summer habitat by Platte Valley deer.
• Baggs Deer Underpass Monitoring - A study documenting the use of new underpasses installed in the Baggs, Highway 789 area. Cameras are used to record species of use and numbers.
• Chronic Wasting Disease (CWD) and its affect on white-tailed deer populations in central Wyoming - This long-term study is designed to understand the population effects of CWD on white-tailed deer.
• Fortification Elk – This study, conducted by the University of Wyoming for the Bureau of Land Management, looks at the Fortification Elk herd’s habitat use and movements to gain knowledge of the potential effects of gas development.
• Brucellosis Studies - Several research projects are underway, including determining effects of the disease on elk populations and ways to reduce the prevalence and risk of transmission to livestock.
Species of Greatest Conservation Need (SGCN) received substantially more attention during FY 11, including:
• River Otter Monitoring – This study will estimate the abundance and survival of river otters along the Green River and tributaries.
• Lodgepole Beetle Assessment for Species of Greatest Conservation Need – This study will identify the presence and abundance of avian, mammalian, and amphibian species in all stand types. The study will also test predictions related to the value of live versus dead lodgepole stands and spruce-fir forests as potential refugia for lodgepole-inhabiting SGCN prior to lodgepole regeneration.
• Assessment of Wildlife Vulnerability to Energy Development (AWVED) – This study will develop spatially explicit projections of energy development and use SGCN distribution maps and energy development projects to assess the relative degree SGCN will be exposed to development.
• Influence of energy development on non-game sagebrush birds with a focus on sagebrush birds that are SGCN – Survey sites have been established and initial surveys were conducted in 2008 and 2009. The diversity and abundance patterns in relation to energy development intensity are being evaluated.
15
• Evaluation of Ferruginous hawk population status and trends – Documented population densities of nesting Ferruginous hawks and other raptor species in four widely scattered study areas and evaluated changes since the 1978 original baseline data.
• Wind energy development and grassland birds – Study to compare the abundance, diversity, mortality, and nesting productivity of avian SGCN in mixed-grass prairie habitats both near and away from existing wind turbine complexes.
• Small Mammal Distribution, Sagebrush habitats, SW Wyoming – Collect distribution data on dwarf shrew, Great Basin pocket mouse, olive-backed pocket mouse, silky pocket mouse, western heather vole, vagrant shrew, and sagebrush vole.
• Coon Creek Revisited: Wildlife Response to Broad-Scale Forest Disturbance - Revisiting old study sites in the Sierra Madre Range (Coon Creek) to examine the local, short-term affect of beetle-induced lodgepole pine death on bird and red squirrel populations.
• Energy development and songbirds – Study to monitor nests of sagebrush songbirds, determine the factors underlying variation in nest predation risk and develop specific management recommendations for maximizing avian nest success across gradients in energy development intensity.
• The Department has been working with Wyoming Audubon on a long-term monitoring program to determine the distribution, breeding status, and abundance trends for avian SGCNs.
• Other mammalian surveys include work with black-footed ferrets, pocket gophers, swift fox, and Prebles Jumping mouse.
The terrestrial habitat section completed a myriad of projects includes: four landscape scale projects using satellite imagery and ground-truthing to document land cover encompassing about 3.5 million acres; finer scale project level intensive rangeland and habitat inventories and assessments on almost 304,000 acres; grazing management plans on 25 areas totaling over 690,000 acres; wildlife stewardship plans on three areas totaling about 22,200 acres; nearly 17,000 acres of prescribed fire; mechanical vegetation treatments on about 7,900 acres; herbicide treatments on nearly 17,000 acres; seeding projects on about 2,900 acres; planting nearly 8,000 shrubs and trees; assisting over 200 private landowners, resulting in 127 on-the-ground habitat projects; involvement in 33 major information and education efforts; collecting information from 114 vegetation monitoring transects to document past projects; collecting information from 126 annual vegetation production/utilization transects; and administering and oversight of 128 different funding sources to implement projects. The Department developed a state wolf management program in accordance with Wyoming Statutes and Commission regulations upon official delisting of wolves by the U.S. Fish and Wildlife Service. The Department’s program consisted of three wolf management specialists stationed in Cody, Lander, and Pinedale and a wolf program coordinator stationed in Jackson. Upon relisting, the program was reduced from a comprehensive wolf management program with four full-time employees (FTE’s) to a wolf damage investigation/compensation program with one FTE stationed in Pinedale. Regional personnel and personnel from the Trophy Game Conflict Resolution program assisted with the investigation and compensation of wolf damage. The Department continues to investigate and compensate livestock producers for wolf losses in those portions of the state where wolves are classified as trophy game animals. In FY 11 there
16
were 20 verified livestock depredations by wolves (19 cattle and 1 sheep) and two calves injured by wolves in the Wolf Trophy Game Management Area. In total, $69,221.77 was paid in compensation for wolf depredation in accordance with the formula for missing livestock as provided for in Commission Regulation Chapter 28, Regulation Governing Big or Trophy Game Animal or Game Bird Damage Claims. The Downar Bird farm experienced a complete loss of all pen raised pheasants following an outbreak of the zoonotic disease, Chlamydia citicosis. The source of the infection was never determined, but suspected to be transmitted from avian species around bird pens. The Department completely de-populated the bird farm and conducted actions to decontaminate the facilities. The Department purchased 10,000 pheasants to replace a portion of those lost so the Springer Special hunt and PLPW area releases could continue this fall. In calendar year 2010, Wyoming had 79 enforcement personnel record law enforcement actions. These officers worked a total of 44,788 hours and drove 623,595 miles on law enforcement related activities. A total of 3,830 law enforcement actions were taken comprising of 1,658 citations, 1,784 written warnings, and 430 additional wildlife violations documented that could not be attributed to a identifiable suspect. The Investigative Unit spent most of FY 11 bringing three separate, major, felony Lacey Act cases to the prosecution phase. One case involving illegal outfitting and the transfer of licenses went to the Federal Grand Jury. The Grand Jury handed down a 28 count indictment. Another case will likely be presented to the Grand Jury in the fall of 2011. These three cases are the result of huge efforts, including undercover work. Law enforcement task forces were employed to address areas with chronic violations. Those included:
• Glendo Reservoir – Memorial Day Weekend; Fishing and watercraft enforcement • Alcova and Pathfinder Reservoirs- 4th of July Week; Fishing and watercraft enforcement • Green River/Kemmerer/Cokeville Antler Task Force – Antler regulation enforcement • Bear River Divide HMA – Additional enforcement presence, fall hunting season • Wyoming/Utah State Line Decoy Task Force – Deer/elk decoy operation along state line • Antler rendezvous/Dubois – Possession of wildlife parts/enforcement • Seminoe Reservoir – 4th of July Week; Fishing and watercraft enforcement • Pinedale Winter Range – Enforcement along mule deer winter range/poaching
The Private Lands Public Wildlife (PLPW) Access program continues to provide quality hunting and fishing access through the Hunter Management Area (HMA) and Walk-in Area (WIA) programs. With the addition of five new HMAs, The program grew from 917,438 private acres in 2009 to 1,099,125 acres in 2010. The new HMAs includes Copper Mountain East of Thermopolis, Cow Creek South of Saratoga, Hanna Draw West of Hanna, Missouri John East of Hanna, and Parker Gulch East of Laramie. The WIA program increased in acreage during 2010 to 681,683 private acres compared to 665,301 in 2009. The Walk-in Fishing Area Program increased from 4,891 lake acres in 2009 to 4,944 acres in 2010, while stream miles also increased from 84.9 to 96.3 miles.
17
The HMA online permission slip system continues to be popular, with 1,740 individuals applying for or receiving permission for 3,214 permits within the first day of application. Improvements to the system have enhanced efficiently and distribution of permission slips. Harvest surveys from 2010 indicated that 13.3 percent of elk hunters, 17.1 percent of deer hunters, and 24 percent of antelope hunters used a PLPW Access Area (both HMA and WIA) during the hunting season. In summary, the Wildlife Division addressed all major issues during FY 11, and the majority of divisional goals and objectives were completed thanks to an extremely dedicated and hard-working group of employees.

PROGRAM-LEVEL REPORTS
18
Program: Aquatic Wildlife Management Division: Fish Mission: Conserve and enhance all aquatic wildlife, reptiles, amphibians, and their habitats for current and future generations. We will provide diverse, quality fisheries resources and angling opportunities. Program Facts: The Aquatic Wildlife Management program is made up of seven sub-programs, listed below with number of staff and 2011 (FY 11) budget: Sub-programs # FTEs* 2011 Annual Budget Fish Hatcheries and Rearing Stations 40.7 $ 4,566,496 Regional Aquatic Wildlife Mgmt. 33.5 3,065,988 Aquatic Invasive Species 1.5 217,251 Boating Access 0.0 1,250,000 Statewide Aquatic Wildlife Mgmt. 5.5 533,923 Fish Spawning 2.7 250,540 Fish Distribution 0.0 120,174 Fish Wyoming** 0.0 50,000 TOTAL 83.9 $ 10,054,372 * Includes permanent, contract, and temporary positions authorized in the FY 11 budget. Any positions added during the budget cycle require Wyoming Game and Fish Commission authorization or must be funded from supplemental grants. ** One time funding for FY 11 from License Recoupment. The Aquatic Wildlife program is located across the state in eight regional offices, Cheyenne headquarters, and ten remotely located fish hatcheries and rearing stations. Primary Functions of the Aquatic Wildlife Management Program: • Conserve and enhance all aquatic wildlife, amphibians, and reptiles by scientifically
assessing populations at both local and watershed levels, controlling exotic species where necessary, and where ecologically and economically feasible reintroducing native species into suitable habitats in order to conserve these taxa for future generations.
• Provide diverse, quality fisheries resources and angling opportunities through a system of fish management that attempts to first manage wild fisheries where possible, but relies upon an evaluation-based fish-stocking program. The program meets angler desires by stocking salmonids (trout, grayling, and Kokanee) that come from egg sources within Wyoming and are reared using modern fish culture practices. Non-salmonid (walleye, bass, catfish, etc.) fisheries are maintained through the trade of excess eggs with federal and other state agencies. Our efforts will balance the productive capacity of habitats with public desires.
Performance Measure #2: Number of stream and lake surveys completed (Personnel with this program will work to complete at least 540 stream and lake surveys per year).
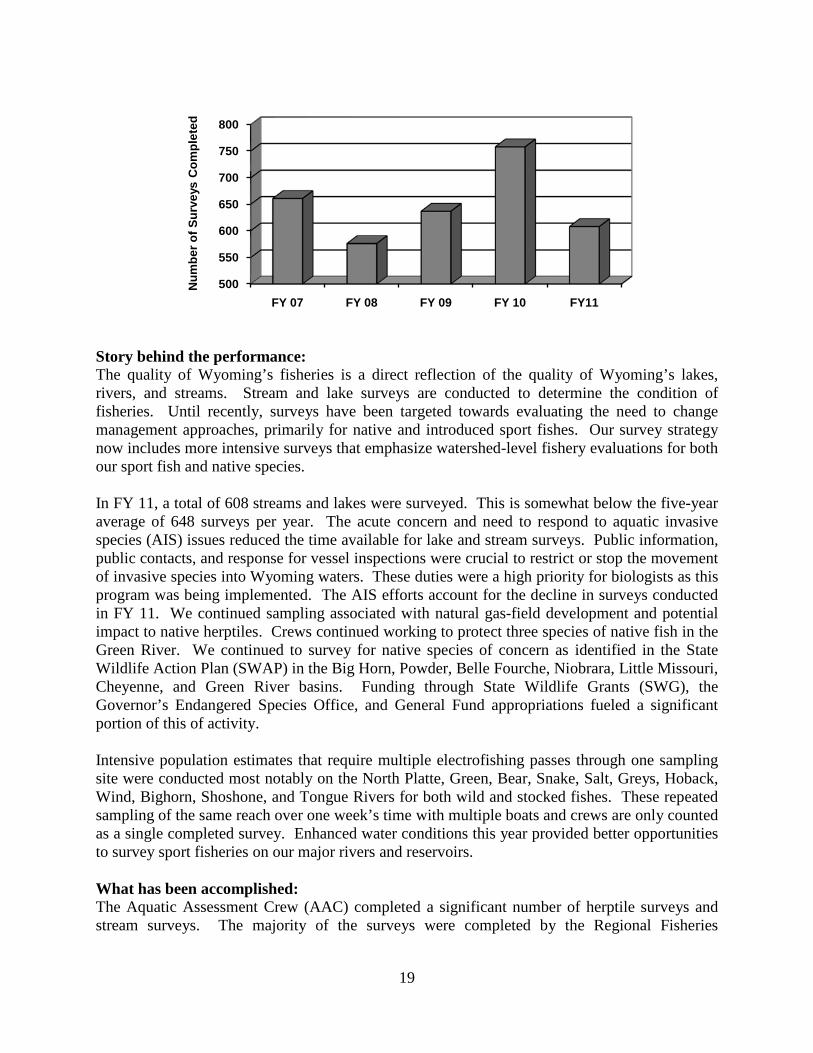
19
Story behind the performance: The quality of Wyoming’s fisheries is a direct reflection of the quality of Wyoming’s lakes, rivers, and streams. Stream and lake surveys are conducted to determine the condition of fisheries. Until recently, surveys have been targeted towards evaluating the need to change management approaches, primarily for native and introduced sport fishes. Our survey strategy now includes more intensive surveys that emphasize watershed-level fishery evaluations for both our sport fish and native species. In FY 11, a total of 608 streams and lakes were surveyed. This is somewhat below the five-year average of 648 surveys per year. The acute concern and need to respond to aquatic invasive species (AIS) issues reduced the time available for lake and stream surveys. Public information, public contacts, and response for vessel inspections were crucial to restrict or stop the movement of invasive species into Wyoming waters. These duties were a high priority for biologists as this program was being implemented. The AIS efforts account for the decline in surveys conducted in FY 11. We continued sampling associated with natural gas-field development and potential impact to native herptiles. Crews continued working to protect three species of native fish in the Green River. We continued to survey for native species of concern as identified in the State Wildlife Action Plan (SWAP) in the Big Horn, Powder, Belle Fourche, Niobrara, Little Missouri, Cheyenne, and Green River basins. Funding through State Wildlife Grants (SWG), the Governor’s Endangered Species Office, and General Fund appropriations fueled a significant portion of this of activity. Intensive population estimates that require multiple electrofishing passes through one sampling site were conducted most notably on the North Platte, Green, Bear, Snake, Salt, Greys, Hoback, Wind, Bighorn, Shoshone, and Tongue Rivers for both wild and stocked fishes. These repeated sampling of the same reach over one week’s time with multiple boats and crews are only counted as a single completed survey. Enhanced water conditions this year provided better opportunities to survey sport fisheries on our major rivers and reservoirs. What has been accomplished: The Aquatic Assessment Crew (AAC) completed a significant number of herptile surveys and stream surveys. The majority of the surveys were completed by the Regional Fisheries
500
550
600
650
700
750
800
FY 07 FY 08 FY 09 FY 10 FY11
Num
ber o
f Sur
veys
Com
plet
ed
20
Management Crews as part of their routine management. Many of these surveys were designed to monitor management strategies and adjust as needed. The SWAP revision was completed in FY 11. The Department continually surveys streams and lakes in order to meet data needs that were identified for aquatic species in the SWAP. Surveys typically gather baseline inventory or trend monitoring data for Species of Greatest Conservation Need (SGCN). The continued availability of funding from the Governor’s Endangered Species Office and General Fund appropriations greatly have accelerated the pace of our investigations for many SGCN. What we propose to improve performance in the next two years: • Implement the new actions identified in the revised SWAP. • Continue evaluating sport fish regulations and our fish stocking programs. Fish stocking
evaluations are necessary to assess and update our brood stock management plans and refine our stocking program to make best use of the limited number of fish available. We need to continue to evaluate success of stocking larger trout to avoid walleye predation in our large reservoirs and evaluate our recently initiated Colorado River cutthroat trout and Firehole rainbow trout stocking activities.
• Seek to work with partners such as the University of Wyoming or Wyoming Natural Diversity Database to assist in surveying bivalves, aquatic snails, and land snails. Endangered Species Act (ESA) petitioners are increasingly targeting these invertebrate species, but we are acutely short on relative abundance and distribution data to respond to requests for information.
• In the future, the AIS program will take less time away from important fisheries management duties which should result in an increased number of surveys.
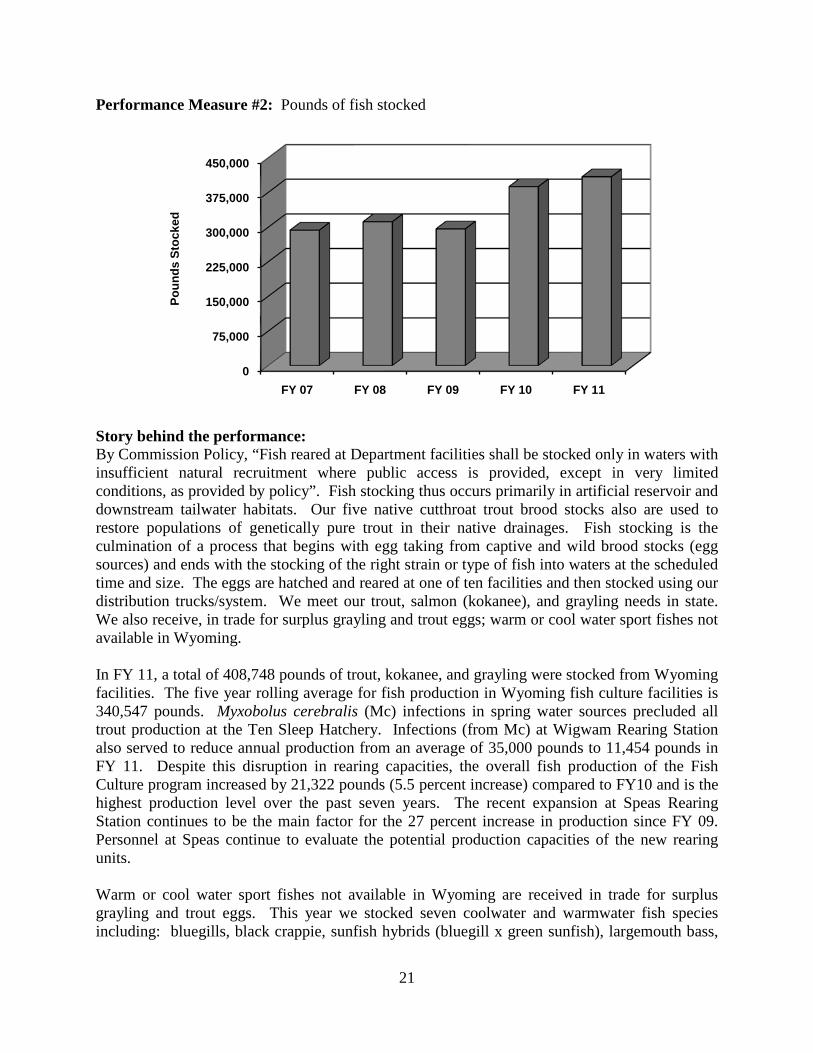
21
Performance Measure #2: Pounds of fish stocked
Story behind the performance: By Commission Policy, “Fish reared at Department facilities shall be stocked only in waters with insufficient natural recruitment where public access is provided, except in very limited conditions, as provided by policy”. Fish stocking thus occurs primarily in artificial reservoir and downstream tailwater habitats. Our five native cutthroat trout brood stocks also are used to restore populations of genetically pure trout in their native drainages. Fish stocking is the culmination of a process that begins with egg taking from captive and wild brood stocks (egg sources) and ends with the stocking of the right strain or type of fish into waters at the scheduled time and size. The eggs are hatched and reared at one of ten facilities and then stocked using our distribution trucks/system. We meet our trout, salmon (kokanee), and grayling needs in state. We also receive, in trade for surplus grayling and trout eggs; warm or cool water sport fishes not available in Wyoming. In FY 11, a total of 408,748 pounds of trout, kokanee, and grayling were stocked from Wyoming facilities. The five year rolling average for fish production in Wyoming fish culture facilities is 340,547 pounds. Myxobolus cerebralis (Mc) infections in spring water sources precluded all trout production at the Ten Sleep Hatchery. Infections (from Mc) at Wigwam Rearing Station also served to reduce annual production from an average of 35,000 pounds to 11,454 pounds in FY 11. Despite this disruption in rearing capacities, the overall fish production of the Fish Culture program increased by 21,322 pounds (5.5 percent increase) compared to FY10 and is the highest production level over the past seven years. The recent expansion at Speas Rearing Station continues to be the main factor for the 27 percent increase in production since FY 09. Personnel at Speas continue to evaluate the potential production capacities of the new rearing units. Warm or cool water sport fishes not available in Wyoming are received in trade for surplus grayling and trout eggs. This year we stocked seven coolwater and warmwater fish species including: bluegills, black crappie, sunfish hybrids (bluegill x green sunfish), largemouth bass,
0
75,000
150,000
225,000
300,000
375,000
450,000
FY 07 FY 08 FY 09 FY 10 FY 11
Poun
ds S
tock
ed
22
northern pike, shovelnose sturgeon, and walleye. These totaled 903,336 fish with the majority being 525,504 walleye fingerlings stocked to maintain the quality of our walleye sport fisheries. These numbers are lower than past years since the cool spring delayed fish production into July 2011. All statewide stocking requests were assessed and reallocated throughout the system to offset production losses. While pounds are easily tracked or measured, the quality of the fish stocked continues to be emphasized. This is done by not overstocking facilities and incorporating modern fish health practices that stress optimum, not maximum, production levels. New rearing units at Dubois and Speas are continually being evaluated to determine ultimate production levels. Emphasis of the stocking program is to release high quality fish for the greatest return when stocking to improve sport fisheries or to restore native trout fisheries. Although adjustments were needed to address whirling disease losses, the Fish Culture sub-program continues to meet the program’s internal goal of producing +/- 10 percent of the requests made from regional aquatic wildlife managers. Coupled with more favorable reservoir conditions, the stocking of more than 21,000 additional pounds of fish over last year should produce very good fishing in the next several years. What we propose to improve performance in the next two years: • Evaluation of the rearing units at Speas Hatchery continues as production rotations
throughout a production year are expanded. Production goals for 2012 and 2013 show a steady increase in both pounds and species of fish raised at the facility.
• A new hatchery building at Speas is slated for operation in October 2011, thanks to mitigation funds from the Pathfinder Modification Project. The addition of this building will further enhance the capacities at Speas Rearing Station to meet North Platte River system stocking by developing the capacity to rear small fish at the facility instead of relying on other hatcheries to transfer fish. Fish production diversity throughout the sub-program will also increase as hatcheries can schedule fish production in space previously allocated for the Speas transfers.
• The California golden trout brood stock at Story Hatchery exceeded expectations by producing 104,289 eyed eggs, meeting Department requests for the first time since 1993 and also providing 20,000 eggs to the state of Idaho. This is the first successful captive brood stock in the nation and will play an important role in golden trout programs throughout the United State in the coming years.
• The renovation of the Ten Sleep hatchery, through supplemental Legislative funding, is scheduled for completion in September 2011. The hatchery will undergo evaluation of the water treatment system and is scheduled for a full fish health certification in April 2012 to meet the stocking needs of the native Yellowstone cutthroat drainages.
• Whirling disease exposure continues to be an issue at Wigwam Rearing Station with Mc found in the remaining spring water supply in June 2011. Production is suspended at the facility until construction, funded by a supplemental Legislative appropriation, can be completed. It is anticipated that the facility will be back on line in August 2012 and enter the 2013 fish stocking season.
• Continue to maintain and further develop captive brood stocks of native cutthroat species in protective refuges, periodically collecting wild recruitment year classes to maintain genetic stability.
23
• Advance and expand the training system in the sub-program on various fish culture skills and database management of the various production requirements.
• Continue to incorporate and maintain high genetic integrity in captive brood stocks and broaden the scope and sources of our wild genetic sources of native and introduced trout species internally to maintain a disease free supply for the sub-program.
• Continue to seek and evaluate technological methods that allow more efficient use of available water at fish culture facilities. In conjunction with technology, continue to expand proactive protocols to reduce the presence of bacterial coldwater diseases and address possible biosecurity issues from other fish health and aquatic invasive species threats.
• Strive to train fish culture personnel in management skills and the latest fish culture technologies to prepare for future challenges and anticipated retirements within the next five years.
• Continue development of a sub-program procedure manual for consistency in communications and operations. Each hatchery is completing operation manuals to compliment the sub-program manual to improve coordination.
• Update existing data generating and fish production database management systems to improve record keeping and communications.
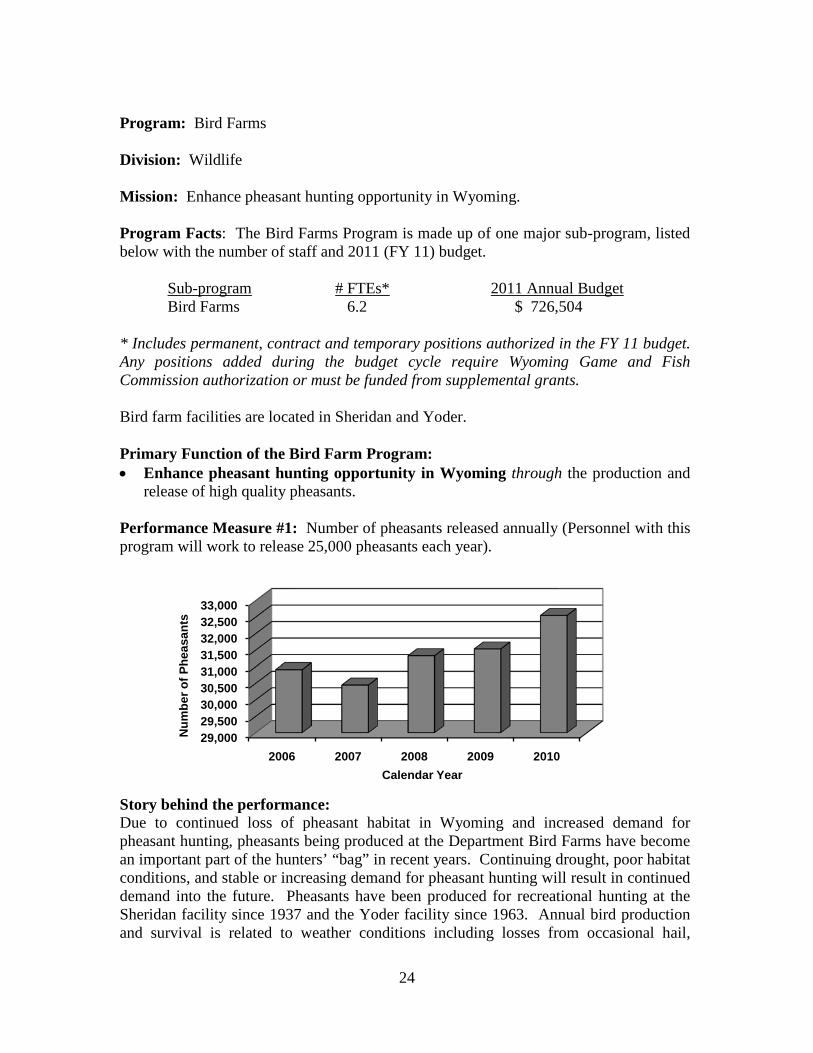
24
Program: Bird Farms Division: Wildlife Mission: Enhance pheasant hunting opportunity in Wyoming. Program Facts: The Bird Farms Program is made up of one major sub-program, listed below with the number of staff and 2011 (FY 11) budget. Sub-program # FTEs* 2011 Annual Budget Bird Farms 6.2 $ 726,504 * Includes permanent, contract and temporary positions authorized in the FY 11 budget. Any positions added during the budget cycle require Wyoming Game and Fish Commission authorization or must be funded from supplemental grants. Bird farm facilities are located in Sheridan and Yoder. Primary Function of the Bird Farm Program: • Enhance pheasant hunting opportunity in Wyoming through the production and
release of high quality pheasants. Performance Measure #1: Number of pheasants released annually (Personnel with this program will work to release 25,000 pheasants each year).
Story behind the performance: Due to continued loss of pheasant habitat in Wyoming and increased demand for pheasant hunting, pheasants being produced at the Department Bird Farms have become an important part of the hunters’ “bag” in recent years. Continuing drought, poor habitat conditions, and stable or increasing demand for pheasant hunting will result in continued demand into the future. Pheasants have been produced for recreational hunting at the Sheridan facility since 1937 and the Yoder facility since 1963. Annual bird production and survival is related to weather conditions including losses from occasional hail,
29,00029,50030,00030,50031,00031,50032,00032,50033,000
2006 2007 2008 2009 2010
Num
ber o
f Phe
asan
ts
Calendar Year
25
snowstorms and excessive heat that may slow the growth of young pheasants. Bird farm personnel coordinate release schedules with regional personnel to maximize the efficiency of bird distribution during the months of October, November, and December of each year. The vast majority of Wyoming’s pheasant hunting occurs in Goshen County in the southeastern part of the state. Established pheasants throughout the state are supplemented by releases from the Department’s Downar and Sheridan Bird Farms. Between 2006 and 2010, the number of pheasants released ranged from 30,446 to 32,548 with an average of 31,352 birds. The number released in calendar 2010 was higher than average at 32,548. Pheasants were released on Department lands, private lands enrolled in the Private Lands Public Wildlife (PLPW) Access program, and private lands where landowners allow public hunting access. The Downar bird farm was affected by disease in the spring of 2011. An outbreak of psittacosis was discovered and due to human health concerns the bird farm was de-populated. Bird farm personnel spent the summer decontaminating the facility and doing needed repairs in anticipation of returning production to normal in 2012. Decontamination consisted of multiple tilling of affected pens, spraying disinfectants on wood and metal surfaces in those pens, disinfecting all equipment exposed to sick birds and fumigation of all buildings that housed sick birds. Decontamination was completed in late June of 2011. What has been accomplished: Personnel at Sheridan bird farm continued to do facility upgrades to maximize efficiency in pheasant production. Personnel actively assist region personnel with check stations, chronic wasting disease monitoring, fish spawning projects, and extension services. Downar bird farm personnel were involved with facility upgrades, ongoing habitat projects on local Wildlife Habitat Management Areas, local extension services, and involvement with a local Coordinated Resource Management (CRM) weed management project. Personnel also help the PLPW program with signing and guzzler maintenance. Downar personnel completed decontamination, as directed by Vet Services, in anticipation of re-population and renewal of production. Pheasants were contracted from private sources. Production will resume in spring of 2012. What we propose to improve performance in the next two years: • Return Downar bird farm to full production. • Personnel at the bird farms will continue to seek the most cost effective and efficient
methods of rearing pheasants. • Efforts are being made to improve the genetics of the pheasants being raised to
ensure a quality product will be available for hunting. • The existing facilities are at maximum production at this time. Personnel will explore
all avenues to continue this production level.
26
Program: Conservation Education Division: Services Mission: Provide learning and participation opportunities relating to both aquatic and terrestrial wildlife management, wildlife conservation, wildlife related skills, and lawful and ethical behavior. Program Facts: The Conservation Education program is made up of two major sub-programs, listed below with number of staff and 2011 (FY 11) budget: Sub-program #FTEs* 2011 Annual Budget Hunter Education 1.0 $ 140,802 Conservation Education 4.0 329,596 TOTAL 6.0 $ 723,904 *Includes permanent and contract positions authorized in FY 11 budget. Any positions added during the budget cycle require Wyoming Game and Fish Commission authorization or must be funded from supplemental grants. These programs do require statewide responsibilities, travel, and assistance from regional personnel. This program is located in the Department Headquarters Office in Cheyenne. Primary Functions of the Conservation Education Program: • Provide learning and participation opportunities to youth and adults in outdoor
skills, and as required by State Statute, and continue to offer hunter education so that hunters engage in ethical, lawful, and safe actions.
• Create awareness in youth and adults of the importance of planned management practices for wildlife and their habitats within their specific ecosystems.
Performance Measure #1: Number of educational opportunities offered and number of people reached annually through Conservation Education efforts (personnel from this program will work to provide at least 200 conservation education opportunities to 20,000 people).
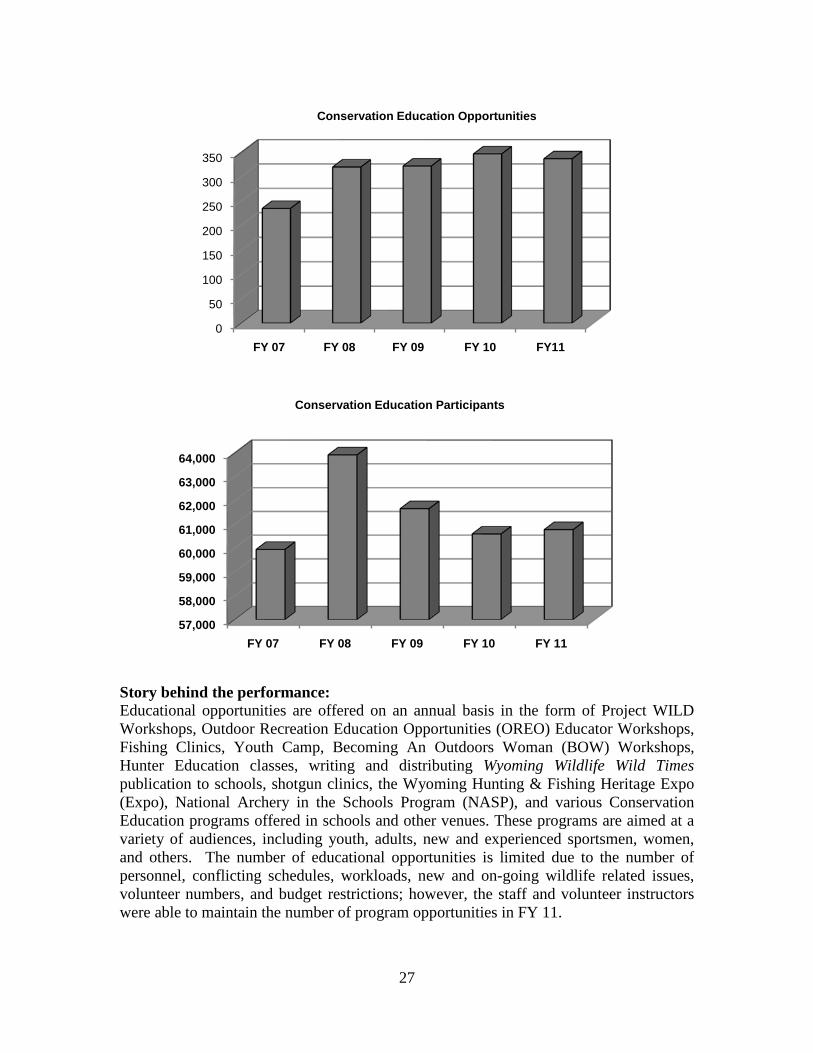
27
57,000
58,000
59,000
60,000
61,000
62,000
63,000
64,000
FY 07 FY 08 FY 09 FY 10 FY 11
Conservation Education Participants
Story behind the performance: Educational opportunities are offered on an annual basis in the form of Project WILD Workshops, Outdoor Recreation Education Opportunities (OREO) Educator Workshops, Fishing Clinics, Youth Camp, Becoming An Outdoors Woman (BOW) Workshops, Hunter Education classes, writing and distributing Wyoming Wildlife Wild Times publication to schools, shotgun clinics, the Wyoming Hunting & Fishing Heritage Expo (Expo), National Archery in the Schools Program (NASP), and various Conservation Education programs offered in schools and other venues. These programs are aimed at a variety of audiences, including youth, adults, new and experienced sportsmen, women, and others. The number of educational opportunities is limited due to the number of personnel, conflicting schedules, workloads, new and on-going wildlife related issues, volunteer numbers, and budget restrictions; however, the staff and volunteer instructors were able to maintain the number of program opportunities in FY 11.
0
50
100
150
200
250
300
350
FY 07 FY 08 FY 09 FY 10 FY11
Conservation Education Opportunities
28
In FY 11, there were 337 program opportunities available, which was a decrease of 10 program opportunities from FY 10. This decrease is in part due to vacant positions and staff workloads. The number of participants in FY 11 was 60,781, which is slightly higher than FY 10 participants. The staff worked hard to promote and improve program options for participants, thus number of participants per program remained steady or increased. For example, in FY 10 there were 40 participants for the Becoming An Outdoors Woman program and in FY 11 there were 45 participants. Another factor effecting participation numbers was the downturn in the economy. People and schools did not have the ability to travel as readily. With increased promotion and school recruitment, the attendance at Expo has steadily increased to an average of 13,000 since FY 06. However, in FY 11 due to school budget and travel restrictions, the Expo attendance dropped to 12,565, down approximately 500 people. It is clear that continued participation in Department programs indicates that the quality of the programs remains high. Department program opportunities vary a great deal. Some opportunities, such as the Expo, reach large numbers of people for a limited amount of time and with a limited amount of information. Other programs, like Youth Conservation Camp and Becoming An Outdoors Woman, reach smaller audiences for a longer period with more comprehensive information and presentations. Further, our educational efforts must be flexible and dynamic to meet the ever-changing needs of our constituents. The institution of a comprehensive Hunter Education Newsletter is getting more interest and participation is increasing in the Hunter Education program, classes, and workshops. The distribution of the Wyoming Wildlife Wild Times magazine has been on a steady increase since FY 05 as more schools and educators are exposed to our programs and resources. There are now 8,700 magazines distributed statewide every quarter. What we propose to improve performance in the next two years: • Continue to evaluate programs to meet the participation needs of the public,
recognizing that numbers alone are not an indication of an effective educational program.
• Continue to modify programs to incorporate the Department’s priorities. • Continue to evaluate the Hunter Education program to provide effective instruction
and offer a Hunter Education Instructor Academy to solidify the program. • Continue to collaborate with conservation organizations, Department of Education,
local, state agencies, federal agencies, natural resource agencies, community organizations, businesses, and individuals to build effective educational programs.
Performance Measure #2: Percentage of participants rating conservation programs as “meets expectations” (Personnel with this program will work to ensure that programs meet or exceed the expectations of at least 80 percent of participants).
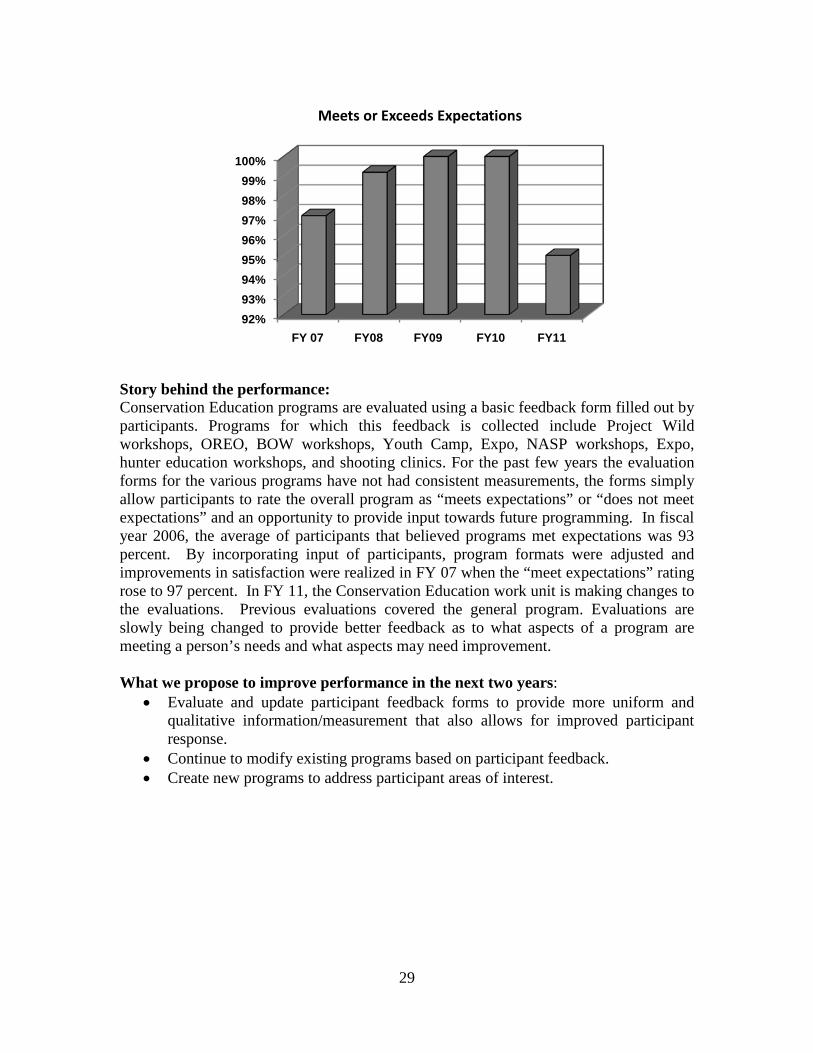
29
Story behind the performance: Conservation Education programs are evaluated using a basic feedback form filled out by participants. Programs for which this feedback is collected include Project Wild workshops, OREO, BOW workshops, Youth Camp, Expo, NASP workshops, Expo, hunter education workshops, and shooting clinics. For the past few years the evaluation forms for the various programs have not had consistent measurements, the forms simply allow participants to rate the overall program as “meets expectations” or “does not meet expectations” and an opportunity to provide input towards future programming. In fiscal year 2006, the average of participants that believed programs met expectations was 93 percent. By incorporating input of participants, program formats were adjusted and improvements in satisfaction were realized in FY 07 when the “meet expectations” rating rose to 97 percent. In FY 11, the Conservation Education work unit is making changes to the evaluations. Previous evaluations covered the general program. Evaluations are slowly being changed to provide better feedback as to what aspects of a program are meeting a person’s needs and what aspects may need improvement. What we propose to improve performance in the next two years:
• Evaluate and update participant feedback forms to provide more uniform and qualitative information/measurement that also allows for improved participant response.
• Continue to modify existing programs based on participant feedback. • Create new programs to address participant areas of interest.
92%93%94%95%96%97%98%99%
100%
FY 07 FY08 FY09 FY10 FY11
Meets or Exceeds Expectations
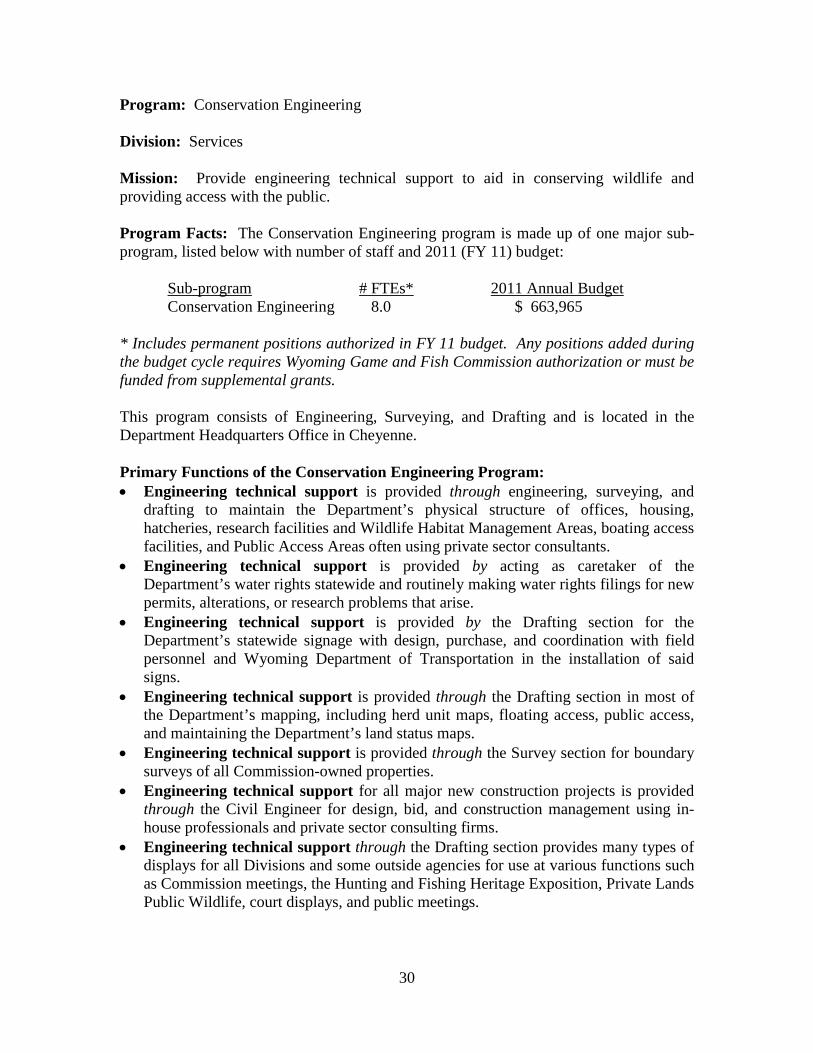
30
Program: Conservation Engineering Division: Services Mission: Provide engineering technical support to aid in conserving wildlife and providing access with the public. Program Facts: The Conservation Engineering program is made up of one major sub-program, listed below with number of staff and 2011 (FY 11) budget:
Sub-program # FTEs* 2011 Annual Budget
Conservation Engineering 8.0 $ 663,965 * Includes permanent positions authorized in FY 11 budget. Any positions added during the budget cycle requires Wyoming Game and Fish Commission authorization or must be funded from supplemental grants. This program consists of Engineering, Surveying, and Drafting and is located in the Department Headquarters Office in Cheyenne. Primary Functions of the Conservation Engineering Program: • Engineering technical support is provided through engineering, surveying, and
drafting to maintain the Department’s physical structure of offices, housing, hatcheries, research facilities and Wildlife Habitat Management Areas, boating access facilities, and Public Access Areas often using private sector consultants.
• Engineering technical support is provided by acting as caretaker of the Department’s water rights statewide and routinely making water rights filings for new permits, alterations, or research problems that arise.
• Engineering technical support is provided by the Drafting section for the Department’s statewide signage with design, purchase, and coordination with field personnel and Wyoming Department of Transportation in the installation of said signs.
• Engineering technical support is provided through the Drafting section in most of the Department’s mapping, including herd unit maps, floating access, public access, and maintaining the Department’s land status maps.
• Engineering technical support is provided through the Survey section for boundary surveys of all Commission-owned properties.
• Engineering technical support for all major new construction projects is provided through the Civil Engineer for design, bid, and construction management using in-house professionals and private sector consulting firms.
• Engineering technical support through the Drafting section provides many types of displays for all Divisions and some outside agencies for use at various functions such as Commission meetings, the Hunting and Fishing Heritage Exposition, Private Lands Public Wildlife, court displays, and public meetings.
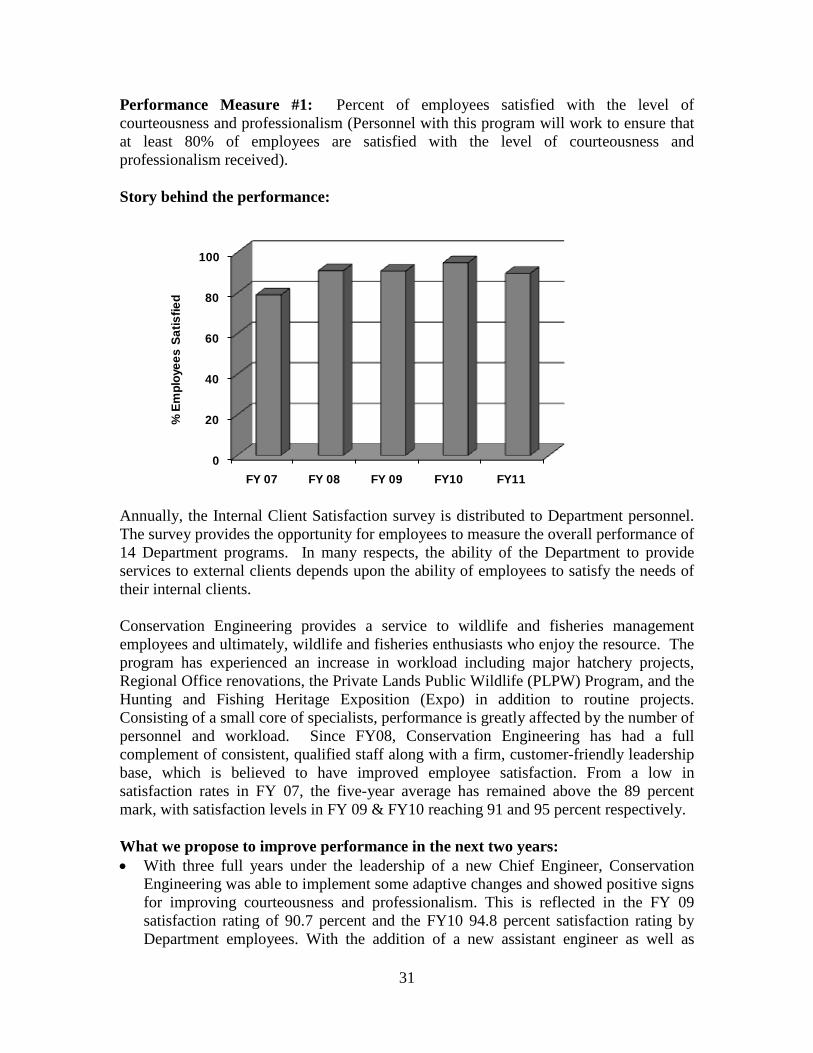
31
Performance Measure #1: Percent of employees satisfied with the level of courteousness and professionalism (Personnel with this program will work to ensure that at least 80% of employees are satisfied with the level of courteousness and professionalism received). Story behind the performance:
Annually, the Internal Client Satisfaction survey is distributed to Department personnel. The survey provides the opportunity for employees to measure the overall performance of 14 Department programs. In many respects, the ability of the Department to provide services to external clients depends upon the ability of employees to satisfy the needs of their internal clients. Conservation Engineering provides a service to wildlife and fisheries management employees and ultimately, wildlife and fisheries enthusiasts who enjoy the resource. The program has experienced an increase in workload including major hatchery projects, Regional Office renovations, the Private Lands Public Wildlife (PLPW) Program, and the Hunting and Fishing Heritage Exposition (Expo) in addition to routine projects. Consisting of a small core of specialists, performance is greatly affected by the number of personnel and workload. Since FY08, Conservation Engineering has had a full complement of consistent, qualified staff along with a firm, customer-friendly leadership base, which is believed to have improved employee satisfaction. From a low in satisfaction rates in FY 07, the five-year average has remained above the 89 percent mark, with satisfaction levels in FY 09 & FY10 reaching 91 and 95 percent respectively. What we propose to improve performance in the next two years: • With three full years under the leadership of a new Chief Engineer, Conservation
Engineering was able to implement some adaptive changes and showed positive signs for improving courteousness and professionalism. This is reflected in the FY 09 satisfaction rating of 90.7 percent and the FY10 94.8 percent satisfaction rating by Department employees. With the addition of a new assistant engineer as well as
0
20
40
60
80
100
FY 07 FY 08 FY 09 FY10 FY11
% E
mpl
oyee
s Sa
tisfie
d
32
consistent and improved communication among Conservation Engineering staff, a high level of performance in this area is expected to be sustained or increased in the future.
Performance Measure #2: Percent of employees satisfied with the level of attention and timeliness provided (Personnel with this program will work to ensure that at least 70% of employees are satisfied with the level of attention and timeliness provided).
0
20
40
60
80
100
FY 07 FY 08 FY 09 FY10 FY11
% E
mpl
oyee
s S
atis
fied
Story behind the performance: Annually, the Internal Client Satisfaction survey is distributed to Department personnel. The survey provides the opportunity for employees to measure the overall performance of 14 Department programs. In many respects, the ability of the Department to provide services to external clients depends upon the ability of employees to satisfy the needs of their internal clients. Conservation Engineering replaced the Chief Engineer, Assistant Engineer, Surveyor, and two Draftsmen over the last several years. With new, qualified employees now in these positions, Conservation Engineering has improved its relationship and communication with other employees and subsequently the attention and timeliness of services provided. With a five-year average of 79.1 percent, the FY 10, 83.2 percent satisfaction rate indicates that Department employees who interact with Conservation Engineering staff have noticed efforts towards attention and timeliness. What we propose to improve performance in the next two years: • With a full compliment of employees on board and with a new direction in leadership
in the Conservation Engineering program, immediate strides in improving performance are apparent over the last several years with ratings of 66 percent in FY 07, 82.6 percent in FY 09 and 83.2 percent in FY10. Redoubling of efforts toward timeliness and attentiveness to clients as well as maintaining qualified, responsible, and responsive employees is expected to be reflected in improvement over the next two years.
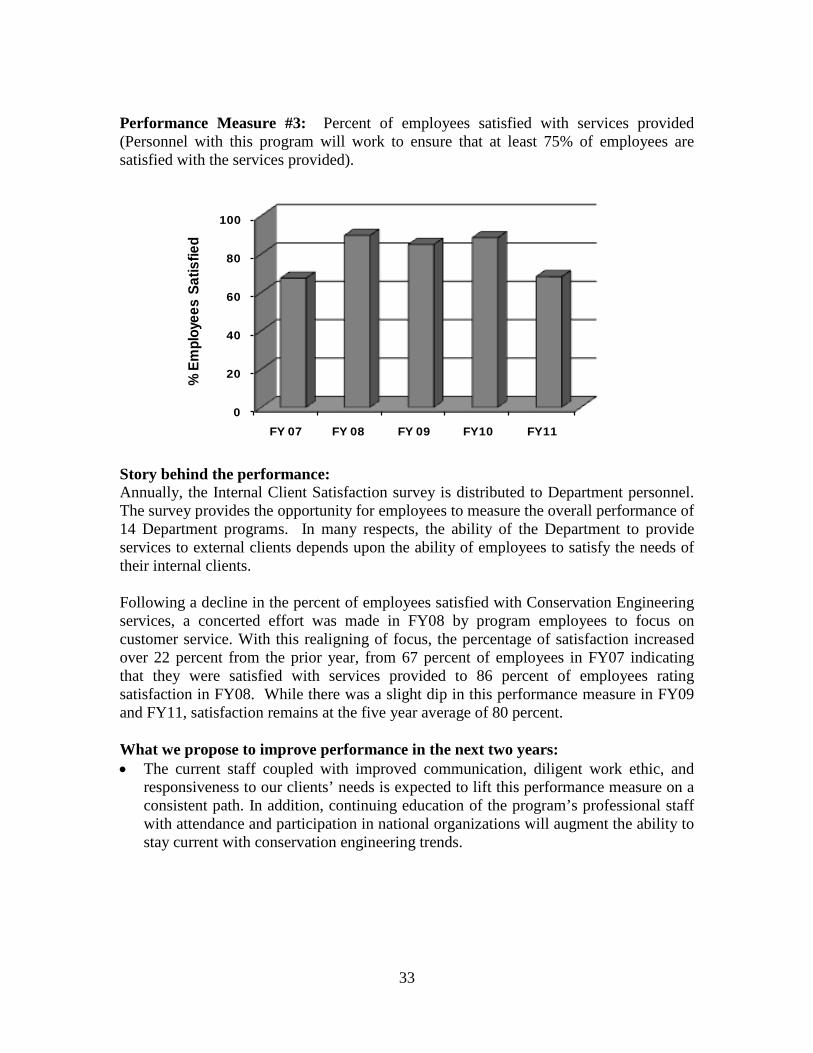
33
Performance Measure #3: Percent of employees satisfied with services provided (Personnel with this program will work to ensure that at least 75% of employees are satisfied with the services provided).
0
20
40
60
80
100
FY 07 FY 08 FY 09 FY10 FY11
% E
mpl
oyee
s Sa
tisfie
d
Story behind the performance: Annually, the Internal Client Satisfaction survey is distributed to Department personnel. The survey provides the opportunity for employees to measure the overall performance of 14 Department programs. In many respects, the ability of the Department to provide services to external clients depends upon the ability of employees to satisfy the needs of their internal clients. Following a decline in the percent of employees satisfied with Conservation Engineering services, a concerted effort was made in FY08 by program employees to focus on customer service. With this realigning of focus, the percentage of satisfaction increased over 22 percent from the prior year, from 67 percent of employees in FY07 indicating that they were satisfied with services provided to 86 percent of employees rating satisfaction in FY08. While there was a slight dip in this performance measure in FY09 and FY11, satisfaction remains at the five year average of 80 percent. What we propose to improve performance in the next two years: • The current staff coupled with improved communication, diligent work ethic, and
responsiveness to our clients’ needs is expected to lift this performance measure on a consistent path. In addition, continuing education of the program’s professional staff with attendance and participation in national organizations will augment the ability to stay current with conservation engineering trends.
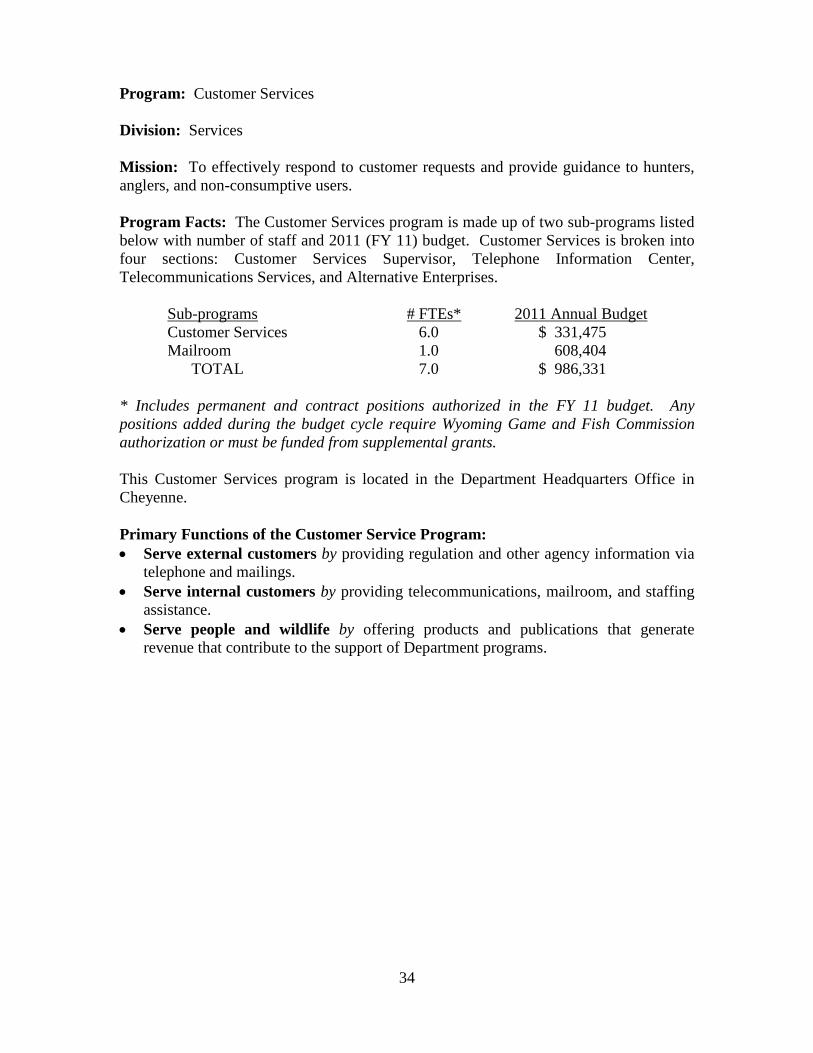
34
Program: Customer Services Division: Services Mission: To effectively respond to customer requests and provide guidance to hunters, anglers, and non-consumptive users. Program Facts: The Customer Services program is made up of two sub-programs listed below with number of staff and 2011 (FY 11) budget. Customer Services is broken into four sections: Customer Services Supervisor, Telephone Information Center, Telecommunications Services, and Alternative Enterprises. Sub-programs # FTEs* 2011 Annual Budget Customer Services 6.0 $ 331,475
Mailroom 1.0 608,404 TOTAL 7.0 $ 986,331
* Includes permanent and contract positions authorized in the FY 11 budget. Any positions added during the budget cycle require Wyoming Game and Fish Commission authorization or must be funded from supplemental grants. This Customer Services program is located in the Department Headquarters Office in Cheyenne. Primary Functions of the Customer Service Program: • Serve external customers by providing regulation and other agency information via
telephone and mailings. • Serve internal customers by providing telecommunications, mailroom, and staffing
assistance. • Serve people and wildlife by offering products and publications that generate
revenue that contribute to the support of Department programs.
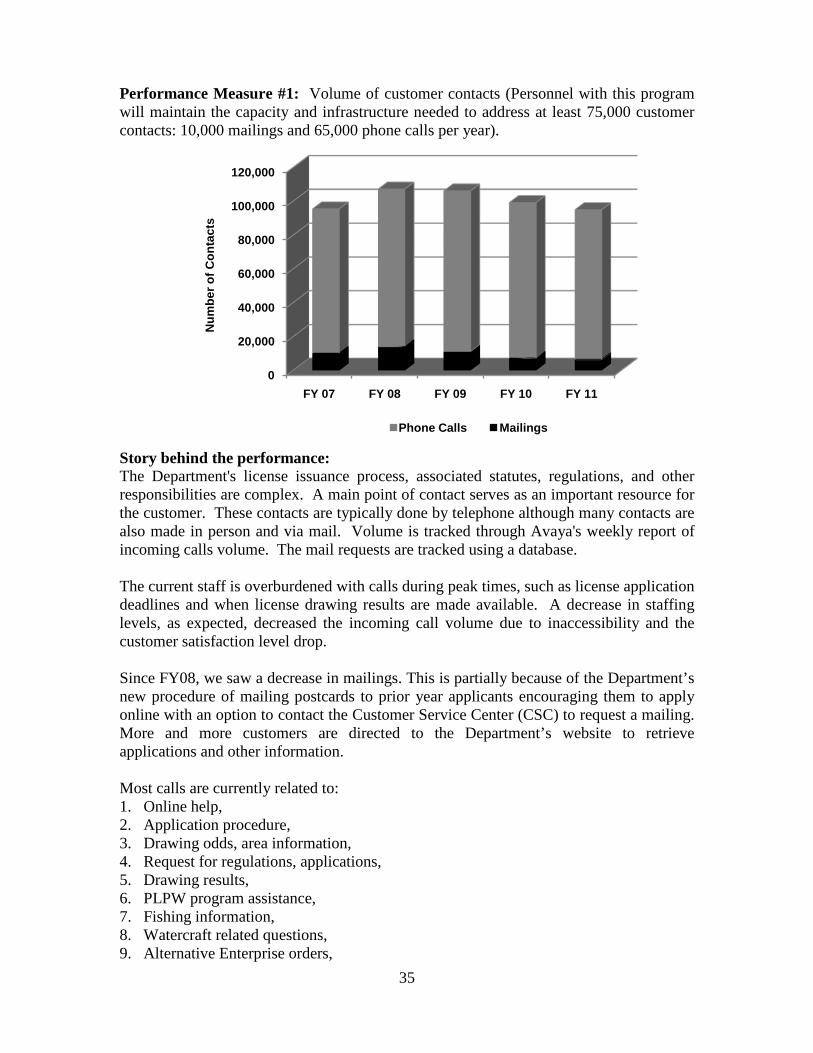
35
Performance Measure #1: Volume of customer contacts (Personnel with this program will maintain the capacity and infrastructure needed to address at least 75,000 customer contacts: 10,000 mailings and 65,000 phone calls per year).
Story behind the performance: The Department's license issuance process, associated statutes, regulations, and other responsibilities are complex. A main point of contact serves as an important resource for the customer. These contacts are typically done by telephone although many contacts are also made in person and via mail. Volume is tracked through Avaya's weekly report of incoming calls volume. The mail requests are tracked using a database. The current staff is overburdened with calls during peak times, such as license application deadlines and when license drawing results are made available. A decrease in staffing levels, as expected, decreased the incoming call volume due to inaccessibility and the customer satisfaction level drop. Since FY08, we saw a decrease in mailings. This is partially because of the Department’s new procedure of mailing postcards to prior year applicants encouraging them to apply online with an option to contact the Customer Service Center (CSC) to request a mailing. More and more customers are directed to the Department’s website to retrieve applications and other information. Most calls are currently related to: 1. Online help, 2. Application procedure, 3. Drawing odds, area information, 4. Request for regulations, applications, 5. Drawing results, 6. PLPW program assistance, 7. Fishing information, 8. Watercraft related questions, 9. Alternative Enterprise orders,
0
20,000
40,000
60,000
80,000
100,000
120,000
FY 07 FY 08 FY 09 FY 10 FY 11
Num
ber o
f Con
tact
s
Phone Calls Mailings
36
10. Hunter Safety information, and 11. General regulations Since FY07, the average annual number of mailings has been 9,740. The average annual number of phone calls has been 90,727. In FY11, the Customer Service staff managed 6,383 mailings and over 88,000 phone calls. Mailings are down considerably which is due to redirecting customers to the website. What we propose to improve performance in the next two years: • Continue to serve our customers via telephone and mailings while continuing to assist
a growing number of sportspersons who are applying online. • We will lower the number of transfer calls to other work units by using information
material provided to us and encouraging communication between work units. Performance Measure #2: Number of Departmental telecommunication requests handled (Personnel with this program will maintain the capacity and infrastructure to handle at least 400 telecommunication requests from Department employees per year).
Story behind the performance: Currently, one customer service employee staffs this section as part-time duties. The employee's main duties include serving as the customer service center lead worker. As the Telecommunications Liaison, this employee serves as the point of contact for Department employees, Information Technology Division (ITD), and private vendors for all telecommunication related issues. This section has been relied upon more than in the past due to the rapid pace of the cellular environment. This is expected to continue as the cellular industry moves away from support of analog cellular service. The main types of calls are cell phone upgrades, replacements, plan or billing changes, general inquiries, disconnections, and service and repair calls for landlines. Work orders are submitted through Telemaster Software for cellular needs, construction or telecommunication equipment requests. The ITD help desk is contacted for troubleshooting phone issues throughout the state. The Basic Call Management System
0
100
200
300
400
500
600
700
FY 07 FY 08 FY 09 FY 10 FY11
Num
ber o
f Req
uest
s
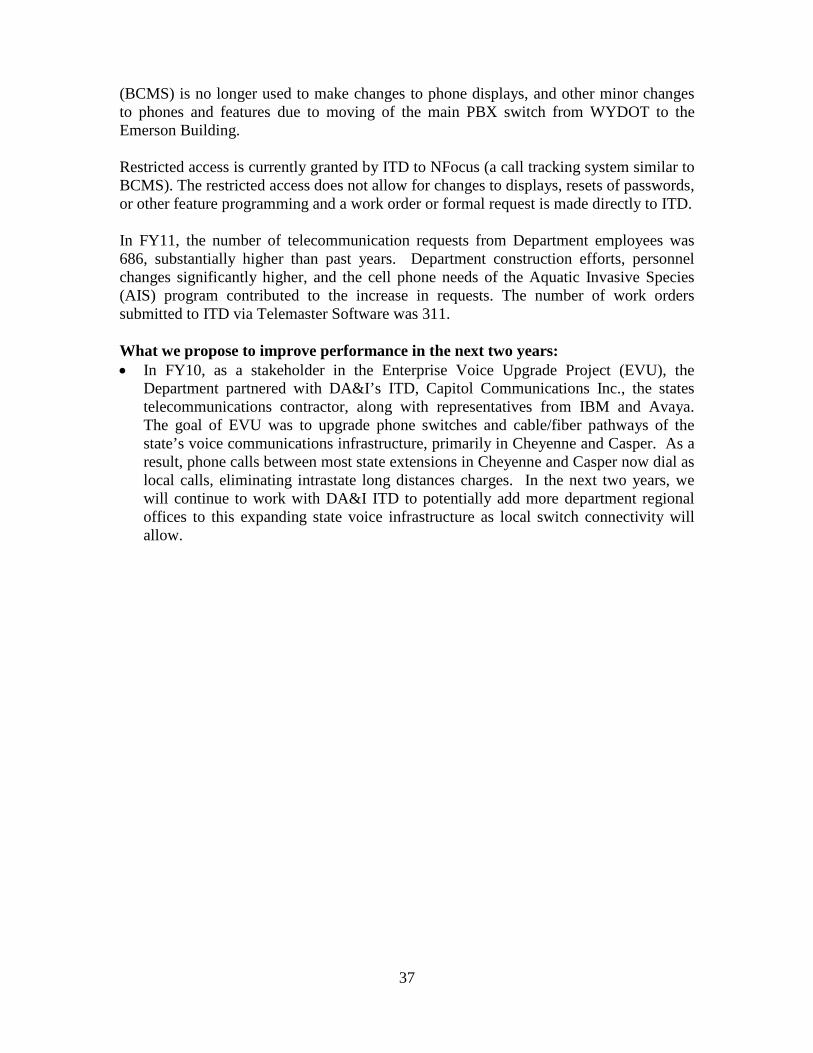
37
(BCMS) is no longer used to make changes to phone displays, and other minor changes to phones and features due to moving of the main PBX switch from WYDOT to the Emerson Building. Restricted access is currently granted by ITD to NFocus (a call tracking system similar to BCMS). The restricted access does not allow for changes to displays, resets of passwords, or other feature programming and a work order or formal request is made directly to ITD. In FY11, the number of telecommunication requests from Department employees was 686, substantially higher than past years. Department construction efforts, personnel changes significantly higher, and the cell phone needs of the Aquatic Invasive Species (AIS) program contributed to the increase in requests. The number of work orders submitted to ITD via Telemaster Software was 311. What we propose to improve performance in the next two years: • In FY10, as a stakeholder in the Enterprise Voice Upgrade Project (EVU), the
Department partnered with DA&I’s ITD, Capitol Communications Inc., the states telecommunications contractor, along with representatives from IBM and Avaya. The goal of EVU was to upgrade phone switches and cable/fiber pathways of the state’s voice communications infrastructure, primarily in Cheyenne and Casper. As a result, phone calls between most state extensions in Cheyenne and Casper now dial as local calls, eliminating intrastate long distances charges. In the next two years, we will continue to work with DA&I ITD to potentially add more department regional offices to this expanding state voice infrastructure as local switch connectivity will allow.
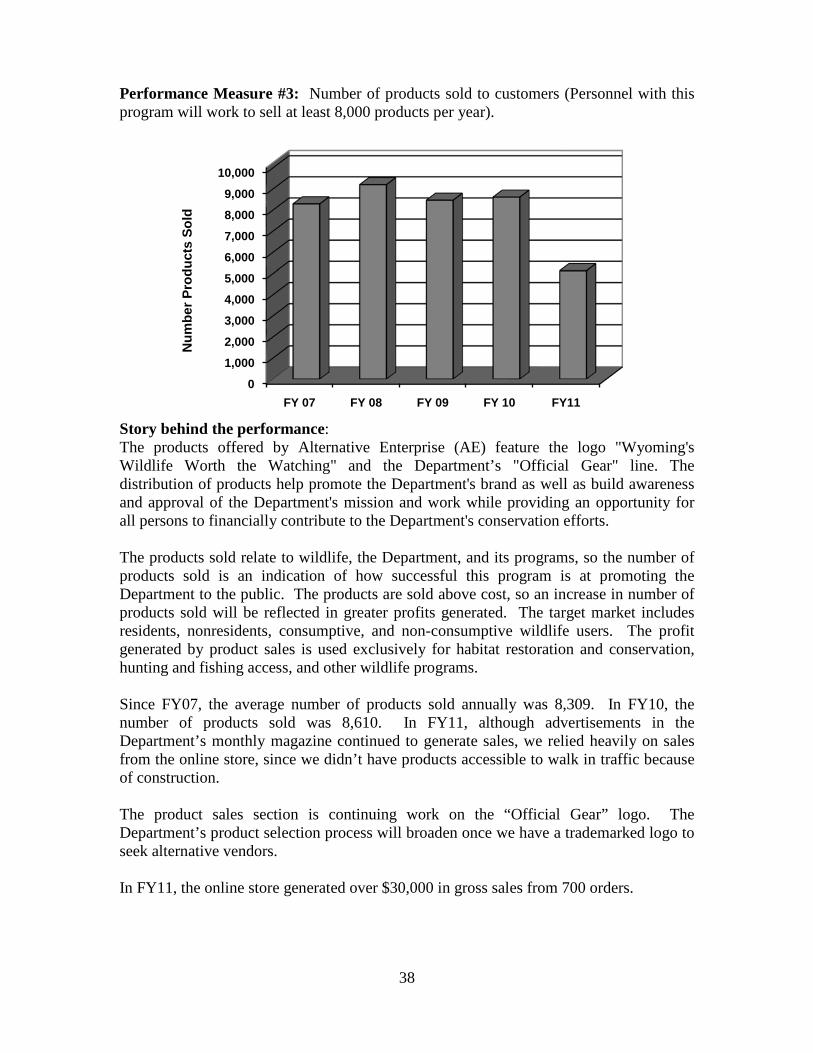
38
Performance Measure #3: Number of products sold to customers (Personnel with this program will work to sell at least 8,000 products per year).
Story behind the performance: The products offered by Alternative Enterprise (AE) feature the logo "Wyoming's Wildlife Worth the Watching" and the Department’s "Official Gear" line. The distribution of products help promote the Department's brand as well as build awareness and approval of the Department's mission and work while providing an opportunity for all persons to financially contribute to the Department's conservation efforts. The products sold relate to wildlife, the Department, and its programs, so the number of products sold is an indication of how successful this program is at promoting the Department to the public. The products are sold above cost, so an increase in number of products sold will be reflected in greater profits generated. The target market includes residents, nonresidents, consumptive, and non-consumptive wildlife users. The profit generated by product sales is used exclusively for habitat restoration and conservation, hunting and fishing access, and other wildlife programs. Since FY07, the average number of products sold annually was 8,309. In FY10, the number of products sold was 8,610. In FY11, although advertisements in the Department’s monthly magazine continued to generate sales, we relied heavily on sales from the online store, since we didn’t have products accessible to walk in traffic because of construction. The product sales section is continuing work on the “Official Gear” logo. The Department’s product selection process will broaden once we have a trademarked logo to seek alternative vendors. In FY11, the online store generated over $30,000 in gross sales from 700 orders.
0
1,000
2,000
3,000
4,000
5,000
6,000
7,000
8,000
9,000
10,000
FY 07 FY 08 FY 09 FY 10 FY11
Num
ber P
rodu
cts
Sold
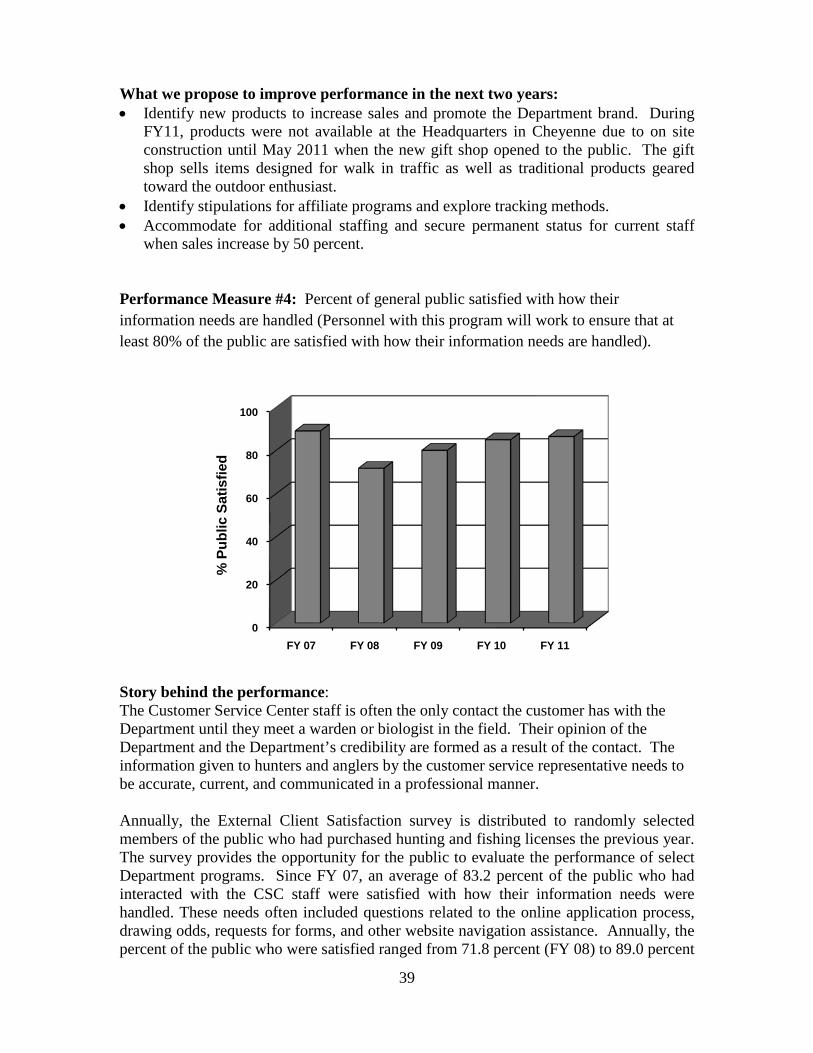
39
What we propose to improve performance in the next two years: • Identify new products to increase sales and promote the Department brand. During
FY11, products were not available at the Headquarters in Cheyenne due to on site construction until May 2011 when the new gift shop opened to the public. The gift shop sells items designed for walk in traffic as well as traditional products geared toward the outdoor enthusiast.
• Identify stipulations for affiliate programs and explore tracking methods. • Accommodate for additional staffing and secure permanent status for current staff
when sales increase by 50 percent. Performance Measure #4: Percent of general public satisfied with how their information needs are handled (Personnel with this program will work to ensure that at least 80% of the public are satisfied with how their information needs are handled).
Story behind the performance: The Customer Service Center staff is often the only contact the customer has with the Department until they meet a warden or biologist in the field. Their opinion of the Department and the Department’s credibility are formed as a result of the contact. The information given to hunters and anglers by the customer service representative needs to be accurate, current, and communicated in a professional manner. Annually, the External Client Satisfaction survey is distributed to randomly selected members of the public who had purchased hunting and fishing licenses the previous year. The survey provides the opportunity for the public to evaluate the performance of select Department programs. Since FY 07, an average of 83.2 percent of the public who had interacted with the CSC staff were satisfied with how their information needs were handled. These needs often included questions related to the online application process, drawing odds, requests for forms, and other website navigation assistance. Annually, the percent of the public who were satisfied ranged from 71.8 percent (FY 08) to 89.0 percent
0
20
40
60
80
100
FY 07 FY 08 FY 09 FY 10 FY 11
% P
ublic
Sat
isfie
d
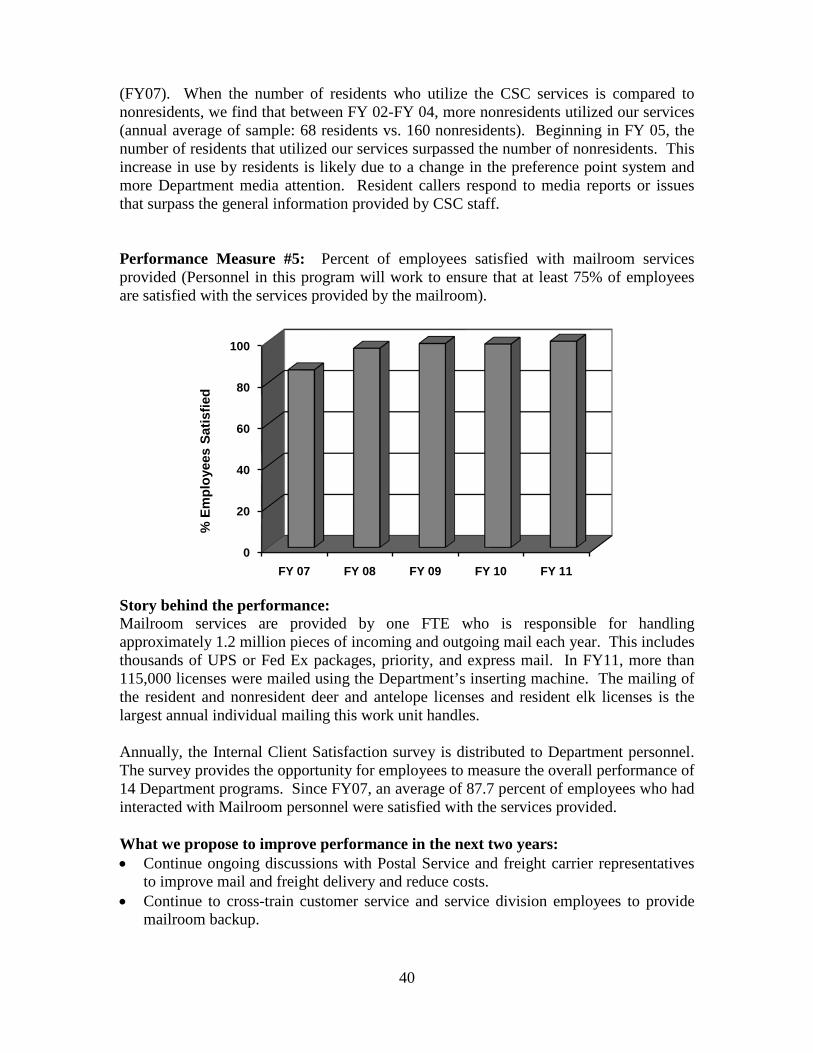
40
(FY07). When the number of residents who utilize the CSC services is compared to nonresidents, we find that between FY 02-FY 04, more nonresidents utilized our services (annual average of sample: 68 residents vs. 160 nonresidents). Beginning in FY 05, the number of residents that utilized our services surpassed the number of nonresidents. This increase in use by residents is likely due to a change in the preference point system and more Department media attention. Resident callers respond to media reports or issues that surpass the general information provided by CSC staff. Performance Measure #5: Percent of employees satisfied with mailroom services provided (Personnel in this program will work to ensure that at least 75% of employees are satisfied with the services provided by the mailroom).
Story behind the performance: Mailroom services are provided by one FTE who is responsible for handling approximately 1.2 million pieces of incoming and outgoing mail each year. This includes thousands of UPS or Fed Ex packages, priority, and express mail. In FY11, more than 115,000 licenses were mailed using the Department’s inserting machine. The mailing of the resident and nonresident deer and antelope licenses and resident elk licenses is the largest annual individual mailing this work unit handles. Annually, the Internal Client Satisfaction survey is distributed to Department personnel. The survey provides the opportunity for employees to measure the overall performance of 14 Department programs. Since FY07, an average of 87.7 percent of employees who had interacted with Mailroom personnel were satisfied with the services provided. What we propose to improve performance in the next two years: • Continue ongoing discussions with Postal Service and freight carrier representatives
to improve mail and freight delivery and reduce costs. • Continue to cross-train customer service and service division employees to provide
mailroom backup.
0
20
40
60
80
100
FY 07 FY 08 FY 09 FY 10 FY 11
% E
mpl
oyee
s Sa
tisfie
d
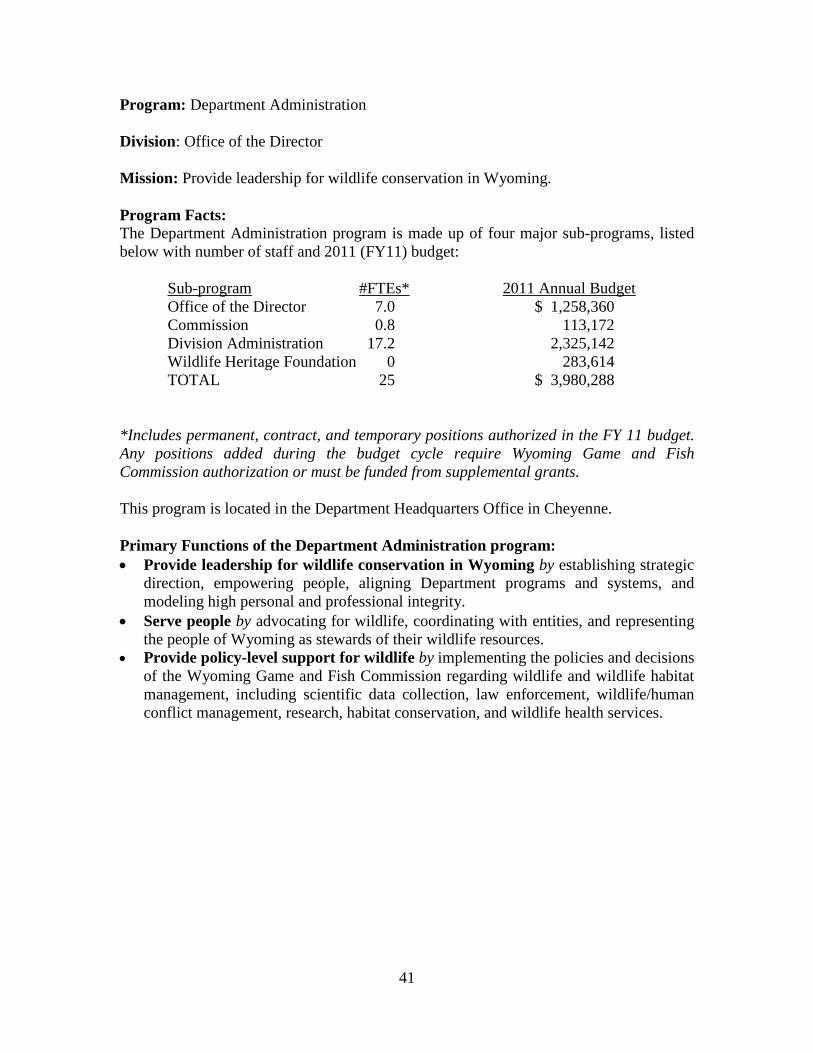
41
Program: Department Administration Division: Office of the Director Mission: Provide leadership for wildlife conservation in Wyoming. Program Facts: The Department Administration program is made up of four major sub-programs, listed below with number of staff and 2011 (FY11) budget: Sub-program #FTEs* 2011 Annual Budget
Office of the Director 7.0 $ 1,258,360 Commission 0.8 113,172 Division Administration 17.2 2,325,142 Wildlife Heritage Foundation 0 283,614
TOTAL 25 $ 3,980,288
*Includes permanent, contract, and temporary positions authorized in the FY 11 budget. Any positions added during the budget cycle require Wyoming Game and Fish Commission authorization or must be funded from supplemental grants. This program is located in the Department Headquarters Office in Cheyenne. Primary Functions of the Department Administration program: • Provide leadership for wildlife conservation in Wyoming by establishing strategic
direction, empowering people, aligning Department programs and systems, and modeling high personal and professional integrity.
• Serve people by advocating for wildlife, coordinating with entities, and representing the people of Wyoming as stewards of their wildlife resources.
• Provide policy-level support for wildlife by implementing the policies and decisions of the Wyoming Game and Fish Commission regarding wildlife and wildlife habitat management, including scientific data collection, law enforcement, wildlife/human conflict management, research, habitat conservation, and wildlife health services.
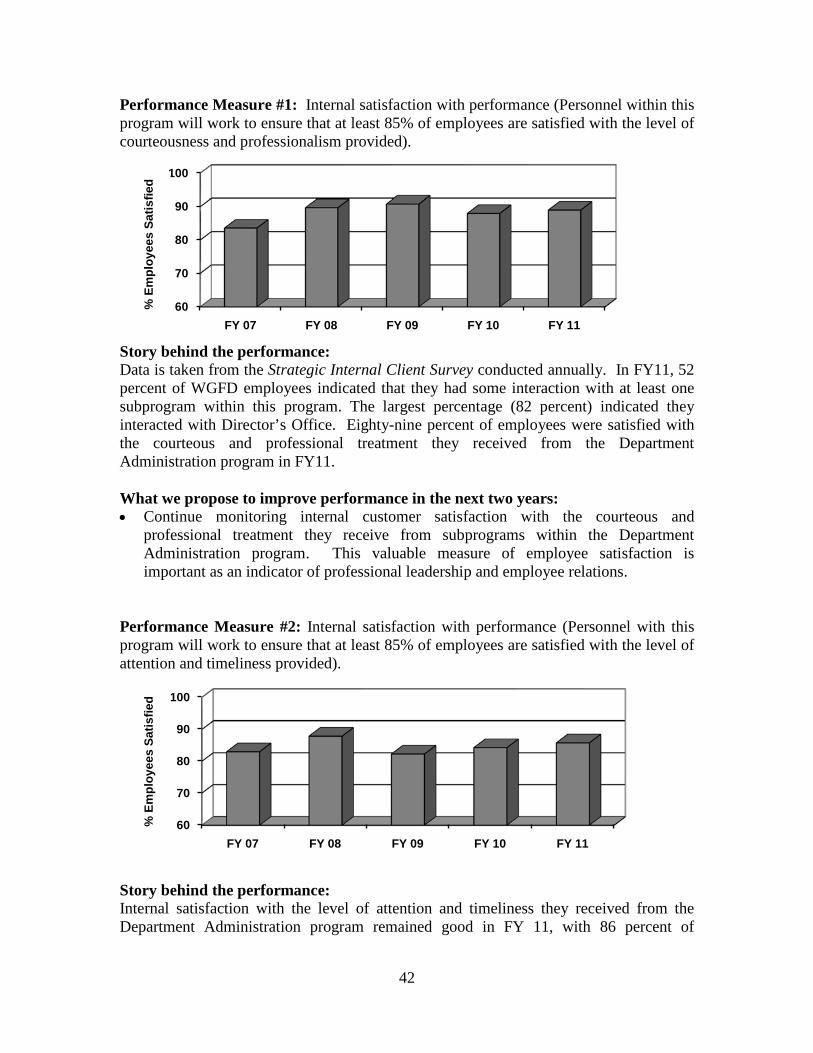
42
Performance Measure #1: Internal satisfaction with performance (Personnel within this program will work to ensure that at least 85% of employees are satisfied with the level of courteousness and professionalism provided).
Story behind the performance: Data is taken from the Strategic Internal Client Survey conducted annually. In FY11, 52 percent of WGFD employees indicated that they had some interaction with at least one subprogram within this program. The largest percentage (82 percent) indicated they interacted with Director’s Office. Eighty-nine percent of employees were satisfied with the courteous and professional treatment they received from the Department Administration program in FY11. What we propose to improve performance in the next two years: • Continue monitoring internal customer satisfaction with the courteous and
professional treatment they receive from subprograms within the Department Administration program. This valuable measure of employee satisfaction is important as an indicator of professional leadership and employee relations.
Performance Measure #2: Internal satisfaction with performance (Personnel with this program will work to ensure that at least 85% of employees are satisfied with the level of attention and timeliness provided).
Story behind the performance: Internal satisfaction with the level of attention and timeliness they received from the Department Administration program remained good in FY 11, with 86 percent of
60
70
80
90
100
FY 07 FY 08 FY 09 FY 10 FY 11
60
70
80
90
100
FY 07 FY 08 FY 09 FY 10 FY 11
% E
mpl
oyee
s Sa
tisfie
d %
Em
ploy
ees
Satis
fied
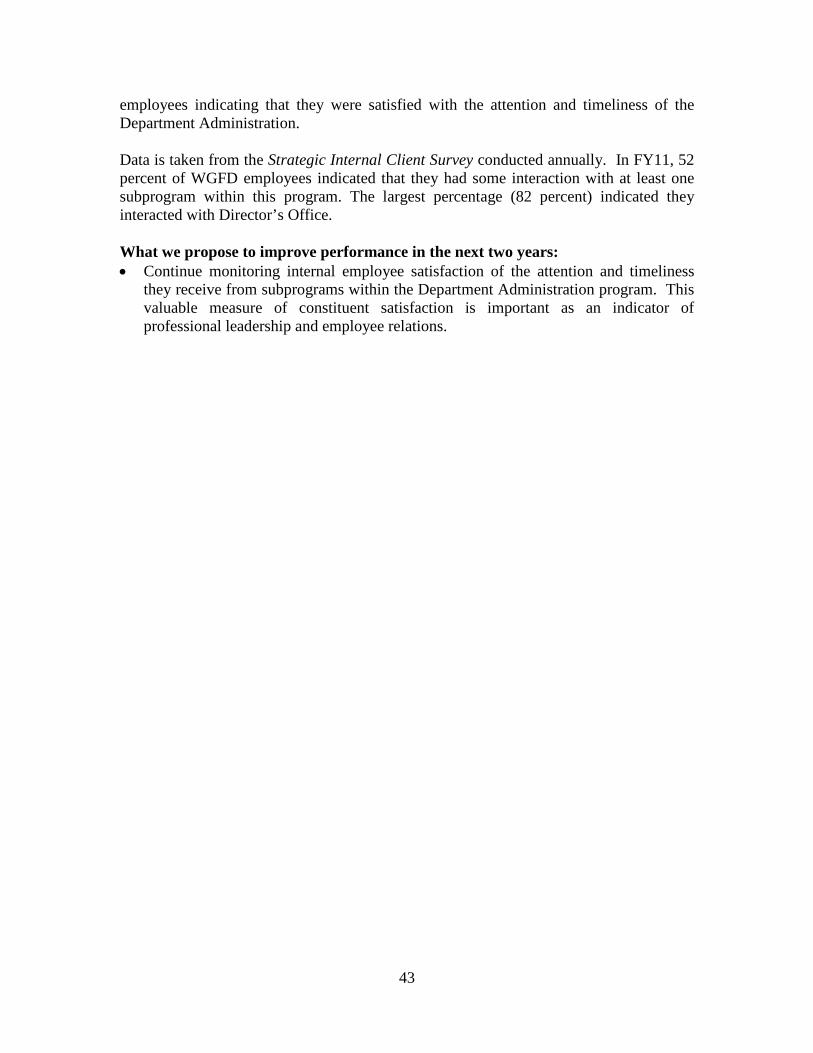
43
employees indicating that they were satisfied with the attention and timeliness of the Department Administration. Data is taken from the Strategic Internal Client Survey conducted annually. In FY11, 52 percent of WGFD employees indicated that they had some interaction with at least one subprogram within this program. The largest percentage (82 percent) indicated they interacted with Director’s Office. What we propose to improve performance in the next two years: • Continue monitoring internal employee satisfaction of the attention and timeliness
they receive from subprograms within the Department Administration program. This valuable measure of constituent satisfaction is important as an indicator of professional leadership and employee relations.
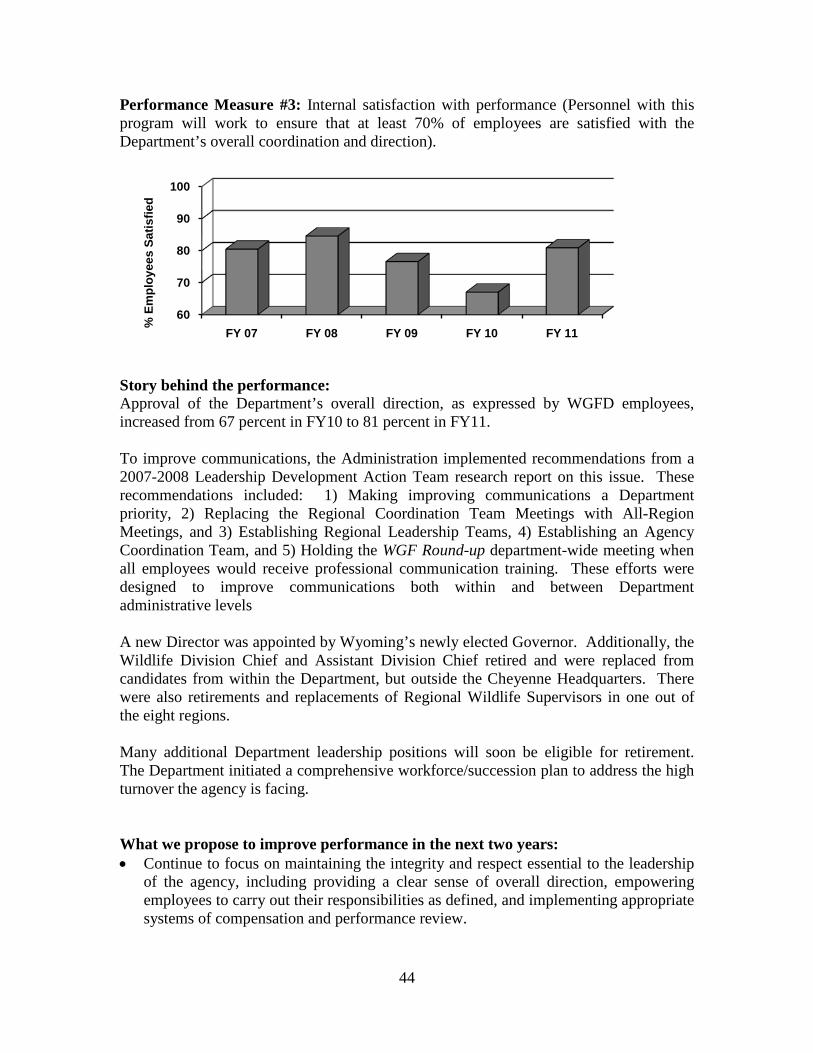
44
Performance Measure #3: Internal satisfaction with performance (Personnel with this program will work to ensure that at least 70% of employees are satisfied with the Department’s overall coordination and direction).
Story behind the performance: Approval of the Department’s overall direction, as expressed by WGFD employees, increased from 67 percent in FY10 to 81 percent in FY11. To improve communications, the Administration implemented recommendations from a 2007-2008 Leadership Development Action Team research report on this issue. These recommendations included: 1) Making improving communications a Department priority, 2) Replacing the Regional Coordination Team Meetings with All-Region Meetings, and 3) Establishing Regional Leadership Teams, 4) Establishing an Agency Coordination Team, and 5) Holding the WGF Round-up department-wide meeting when all employees would receive professional communication training. These efforts were designed to improve communications both within and between Department administrative levels A new Director was appointed by Wyoming’s newly elected Governor. Additionally, the Wildlife Division Chief and Assistant Division Chief retired and were replaced from candidates from within the Department, but outside the Cheyenne Headquarters. There were also retirements and replacements of Regional Wildlife Supervisors in one out of the eight regions. Many additional Department leadership positions will soon be eligible for retirement. The Department initiated a comprehensive workforce/succession plan to address the high turnover the agency is facing. What we propose to improve performance in the next two years: • Continue to focus on maintaining the integrity and respect essential to the leadership
of the agency, including providing a clear sense of overall direction, empowering employees to carry out their responsibilities as defined, and implementing appropriate systems of compensation and performance review.
60
70
80
90
100
FY 07 FY 08 FY 09 FY 10 FY 11
% E
mpl
oyee
s Sa
tisfie
d
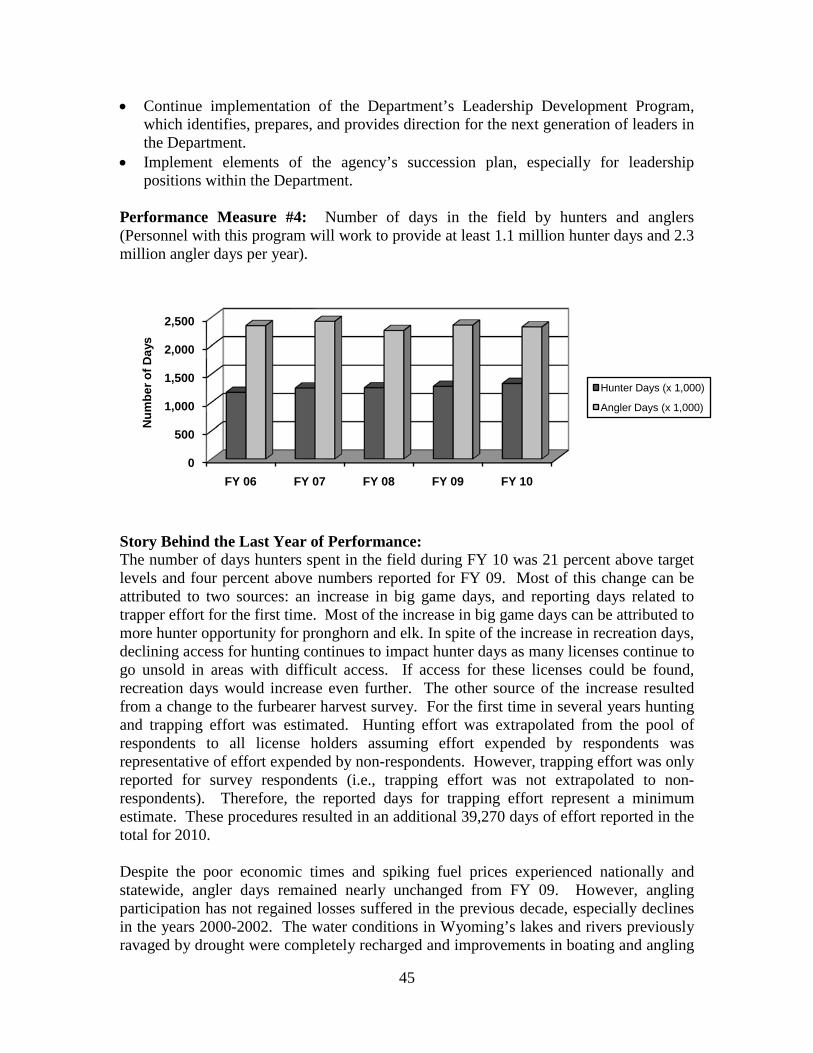
45
• Continue implementation of the Department’s Leadership Development Program, which identifies, prepares, and provides direction for the next generation of leaders in the Department.
• Implement elements of the agency’s succession plan, especially for leadership positions within the Department.
Performance Measure #4: Number of days in the field by hunters and anglers (Personnel with this program will work to provide at least 1.1 million hunter days and 2.3 million angler days per year).
Story Behind the Last Year of Performance: The number of days hunters spent in the field during FY 10 was 21 percent above target levels and four percent above numbers reported for FY 09. Most of this change can be attributed to two sources: an increase in big game days, and reporting days related to trapper effort for the first time. Most of the increase in big game days can be attributed to more hunter opportunity for pronghorn and elk. In spite of the increase in recreation days, declining access for hunting continues to impact hunter days as many licenses continue to go unsold in areas with difficult access. If access for these licenses could be found, recreation days would increase even further. The other source of the increase resulted from a change to the furbearer harvest survey. For the first time in several years hunting and trapping effort was estimated. Hunting effort was extrapolated from the pool of respondents to all license holders assuming effort expended by respondents was representative of effort expended by non-respondents. However, trapping effort was only reported for survey respondents (i.e., trapping effort was not extrapolated to non-respondents). Therefore, the reported days for trapping effort represent a minimum estimate. These procedures resulted in an additional 39,270 days of effort reported in the total for 2010. Despite the poor economic times and spiking fuel prices experienced nationally and statewide, angler days remained nearly unchanged from FY 09. However, angling participation has not regained losses suffered in the previous decade, especially declines in the years 2000-2002. The water conditions in Wyoming’s lakes and rivers previously ravaged by drought were completely recharged and improvements in boating and angling
0
500
1,000
1,500
2,000
2,500
FY 06 FY 07 FY 08 FY 09 FY 10
Num
ber o
f Day
s
Hunter Days (x 1,000)
Angler Days (x 1,000)
46
conditions should provide increased opportunity in the future. In terms of license sales, resident annual licenses decreased slightly while non-resident annual licenses increased slightly since last year. Daily license sales for residents showed an increase while non-resident daily license sales decline by 8,000 (or four percent) in comparison to last year. For the period FY06 – FY10, Wyoming residents and nonresidents have expended an average of 1,261,381 hunter days (includes the final FY 08 data; preliminary data were used in the 2009 Annual Report) and 2,349,262 angler days. In FY 10, 1,334,416 hunter recreation days and 2,331,446 angler recreation days were provided. Values reflect Lifetime License holders included in the estimate of angler recreation days. What has been Accomplished: Declining hunting and fishing access is being partially addressed through the Department’s Private Lands Public Wildlife (PLPW) Access Program. The enrollment in each program for calendar year 2010 was: Hunter Management, 1,099,125 acres; Walk-in Hunting, 681,683 acres; Walk-in Fishing lake acres, 4,944 acres; and Walk-in Fishing stream miles, 96 miles. Based on data presented in the 2010 PLPW Annual Report, the average enrollment in each program for 2006-2010 was: Hunter Management, 911,156 acres; Walk-in Hunting, 622,664 acres; Walk-in Fishing lake acres, 2,134 acres; and Walk-in Fishing stream miles, 92 miles. The PLPW Access Program is an important strategy for increasing hunting and fishing access to private and landlocked public land. Combined with public lands that were associated with the enrolled private lands, the PLPW Access Program provided approximately 3.47 million acres of hunting access for the fall 2010/spring 2011 hunting seasons. The Department will continue to explore options for enhancing hunting and fishing access to private lands. In FY 10, the Department continued to concentrate on modernizing and repairing aging boating access infrastructure. Major repair of aging roads, parking areas, and comfort stations was a focus for a majority of work completed by our boating access program. The Department’s Fish Wyoming program assisted with angler workshops and fishing rod hand-outs for fishing workshop participants and students attending EXPO. The Department continues to manage wildlife populations as needed through elk feedgrounds, fish hatcheries, and bird farms. Veterinary Services’ efforts to address terrestrial wildlife diseases were approved, as were funds to prevent whirling disease at two fish culture facilities. These improvements to fish culture facilities are expected to lead to advancement in disease prevention techniques and allow for greater flexibility in the stocking trout in order to meet angler needs. What we propose to improve performance in next two years: With above normal precipitation during the last few years, water levels in our streams and rivers have led to a recovery of fisheries diminished by persistent drought; this bodes well for future fishing success. As fisheries improve in response to improved habitat conditions, fishing success should improve also. Fishing success in terms of improved catch rates tend to improve fishing participation and license sales to the extent economic factors will allow. The increased capacity of the Speas Rearing Station has made it

47
possible to respond to improving reservoir conditions by stocking more pounds of trout which should speed the recovery of our popular reservoir fisheries. Changes in private land ownership, which is affecting public access, the primary and secondary effects of mineral development, and changes in societal interests are also compounding the problem. The Department will continue to encourage hunter and angler recruitment, seek ways to maintain and increase access, improve habitat and advertise the opportunities Wyoming offers.
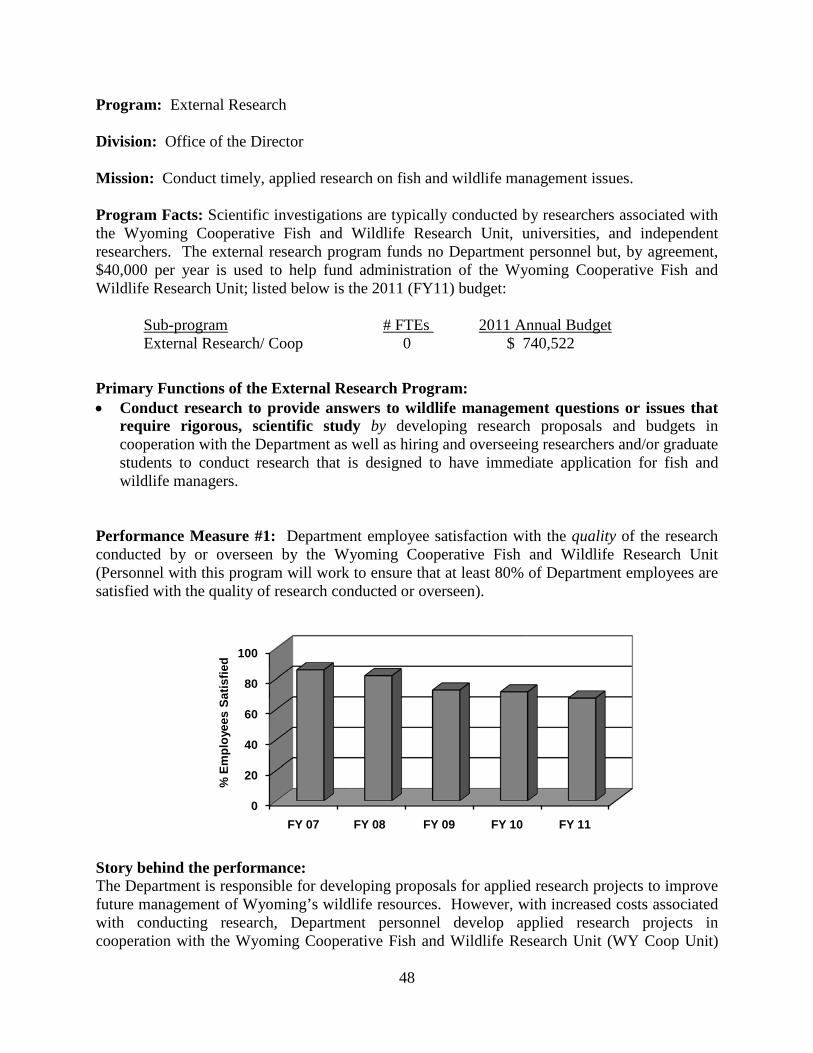
48
Program: External Research Division: Office of the Director Mission: Conduct timely, applied research on fish and wildlife management issues. Program Facts: Scientific investigations are typically conducted by researchers associated with the Wyoming Cooperative Fish and Wildlife Research Unit, universities, and independent researchers. The external research program funds no Department personnel but, by agreement, $40,000 per year is used to help fund administration of the Wyoming Cooperative Fish and Wildlife Research Unit; listed below is the 2011 (FY11) budget:
Sub-program # FTEs 2011 Annual Budget External Research/ Coop 0 $ 740,522
Primary Functions of the External Research Program: • Conduct research to provide answers to wildlife management questions or issues that
require rigorous, scientific study by developing research proposals and budgets in cooperation with the Department as well as hiring and overseeing researchers and/or graduate students to conduct research that is designed to have immediate application for fish and wildlife managers.
Performance Measure #1: Department employee satisfaction with the quality of the research conducted by or overseen by the Wyoming Cooperative Fish and Wildlife Research Unit (Personnel with this program will work to ensure that at least 80% of Department employees are satisfied with the quality of research conducted or overseen).
Story behind the performance: The Department is responsible for developing proposals for applied research projects to improve future management of Wyoming’s wildlife resources. However, with increased costs associated with conducting research, Department personnel develop applied research projects in cooperation with the Wyoming Cooperative Fish and Wildlife Research Unit (WY Coop Unit)
0
20
40
60
80
100
FY 07 FY 08 FY 09 FY 10 FY 11
% E
mpl
oyee
s Sa
tisfie
d
49
and other researchers. These proposals are ranked and prioritized by Fish and Wildlife Divisions for funding. With the exception of some wildlife veterinary research, all Department research is outsourced to the WY Coop Unit, universities, and other contracted researchers. Therefore, we rigorously seek qualified researchers to assist with our research questions. Typically, the majority of research funding has gone to funding researchers hired or directed by the WY Coop Unit. Annually, the Department evaluates the research product in terms of quality, especially whether the research product is applicable to current wildlife management questions and addresses the wildlife management questions posed in Department proposals. This evaluation is conducted via the Internal Client Satisfaction survey, which is distributed to Department personnel. Starting with the FY 03 survey, two separate questions were created to recognize the distinction between quality and quantity. Since FY07, an average of 76 percent of Department employees who had interacted with the members of the WY Coop Unit were satisfied with the quality of research conducted or completed. The percentage was highest in FY07 (85.7 percent) and lowest in FY11 (67.3 percent). Some discontent regarding reduced capacity due to staffing challenges may have caused this perception regarding quality of work accomplished. It has been necessary to go outside Wyoming to meet fisheries research needs in recent years due to vacancies at the WY Coop Unit and diminished research capacity. During the past year, two successful searches were completed to fill the Assistant Lead for Wildlife and Assistant Lead for Fisheries positions at the WY Coop Unit. Dr. Anna Chalfoun (terrestrial nongame wildlife) and Dr. Annika Walters (fish) were selected to fill these vacancies. The unit is now fully staffed with a leader and two assistant leaders for the first time in several years. Dr. Chalfoun was the Academic Research Professional working on nongame prior to accepting her current position as assistant unit leader. The Wildlife Division will continue to work with her to develop the terrestrial nongame research program. The Fish Division will assist the new Assistant Lead for Fisheries with the development of her research program, but will likely continue to utilize research expertise at other universities in the region as well. What has been accomplished: In FY11, the WY Coop Unit continued research on seven wildlife studies and began work on five others including:
1. Absaroka Front Elk Ecology Project evaluating habitat, season ranges, and migration patterns (ongoing);
2. Teton Range Bighorn Sheep Study evaluating winter range loss due to human use (ongoing);
3. Influence of climate and bear predation on moose (Post-doc, ongoing); 4. PxP Moose project pre-development work developing baseline information on moose
prior to energy development (new); 5. Ecology of fed versus nonfed elk in western Wyoming (Pinedale elk habitat study,
ongoing) evaluates the habitat use patterns, movement, and interchange among fed and non-fed elk wintering along the Wind River and Wyoming Range fronts focusing on migration routes, habitat use, forage utilization, winter distribution, season ranges, and brucellosis status;
50
6. Elk Pop-II Synthesis (Post-doc) looking at the effectiveness of WGFD population monitoring efforts (new);
7. Platte Valley Mule Deer population estimate using Idaho’s sightability technique (new); 8. Pine beetle outbreak impacts on nongame bird and mammal communities (ongoing)
evaluates the use of live and beetle-killed pine stands by mammalian, avian, and amphibian Species of Greatest Conservation Need (SGCN) and examines the extent to which adjacent spruce fir stands may provide temporary and spatial refugia for SGCN prior to lodge pole pine regeneration;
9. Energy development and songbirds (new); 10. Energy development and small mammals (ongoing, completed May 2011); 11. Wind energy development and grassland birds (new); 12. American Pika status in Wyoming (ongoing).
The Department also worked with other wildlife researchers at the University of Wyoming on:
1. Monitoring river otter in the Green River Basin and tributaries using hair and fecal DNA analysis and capture re-capture models (ongoing);
2. Revisiting old study sites in the Sierra Madre Range (Coon Creek) to evaluate wildlife response to broad-scale forest disturbance (ongoing).
The Department continues to work with the WY Coop Unit and other regional universities to meet continuing aquatic research needs. Six university research projects were completed in FY 11, two new projects were initiated and one is ongoing. The WY Coop Unit completed two projects in FY11. The first, utilized stable isotopes to identify the natal origins of a number of important Wyoming sport fishes. The second was an evaluation of the impacts of roads associated with energy development on herpetofauna in southwest Wyoming. A third project describing the distribution of aquatic gastropods was completed through the University of Wyoming (UW) Department of Zoology and Physiology. Two projects were also completed by researchers at Colorado State University (CSU); hornyhead chub distribution and ecology and larval drift of native suckers in the Big Sandy River. The sixth project completed was a project to describe the spatial ecology of midget-faded rattlesnakes in southwest Wyoming. This project was conducted by a team of researchers from the Orianne Society, Clayton State University (in Georgia), and the University of Idaho. Two new aquatic research projects were initiated in FY11. The first project is being conducted by researchers at CSU to determine the swimming and jumping abilities of multiple fish species for use in the design of effective barriers to fish passage. A second project, to describe the relationship between beaver and vegetation dynamics on Pole Mountain, was initiated through the UW Department of Renewable Resources. A project at CSU to develop a model to project the impacts of various climate change scenarios on Colorado River cutthroat trout entered its third and final year in FY 12. What we propose to improve performance in the next two years: • Seek to enhance funding for applied research in the fields of native species of concern,
wildlife diseases, big game, game bird, and sport fisheries.

51
• Work with new WY Coop Unit personnel to initiate research projects to benefit WGFD management personnel.
• Increase research capacity by continuing to match department research dollars with funds available from other funding partners. Much of this additional funding will be used to contract additional research through the WY Coop Unit, UW, CSU, and other entities to address concerns addressed in the State Wildlife Action Plan.
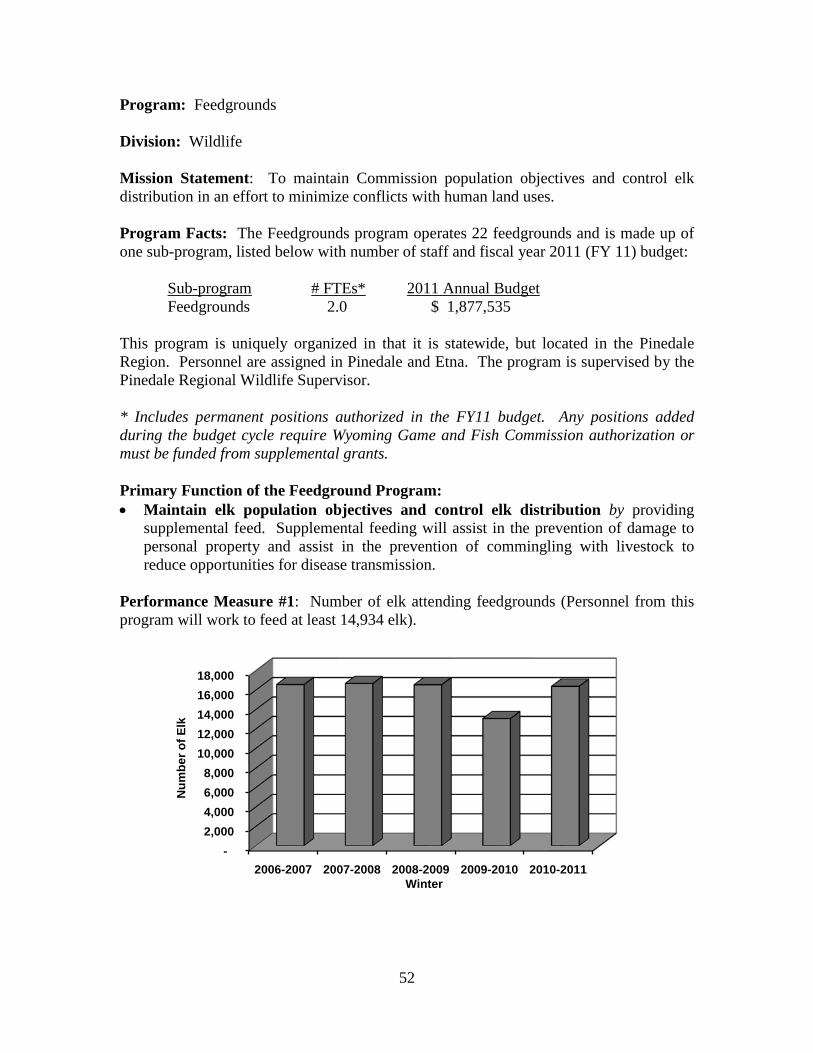
52
Program: Feedgrounds Division: Wildlife Mission Statement: To maintain Commission population objectives and control elk distribution in an effort to minimize conflicts with human land uses. Program Facts: The Feedgrounds program operates 22 feedgrounds and is made up of one sub-program, listed below with number of staff and fiscal year 2011 (FY 11) budget: Sub-program # FTEs* 2011 Annual Budget
Feedgrounds 2.0 $ 1,877,535 This program is uniquely organized in that it is statewide, but located in the Pinedale Region. Personnel are assigned in Pinedale and Etna. The program is supervised by the Pinedale Regional Wildlife Supervisor. * Includes permanent positions authorized in the FY11 budget. Any positions added during the budget cycle require Wyoming Game and Fish Commission authorization or must be funded from supplemental grants. Primary Function of the Feedground Program: • Maintain elk population objectives and control elk distribution by providing
supplemental feed. Supplemental feeding will assist in the prevention of damage to personal property and assist in the prevention of commingling with livestock to reduce opportunities for disease transmission.
Performance Measure #1: Number of elk attending feedgrounds (Personnel from this program will work to feed at least 14,934 elk).
-2,000 4,000 6,000 8,000
10,000 12,000 14,000 16,000 18,000
2006-2007 2007-2008 2008-2009 2009-2010 2010-2011
Num
ber o
f Elk
Winter
53
Story behind the performance: Elk feedgrounds have been an important management tool since the early 1900s. Elk conflicts with agriculture, such as damage to stored hay and feedlines, risk of cattle exposure to brucellosis because of commingling, deep snow accumulations, and loss of native ranges to development significantly impact the ability of elk to utilize native ranges without conflict. During most winters, elk feedgrounds maintain a significant percentage of the total elk population, while native ranges support relatively few elk. Wyoming constituents are accustomed to the increased elk hunting opportunities afforded by high elk numbers that are possible because of feeding. About 16,378 elk were fed during the winter of 2010-2011. This is 2,712 more than the 36 year average, a result of heavy winter snow conditions. Winter snow conditions began early and lasted late enough to utilize all hay inventories at the three Gros Ventre feedgrounds, Upper Green River, and Bench Corral feedgrounds. Soda Lake, Fall Creek, and Muddy Creek were within ten ton of utilizing all hay inventories. This is a stark contrast from last season where three feedgrounds completed the season without having to begin feeding operations. Local weather records show the 2010-2011 winter to be the best snow and water winter since the early eighties; a thirty-year winter. During the last five winters, the number of elk attending the feedgrounds has ranged between 13,054 elk (winter 2009-2010) and 16,666 elk (winter 2006-2007). In order to reduce damage/commingling conflicts and prevent excessive starvation, about 92 percent of the elk in the two regions were fed. Last season, about 77 percent were fed. In addition, emergency feeding operations took place in Buffalo Valley, Wilson, and Star Valley, where 180 additional tons of hay were fed. Western Wyoming has been under the influence of drought conditions for the past 12-20 years. Winter conditions during 2010-2011 were heavy and created early start dates, late end dates, and concentrated more elk on feedgrounds. Overall, the feeding season was 130 days in length. Sixty-four days longer than last season. The average feeding season is 125 days. Wolves continue to chase elk from and between feedgrounds. These factors can influence the number of elk counted on feedgrounds and/or fed. All elk herd units, with exception of the Hoback and Afton elk herd units (EHU), had elk numbers in excess of the individual quotas. This can be attributed to the heavy winter conditions. Again, to compare to last season (2009-2010), all EHU’s except one, were less than individual feedground quotas. On average, between 73 percent and 84 percent of the elk in the region are fed each year. This is because adequate native range is not available. These elk are fed at select locations that allow them to be attracted to feedgrounds. Feeding at these locations assists in keeping the elk away from potential commingling/damage situations. While elk attend feedgrounds, they are fed adequate hay (quantity and quality) to reduce starvation. Public acceptance for elk mortality on feedgrounds is low. Long-term average mortality from all causes does not exceed 1.5 percent on all feedgrounds combined. Mortality resulting from old age, hunter crippling, wolf predation, vaccination, and elk trapping cannot be prevented by feedground management techniques. Other causes of mortality (goring, some diseases, and malnutrition) may be related to feedground management.
54
Feedground managers should utilize available techniques to minimize those causes of mortality that may be attributed to feedground management. Percent winter mortality for 2010-2011 was 1.4 percent, 1.1 percent more than the previous year. In addition to helping support elk population numbers and hunting opportunities in northwest Wyoming, elk attendance on feedgrounds provides an opportunity to vaccinate elk for brucellosis and reduce conflict with private landowners. During winter 2010-2011, 51 percent (n=2,032) of elk calves on feedgrounds were ballistically vaccinated with Strain 19. This was the fourth year that Fall Creek and Scab Creek were excluded and the fifth year Muddy Creek feedgrounds were excluded from vaccination operations due to the test and removal program (for further details, see Wildlife Health and Laboratory Services program). What has been accomplished: • The overall average feeding season was 130 days. • 92 percent of elk attended feedgrounds. • Mortality was 1.4 percent. • Wolves caused elk mortality at ten of the 22 feedgrounds. There were 86 elk
documented by elk feeders that had been killed by wolves. This number increased from 18 the previous year.
What we propose to improve performance in the next two years: • Continue to work with terrestrial wildlife biologists and game wardens during their
winter survey effort to obtain accurate feedground counts to compare to elk counted on native ranges.
• Direct elk feeders during fall orientation briefing to record all deaths and to attempt to determine the cause of death. Continuing to document and identify the major causes of winter elk mortality on feedgrounds is helpful in addressing public concerns and helps feedground personnel improve management efforts, thus resulting in more productive feeding efforts.
• Keep the public informed of situations that may lead to unfavorable public opinion. Feedground personnel, game wardens, and terrestrial wildlife biologists need to be aware of situations that have the potential to cause public concern and take the lead in developing a media approach.
• Be prepared to quickly notify and work with the Department’s Veterinary Services program if disease issues are causing unexpected numbers of elk to die.
• Forest Park and Upper Green River feedgrounds do not serve to prevent damage and commingling with livestock. Their sole purpose is to prevent excessive winter elk losses. Feeding strategies can be adjusted at these locations to feed less hay to save on feeding costs and reduce potential intra-specific disease transmission.
• The “Target Feedground Management” plan was implemented on feedgrounds with decreased damage/commingling risk for the second year. These feedgrounds included Upper Green River, Soda Lake, Fall Creek, Bench Corral, Gros Ventre, and Forest Park. This plan shows potential to decrease hay consumption, in the spring, in areas with decreased snow depths. Low-Density feeding strategy of the “Target feedground Management” plan was implemented on the Dog Creek feedground.
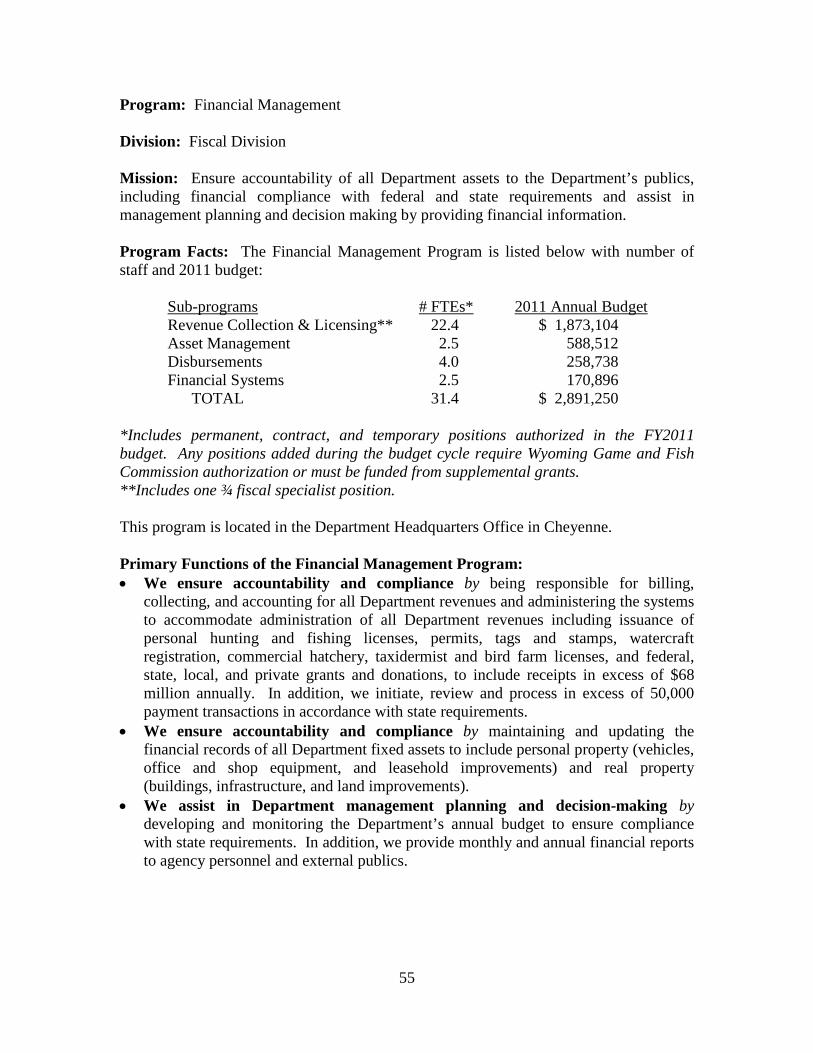
55
Program: Financial Management Division: Fiscal Division Mission: Ensure accountability of all Department assets to the Department’s publics, including financial compliance with federal and state requirements and assist in management planning and decision making by providing financial information. Program Facts: The Financial Management Program is listed below with number of staff and 2011 budget: Sub-programs # FTEs* 2011 Annual Budget Revenue Collection & Licensing** 22.4 $ 1,873,104 Asset Management 2.5 588,512 Disbursements 4.0 258,738 Financial Systems 2.5 170,896 TOTAL 31.4 $ 2,891,250 *Includes permanent, contract, and temporary positions authorized in the FY2011 budget. Any positions added during the budget cycle require Wyoming Game and Fish Commission authorization or must be funded from supplemental grants. **Includes one ¾ fiscal specialist position. This program is located in the Department Headquarters Office in Cheyenne. Primary Functions of the Financial Management Program: • We ensure accountability and compliance by being responsible for billing,
collecting, and accounting for all Department revenues and administering the systems to accommodate administration of all Department revenues including issuance of personal hunting and fishing licenses, permits, tags and stamps, watercraft registration, commercial hatchery, taxidermist and bird farm licenses, and federal, state, local, and private grants and donations, to include receipts in excess of $68 million annually. In addition, we initiate, review and process in excess of 50,000 payment transactions in accordance with state requirements.
• We ensure accountability and compliance by maintaining and updating the financial records of all Department fixed assets to include personal property (vehicles, office and shop equipment, and leasehold improvements) and real property (buildings, infrastructure, and land improvements).
• We assist in Department management planning and decision-making by developing and monitoring the Department’s annual budget to ensure compliance with state requirements. In addition, we provide monthly and annual financial reports to agency personnel and external publics.
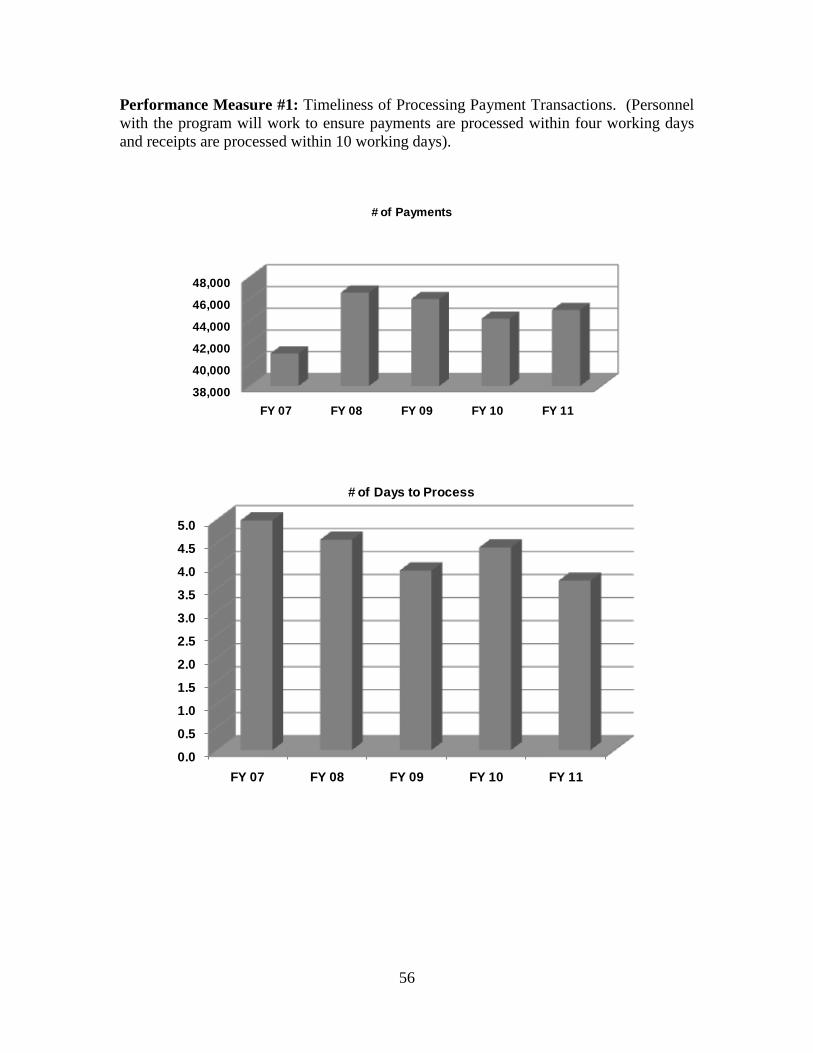
56
Performance Measure #1: Timeliness of Processing Payment Transactions. (Personnel with the program will work to ensure payments are processed within four working days and receipts are processed within 10 working days).
38,000
40,000
42,000
44,000
46,000
48,000
FY 07 FY 08 FY 09 FY 10 FY 11
# of Payments
0.0
0.5
1.0
1.5
2.0
2.5
3.0
3.5
4.0
4.5
5.0
FY 07 FY 08 FY 09 FY 10 FY 11
# of Days to Process
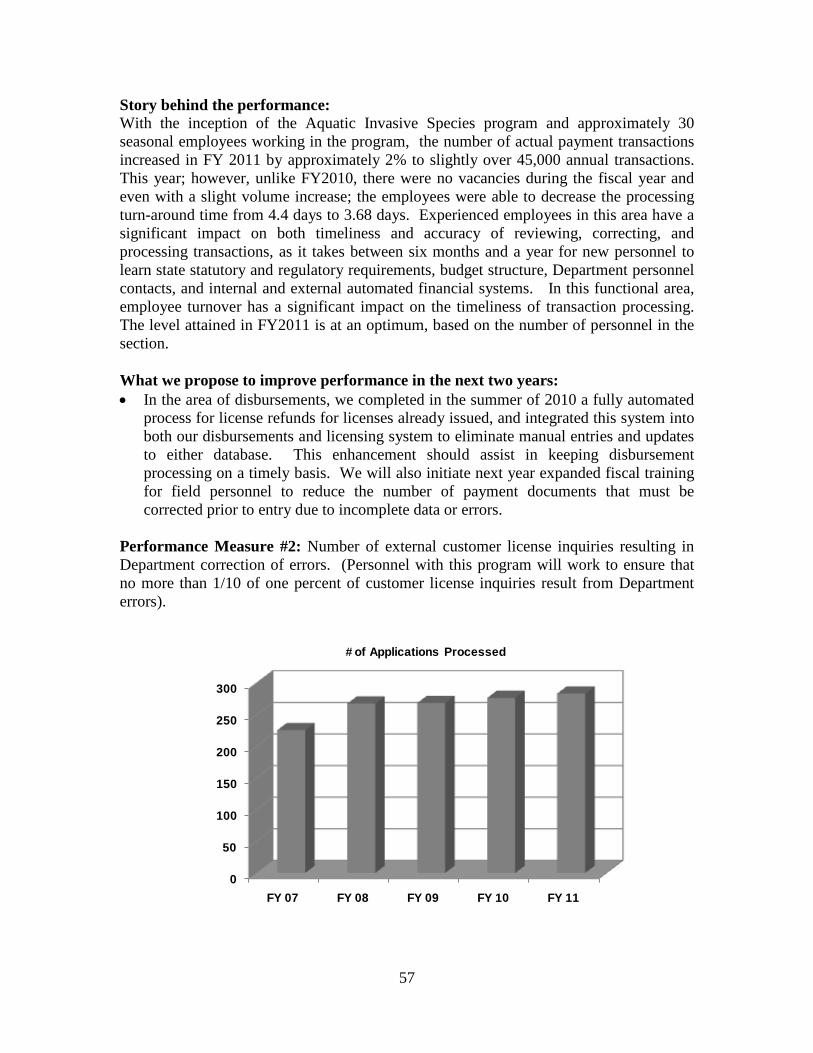
57
Story behind the performance: With the inception of the Aquatic Invasive Species program and approximately 30 seasonal employees working in the program, the number of actual payment transactions increased in FY 2011 by approximately 2% to slightly over 45,000 annual transactions. This year; however, unlike FY2010, there were no vacancies during the fiscal year and even with a slight volume increase; the employees were able to decrease the processing turn-around time from 4.4 days to 3.68 days. Experienced employees in this area have a significant impact on both timeliness and accuracy of reviewing, correcting, and processing transactions, as it takes between six months and a year for new personnel to learn state statutory and regulatory requirements, budget structure, Department personnel contacts, and internal and external automated financial systems. In this functional area, employee turnover has a significant impact on the timeliness of transaction processing. The level attained in FY2011 is at an optimum, based on the number of personnel in the section. What we propose to improve performance in the next two years: • In the area of disbursements, we completed in the summer of 2010 a fully automated
process for license refunds for licenses already issued, and integrated this system into both our disbursements and licensing system to eliminate manual entries and updates to either database. This enhancement should assist in keeping disbursement processing on a timely basis. We will also initiate next year expanded fiscal training for field personnel to reduce the number of payment documents that must be corrected prior to entry due to incomplete data or errors.
Performance Measure #2: Number of external customer license inquiries resulting in Department correction of errors. (Personnel with this program will work to ensure that no more than 1/10 of one percent of customer license inquiries result from Department errors).
0
50
100
150
200
250
300
FY 07 FY 08 FY 09 FY 10 FY 11
# of Applications Processed
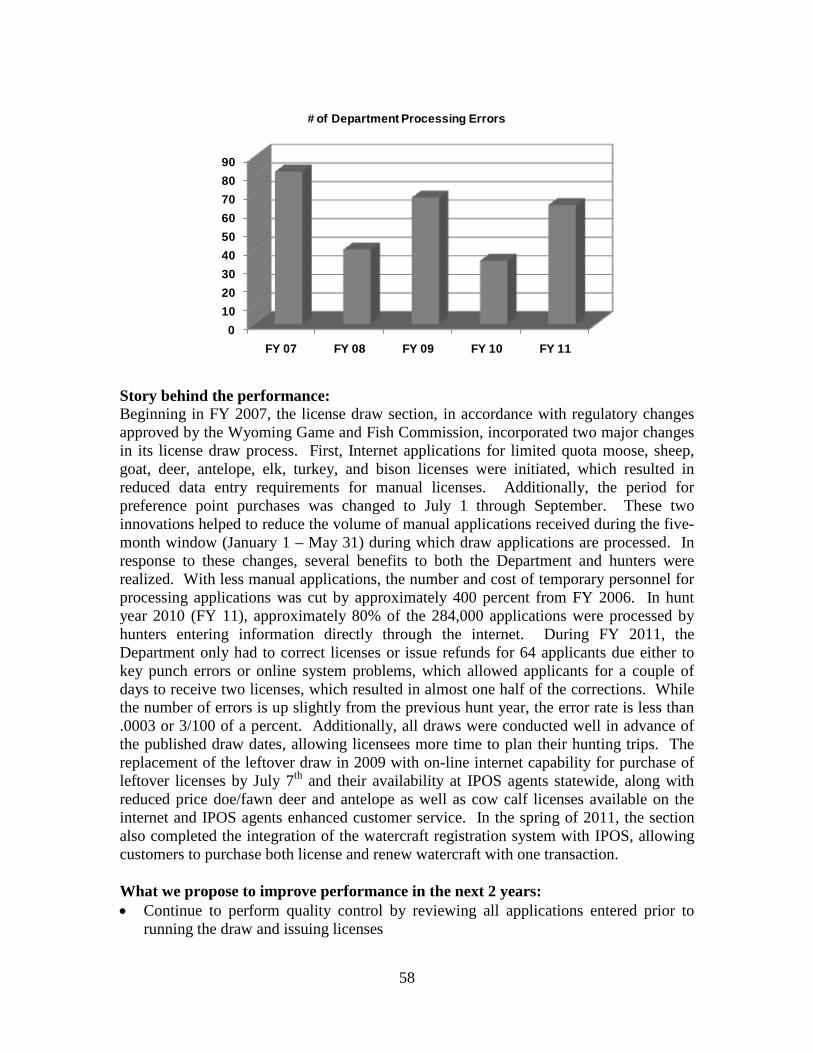
58
0102030405060708090
FY 07 FY 08 FY 09 FY 10 FY 11
# of Department Processing Errors
Story behind the performance: Beginning in FY 2007, the license draw section, in accordance with regulatory changes approved by the Wyoming Game and Fish Commission, incorporated two major changes in its license draw process. First, Internet applications for limited quota moose, sheep, goat, deer, antelope, elk, turkey, and bison licenses were initiated, which resulted in reduced data entry requirements for manual licenses. Additionally, the period for preference point purchases was changed to July 1 through September. These two innovations helped to reduce the volume of manual applications received during the five-month window (January 1 – May 31) during which draw applications are processed. In response to these changes, several benefits to both the Department and hunters were realized. With less manual applications, the number and cost of temporary personnel for processing applications was cut by approximately 400 percent from FY 2006. In hunt year 2010 (FY 11), approximately 80% of the 284,000 applications were processed by hunters entering information directly through the internet. During FY 2011, the Department only had to correct licenses or issue refunds for 64 applicants due either to key punch errors or online system problems, which allowed applicants for a couple of days to receive two licenses, which resulted in almost one half of the corrections. While the number of errors is up slightly from the previous hunt year, the error rate is less than .0003 or 3/100 of a percent. Additionally, all draws were conducted well in advance of the published draw dates, allowing licensees more time to plan their hunting trips. The replacement of the leftover draw in 2009 with on-line internet capability for purchase of leftover licenses by July 7th and their availability at IPOS agents statewide, along with reduced price doe/fawn deer and antelope as well as cow calf licenses available on the internet and IPOS agents enhanced customer service. In the spring of 2011, the section also completed the integration of the watercraft registration system with IPOS, allowing customers to purchase both license and renew watercraft with one transaction. What we propose to improve performance in the next 2 years: • Continue to perform quality control by reviewing all applications entered prior to
running the draw and issuing licenses
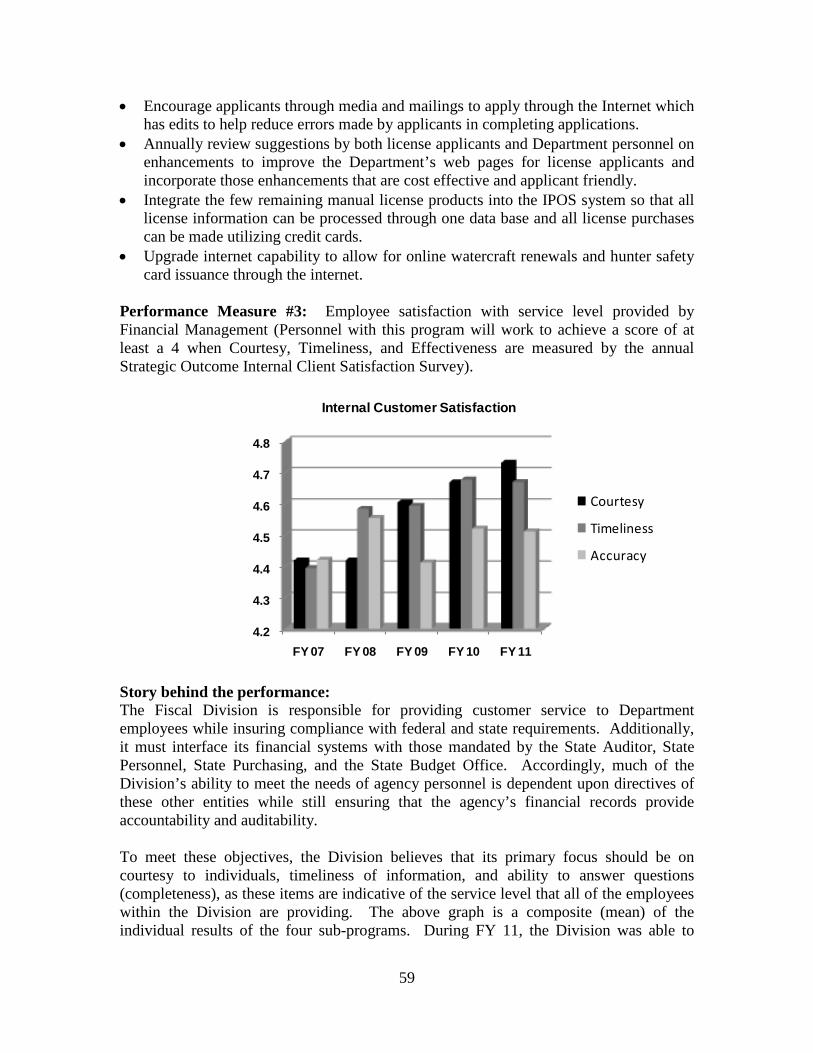
59
• Encourage applicants through media and mailings to apply through the Internet which has edits to help reduce errors made by applicants in completing applications.
• Annually review suggestions by both license applicants and Department personnel on enhancements to improve the Department’s web pages for license applicants and incorporate those enhancements that are cost effective and applicant friendly.
• Integrate the few remaining manual license products into the IPOS system so that all license information can be processed through one data base and all license purchases can be made utilizing credit cards.
• Upgrade internet capability to allow for online watercraft renewals and hunter safety card issuance through the internet.
Performance Measure #3: Employee satisfaction with service level provided by Financial Management (Personnel with this program will work to achieve a score of at least a 4 when Courtesy, Timeliness, and Effectiveness are measured by the annual Strategic Outcome Internal Client Satisfaction Survey).
4.2
4.3
4.4
4.5
4.6
4.7
4.8
FY 07 FY 08 FY 09 FY 10 FY 11
Courtesy
Timeliness
Accuracy
Internal Customer Satisfaction
Story behind the performance: The Fiscal Division is responsible for providing customer service to Department employees while insuring compliance with federal and state requirements. Additionally, it must interface its financial systems with those mandated by the State Auditor, State Personnel, State Purchasing, and the State Budget Office. Accordingly, much of the Division’s ability to meet the needs of agency personnel is dependent upon directives of these other entities while still ensuring that the agency’s financial records provide accountability and auditability. To meet these objectives, the Division believes that its primary focus should be on courtesy to individuals, timeliness of information, and ability to answer questions (completeness), as these items are indicative of the service level that all of the employees within the Division are providing. The above graph is a composite (mean) of the individual results of the four sub-programs. During FY 11, the Division was able to
60
continue high levels of customer satisfaction in all three areas, at a level of 4.5 to 4.7 on a scale of 5. Over the past five years, the Division has continued to show satisfaction levels between very good and good. Accordingly, we believe that an indicator of “4 “or above (good) on a 1 to 5 satisfaction scale demonstrates that an acceptable level of service is being provided, while still being cost efficient. What we propose to improve performance in the next two years: • We propose to continue to maintain service levels where employees can be provided
assistance in a timely, complete, and courteous manner. This has been a challenge in recent years due to major changes in the license area, which while resulting in significant customer enhancements, did have some growing pains, in addition to continued changes with State Accounting system managed by the State Auditor’s office that delayed some transaction processing and report availability. However, increasing availability to online information for regional administrative personnel has assisted those individuals in answering questions by field personnel and we will continue to work on making more online information available to all personnel and to expand training to field personnel, especially through video conferencing, a cost effective alternative to extensive travel.
• The Division will be working on additional enhancements to its licensing system to include integration of hunter safety information over the next 18 months.
• The Division will implement internet renewals of water craft registrations during the fall of 2011.
61
Program: Habitat Division: Fish and Wildlife Mission: Holistically manage, preserve, restore, and/or improve habitat to enhance and sustain Wyoming’s fish and wildlife populations for current and future generations. Program Facts: The Department Habitat program is made up of three major sub-programs, listed below with number of staff and 2011 (FY 11) budget: Sub-programs # FTEs* 2011 Annual Budget Terrestrial Habitat Management 15.2 $ 2,086,886 Aquatic Habitat Management 10.8 1,438,534 Water Management 2.5 255,422 TOTAL 28.5 $ 3,780,842 * Includes permanent, contract, and temporary positions authorized in the FY 11 budget. Any positions added during the budget cycle require Wyoming Game and Fish Commission authorization or must be funded from supplemental grants. The Habitat program formerly included the Habitat and Access Management sub-program (Strategic Plan FY 04-FY 07, November 2003). While this sub-program has since been removed, the Habitat program has incorporated the Water Management sub-program (formerly a sub-program in Aquatic Wildlife Management program). The Habitat program has statewide responsibilities. Permanent personnel are located in Buffalo (1), Casper (3), Cheyenne (4), Cody (3), Green River (2), Jackson (2), Lander (2), Laramie (3), Pinedale (2), and Sheridan (2). Primary Functions of the Habitat Program: • Manage, preserve, and restore habitat for long-term sustainable management of
fish and wildlife populations by inventorying wildlife habitat conditions, determining where conditions are limiting, and planning and implementing projects at watershed and landscape scales in order to conserve and restore habitat quality. This is accomplished by integrating various land uses while involving the general public, private landowners, and land management agencies.
• Increase fish and wildlife-based recreation through habitat enhancements that increase productivity of fish and wildlife populations by designing and implementing habitat improvement projects in cooperation with private landowners and/or public land managers.
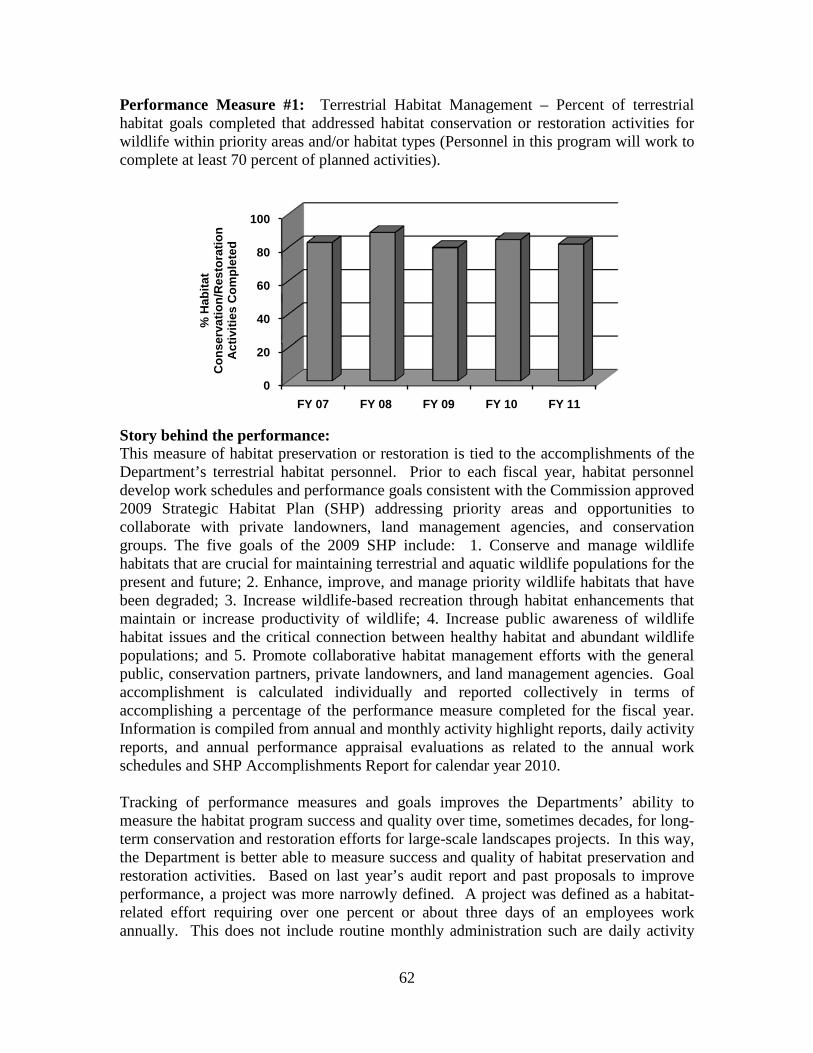
62
Performance Measure #1: Terrestrial Habitat Management – Percent of terrestrial habitat goals completed that addressed habitat conservation or restoration activities for wildlife within priority areas and/or habitat types (Personnel in this program will work to complete at least 70 percent of planned activities).
Story behind the performance: This measure of habitat preservation or restoration is tied to the accomplishments of the Department’s terrestrial habitat personnel. Prior to each fiscal year, habitat personnel develop work schedules and performance goals consistent with the Commission approved 2009 Strategic Habitat Plan (SHP) addressing priority areas and opportunities to collaborate with private landowners, land management agencies, and conservation groups. The five goals of the 2009 SHP include: 1. Conserve and manage wildlife habitats that are crucial for maintaining terrestrial and aquatic wildlife populations for the present and future; 2. Enhance, improve, and manage priority wildlife habitats that have been degraded; 3. Increase wildlife-based recreation through habitat enhancements that maintain or increase productivity of wildlife; 4. Increase public awareness of wildlife habitat issues and the critical connection between healthy habitat and abundant wildlife populations; and 5. Promote collaborative habitat management efforts with the general public, conservation partners, private landowners, and land management agencies. Goal accomplishment is calculated individually and reported collectively in terms of accomplishing a percentage of the performance measure completed for the fiscal year. Information is compiled from annual and monthly activity highlight reports, daily activity reports, and annual performance appraisal evaluations as related to the annual work schedules and SHP Accomplishments Report for calendar year 2010. Tracking of performance measures and goals improves the Departments’ ability to measure the habitat program success and quality over time, sometimes decades, for long-term conservation and restoration efforts for large-scale landscapes projects. In this way, the Department is better able to measure success and quality of habitat preservation and restoration activities. Based on last year’s audit report and past proposals to improve performance, a project was more narrowly defined. A project was defined as a habitat-related effort requiring over one percent or about three days of an employees work annually. This does not include routine monthly administration such are daily activity
0
20
40
60
80
100
FY 07 FY 08 FY 09 FY 10 FY 11
% H
abita
t C
onse
rvat
ion/
Res
tora
tion
Act
iviti
es C
ompl
eted
63
reports. A project was also defined as beginning with the general identification of a need or opportunity, assessment and evaluation, collaboration with landowners and managers, development of specific objectives, securing funding, implementation. and monitoring. These attempts follow guidance provided in the revised 2009 SHP which defined which projects were habitat conservation or restoration versus projects that were mainly habitat enhancement or were related to others goals. What has been accomplished: In FY 11, 82 percent (14 completed of 17 planned) of the terrestrial habitat goals exclusively addressing habitat conservation or restoration activities were completed with the incomplete goals still in progress. The slight decrease from FY 10 (85 percent completion) and the long-term average is due to exclusively defining those goals that address habitat conservation or restoration and the resignation of two employees and the retirement of another. Reasons for projects not being completed were beyond habitat personnel control and include weather, outside partner funding delays, delays in obtaining required documents to conduct activities on federal lands (such as the National Environment Policy Act (NEPA) documents), loss of personnel, and work on addressing 39 unplanned projects. Overall, the Terrestrial Habitat Section planned 244 habitat projects encompassing all of the 2009 SHP goals, and implemented 211 projects (86.5%) during FY 11. These include, but are not necessarily exclusive to the annual report performance measure numbers one and two. An additional 39 unplanned projects were implemented or completed during the fiscal year. This was accomplished even with the resignation of the Lander Region terrestrial habitat biologist in February 2011, the Casper Region habitat extension biologist in March 2011, and the retirement of the Jackson Region terrestrial habitat biologist in June 2011. These positions were not filled until June 2011. A partial list of terrestrial habitat projects addressing one or more or a combination of the five goals of the 2009 SHP completed in FY 11 include: four landscape scale projects using satellite imagery and ground-truthing to document land cover encompassing about 3.5 million acres; finer scale project level intensive rangeland and habitat inventories and assessments on almost 304,000 acres; grazing management plans on 25 areas totaling over 690,000 acres; wildlife stewardship plans on three areas totaling about 22,200 acres; nearly 17,000 acres of prescribed fire; mechanical vegetation treatments on about 7,900 acres; herbicide treatments on nearly 17,000 acres; seeding projects on about 2,900 acres; planting nearly 8,000 shrubs and trees; assisting over 200 private landowners, resulting in 127 on-the-ground habitat projects; involvement in 33 major information and education efforts; collecting information from 114 vegetation monitoring transects to document past projects; collecting information from 126 annual vegetation production/utilization transects; and administering and oversight of 128 different funding sources to implement projects. Projects were accomplished by Section personnel working with partners and soliciting grants from outside sources including the Wyoming Wildlife and Natural Resource Trust (WWNRT), Wyoming Governor’s Big Game License Coalition, Rocky Mountain Elk Foundation, North American Foundation for Wild Sheep, Natural Resources Conservation Service (NRCS) Wyoming Farm Bill Programs, Water for Wildlife Foundation, Pheasants Forever, U.S. Fish and Wildlife Service Private Lands
64
Program and Landowner Incentive Program, the Wyoming Governor’s Sage-Grouse Fund, private landowners, Bureau of Land Management (BLM), U.S. Forest Service (USFS), Wyoming Landscape Conservation Initiative, Jonah Interagency Office Mitigation, and private and corporate donors among others. Many of the terrestrial habitat projects include working with a variety of internal and external working groups and partnerships, providing wildlife habitat related wildlife environmental review information, assisting with BLM Resource Management Plan and U.S. Forest Service plan revisions, and assisting on various wildlife habitat research projects. Finally, during FY 11 Terrestrial Habitat Section personnel prepared 22 Department and 37 external funding requests for FY 12 project implementation. Examples of unplanned terrestrial projects implemented during FY 11 include: developing a statewide sagebrush treatment geodatabase for proposal requests in sage-grouse core areas; hosting the International Moose Conference in Jackson, Wyoming; participating on the Department wetland steering committee; evaluating potential conservation easements; coordinating and involvement with the NRCS Sage-Grouse Initiative; assisting with development of the sage-grouse core area Density Distribution Calculation Tool GIS process; and filling three vacant positions. Habitat biologists annual work plans are often amended during the fiscal year due to increasing requests to assist in the mitigation of habitats disturbed by energy development, BLM Resource Management Plan and Forest Service Plan activities and revisions, NRCS 2010 Farm Bill changes and requirements, and requests from the Department’s administration. What we propose to improve performance in the next two years: • Combine performance measure numbers one and two as almost all projects address
both measures, and it is often difficult to separate projects into these two measures. Within the 2009 SHP goals one, two, and three directly address these two performance measures and are supplemented by and required by 2009 SHP goals four and five. All five goals from the 2009 SHP should be combined as one performance measure for future years.
• Implement the Commission approved Department’s 2009 SHP in priority habitat areas and priority habitats to maintain, increase, or improve wildlife populations. Funding is provided in existing budgets and through partnerships with other agencies, private landowners, and conservation groups.
• In synchrony with the Department’s budget process, continue to develop funding proposals for submission to the WWNRT, Wyoming Landscape Conservation Initiative Team, U.S. Department of Agriculture Farm Bill Programs, conservation groups, and other funding source partners. These additional funds allow for the expansion and continuation of conservation, restoration, and improvement efforts. Utilize the Director’s Office additional funding to accomplish NEPA, inventories, and assessments to prepare large shelf-ready projects.
• Evaluate section personnel structure and workload, develop a mid-level field supervisor proposal for Department consideration, and continue to investigate and propose additional field personnel resources such as additional interns, longer-term
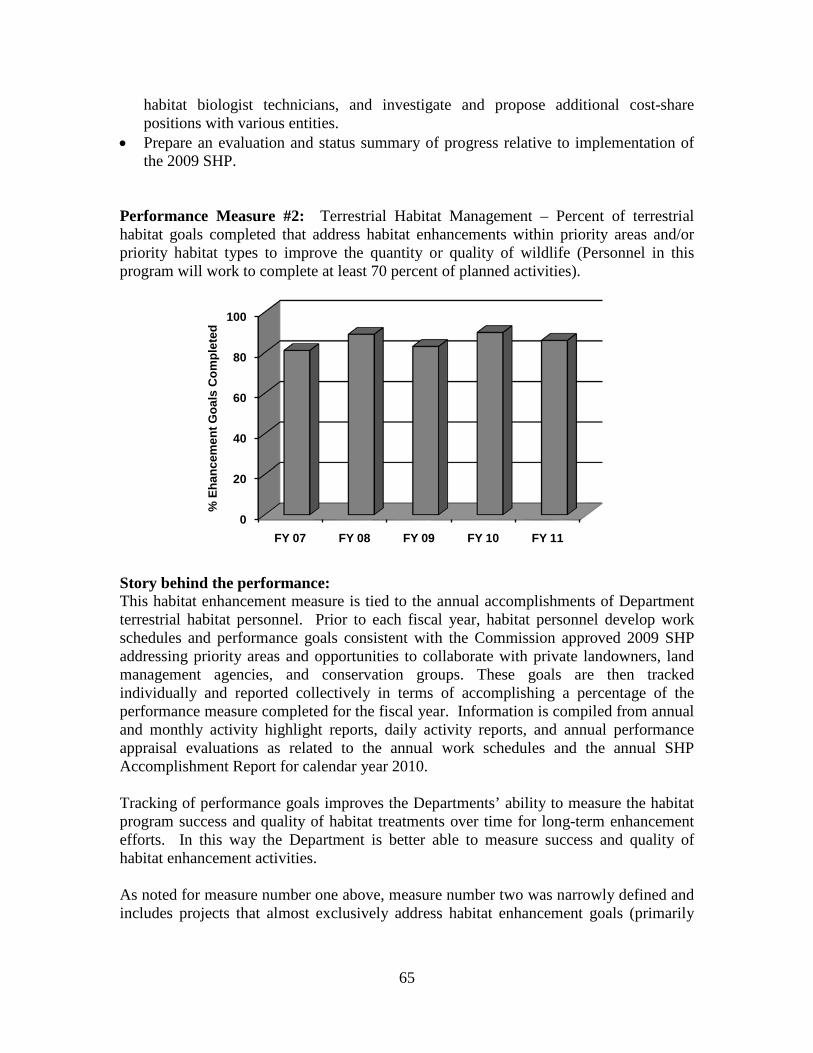
65
habitat biologist technicians, and investigate and propose additional cost-share positions with various entities.
• Prepare an evaluation and status summary of progress relative to implementation of the 2009 SHP.
Performance Measure #2: Terrestrial Habitat Management – Percent of terrestrial habitat goals completed that address habitat enhancements within priority areas and/or priority habitat types to improve the quantity or quality of wildlife (Personnel in this program will work to complete at least 70 percent of planned activities).
Story behind the performance: This habitat enhancement measure is tied to the annual accomplishments of Department terrestrial habitat personnel. Prior to each fiscal year, habitat personnel develop work schedules and performance goals consistent with the Commission approved 2009 SHP addressing priority areas and opportunities to collaborate with private landowners, land management agencies, and conservation groups. These goals are then tracked individually and reported collectively in terms of accomplishing a percentage of the performance measure completed for the fiscal year. Information is compiled from annual and monthly activity highlight reports, daily activity reports, and annual performance appraisal evaluations as related to the annual work schedules and the annual SHP Accomplishment Report for calendar year 2010. Tracking of performance goals improves the Departments’ ability to measure the habitat program success and quality of habitat treatments over time for long-term enhancement efforts. In this way the Department is better able to measure success and quality of habitat enhancement activities. As noted for measure number one above, measure number two was narrowly defined and includes projects that almost exclusively address habitat enhancement goals (primarily
0
20
40
60
80
100
FY 07 FY 08 FY 09 FY 10 FY 11
% E
hanc
emen
t Goa
ls C
ompl
eted
66
2009 SHP goals two and three) versus those that were mainly habitat conservation, other goals, or a combination of the five habitat goals of the 2009 SHP. What has been accomplished: In FY 11, 86 percent (57 completed of 66 planned) of the terrestrial habitat goals that exclusively addressed habitat enhancement activities were completed with incomplete goals still in progress. The slight decrease from FY 10 (90 percent completion) and the long-term average is due to defining those goals addressing habitat enhancements exclusively and the resignation of two employees and the retirement of another. Reasons for projects not being completed or implemented were beyond habitat personnel control and include weather, outside partner funding delays, delays in obtaining required documents to conduct activities on federal lands (such as, the National Environment Policy Act (NEPA) document), loss of personnel, and work on addressing 39 unplanned projects during the fiscal year. The decline in the total number of projects from previous years is a result of consolidation of projects on a larger scale and only reporting on projects that exclusively address habitat enhancement goals versus those that were mainly habitat conservation goals or were related to other habitat goals outlined in the 2009 SHP. A partial list of major accomplishments is reported in measure number one above and includes measure number 2 projects. Habitat biologists annual work plans are often amended during the fiscal year due to the increasing requests to assist in the mitigation of habitats disturbed by energy development, BLM Resource Management Plan and Forest Service Plan activities and revisions, NRCS 2010 Farm Bill changes and requirements, and requests from the Department’s administration. What we propose to improve performance in the next two years: • Combine performance measure numbers one and two as almost all projects address
both measures, and it is often difficult to separate projects into these two measures. Within the 2009 SHP goals one, two, and three primarily address these two performance measures directly and are supplemented by and require by 2009 SHP goals four and five. All five goals from the 2009 SHP should be combined as one performance measure for future years.
• Implement the Commission approved revised (2009) Department’s SHP in priority habitat areas and priority habitats delineated in the SHP to maintain, improve, or increase wildlife populations. Funding is provided in existing budgets and through partnerships with other agencies, private landowners, and conservation groups.
• In synchrony with the Department budget process, continue to develop additional proposals to submit for funding to the WWNRT, Wyoming Landscape Conservation Initiative Team, U.S. Department of Agriculture Farm Bill Program, conservation groups, and other funding source partners. These additional funds will allow for funding of more conservation, restoration, and improvement projects. Utilize the Director’s Office additional funding to accomplish NEPA, inventories, and assessments to prepare large shelf-ready projects.
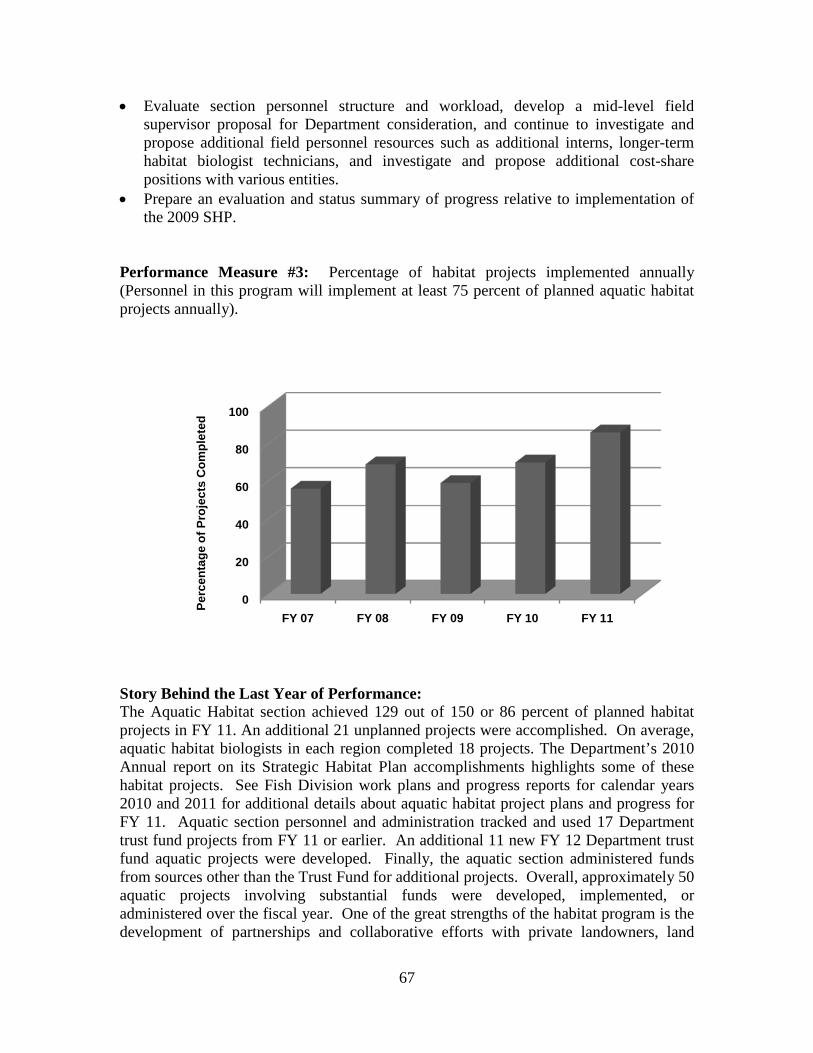
67
• Evaluate section personnel structure and workload, develop a mid-level field supervisor proposal for Department consideration, and continue to investigate and propose additional field personnel resources such as additional interns, longer-term habitat biologist technicians, and investigate and propose additional cost-share positions with various entities.
• Prepare an evaluation and status summary of progress relative to implementation of the 2009 SHP.
Performance Measure #3: Percentage of habitat projects implemented annually (Personnel in this program will implement at least 75 percent of planned aquatic habitat projects annually).
Story Behind the Last Year of Performance: The Aquatic Habitat section achieved 129 out of 150 or 86 percent of planned habitat projects in FY 11. An additional 21 unplanned projects were accomplished. On average, aquatic habitat biologists in each region completed 18 projects. The Department’s 2010 Annual report on its Strategic Habitat Plan accomplishments highlights some of these habitat projects. See Fish Division work plans and progress reports for calendar years 2010 and 2011 for additional details about aquatic habitat project plans and progress for FY 11. Aquatic section personnel and administration tracked and used 17 Department trust fund projects from FY 11 or earlier. An additional 11 new FY 12 Department trust fund aquatic projects were developed. Finally, the aquatic section administered funds from sources other than the Trust Fund for additional projects. Overall, approximately 50 aquatic projects involving substantial funds were developed, implemented, or administered over the fiscal year. One of the great strengths of the habitat program is the development of partnerships and collaborative efforts with private landowners, land
0
20
40
60
80
100
FY 07 FY 08 FY 09 FY 10 FY 11
Perc
enta
ge o
f Pro
ject
s C
ompl
eted
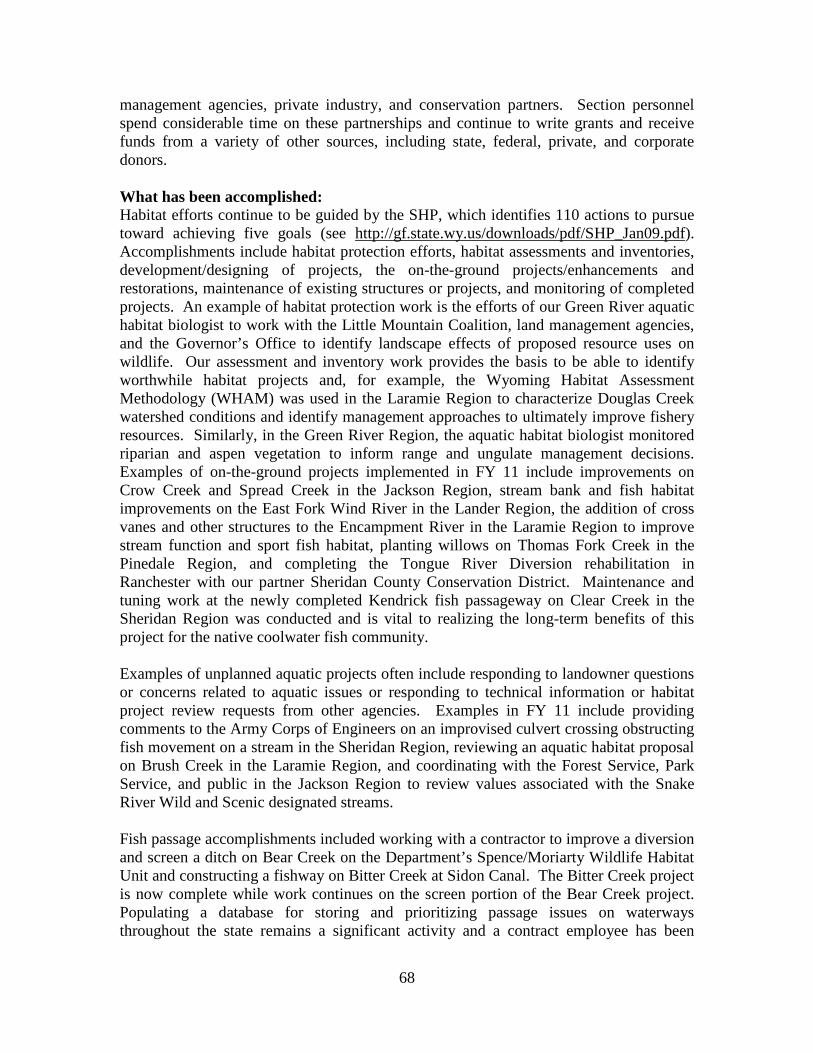
68
management agencies, private industry, and conservation partners. Section personnel spend considerable time on these partnerships and continue to write grants and receive funds from a variety of other sources, including state, federal, private, and corporate donors. What has been accomplished: Habitat efforts continue to be guided by the SHP, which identifies 110 actions to pursue toward achieving five goals (see http://gf.state.wy.us/downloads/pdf/SHP_Jan09.pdf). Accomplishments include habitat protection efforts, habitat assessments and inventories, development/designing of projects, the on-the-ground projects/enhancements and restorations, maintenance of existing structures or projects, and monitoring of completed projects. An example of habitat protection work is the efforts of our Green River aquatic habitat biologist to work with the Little Mountain Coalition, land management agencies, and the Governor’s Office to identify landscape effects of proposed resource uses on wildlife. Our assessment and inventory work provides the basis to be able to identify worthwhile habitat projects and, for example, the Wyoming Habitat Assessment Methodology (WHAM) was used in the Laramie Region to characterize Douglas Creek watershed conditions and identify management approaches to ultimately improve fishery resources. Similarly, in the Green River Region, the aquatic habitat biologist monitored riparian and aspen vegetation to inform range and ungulate management decisions. Examples of on-the-ground projects implemented in FY 11 include improvements on Crow Creek and Spread Creek in the Jackson Region, stream bank and fish habitat improvements on the East Fork Wind River in the Lander Region, the addition of cross vanes and other structures to the Encampment River in the Laramie Region to improve stream function and sport fish habitat, planting willows on Thomas Fork Creek in the Pinedale Region, and completing the Tongue River Diversion rehabilitation in Ranchester with our partner Sheridan County Conservation District. Maintenance and tuning work at the newly completed Kendrick fish passageway on Clear Creek in the Sheridan Region was conducted and is vital to realizing the long-term benefits of this project for the native coolwater fish community. Examples of unplanned aquatic projects often include responding to landowner questions or concerns related to aquatic issues or responding to technical information or habitat project review requests from other agencies. Examples in FY 11 include providing comments to the Army Corps of Engineers on an improvised culvert crossing obstructing fish movement on a stream in the Sheridan Region, reviewing an aquatic habitat proposal on Brush Creek in the Laramie Region, and coordinating with the Forest Service, Park Service, and public in the Jackson Region to review values associated with the Snake River Wild and Scenic designated streams. Fish passage accomplishments included working with a contractor to improve a diversion and screen a ditch on Bear Creek on the Department’s Spence/Moriarty Wildlife Habitat Unit and constructing a fishway on Bitter Creek at Sidon Canal. The Bitter Creek project is now complete while work continues on the screen portion of the Bear Creek project. Populating a database for storing and prioritizing passage issues on waterways throughout the state remains a significant activity and a contract employee has been
69
pursuing this in priority drainages statewide. Further fish passage work included the administration of block grants to the Lake DeSmet Conservation District and the Sheridan County Conservation District to rehabilitate and provide fish passage at multiple diversion structures, a land survey and starting design for a fishway on the Encampment River at the WYCO diversion, the development of a design and funding for improving passage at the Harmony Diversion on the Nowood River, and cooperating with the Greybull Valley irrigation District and Trout Unlimited to develop a fishway in conjunction with diversion rehabilitation. Finally, the Department worked extensively with Trout Unlimited in reviewing and funding several projects to improve fish passage including the Smiths Fork Whites Water and Twin Creek BQ Diversion Projects. What we propose to improve performance in the next two years: The first step to improving performance is maintaining the solid base of habitat achievements currently produced by the aquatic and terrestrial habitat sections. With renewed focus on priority wildlife habitats under the revised SHP, section personnel will continue to work with land management agencies, private landowners, and funding partners to conserve and manage wildlife habitats deemed crucial for maintaining populations of terrestrial and aquatic wildlife for the present and future. The largest gains in aquatic habitat performance could be gained through staffing. The Aquatic Habitat section is essentially down two positions. The Casper position was lost during the Wyoming state government position freeze of 2009 and 2010. The Cody position has been reclassified to Fish Passage Coordinator. There are unmet aquatic habitat protection, enhancement, and restoration needs in both regions that can only be met by assigning permanent personnel to the issues. The Department and Commission again approved $200,000 in FY 11 toward developing and implementing habitat projects. Identified issues to be addressed included NEPA planning, archaeological surveys, wetland surveys, and acquiring design and engineering services. The contracts and projects conducted in FY 11 appear to be fruitful and leading toward projects; therefore, so-called “project planning funds” were again dedicated toward developing projects in FY 12. Projects developed and obstacles removed in this manner will increase the Department’s ability to match the tremendous habitat project funding opportunity inherent in the Wyoming Wildlife and Natural Resource Trust. Efforts to enhance internal coordination and communication and efficiently deliver the Department’s habitat management and enhancement program are major on-going focuses. The Habitat and Technical Advisory Group (HTAG), an internal Department team, is well positioned to actively implement the SHP. One action the HTAG can accomplish is to review 110 habitat actions identified in the SHP and identify any that have languished or could merit additional attention. Last, but not least, there will be continued focus on maintaining and developing additional partnerships and expand collaborative habitat management projects. Personnel will continue to develop large-scale proposals and applications for funding from the Wyoming Wildlife and Natural Resource Trust, Governor’s Sage Grouse Fund,
70
Wyoming Governor’s Big Game License Coalition, U.S. Fish and Wildlife Service State Wildlife Grants, and the Wyoming Conservation Landscape Initiative. In addition, the Department continues to seek expansion of the Habitat Extension Biologist partnerships with NRCS to facilitate implementation of Farm Bill programs that benefit wildlife on private lands. Performance Measure #4: Water Management/Instream Flow – The number of applications for instream flow water rights filed (Personnel in this program will work to file at least three instream flow water rights applications per year).
Story behind the performance: One of the primary responsibilities of Water Management is filing applications for instream flow water rights. The applications are the culmination of many years studying the interrelationship between physical habitat and hydrology of individual stream segments. This measure shows the number of instream flow water rights applications filed with the State Engineers Office. In FY 11, instream flow water rights field studies were completed on nine different stream segments. Analyses and reports were initiated for all streams where data was collected. No filings were submitted to the State Engineer in FY 11; however, five filings were submitted the first week of July 2011. Four more filings will be submitted by October 2011 and five more filings are anticipated in early 2012 (a total of 14 new filings). Filings are typically submitted in blocks as groups of applications are prepared. This protocol allows department engineering staff to stay focused on preparing needed maps all at one time and also allows the Water Development Commission to better coordinate legislatively mandated feasibility studies and selection of contractors who conduct that work.
What we propose to improve performance in the next two years: • Continue to work closely with regional personnel in all divisions and assist with
water right and management decisions to maximize the ability of Wyoming Game and Fish Commission water rights to maintain and protect fish and wildlife resources as well as sustain the standing and value of the water rights themselves. A long-term water management plan will be finalized in late summer 2011 and the guidance provided in this document will help focus future instream flow filing efforts.
0
2
4
6
8
10
FY 07 FY 08 FY 09 FY 10 FY 11
# of
App
licat
ions
File
d

71
• Greater public awareness of instream flow and water management issues is needed. As a consequence, continued information will be provided regarding the benefits of instream flows to the general public and private landowners via articles in department publications and presentations. When the Department has its anticipated new web page in place, the Section’s web page will be improved to help viewers better understand the accomplishments, needs, and challenges faced by the state when managing water for fish and wildlife.
72
Program: Habitat and Access Management Division: Services Mission Statement: Manage and protect Commission property rights for the benefit of the Commission, Department, and people of Wyoming. Wildlife Habitat Management and Public Access Areas are managed in a cost-effective and efficient manner while technical knowledge and habitat development services are provided to the Department. Program Facts: The Habitat and Access Management program manages and administers Wildlife Habitat Management Areas and Public Access Areas for the Wyoming Game and Fish Department. In addition, the branch will complete project requests for other divisions within any single fiscal year. Listed below are the number of staff and 2011 (FY11) budget: Sub-program # FTEs* 2011 Annual Budget
Habitat and Access Management 26.3 $ 3,246,663 * Includes permanent, contract, and temporary positions authorized in the FY11 budget. Any positions added during the budget cycle require Wyoming Game and Fish Commission authorization or must be funded from supplemental grants. The program is located statewide with personnel in Jackson, Pinedale, Cody, Lovell, Sheridan, Laramie, Yoder, Lander, Dubois, Casper, and Cheyenne. Primary Functions of the Habitat and Access Management Program: • On behalf of the Wyoming Game and Fish Commission, manage and protect
Commission property rights for the benefit of the Commission, Department, and people of Wyoming by facilitating wildlife conservation through conserving and improving wildlife habitat on Wildlife Habitat Management Areas. We serve the public by providing for safe and reasonable public recreation of the wildlife resource on Wildlife Habitat Management Areas while maintaining a balance between habitat conservation and public recreation on those lands.
• On behalf of the Commission, manage and protect Commission property rights for the benefit of the Commission, Department, and people of Wyoming through providing for safe and reasonable public access, and recreation of the wildlife resource on Public Access Areas.
• Provide technical knowledge and development services to the Department by working on project requests, which conserve wildlife habitat through the Department’s Strategic Habitat Plan and increase public recreational opportunities within the state.
• Operate in a cost-effective and efficient manner through the balance of private sector contracts and trained Department crews.
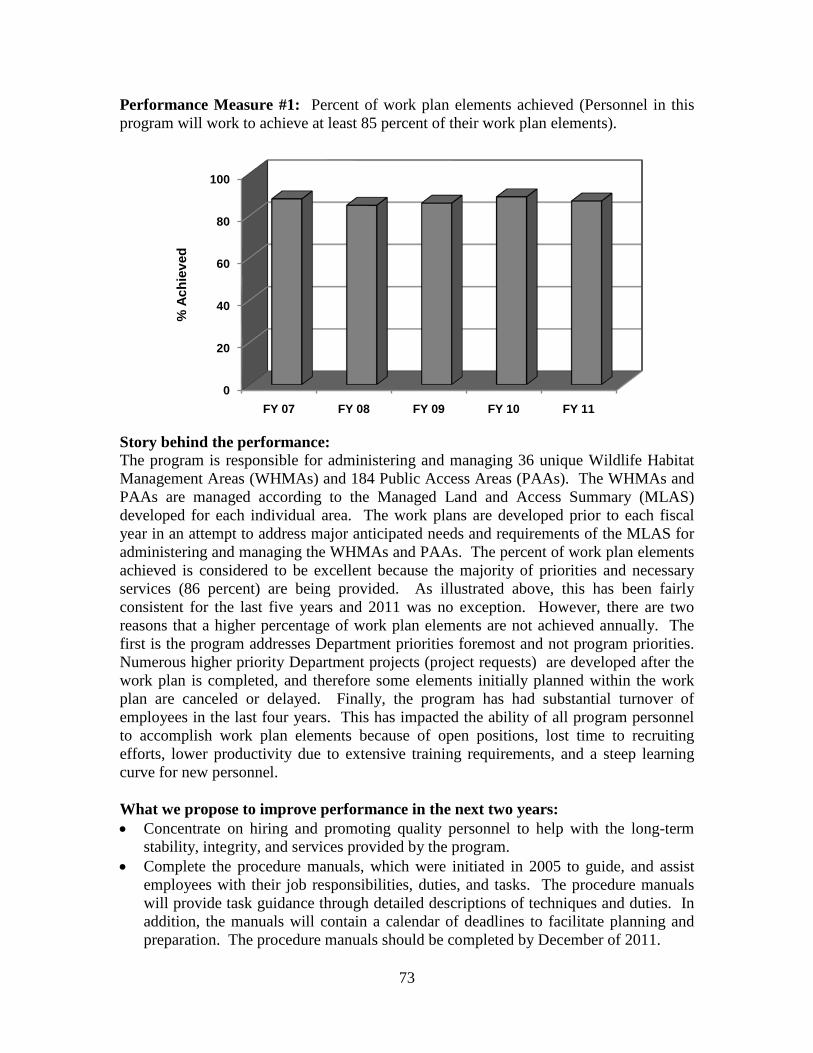
73
Performance Measure #1: Percent of work plan elements achieved (Personnel in this program will work to achieve at least 85 percent of their work plan elements).
Story behind the performance: The program is responsible for administering and managing 36 unique Wildlife Habitat Management Areas (WHMAs) and 184 Public Access Areas (PAAs). The WHMAs and PAAs are managed according to the Managed Land and Access Summary (MLAS) developed for each individual area. The work plans are developed prior to each fiscal year in an attempt to address major anticipated needs and requirements of the MLAS for administering and managing the WHMAs and PAAs. The percent of work plan elements achieved is considered to be excellent because the majority of priorities and necessary services (86 percent) are being provided. As illustrated above, this has been fairly consistent for the last five years and 2011 was no exception. However, there are two reasons that a higher percentage of work plan elements are not achieved annually. The first is the program addresses Department priorities foremost and not program priorities. Numerous higher priority Department projects (project requests) are developed after the work plan is completed, and therefore some elements initially planned within the work plan are canceled or delayed. Finally, the program has had substantial turnover of employees in the last four years. This has impacted the ability of all program personnel to accomplish work plan elements because of open positions, lost time to recruiting efforts, lower productivity due to extensive training requirements, and a steep learning curve for new personnel. What we propose to improve performance in the next two years: • Concentrate on hiring and promoting quality personnel to help with the long-term
stability, integrity, and services provided by the program. • Complete the procedure manuals, which were initiated in 2005 to guide, and assist
employees with their job responsibilities, duties, and tasks. The procedure manuals will provide task guidance through detailed descriptions of techniques and duties. In addition, the manuals will contain a calendar of deadlines to facilitate planning and preparation. The procedure manuals should be completed by December of 2011.
0
20
40
60
80
100
FY 07 FY 08 FY 09 FY 10 FY 11
% A
chie
ved
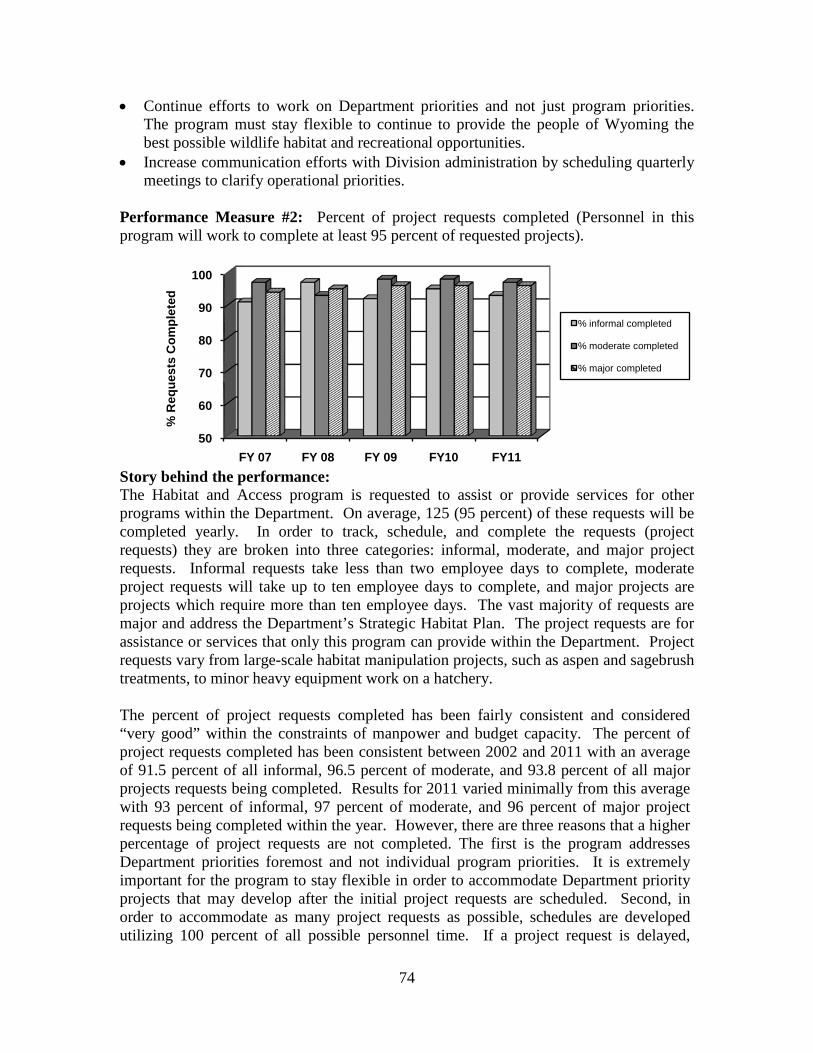
74
• Continue efforts to work on Department priorities and not just program priorities. The program must stay flexible to continue to provide the people of Wyoming the best possible wildlife habitat and recreational opportunities.
• Increase communication efforts with Division administration by scheduling quarterly meetings to clarify operational priorities.
Performance Measure #2: Percent of project requests completed (Personnel in this program will work to complete at least 95 percent of requested projects).
Story behind the performance: The Habitat and Access program is requested to assist or provide services for other programs within the Department. On average, 125 (95 percent) of these requests will be completed yearly. In order to track, schedule, and complete the requests (project requests) they are broken into three categories: informal, moderate, and major project requests. Informal requests take less than two employee days to complete, moderate project requests will take up to ten employee days to complete, and major projects are projects which require more than ten employee days. The vast majority of requests are major and address the Department’s Strategic Habitat Plan. The project requests are for assistance or services that only this program can provide within the Department. Project requests vary from large-scale habitat manipulation projects, such as aspen and sagebrush treatments, to minor heavy equipment work on a hatchery. The percent of project requests completed has been fairly consistent and considered “very good” within the constraints of manpower and budget capacity. The percent of project requests completed has been consistent between 2002 and 2011 with an average of 91.5 percent of all informal, 96.5 percent of moderate, and 93.8 percent of all major projects requests being completed. Results for 2011 varied minimally from this average with 93 percent of informal, 97 percent of moderate, and 96 percent of major project requests being completed within the year. However, there are three reasons that a higher percentage of project requests are not completed. The first is the program addresses Department priorities foremost and not individual program priorities. It is extremely important for the program to stay flexible in order to accommodate Department priority projects that may develop after the initial project requests are scheduled. Second, in order to accommodate as many project requests as possible, schedules are developed utilizing 100 percent of all possible personnel time. If a project request is delayed,
50
60
70
80
90
100
FY 07 FY 08 FY 09 FY10 FY11
% R
eque
sts
Com
plet
ed
% informal completed
% moderate completed
% major completed
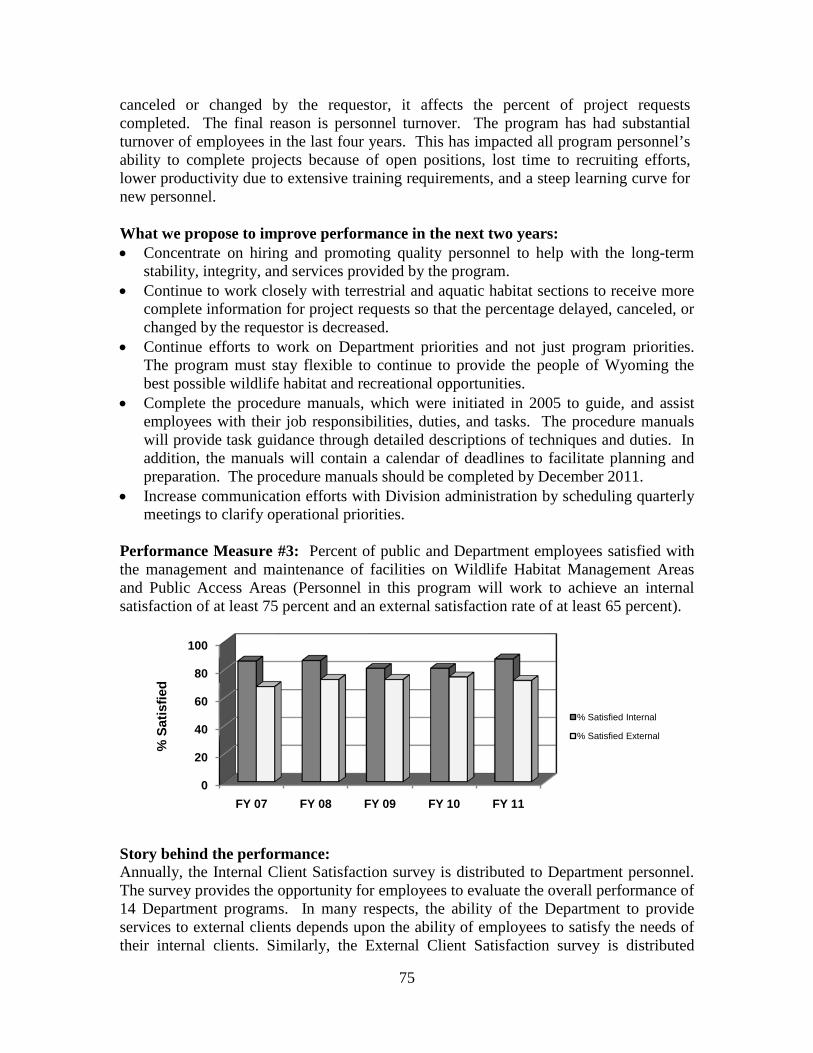
75
canceled or changed by the requestor, it affects the percent of project requests completed. The final reason is personnel turnover. The program has had substantial turnover of employees in the last four years. This has impacted all program personnel’s ability to complete projects because of open positions, lost time to recruiting efforts, lower productivity due to extensive training requirements, and a steep learning curve for new personnel. What we propose to improve performance in the next two years: • Concentrate on hiring and promoting quality personnel to help with the long-term
stability, integrity, and services provided by the program. • Continue to work closely with terrestrial and aquatic habitat sections to receive more
complete information for project requests so that the percentage delayed, canceled, or changed by the requestor is decreased.
• Continue efforts to work on Department priorities and not just program priorities. The program must stay flexible to continue to provide the people of Wyoming the best possible wildlife habitat and recreational opportunities.
• Complete the procedure manuals, which were initiated in 2005 to guide, and assist employees with their job responsibilities, duties, and tasks. The procedure manuals will provide task guidance through detailed descriptions of techniques and duties. In addition, the manuals will contain a calendar of deadlines to facilitate planning and preparation. The procedure manuals should be completed by December 2011.
• Increase communication efforts with Division administration by scheduling quarterly meetings to clarify operational priorities.
Performance Measure #3: Percent of public and Department employees satisfied with the management and maintenance of facilities on Wildlife Habitat Management Areas and Public Access Areas (Personnel in this program will work to achieve an internal satisfaction of at least 75 percent and an external satisfaction rate of at least 65 percent).
Story behind the performance: Annually, the Internal Client Satisfaction survey is distributed to Department personnel. The survey provides the opportunity for employees to evaluate the overall performance of 14 Department programs. In many respects, the ability of the Department to provide services to external clients depends upon the ability of employees to satisfy the needs of their internal clients. Similarly, the External Client Satisfaction survey is distributed
0
20
40
60
80
100
FY 07 FY 08 FY 09 FY 10 FY 11
% S
atis
fied
% Satisfied Internal
% Satisfied External
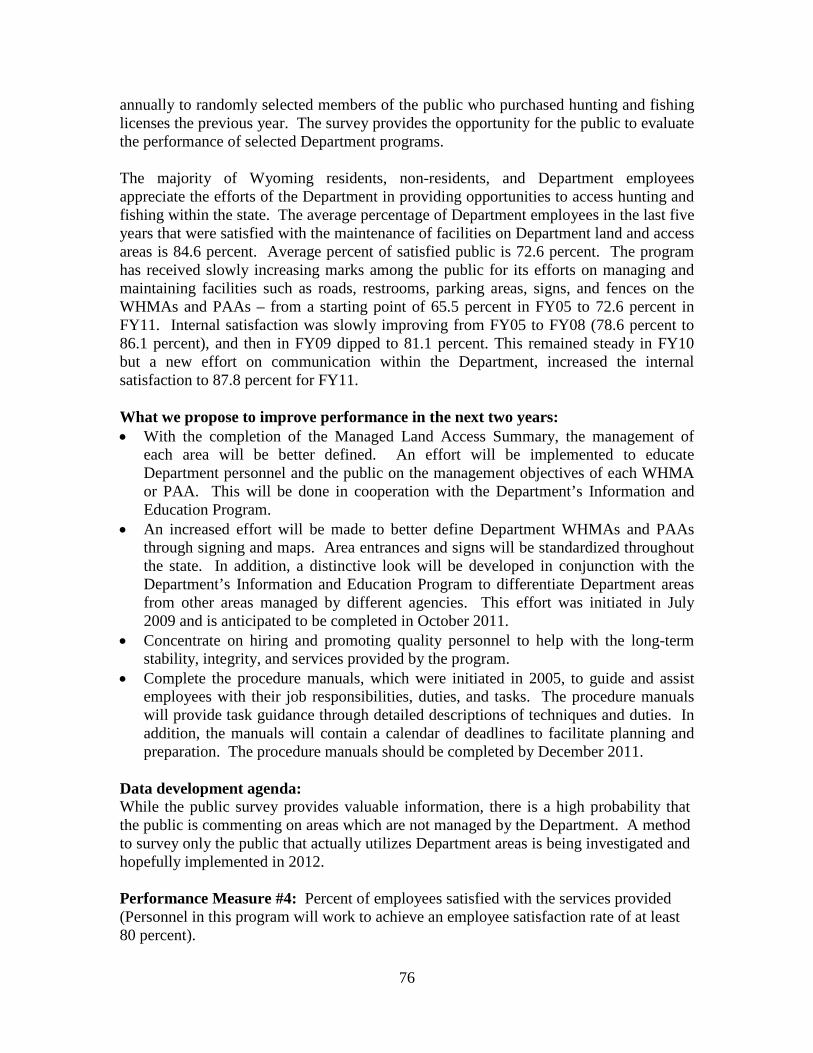
76
annually to randomly selected members of the public who purchased hunting and fishing licenses the previous year. The survey provides the opportunity for the public to evaluate the performance of selected Department programs. The majority of Wyoming residents, non-residents, and Department employees appreciate the efforts of the Department in providing opportunities to access hunting and fishing within the state. The average percentage of Department employees in the last five years that were satisfied with the maintenance of facilities on Department land and access areas is 84.6 percent. Average percent of satisfied public is 72.6 percent. The program has received slowly increasing marks among the public for its efforts on managing and maintaining facilities such as roads, restrooms, parking areas, signs, and fences on the WHMAs and PAAs – from a starting point of 65.5 percent in FY05 to 72.6 percent in FY11. Internal satisfaction was slowly improving from FY05 to FY08 (78.6 percent to 86.1 percent), and then in FY09 dipped to 81.1 percent. This remained steady in FY10 but a new effort on communication within the Department, increased the internal satisfaction to 87.8 percent for FY11. What we propose to improve performance in the next two years: • With the completion of the Managed Land Access Summary, the management of
each area will be better defined. An effort will be implemented to educate Department personnel and the public on the management objectives of each WHMA or PAA. This will be done in cooperation with the Department’s Information and Education Program.
• An increased effort will be made to better define Department WHMAs and PAAs through signing and maps. Area entrances and signs will be standardized throughout the state. In addition, a distinctive look will be developed in conjunction with the Department’s Information and Education Program to differentiate Department areas from other areas managed by different agencies. This effort was initiated in July 2009 and is anticipated to be completed in October 2011.
• Concentrate on hiring and promoting quality personnel to help with the long-term stability, integrity, and services provided by the program.
• Complete the procedure manuals, which were initiated in 2005, to guide and assist employees with their job responsibilities, duties, and tasks. The procedure manuals will provide task guidance through detailed descriptions of techniques and duties. In addition, the manuals will contain a calendar of deadlines to facilitate planning and preparation. The procedure manuals should be completed by December 2011.
Data development agenda: While the public survey provides valuable information, there is a high probability that the public is commenting on areas which are not managed by the Department. A method to survey only the public that actually utilizes Department areas is being investigated and hopefully implemented in 2012. Performance Measure #4: Percent of employees satisfied with the services provided (Personnel in this program will work to achieve an employee satisfaction rate of at least 80 percent).
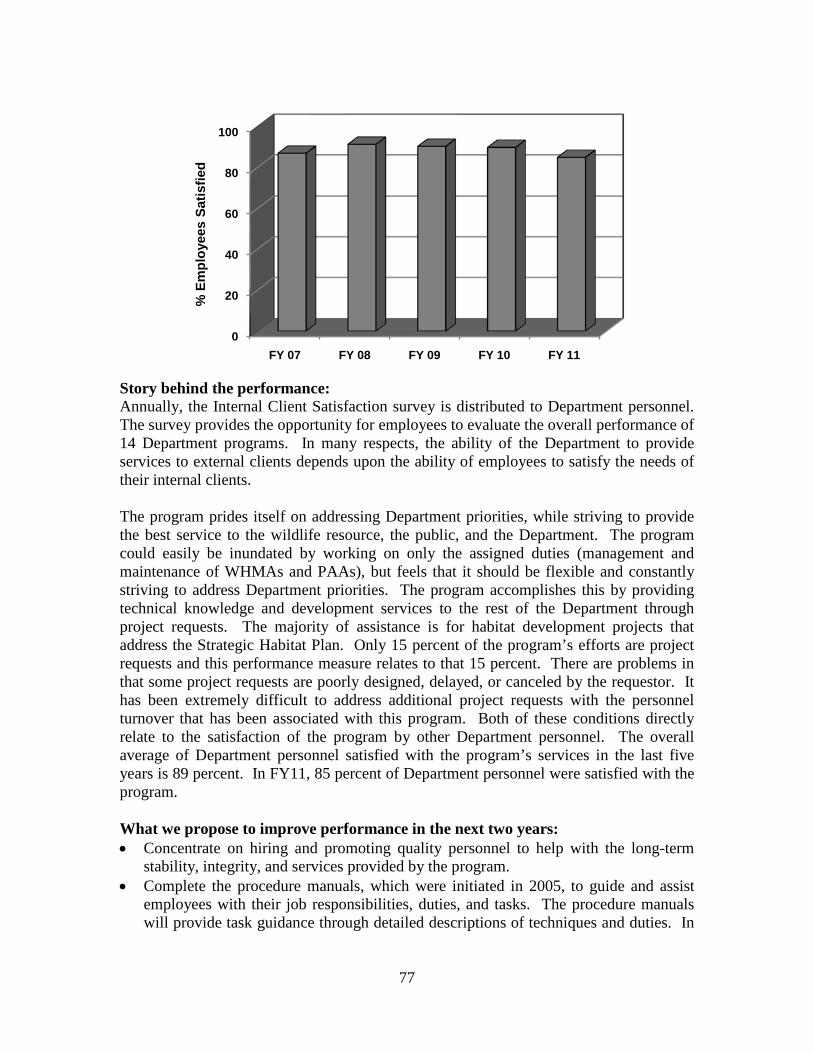
77
Story behind the performance: Annually, the Internal Client Satisfaction survey is distributed to Department personnel. The survey provides the opportunity for employees to evaluate the overall performance of 14 Department programs. In many respects, the ability of the Department to provide services to external clients depends upon the ability of employees to satisfy the needs of their internal clients. The program prides itself on addressing Department priorities, while striving to provide the best service to the wildlife resource, the public, and the Department. The program could easily be inundated by working on only the assigned duties (management and maintenance of WHMAs and PAAs), but feels that it should be flexible and constantly striving to address Department priorities. The program accomplishes this by providing technical knowledge and development services to the rest of the Department through project requests. The majority of assistance is for habitat development projects that address the Strategic Habitat Plan. Only 15 percent of the program’s efforts are project requests and this performance measure relates to that 15 percent. There are problems in that some project requests are poorly designed, delayed, or canceled by the requestor. It has been extremely difficult to address additional project requests with the personnel turnover that has been associated with this program. Both of these conditions directly relate to the satisfaction of the program by other Department personnel. The overall average of Department personnel satisfied with the program’s services in the last five years is 89 percent. In FY11, 85 percent of Department personnel were satisfied with the program. What we propose to improve performance in the next two years: • Concentrate on hiring and promoting quality personnel to help with the long-term
stability, integrity, and services provided by the program. • Complete the procedure manuals, which were initiated in 2005, to guide and assist
employees with their job responsibilities, duties, and tasks. The procedure manuals will provide task guidance through detailed descriptions of techniques and duties. In
0
20
40
60
80
100
FY 07 FY 08 FY 09 FY 10 FY 11
% E
mpl
oyee
s Sa
tisfie
d
78
addition, the manuals will contain a calendar of deadlines to facilitate planning and preparation. The procedure manuals should be completed by December 2011.
• Continue to work closely with terrestrial and aquatic habitat sections to receive more complete information for project requests so that the percentage delayed, canceled, or changed by the requestor is decreased.
• Continue efforts to work on Department priorities and not just program priorities. The program must remain flexible to continue to provide the public the best possible wildlife habitat and recreational opportunities.
• Educate Department employees on program priorities and limitations through presentations and discussions at FY11 and FY12 Wildlife, Fish, and Services Supervisors meeting and at the region Coordination Team meetings.
Data development agenda: While the percent satisfaction is important data, future internal survey will be modified to be more specific to employee satisfaction of the handling and completion of project requests. Therefore, the future data should relate to project requests.
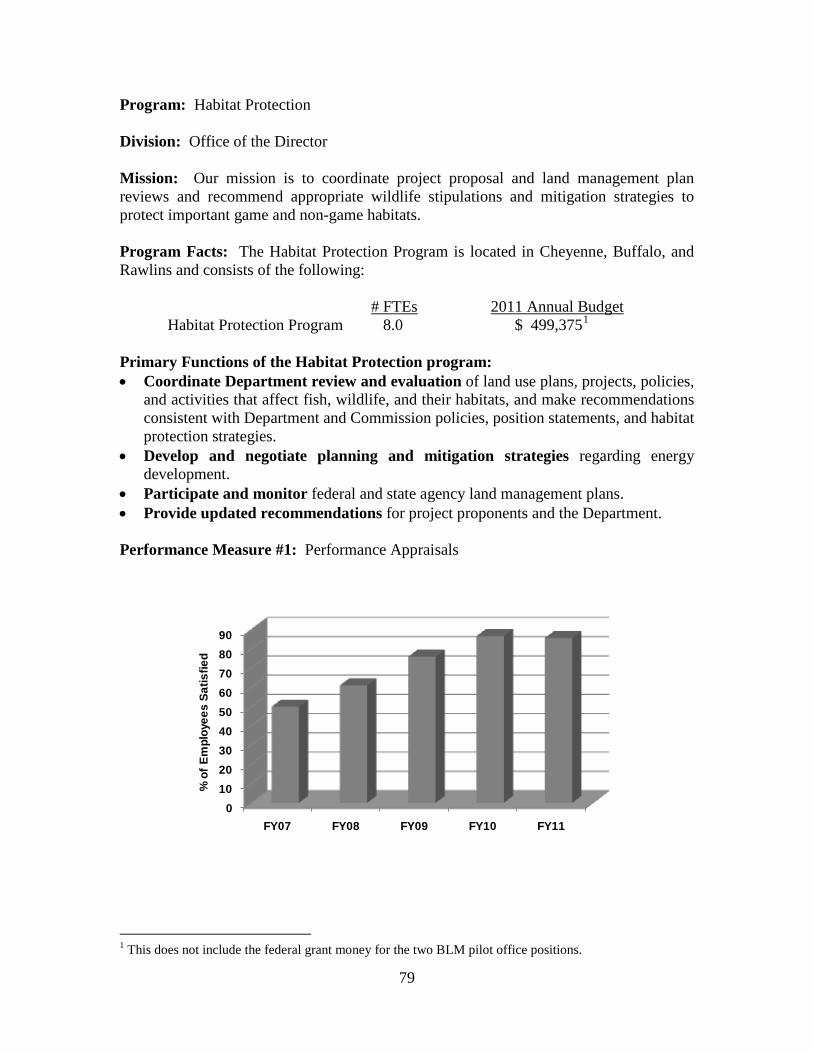
79
Program: Habitat Protection Division: Office of the Director Mission: Our mission is to coordinate project proposal and land management plan reviews and recommend appropriate wildlife stipulations and mitigation strategies to protect important game and non-game habitats. Program Facts: The Habitat Protection Program is located in Cheyenne, Buffalo, and Rawlins and consists of the following: # FTEs 2011 Annual Budget
Habitat Protection Program 8.0 $ 499,3751 Primary Functions of the Habitat Protection program: • Coordinate Department review and evaluation of land use plans, projects, policies,
and activities that affect fish, wildlife, and their habitats, and make recommendations consistent with Department and Commission policies, position statements, and habitat protection strategies.
• Develop and negotiate planning and mitigation strategies regarding energy development.
• Participate and monitor federal and state agency land management plans. • Provide updated recommendations for project proponents and the Department. Performance Measure #1: Performance Appraisals
0102030405060708090
FY07 FY08 FY09 FY10 FY11
% o
f Em
ploy
ees
Satis
fied
1 This does not include the federal grant money for the two BLM pilot office positions.
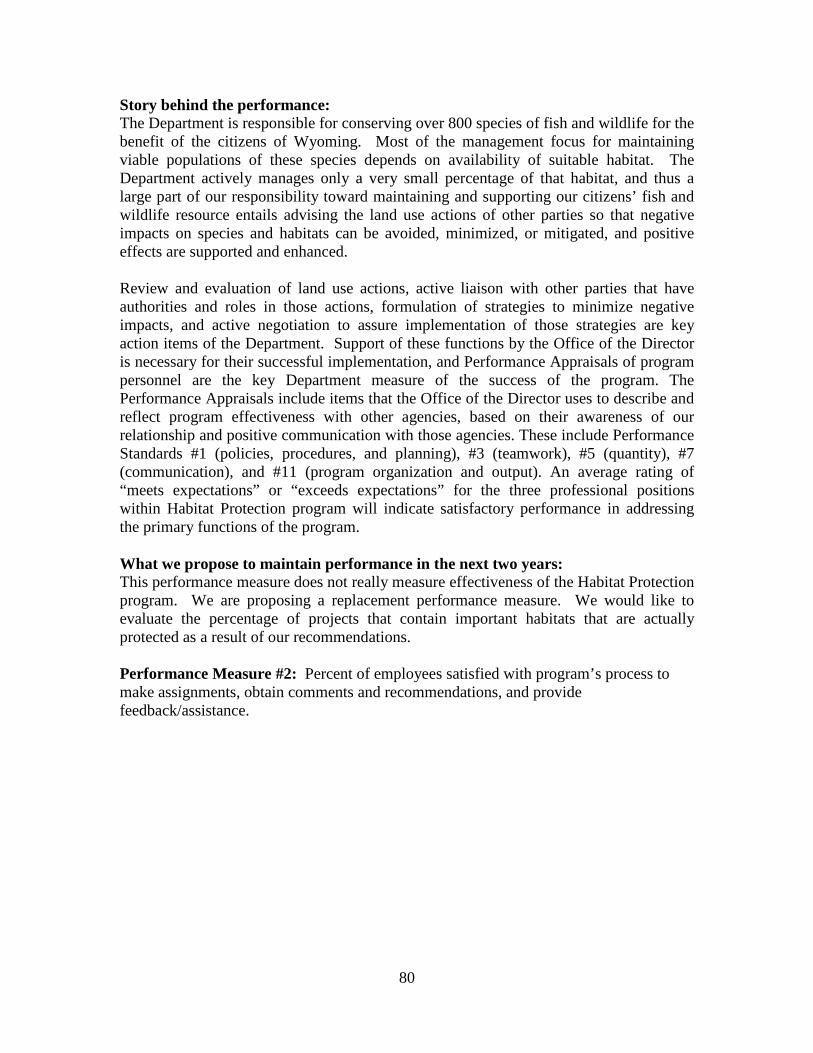
80
Story behind the performance: The Department is responsible for conserving over 800 species of fish and wildlife for the benefit of the citizens of Wyoming. Most of the management focus for maintaining viable populations of these species depends on availability of suitable habitat. The Department actively manages only a very small percentage of that habitat, and thus a large part of our responsibility toward maintaining and supporting our citizens’ fish and wildlife resource entails advising the land use actions of other parties so that negative impacts on species and habitats can be avoided, minimized, or mitigated, and positive effects are supported and enhanced. Review and evaluation of land use actions, active liaison with other parties that have authorities and roles in those actions, formulation of strategies to minimize negative impacts, and active negotiation to assure implementation of those strategies are key action items of the Department. Support of these functions by the Office of the Director is necessary for their successful implementation, and Performance Appraisals of program personnel are the key Department measure of the success of the program. The Performance Appraisals include items that the Office of the Director uses to describe and reflect program effectiveness with other agencies, based on their awareness of our relationship and positive communication with those agencies. These include Performance Standards #1 (policies, procedures, and planning), #3 (teamwork), #5 (quantity), #7 (communication), and #11 (program organization and output). An average rating of “meets expectations” or “exceeds expectations” for the three professional positions within Habitat Protection program will indicate satisfactory performance in addressing the primary functions of the program. What we propose to maintain performance in the next two years: This performance measure does not really measure effectiveness of the Habitat Protection program. We are proposing a replacement performance measure. We would like to evaluate the percentage of projects that contain important habitats that are actually protected as a result of our recommendations. Performance Measure #2: Percent of employees satisfied with program’s process to make assignments, obtain comments and recommendations, and provide feedback/assistance.
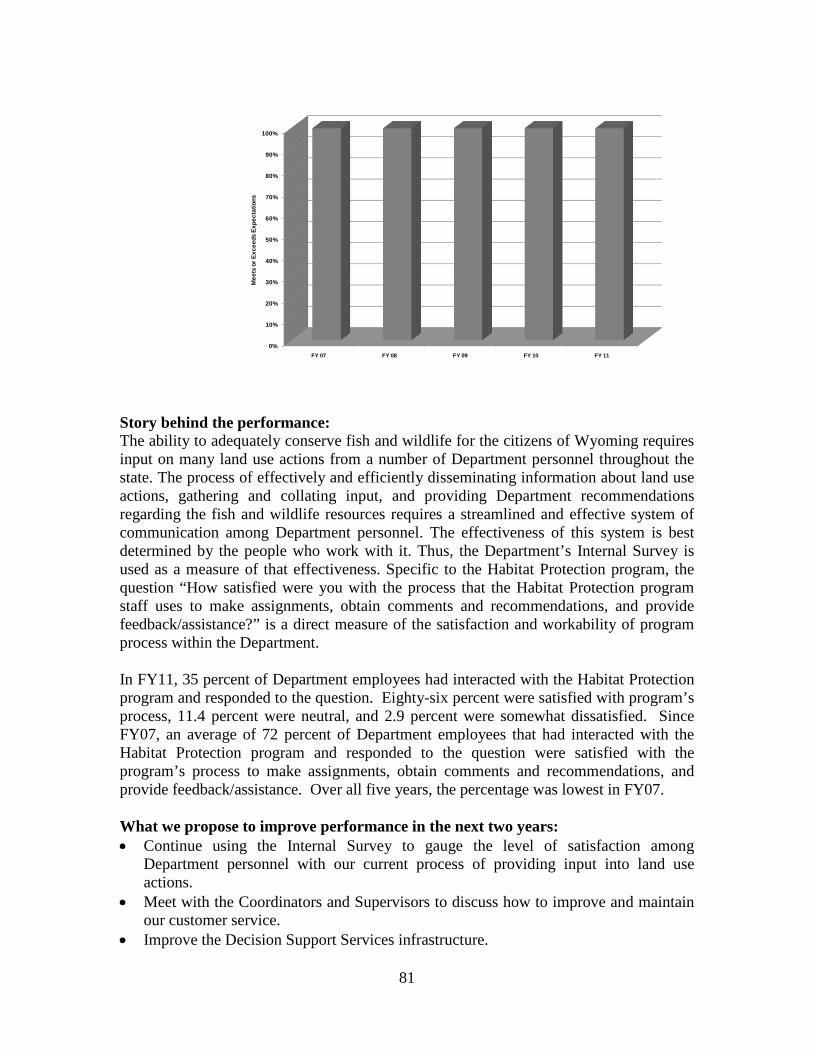
81
0%
10%
20%
30%
40%
50%
60%
70%
80%
90%
100%
FY 07 FY 08 FY 09 FY 10 FY 11
Mee
ts o
r Exc
eeds
Exp
ecta
tions
Story behind the performance: The ability to adequately conserve fish and wildlife for the citizens of Wyoming requires input on many land use actions from a number of Department personnel throughout the state. The process of effectively and efficiently disseminating information about land use actions, gathering and collating input, and providing Department recommendations regarding the fish and wildlife resources requires a streamlined and effective system of communication among Department personnel. The effectiveness of this system is best determined by the people who work with it. Thus, the Department’s Internal Survey is used as a measure of that effectiveness. Specific to the Habitat Protection program, the question “How satisfied were you with the process that the Habitat Protection program staff uses to make assignments, obtain comments and recommendations, and provide feedback/assistance?” is a direct measure of the satisfaction and workability of program process within the Department. In FY11, 35 percent of Department employees had interacted with the Habitat Protection program and responded to the question. Eighty-six percent were satisfied with program’s process, 11.4 percent were neutral, and 2.9 percent were somewhat dissatisfied. Since FY07, an average of 72 percent of Department employees that had interacted with the Habitat Protection program and responded to the question were satisfied with the program’s process to make assignments, obtain comments and recommendations, and provide feedback/assistance. Over all five years, the percentage was lowest in FY07. What we propose to improve performance in the next two years: • Continue using the Internal Survey to gauge the level of satisfaction among
Department personnel with our current process of providing input into land use actions.
• Meet with the Coordinators and Supervisors to discuss how to improve and maintain our customer service.
• Improve the Decision Support Services infrastructure.
82
Program: Information Division: Services Mission: Disseminate information to promote public understanding and support for wildlife, wildlife habitat, wildlife conservation, and the Department’s management programs. Program Facts: The Information program is made up of two major sub-programs, listed below with number of staff and 2011 (FY11) budget: Sub-programs #FTEs* 2011 Annual Budget
Information 5.0 $ 78,018 Publications 3.0 $ 463,615
TOTAL 8.0 $ 541,633
* Includes permanent positions authorized in the FY11 budget. Any positions added during the budget cycle require Wyoming Game and Fish Commission authorization or must be funded from supplemental grants. One of the Information full-time employees (FTE) was also assigned a Regional Information and Education Specialist (RIES) duties which cover the Laramie Region. This was done when the RIESs were placed under the Multi-Media Supervisor position, and the Laramie Region RIES/Supervisor FTE was converted to the webmaster FTE position. This program is located in the Department Headquarters Office in Cheyenne. Primary Functions of the Information Program: • Disseminate information to promote public understanding and support for
wildlife, wildlife habitat, and wildlife conservation through audio, video, print and other media, and personal contact with constituents. These efforts to provide wildlife-related information facilitate the development of informed support for Department programs.
• Encourage involvement and cooperation of the Department’s management programs through proactive outreach strategies, including three external publications that encourage interest in wildlife and wildlife habitat and provide information on current Department management practices. These publications, provided consistently throughout the fiscal year, facilitate the development of informed support for Department programs.
• Serve people by providing wildlife, hunting, and fishing related information through the news media.
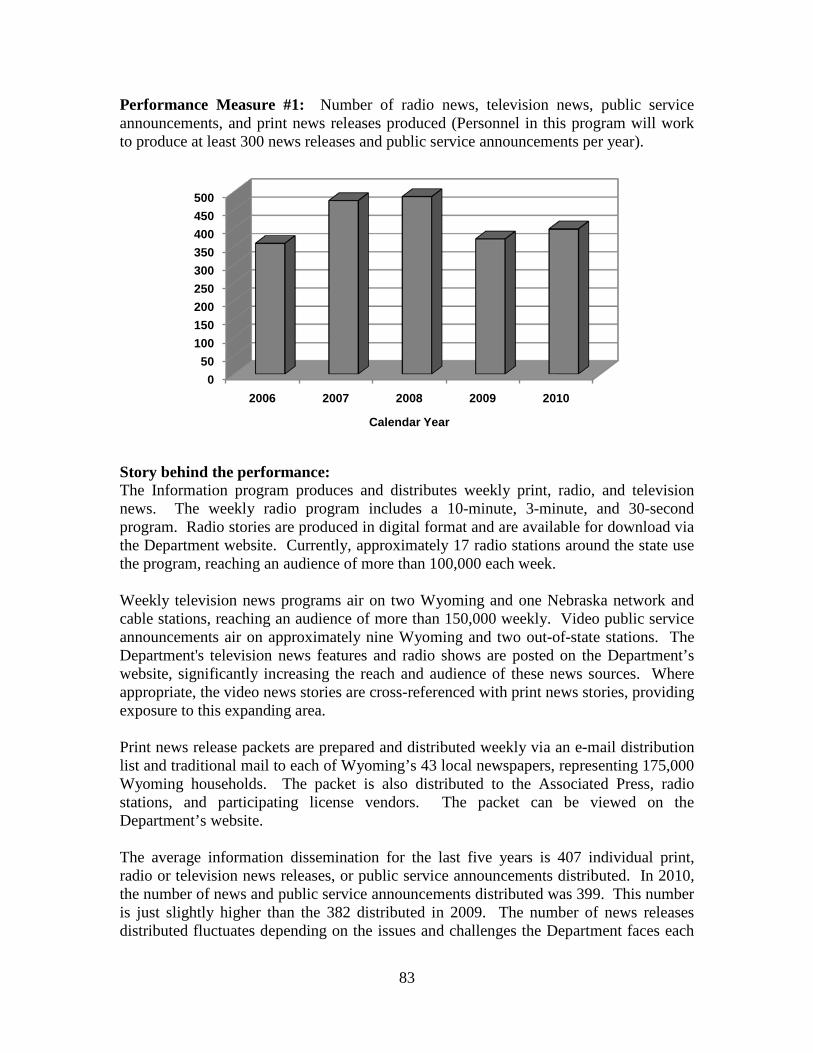
83
Performance Measure #1: Number of radio news, television news, public service announcements, and print news releases produced (Personnel in this program will work to produce at least 300 news releases and public service announcements per year).
Story behind the performance: The Information program produces and distributes weekly print, radio, and television news. The weekly radio program includes a 10-minute, 3-minute, and 30-second program. Radio stories are produced in digital format and are available for download via the Department website. Currently, approximately 17 radio stations around the state use the program, reaching an audience of more than 100,000 each week. Weekly television news programs air on two Wyoming and one Nebraska network and cable stations, reaching an audience of more than 150,000 weekly. Video public service announcements air on approximately nine Wyoming and two out-of-state stations. The Department's television news features and radio shows are posted on the Department’s website, significantly increasing the reach and audience of these news sources. Where appropriate, the video news stories are cross-referenced with print news stories, providing exposure to this expanding area. Print news release packets are prepared and distributed weekly via an e-mail distribution list and traditional mail to each of Wyoming’s 43 local newspapers, representing 175,000 Wyoming households. The packet is also distributed to the Associated Press, radio stations, and participating license vendors. The packet can be viewed on the Department’s website. The average information dissemination for the last five years is 407 individual print, radio or television news releases, or public service announcements distributed. In 2010, the number of news and public service announcements distributed was 399. This number is just slightly higher than the 382 distributed in 2009. The number of news releases distributed fluctuates depending on the issues and challenges the Department faces each
050
100150200250300350400450500
2006 2007 2008 2009 2010
Calendar Year
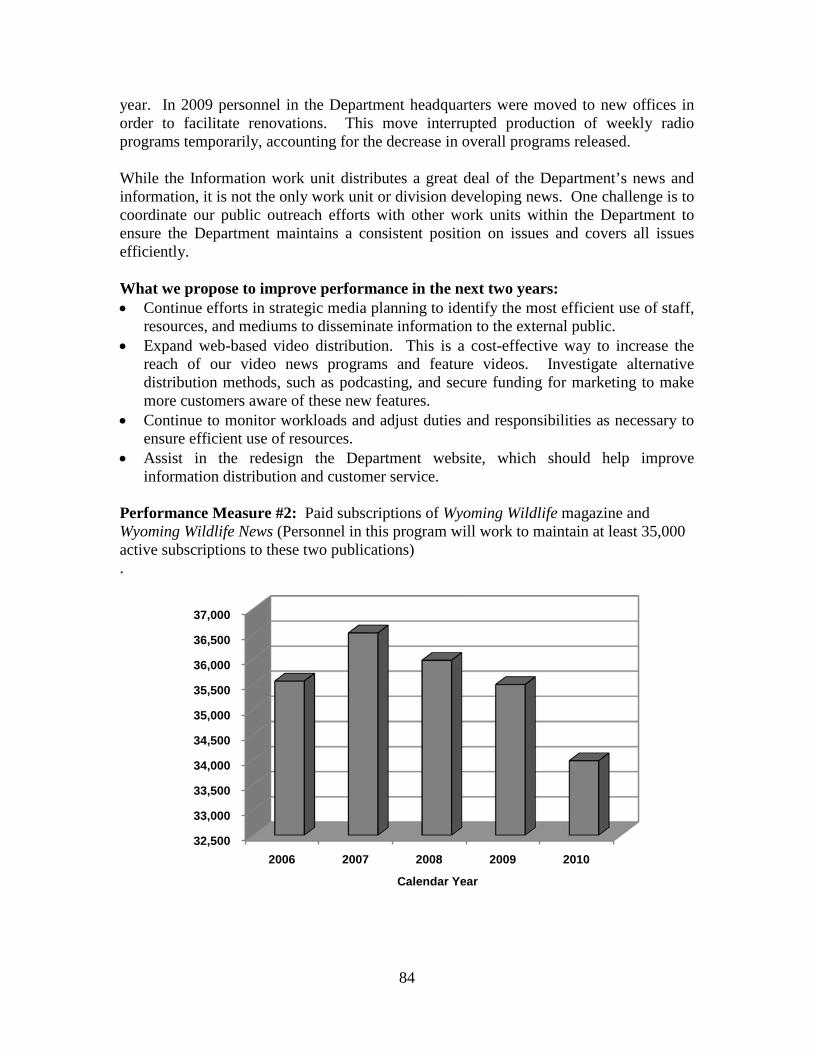
84
year. In 2009 personnel in the Department headquarters were moved to new offices in order to facilitate renovations. This move interrupted production of weekly radio programs temporarily, accounting for the decrease in overall programs released. While the Information work unit distributes a great deal of the Department’s news and information, it is not the only work unit or division developing news. One challenge is to coordinate our public outreach efforts with other work units within the Department to ensure the Department maintains a consistent position on issues and covers all issues efficiently. What we propose to improve performance in the next two years: • Continue efforts in strategic media planning to identify the most efficient use of staff,
resources, and mediums to disseminate information to the external public. • Expand web-based video distribution. This is a cost-effective way to increase the
reach of our video news programs and feature videos. Investigate alternative distribution methods, such as podcasting, and secure funding for marketing to make more customers aware of these new features.
• Continue to monitor workloads and adjust duties and responsibilities as necessary to ensure efficient use of resources.
• Assist in the redesign the Department website, which should help improve information distribution and customer service.
Performance Measure #2: Paid subscriptions of Wyoming Wildlife magazine and Wyoming Wildlife News (Personnel in this program will work to maintain at least 35,000 active subscriptions to these two publications) .
32,500
33,000
33,500
34,000
34,500
35,000
35,500
36,000
36,500
37,000
2006 2007 2008 2009 2010
Calendar Year
85
Story behind the performance: The Publications sub-program produces two regular publications: Wyoming Wildlife magazine a monthly, 4-color publication; and Wyoming Wildlife News, a semi-monthly tabloid newspaper. Average monthly readership for the magazine was 31,486 and distribution of the News is approximately 26,000 per issue, including a per-issue average of 2,500 subscribers. Both publications are tools used by the Department to generate appreciation and support for wildlife and wild places in the state as well as to raise awareness of issues that affect wildlife and outdoor recreation. Wyoming Wildlife News targets hunters, anglers, and trappers inside the state. The focus of the News is outdoor recreation along with the management of fish and terrestrial game. The News is distributed free of charge at Game and Fish offices, license selling agents, and other distributors across Wyoming and into western Nebraska. Wyoming Wildlife magazine targets a broad audience. Many of the magazine’s subscribers are hunters and anglers, but a large proportion of its readers have a less focused interest in the state’s wildlife and open spaces. The magazine attempts to deepen their interest and support for wildlife and wildlife conservation in Wyoming. These two publications are the only Department public relations tools that defray much of their own costs. In FY 2010, gross receipts from subscription sales reached $276,833. Nearly all of this came from sales of magazine subscriptions. The average paid subscriptions for the Wyoming Wildlife magazine over the last five years is 30,700 per year, a number that has remained fairly constant throughout the years. The decrease in the graphs is the loss of subscribers to Wyoming Wildlife News. Assuming an average household size of 2.59 people, that means the magazine reaches about 80,000 people per issue. Adequate funding of promotion efforts for magazine subscriptions would allow the staff to increase circulation, income, and readership. The Publications work unit relies on some freelance articles and photographs for the Wyoming Wildlife magazine and Wyoming Wildlife News resulting in increased costs related to purchasing articles and photos, and an out-of-date photo file. Additionally, there is a need for additional funds for a survey tool to better illuminate readers’ reaction to the periodicals. What we propose to improve performance in the next two years: • Create and maintain a web presence for both publications. A web presence would
further increase visibility of the magazine and expand the potential subscriber base. The Department's website remains a cost-effective marketing tool to increase readership and subscribers.
• Cross-promote all publications and outreach efforts to increase visibility and expand potential subscriber base. Wherever possible, print and radio news releases should include mention of Wyoming Wildlife magazine and Wyoming Wildlife News.

86
• Given adequate funding, implement a readership survey to assess current subscriber satisfaction and demographics of both Wyoming Wildlife magazine and Wyoming
Wildlife News. This will provide the Department with baseline data on our readership and give hard data to determine how adjusting the focus, content, delivery, or price of either publication will affect current readership.
87
Program: Information Technology Division: Services Mission: Provide high quality, secure technology solutions, services, and support to the Department and external constituents to allow for sound fiscal and management decisions. Program Facts: The Information Technology program is made up of one major sub-program, listed below with number of staff and 2011 (FY11) budget: Sub-program # FTEs* 2011 Annual Budget
Information Technology 17.0 $ 2,880,553 * Includes permanent, contract and temporary positions authorized in FY11 budget. Any positions added during the budget cycle require Wyoming Game and Fish Commission authorization or must be funded from supplemental grants. One At-Will-Employee-Contract (AWEC) position has continued to help provide extended-hours technical support for the Department Electronic License Point-of-Sale Service. Payroll for one GIS Analyst position was funded in the 601A CWCS 11-12 General Fund budget. Two additional AWEC positions were added, with funding from the US Fish and Wildlife Service and residing in the 7Y4B budget. All three positions remain as GIS support positions within the GIS Section of the Information Technology program. The Information Technology program is also referred to as the Management Information Services program in Fiscal documentation. The current program is made up of administration and three sections: Application Development, Operations and Support, and Geographic Information Systems. This program is located in the Department Headquarters Office in Cheyenne. Primary Functions of the Information Technology Program: • Provide high quality, secure technology solutions to the Department that support
the overall mission and empower personnel to achieve completion of their workload through the use of technology in a successful, efficient, timely, and cost effective manner.
• Provide services and support to ensure data integrity and security. • Provide support to external constituents by providing and supporting an Internet
hardware and software framework to facilitate better Department communication with our constituents and to provide a means for dynamic interaction between the Department and the general public.
• Facilitate sound fiscal decisions by evaluating technology to identify the best solution to a given problem, challenge, or situation and leverage Information
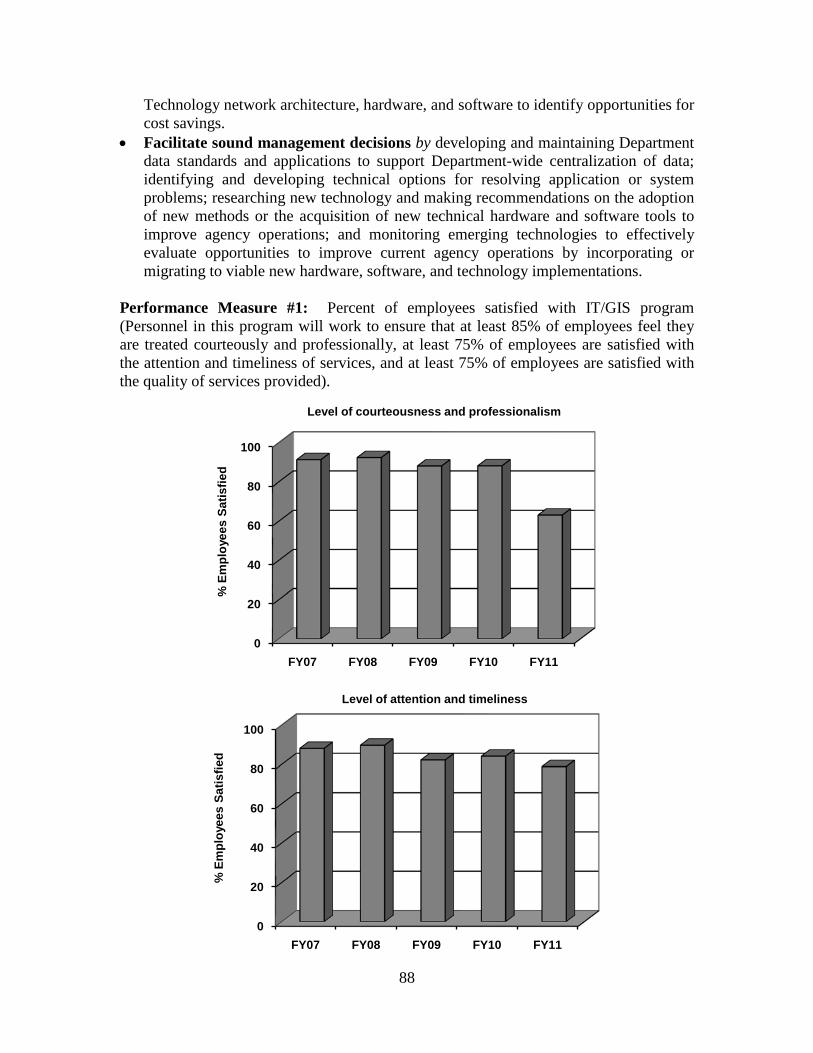
88
Technology network architecture, hardware, and software to identify opportunities for cost savings.
• Facilitate sound management decisions by developing and maintaining Department data standards and applications to support Department-wide centralization of data; identifying and developing technical options for resolving application or system problems; researching new technology and making recommendations on the adoption of new methods or the acquisition of new technical hardware and software tools to improve agency operations; and monitoring emerging technologies to effectively evaluate opportunities to improve current agency operations by incorporating or migrating to viable new hardware, software, and technology implementations.
Performance Measure #1: Percent of employees satisfied with IT/GIS program (Personnel in this program will work to ensure that at least 85% of employees feel they are treated courteously and professionally, at least 75% of employees are satisfied with the attention and timeliness of services, and at least 75% of employees are satisfied with the quality of services provided).
0
20
40
60
80
100
FY07 FY08 FY09 FY10 FY11
% E
mpl
oyee
s Sa
tisfie
d
Level of courteousness and professionalism
0
20
40
60
80
100
FY07 FY08 FY09 FY10 FY11
% E
mpl
oyee
s Sa
tisfie
d
Level of attention and timeliness
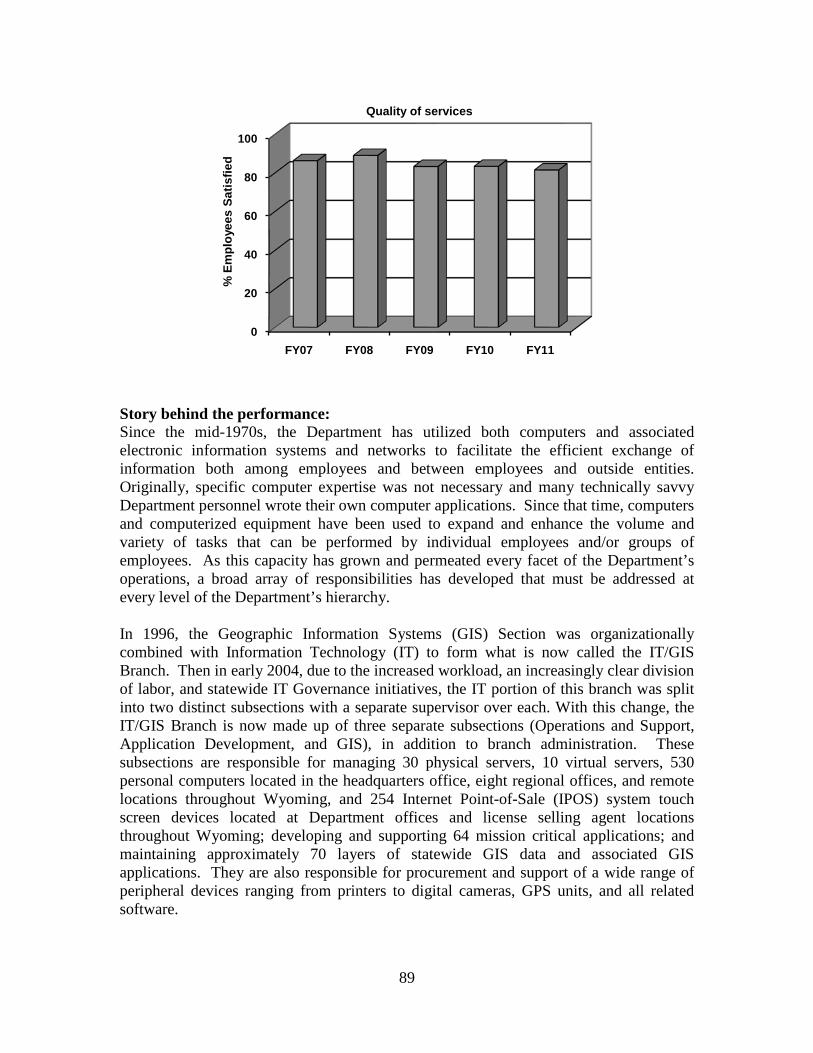
89
Story behind the performance: Since the mid-1970s, the Department has utilized both computers and associated electronic information systems and networks to facilitate the efficient exchange of information both among employees and between employees and outside entities. Originally, specific computer expertise was not necessary and many technically savvy Department personnel wrote their own computer applications. Since that time, computers and computerized equipment have been used to expand and enhance the volume and variety of tasks that can be performed by individual employees and/or groups of employees. As this capacity has grown and permeated every facet of the Department’s operations, a broad array of responsibilities has developed that must be addressed at every level of the Department’s hierarchy. In 1996, the Geographic Information Systems (GIS) Section was organizationally combined with Information Technology (IT) to form what is now called the IT/GIS Branch. Then in early 2004, due to the increased workload, an increasingly clear division of labor, and statewide IT Governance initiatives, the IT portion of this branch was split into two distinct subsections with a separate supervisor over each. With this change, the IT/GIS Branch is now made up of three separate subsections (Operations and Support, Application Development, and GIS), in addition to branch administration. These subsections are responsible for managing 30 physical servers, 10 virtual servers, 530 personal computers located in the headquarters office, eight regional offices, and remote locations throughout Wyoming, and 254 Internet Point-of-Sale (IPOS) system touch screen devices located at Department offices and license selling agent locations throughout Wyoming; developing and supporting 64 mission critical applications; and maintaining approximately 70 layers of statewide GIS data and associated GIS applications. They are also responsible for procurement and support of a wide range of peripheral devices ranging from printers to digital cameras, GPS units, and all related software.
0
20
40
60
80
100
FY07 FY08 FY09 FY10 FY11
% E
mpl
oyee
s Sa
tisfie
d
Quality of services
90
To make effective technology strategy recommendations, IT/GIS personnel must maintain a thorough understanding of the Department’s goals, objectives, and methods by which the Department’s various programs can connect to these. Continual changes to the environment in which the applications operate (interfaces to other applications, changes to hardware, software, and operating systems, new data from users, evolving technologies) requires a dedicated team of informed operations specialists, application developers, and GIS analysts working cooperatively to maintain and improve these systems. System and service failures can rapidly impact large numbers of customers, suppliers, and internal staff. Network outages, server failures, e-mail downtime, and broken desktop computers can significantly reduce the productivity of the entire Department. Since implementing e-Commerce systems in 2007, the Department has become increasingly dependent on technologies to process license sales (just under $66 million dollars were processed through these systems in 2010). It is essential that data integrity is maintained and that this system has the capacity to handle over 200 concurrent License Selling Agents, plus Internet users. At peak times, it is not improbable that there could be 6,000 to 8,000 Internet users submitting on-line applications per day, with over 200 LSAs completing daily transactions at the same time. Thus, reduced or failed service during even part of a day can seriously impact business and certainly influence both internal and external customer perception of the IT/GIS program, especially if this occurs during critical periods. Conversely, when the IT Operations team is executing effectively in building and maintaining a robust infrastructure, and the IT Applications Development team has programmed streamlined and well performing applications, their work is invisible since the technology is performing as employees and customers expect. An example of this was seen in July of 2011 when selling Leftover Big Game Licenses via our Internet Website and license terminals located throughout the state. During the 2009 and 2010 draw periods, systems had been running seamlessly and we felt confident the 2011 draws would operate in the same manner. However, in July of this year, these systems experienced a significant delay in the license purchase process during the first twenty minutes of leftover licenses going on sale. We saw a significant amount of traffic generated by hunters and outfitters looking to purchase leftover licenses with over 8,000 separate connections to our systems just prior to the licenses going on sale on July 20. As many on-line retailers have experienced during similar high demand situations, this resulted in a number of unsatisfied internal and external customers. Shortly thereafter, IT personnel worked aggressively to conduct extensive research and testing to recreate the problem and then to identify and correct the source of the slowdown. We have converted the licensing application to use a later .NET technology and we will continue to stress test and refine the licensing applications in an effort to enhance the performance and stability in this application for 2012. In addition, we will be replacing two of our database servers in our load balanced Web-farm environment to further improve stability and performance of these systems.

91
Improved customer satisfaction with the performance of our e-commerce systems has illustrated that the entire Department Internet site needed to be rewritten in the same technologies to permanently resolve remaining customer satisfaction issues. The largest part of this work has been completed and the Department has hired a Webmaster to begin the process of converting Web site content from the old system to the new one. Many enhancements were also made to the on-line Big Game License Application System, which allows sportspersons to apply for the big game license drawings via the Internet. This year we processed 222,850 license draw applications, 7,955 more than last year; of those, 80 percent were submitted through our on-line system compared to 74 percent last year; and non-residents accounted for nearly 43 percent of the 177,910 total on-line applications. The preference point totals were not included in the application period as there is still over two weeks remaining at the time of this report. Seventy-nine percent of Wyoming residents who applied for big game licenses did so through our on-line system (101,052 on-line versus 27,233 paper applications) and 81 percent of non-residents submitted their applications on-line (76,857 on-line versus 17,709 paper applications). The Application Development Section also enhanced and streamlined the Internet Point of Sale System (IPOS), which services over 210 license selling agents throughout Wyoming. A new Boats Issuance and Renewal System was incorporated into the IPOS application this past year. This includes all inventory/accounting functionality needed by the Fiscal Division and license selling agents. In all licensing systems, all customer social security numbers were deleted and converted over to random generated numbers to help reduce identity theft. Each system was also changed to capture only the last 4 digits of the social security number each time a person applies for a draw license or purchases a licensing item as per Federal mandate.
With advances in worldwide e-Commerce, securing credit card transactions and further hardening systems to help guard against identity theft have taken center stage. As of July of 2010, we are now required to comply with Payment Card Industry Data Security Standards ((PCI-DSS). This brings with it a significant set of requirements and ways of managing Department technologies in order to meet and maintain compliance. These requirements affect everything from network infrastructure down to the individual desktop and work in this area continues. In light of work done on our e-commerce systems, IT/GIS Branch personnel continue to face challenges with integrating and centralizing many Department computer applications, specifically related to allocating adequate programming time to get them completed. This involves a large number of applications originally developed by Department employees and ultimately integrated into a centralized system. In relation to enterprise e-mail, the State of Wyoming contracted with Google to implement a centralized e-mail system for state agencies. This project has impacted the
92
way we do business on several fronts. Converting from the old to new e-mail system has had a significant impact on virtually every Department employee, which has led to dissatisfaction of several employees through the process. Our IT Operations personnel were also heavily involved in technology aspects of the Cheyenne Headquarters Office renovation project. They worked closely with architects and contractors to design a modern data center, complete with a temperature controlled and conditioned power environment. This data center is much superior to our previous system and it is positioned to better house our internal agency and e-commerce systems. The IT help desk and IT governance (the rules and regulations under which an IT department functions and a mechanism developed to ensure compliance with those rules and regulations) are in place to assist internal and external customers in achieving their individual goals. A critical role of these entities is also to help protect against system failures and are large drivers of customer satisfaction, which is a main driver of the need for system uptime. The IT help desk interacts with Department personnel on a constant basis and there are few, if any, other entities within the Department that regularly interact and impact virtually every employee daily. Response time, courtesy of the representative, level of follow-up/follow-through, and resolution speed are all factors that drive customer satisfaction. With the exponential rate that technologies are evolving, having the ability to provide the desired technologies in a timely manner, at a reasonable cost, and then to be able to support those technologies when employees need assistance can also be a daunting challenge. This especially true considering that this must be done in compliance with the security standards noted above. Similar to service failure, a single mistake by IT/GIS personnel can impact the reputation of the entire program because of the potential actual and perceived ramifications of the error. Several other areas that affect the user base include user administration, capacity planning, disaster recovery, and security as noted above. When looking at the IT Operations Section, which houses the IT help desk, internal customer satisfaction remained fairly stable, especially considering that we continued to man all extended-hours technical support for the Internet Point-of-Sale System, which includes 254 touch screen devices located at Department offices and license selling agent locations throughout Wyoming. This has impacted our ability to respond to agency requests for technical service as rapidly as was possible prior to this change; however, we have been able to maintain satisfaction to this point. In addition, we continued to tighten network security and implementing Windows 7 as the operating system for new computers and laptops during this fiscal year. This was done in an effort to get the Department in compliance with State of Wyoming IT policy, to improve previous software licensing/installation issues, and to further prevent malicious code propagating throughout our systems. We believe removing the ability to add and remove software and independently manage their machines was partially
93
accountable for any negative impact in the overall satisfaction of several Department personnel as more employees become affected by this change. Regarding the IT governance aspect, during the 2002 budget session the Wyoming Legislature created a state Chief Information Officer Position and we began to see significant affects to the Department beginning in 2003. With this position came a statewide Information Technology Governance Structure, which began implementation of centralized common IT services throughout state government including technology procurement. This process has also required a significant amount of effort and time commitment, especially for the Department IT Manager, which in turn has reduced time available to address Department specific IT issues. This, along with agency conformance to the statewide governance structure and accompanying changes in IT policy and technology procurement methods (initially driven by this initiative), has undoubtedly impacted Department employee satisfaction in quality of services in previous years. We anticipate that this will continue to require a large amount of time in order to ensure that Department interests are considered throughout the IT Governance Structure. Another factor that has affected customer satisfaction since early 2003 is an Electronic Licensing Service (ELS) we have implemented in conjunction with Fiscal Division as noted above. Aside from mission critical applications, this project continues to be the number one priority for IT Administration and the Development and Operations Subsections within our branch. The time and effort dedicated to this project has resulted in many other Department projects being placed on hold until this work is completed and this has undoubtedly affected internal customer satisfaction. While the Application Development Section has been working on various smaller projects as able, we know from personal interaction that Department personnel desire more of their applications completed. A similar effort driving customer satisfaction can be seen in efforts to centralize and reduce fragmentation of GIS work throughout the Department. We are beginning to see large support for this initiative. We believe this support is in part due to individuals beginning to see value in collaboration and benefits of centralized data. A GIS Working Group was created to help address agency-wide GIS consolidation and had begun to see successes with budget approvals to begin building the framework for this project. At the end of FY 08, the paperwork to officially transfer a vacant position to the GIS Section was initiated. This position was intended to build the back-end infrastructure to facilitate the centralization of geospatial data, advance the concept of a Department enterprise GIS program, and contribute to ongoing technical support of the program’s end-users. Due to economic downturn, this position was frozen and ultimately eliminated, which will continue to delay building the framework for this project. At the same time, Department-wide demand for GIS work has continued to rise significantly over the past year. Examples of these demands include assignments to the Western Governor’s Wildlife Council’s Western States Decision Support System Sub-Group, the Great Northern Landscape Conservation Cooperative (GNLCC), and
94
work with the Wyoming Geographic Information Science Center to re-develop our GIS-based decision support system. As more efforts have been initiated to address concerns associated with species and their habitats (GNLCC, sage-grouse implementation recommendations, State Wildlife Action Plan revision and implementation, Strategic Habitat Plan revision, etc.), impacts on data needs, analyses, and GIS technology products have increased. The Geospatial Information Systems necessary to support this work are an integrated part of our larger technology infrastructure. As such, our ability to maintain uptime of these systems is essential to supporting these projects. With the additional Department priorities noted above, our ability to address projects and activities planned at an earlier date have been delayed, thus customer perceptions of our service in this area may decline. In order to comply with PCI-DSS requirements, we also implemented a password change requirement in addition to migration of the entire Department to the new State e-mail system. Both of these made up the balance of any negative impacts seen in the overall satisfaction of Department personnel. Annually, the Internal Client Satisfaction survey is distributed to Department personnel. The survey provides the opportunity for employees to measure the overall performance of 14 Department programs. Since FY 07, the average percent of employees satisfied with the level of courteousness and professionalism in the IT/GIS Branch was 84.64 percent, the level of satisfaction with attention and timeliness was 84.56 percent, and satisfaction with quality of services provided was 84.63 percent. In FY 11, the level of satisfaction for courteousness and professionalism was 63.2 percent, 78.8 percent for attention and timeliness, and 81.4 percent for quality of services provided. As noted, we made several significant changes to agency-wide technologies during this evaluation period in order to address Department and state priorities. Many of these changes were implemented during or just prior to conducting the internal satisfaction survey and undoubtedly these changes resulted in negative impacts seen in the survey. What we propose to do to improve performance in the next two years: • Continue to prioritize the GIS workload and work closely with the Services Division
and Department Administration to find ways to address the increasing demand for GIS technologies.
• Continue refinement of our problem tracking system to further identify trends in an effort to increase the capability of the team to correct problems and minimize potential for recurrence, thereby lowering overall IT support costs in the future. We have now implemented this in the IT/GIS Branch and plan to gradually expand the use of this software to other entities throughout the Department. Our ability to accomplish this expansion will be largely dependent on time allocated to bringing up the new ELS Internet Point-of-Sale system, which has been given our number one priority.
95
• Define and document the application architecture (the description of all software applications and how they interface with each other) in order to prioritize applications, maintenance, and development on a Department-wide basis.
• Promote information sharing across the Department and other state agencies by actively working with personnel to integrate and centralize their applications and data. We have been centralizing databases into our SQL database server on a continual basis and we plan to continue this work as a part of our promotion and facilitation of agency-wide data sharing.
• Proactively engage in public relations efforts to highlight our successes and ensure that our efforts are recognized by Department personnel, as communication is possibly the single most important task we can do to affect the perception of performance. This will include revising a packet of technology related information specifically pertinent to new employees (IT/GIS Branch structure, policies, procurement process, how-to’s, a description for help information that is available on the Intranet) that they should find helpful when beginning employment.
• Continue participation in the statewide IT Governance process to ensure that the Department interests are considered throughout the IT Governance development. This will help ensure that mandates that may negatively impact Department employee work are kept to a minimum, thus helping to improve internal satisfaction.
• Utilize administrative assistants more regularly and where appropriate to assist us with paperwork and documentation.
Data development agenda: In the past, we have based measurement of our progress towards strategic plan objectives solely on the annual employee internal satisfaction survey. While this input still provides valuable information, as serving internal constituents remains a high priority of the IT Branch, it fails to describe how the IT/GIS Branch is satisfying the overall technology requirements of the Department and constituents in order to accomplish the Department’s mission. With additional functions for which this branch is now responsible, we are implementing additional metrics. Examples include measuring server and network up time, employee response time, reaction to help desk/trouble tickets, and employee assistance measures. Performance Measure #2: Percent of employees satisfied with computer equipment (Personnel in this program will work to ensure that at least 70% of employees are satisfied with the computer equipment provided).
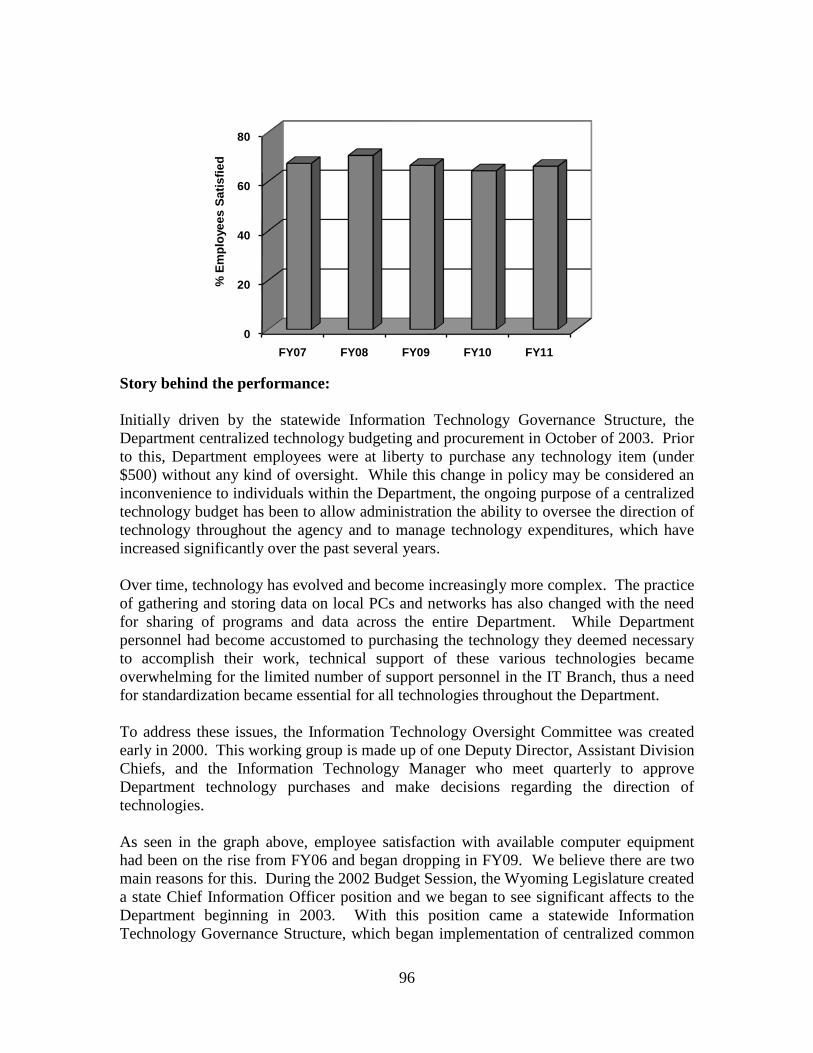
96
Story behind the performance:
Initially driven by the statewide Information Technology Governance Structure, the Department centralized technology budgeting and procurement in October of 2003. Prior to this, Department employees were at liberty to purchase any technology item (under $500) without any kind of oversight. While this change in policy may be considered an inconvenience to individuals within the Department, the ongoing purpose of a centralized technology budget has been to allow administration the ability to oversee the direction of technology throughout the agency and to manage technology expenditures, which have increased significantly over the past several years. Over time, technology has evolved and become increasingly more complex. The practice of gathering and storing data on local PCs and networks has also changed with the need for sharing of programs and data across the entire Department. While Department personnel had become accustomed to purchasing the technology they deemed necessary to accomplish their work, technical support of these various technologies became overwhelming for the limited number of support personnel in the IT Branch, thus a need for standardization became essential for all technologies throughout the Department. To address these issues, the Information Technology Oversight Committee was created early in 2000. This working group is made up of one Deputy Director, Assistant Division Chiefs, and the Information Technology Manager who meet quarterly to approve Department technology purchases and make decisions regarding the direction of technologies. As seen in the graph above, employee satisfaction with available computer equipment had been on the rise from FY06 and began dropping in FY09. We believe there are two main reasons for this. During the 2002 Budget Session, the Wyoming Legislature created a state Chief Information Officer position and we began to see significant affects to the Department beginning in 2003. With this position came a statewide Information Technology Governance Structure, which began implementation of centralized common
0
20
40
60
80
FY07 FY08 FY09 FY10 FY11
% E
mpl
oyee
s Sa
tisfie
d
97
IT services throughout state government including technology procurement. This process has also required a significant amount of effort and time commitment, especially for the Department IT Manager, which in turn has reduced time available to address Department specific IT issues. This, along with agency conformance to the statewide governance structure and accompanying changes in IT policy and technology procurement methods, undoubtedly have had a negative impact on Department employee satisfaction related to computer equipment. Technology continues to grow and with it, many employees are continually looking for technological solutions to better do their jobs. Vendors are also putting more pressure on Department employees to purchase and use the latest technologies to accomplish their work. Department efforts to maintain common technology standards throughout the Department and maintain control of an ever-expanding technology budget undoubtedly have had a significant negative impact when employees were asked if they are satisfied with their current computer equipment. With the advent of e-Commerce or the ability to sell licenses through our Web-based and Internet Point-of-Sale devices, the need to further secure our systems continues to grow. As of this year, we now must comply with Payment Card Industry (PCI) security requirements in addition to our previous efforts to keep the Department in compliance with State of Wyoming IT policy, to improve previous software licensing/installation issues, and to further prevent malicious code propagating throughout our systems. As well, we believe that removing the ability to add and remove software and independently manage their machines continues to negatively impact the overall satisfaction of several Department personnel. We have found that technology procurement greatly influences internal customer satisfaction. Since FY 07, the average percent of employees satisfied with the computer equipment provided was 67.0 percent. In FY11, based on the number of people that responded to the specific question, the level of satisfaction was 66.2 percent, which is up from 64.3 percent last year. Though technology procurement is largely based on budget and standardization and will fluctuate year to year based on evolving technologies, we believe that through persistent evaluation and improvement of our processes for Department employees to get necessary technologies, along with regular communication regarding their needs, employee satisfaction should continue to increase in this area. Mobility, or the ability to accomplish job tasks, use e-mail for communications, and remain in touch with the office while on the road is continuing to become more of a norm for the workforce, not only in the Department but in public and private sectors worldwide. We continued to see a significant demand for this type of technology during the past fiscal year. While the upcoming workforce is becoming increasingly imbedded in these types of technologies, they are expensive to maintain. With a variety of available technologies and associates costs, we have been very conservative in implementing a cost-effective solution, which we believe has contributed to an over decline in employee satisfaction in this area compared to the 5-year average.
98
The IT Manager, along with Services Division administration and IT/GIS Branch personnel has taken a proactive approach to learn of technology needs throughout the Department, as well as to further educate Department personnel on the technology budgeting and procurement process in an effort to adequately address these needs. What we propose to do to improve performance in the next two years: • Help guide agency IT investment priorities by continuing to work with the IT
Oversight Committee on the direction of technologies and accompanying budget. • Continue to communicate with Department employees through individual
discussions, regular attendance at regional team meetings, and various other avenues to keep abreast of employee technology needs, as well as work to help them understand technology procurement methodologies and procedures. Through better communication, we hope to improve overall employee satisfaction related to equipment needed to do their work.
• Continue working with the Department GIS Working Group, which consists of representatives from Services, Fish, and Wildlife Divisions to compile recommendations by which Department administration can address increasing future GIS demands. This group developed an initial plan to begin eliminating fragmentation of GIS work. We have budget approval to purchase servers, software, and licenses to begin implementation of this plan. A vacant position was transferred to the GIS Section in FY09 to implement centralization of geospatial data and to contribute to development of an enterprise GIS program.
• Continue to prioritize the GIS work and work closely with Services Division and Department Administration to find ways to address the increasing demand for GIS technologies.
• Continue to evaluate, purchase, and implement improvements to the Department’s network infrastructure to facilitate better Department internal communication and to provide a means for dynamic interaction between the Department and the general public.
• Continue to evaluate mobile technologies and to work on a solution to provide these types of technologies to the Department in the future.
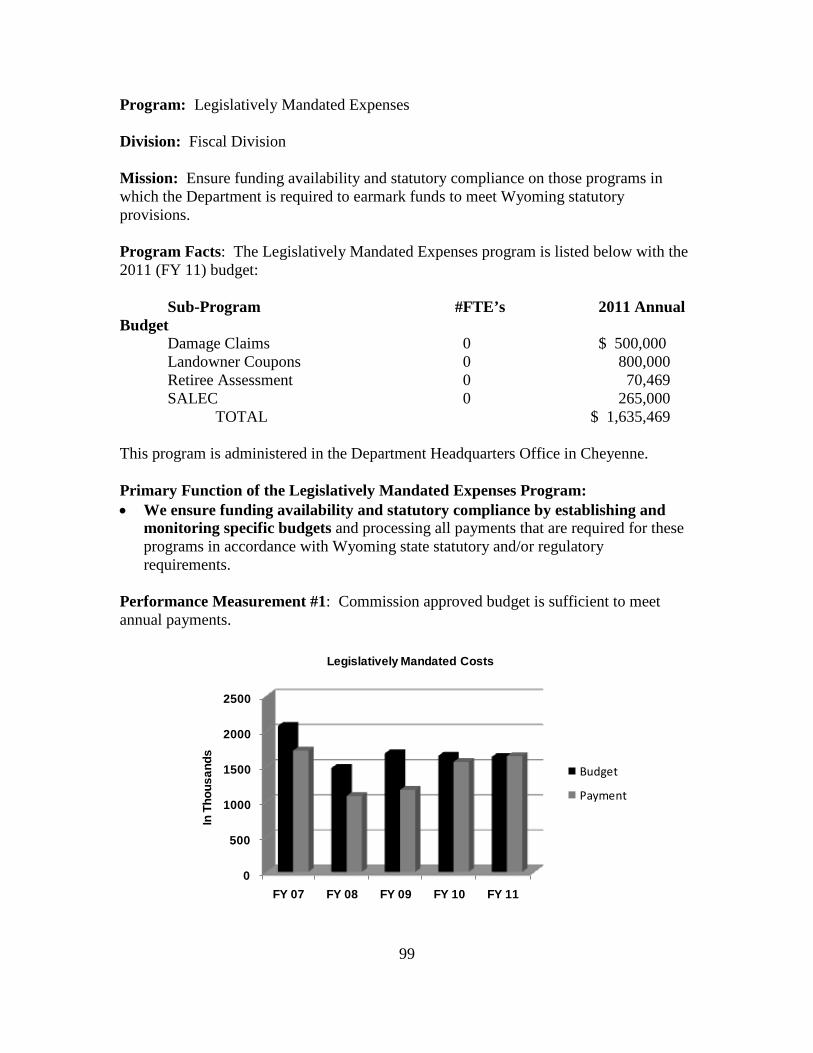
99
Program: Legislatively Mandated Expenses Division: Fiscal Division Mission: Ensure funding availability and statutory compliance on those programs in which the Department is required to earmark funds to meet Wyoming statutory provisions. Program Facts: The Legislatively Mandated Expenses program is listed below with the 2011 (FY 11) budget: Sub-Program #FTE’s 2011 Annual Budget Damage Claims 0 $ 500,000 Landowner Coupons 0 800,000 Retiree Assessment 0 70,469 SALEC 0 265,000 TOTAL $ 1,635,469 This program is administered in the Department Headquarters Office in Cheyenne. Primary Function of the Legislatively Mandated Expenses Program: • We ensure funding availability and statutory compliance by establishing and
monitoring specific budgets and processing all payments that are required for these programs in accordance with Wyoming state statutory and/or regulatory requirements.
Performance Measurement #1: Commission approved budget is sufficient to meet annual payments.
0
500
1000
1500
2000
2500
FY 07 FY 08 FY 09 FY 10 FY 11
In T
hous
ands
Legislatively Mandated Costs
Budget
Payment
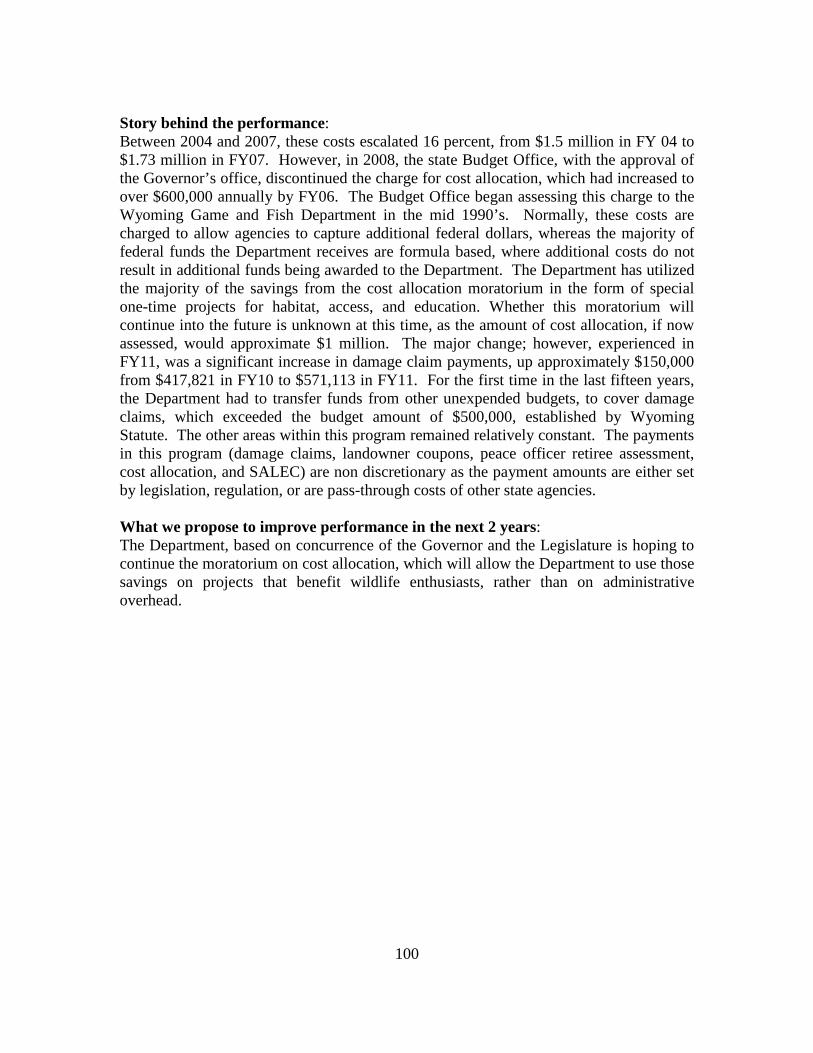
100
Story behind the performance: Between 2004 and 2007, these costs escalated 16 percent, from $1.5 million in FY 04 to $1.73 million in FY07. However, in 2008, the state Budget Office, with the approval of the Governor’s office, discontinued the charge for cost allocation, which had increased to over $600,000 annually by FY06. The Budget Office began assessing this charge to the Wyoming Game and Fish Department in the mid 1990’s. Normally, these costs are charged to allow agencies to capture additional federal dollars, whereas the majority of federal funds the Department receives are formula based, where additional costs do not result in additional funds being awarded to the Department. The Department has utilized the majority of the savings from the cost allocation moratorium in the form of special one-time projects for habitat, access, and education. Whether this moratorium will continue into the future is unknown at this time, as the amount of cost allocation, if now assessed, would approximate $1 million. The major change; however, experienced in FY11, was a significant increase in damage claim payments, up approximately $150,000 from $417,821 in FY10 to $571,113 in FY11. For the first time in the last fifteen years, the Department had to transfer funds from other unexpended budgets, to cover damage claims, which exceeded the budget amount of $500,000, established by Wyoming Statute. The other areas within this program remained relatively constant. The payments in this program (damage claims, landowner coupons, peace officer retiree assessment, cost allocation, and SALEC) are non discretionary as the payment amounts are either set by legislation, regulation, or are pass-through costs of other state agencies. What we propose to improve performance in the next 2 years: The Department, based on concurrence of the Governor and the Legislature is hoping to continue the moratorium on cost allocation, which will allow the Department to use those savings on projects that benefit wildlife enthusiasts, rather than on administrative overhead.
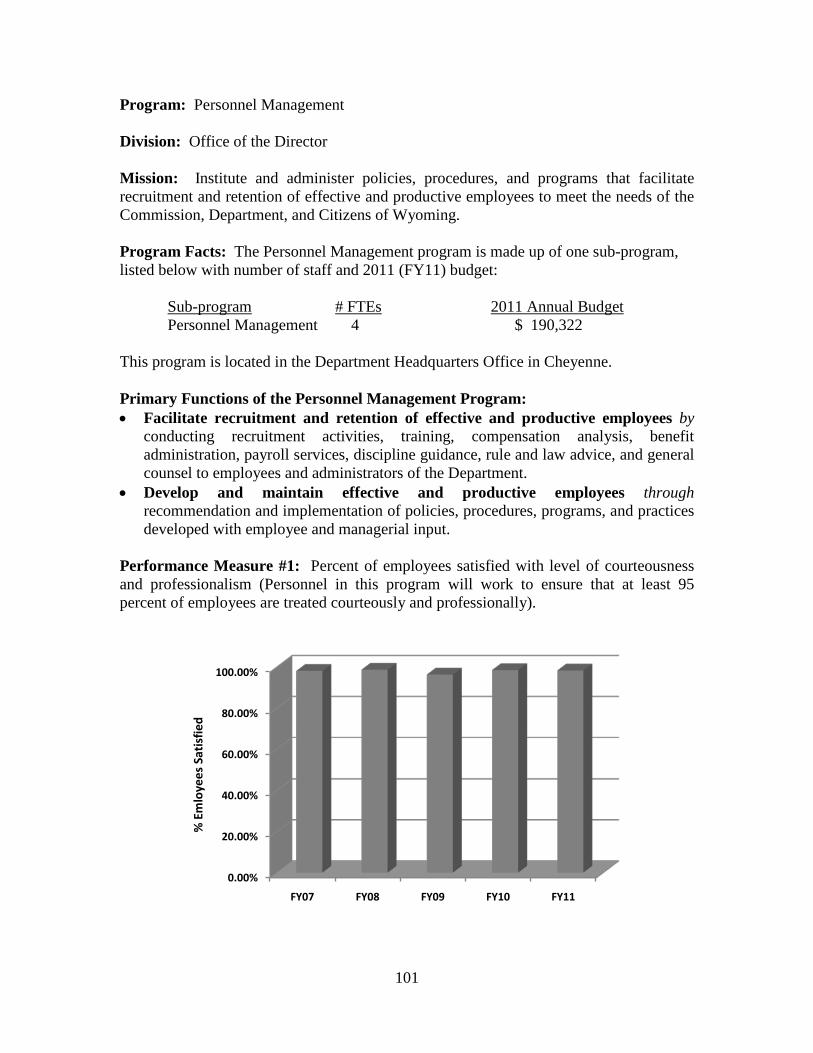
101
Program: Personnel Management Division: Office of the Director Mission: Institute and administer policies, procedures, and programs that facilitate recruitment and retention of effective and productive employees to meet the needs of the Commission, Department, and Citizens of Wyoming. Program Facts: The Personnel Management program is made up of one sub-program, listed below with number of staff and 2011 (FY11) budget: Sub-program # FTEs 2011 Annual Budget
Personnel Management 4 $ 190,322 This program is located in the Department Headquarters Office in Cheyenne. Primary Functions of the Personnel Management Program: • Facilitate recruitment and retention of effective and productive employees by
conducting recruitment activities, training, compensation analysis, benefit administration, payroll services, discipline guidance, rule and law advice, and general counsel to employees and administrators of the Department.
• Develop and maintain effective and productive employees through recommendation and implementation of policies, procedures, programs, and practices developed with employee and managerial input.
Performance Measure #1: Percent of employees satisfied with level of courteousness and professionalism (Personnel in this program will work to ensure that at least 95 percent of employees are treated courteously and professionally).
0.00%
20.00%
40.00%
60.00%
80.00%
100.00%
FY07 FY08 FY09 FY10 FY11
% E
mlo
yees
Sat
isfie
d
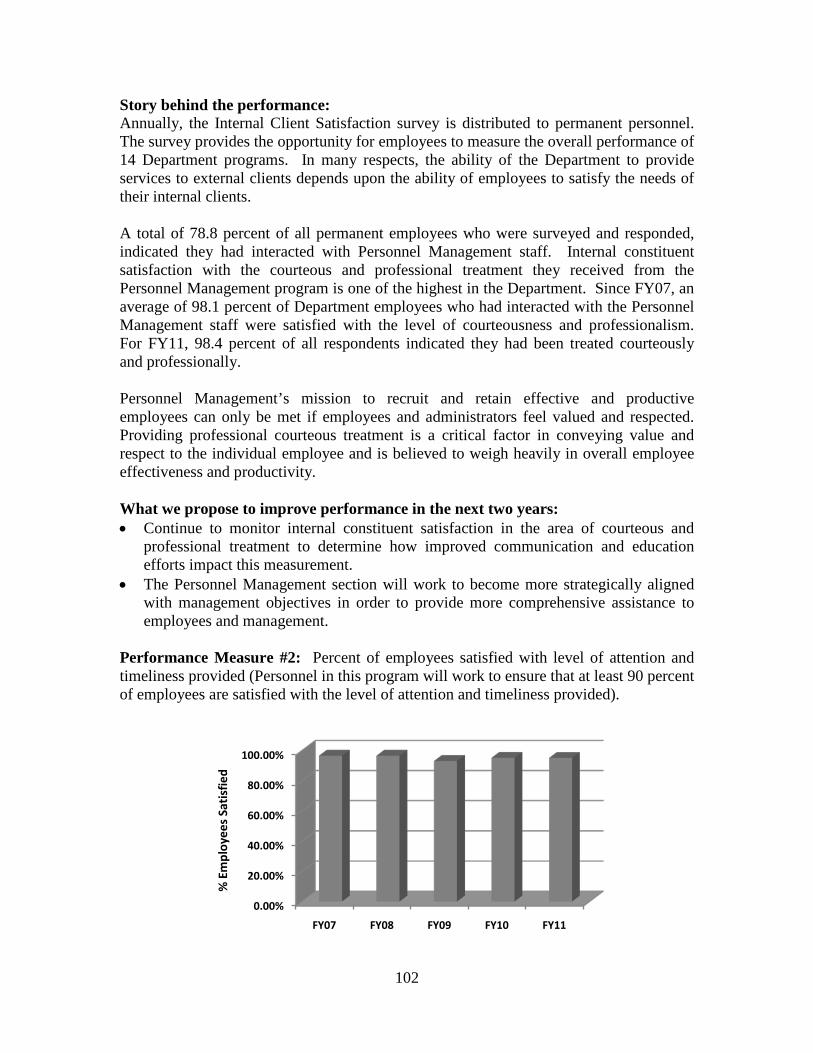
102
Story behind the performance: Annually, the Internal Client Satisfaction survey is distributed to permanent personnel. The survey provides the opportunity for employees to measure the overall performance of 14 Department programs. In many respects, the ability of the Department to provide services to external clients depends upon the ability of employees to satisfy the needs of their internal clients. A total of 78.8 percent of all permanent employees who were surveyed and responded, indicated they had interacted with Personnel Management staff. Internal constituent satisfaction with the courteous and professional treatment they received from the Personnel Management program is one of the highest in the Department. Since FY07, an average of 98.1 percent of Department employees who had interacted with the Personnel Management staff were satisfied with the level of courteousness and professionalism. For FY11, 98.4 percent of all respondents indicated they had been treated courteously and professionally. Personnel Management’s mission to recruit and retain effective and productive employees can only be met if employees and administrators feel valued and respected. Providing professional courteous treatment is a critical factor in conveying value and respect to the individual employee and is believed to weigh heavily in overall employee effectiveness and productivity. What we propose to improve performance in the next two years: • Continue to monitor internal constituent satisfaction in the area of courteous and
professional treatment to determine how improved communication and education efforts impact this measurement.
• The Personnel Management section will work to become more strategically aligned with management objectives in order to provide more comprehensive assistance to employees and management.
Performance Measure #2: Percent of employees satisfied with level of attention and timeliness provided (Personnel in this program will work to ensure that at least 90 percent of employees are satisfied with the level of attention and timeliness provided).
0.00%
20.00%
40.00%
60.00%
80.00%
100.00%
FY07 FY08 FY09 FY10 FY11
% E
mpl
oyee
s Sat
isfie
d
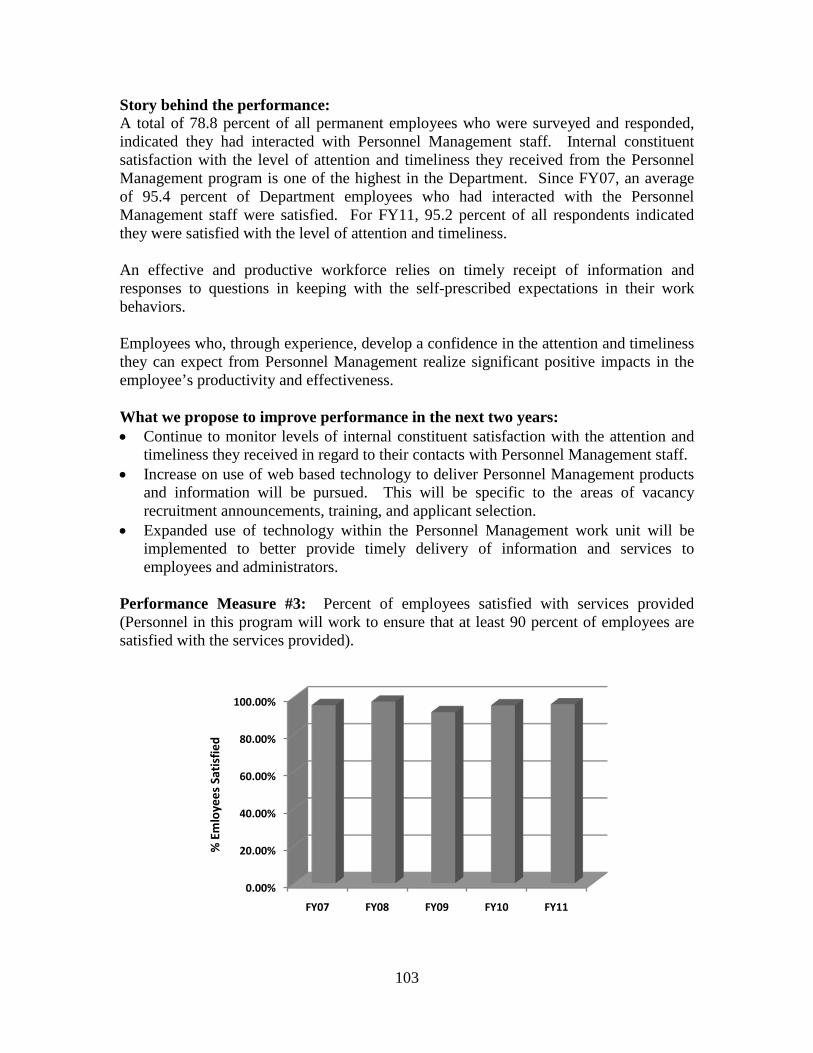
103
Story behind the performance: A total of 78.8 percent of all permanent employees who were surveyed and responded, indicated they had interacted with Personnel Management staff. Internal constituent satisfaction with the level of attention and timeliness they received from the Personnel Management program is one of the highest in the Department. Since FY07, an average of 95.4 percent of Department employees who had interacted with the Personnel Management staff were satisfied. For FY11, 95.2 percent of all respondents indicated they were satisfied with the level of attention and timeliness. An effective and productive workforce relies on timely receipt of information and responses to questions in keeping with the self-prescribed expectations in their work behaviors. Employees who, through experience, develop a confidence in the attention and timeliness they can expect from Personnel Management realize significant positive impacts in the employee’s productivity and effectiveness. What we propose to improve performance in the next two years: • Continue to monitor levels of internal constituent satisfaction with the attention and
timeliness they received in regard to their contacts with Personnel Management staff. • Increase on use of web based technology to deliver Personnel Management products
and information will be pursued. This will be specific to the areas of vacancy recruitment announcements, training, and applicant selection.
• Expanded use of technology within the Personnel Management work unit will be implemented to better provide timely delivery of information and services to employees and administrators.
Performance Measure #3: Percent of employees satisfied with services provided (Personnel in this program will work to ensure that at least 90 percent of employees are satisfied with the services provided).
0.00%
20.00%
40.00%
60.00%
80.00%
100.00%
FY07 FY08 FY09 FY10 FY11
% E
mlo
yees
Sat
isfie
d
104
Story behind the performance: A total of 78.8 percent of all permanent employees who were surveyed and responded indicated they had interacted with Personnel Management staff. Since FY07, an average of 95.5 percent of Department employees who had interacted with the Personnel Management staff were satisfied with the services provided. For FY11, 96.3 percent of all respondents indicated they were satisfied with the services they received from the Personnel Management program. What we propose to improve performance in the next two years: • Continue to monitor levels of internal constituent satisfaction with the services they
receive from the Personnel Management Staff to insure, at a minimum, the current high level of satisfaction with service delivery.
• Improvements in the use of technology for delivery of services will be implemented in the next two years. This includes videoconference training for a number of subjects that are required such as defensive driving, supervisor performance appraisal training, and sexual harassment prevention. Reduced travel time and ease of attendance for employees will be achieved through this improvement.
• The Human Resource Manager will attend various Department employee meetings to obtain direct feedback on service delivered by the Personnel Management work unit.
105
Program: Property Rights (Lands) Management Division: Services/Wildlife Mission: To administer and monitor currently owned Wyoming Game and Fish Commission property rights. To acquire property rights to restore and conserve habitat to enhance and sustain wildlife populations now and in the future. To acquire property rights, provide public access and public recreation, such as hunting and fishing access on private and landlocked public land. Program Facts: The Property Rights Management program is made up of two major sub-programs, listed below with number of staff and 2011 (FY11) budgets: Sub-programs #FTEs* 2011 Annual Budget
Property Rights (Lands) Admin. ** 2.0 $ 1,040,930 PLPW Access Sub-Program 7.6 1,500,658 ***
TOTAL 10.6 $ 2,350,088 * Includes permanent, contract, and temporary positions. ** Includes Property Rights Administration and Strategic Habitat Plan. *** Includes personnel, operations, and easement payments. Property Rights Administration sub-program is located in Services Division and is based out of the Department Headquarters in Cheyenne. The Private Lands Public Wildlife (PLPW) Access sub-program is located in the Wildlife Division and is based out of the Casper Regional Office. Primary Functions of the Property Rights Management Program: • Administer Commission property rights by providing support and technical
expertise to Staff and Commission members on all real property rights management issues as well as addressing requests for assistance and information. By providing assurance that all real property rights issues follow state and federal laws, rules, guidelines, and policies.
• Monitor Commission property rights by annual physical inspections to evaluate possible encroachments and provide recommendations for Commission action.
• Acquire property rights to restore and conserve habitat by assisting in the implementation of the Strategic Habitat Plan to identify wildlife habitats where habitat quality should be preserved through fee title acquisitions, conservation easements, leases, and agreements, by acquiring public access and public recreations rights, and by seeking funding partners.
• Acquire property rights which provide public access and public recreation by maintaining and enhancing public hunting and fishing access on private and public lands through Hunter Management and Walk-in Areas.
Performance Measure #1: Percent of employees satisfied with Property Rights (Lands) Management personnel’s attention, timeliness, and service on Department assignments
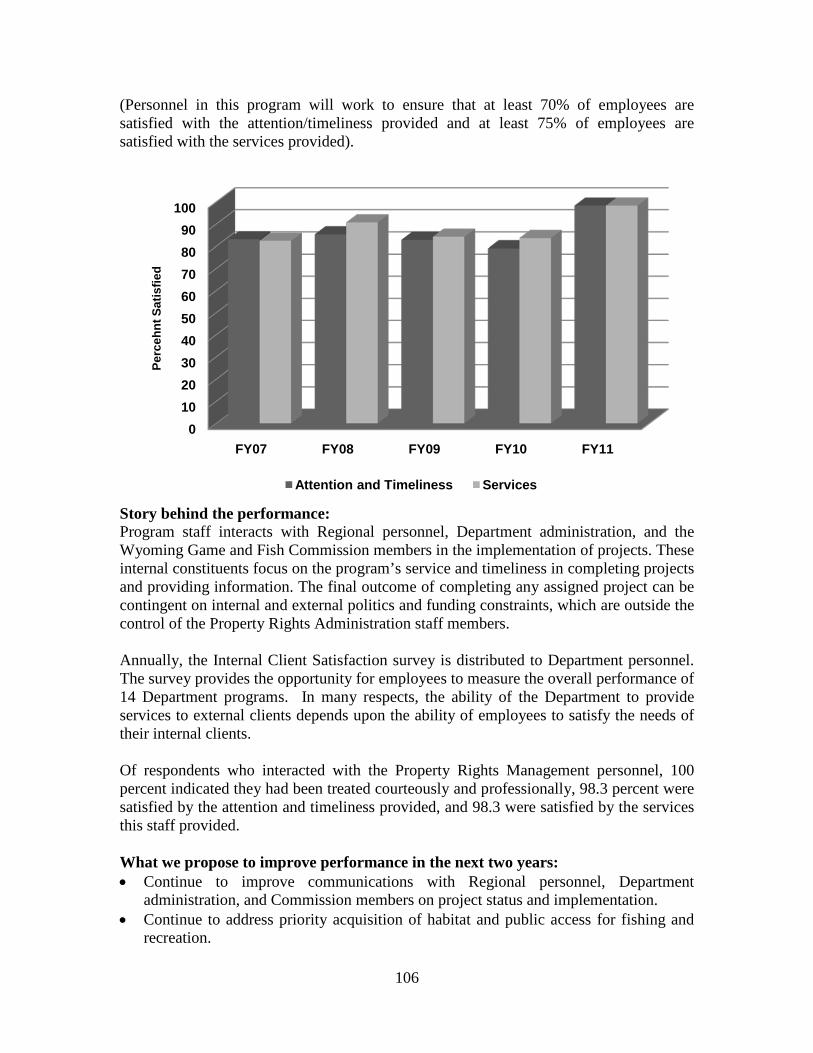
106
(Personnel in this program will work to ensure that at least 70% of employees are satisfied with the attention/timeliness provided and at least 75% of employees are satisfied with the services provided).
Story behind the performance: Program staff interacts with Regional personnel, Department administration, and the Wyoming Game and Fish Commission members in the implementation of projects. These internal constituents focus on the program’s service and timeliness in completing projects and providing information. The final outcome of completing any assigned project can be contingent on internal and external politics and funding constraints, which are outside the control of the Property Rights Administration staff members. Annually, the Internal Client Satisfaction survey is distributed to Department personnel. The survey provides the opportunity for employees to measure the overall performance of 14 Department programs. In many respects, the ability of the Department to provide services to external clients depends upon the ability of employees to satisfy the needs of their internal clients. Of respondents who interacted with the Property Rights Management personnel, 100 percent indicated they had been treated courteously and professionally, 98.3 percent were satisfied by the attention and timeliness provided, and 98.3 were satisfied by the services this staff provided. What we propose to improve performance in the next two years: • Continue to improve communications with Regional personnel, Department
administration, and Commission members on project status and implementation. • Continue to address priority acquisition of habitat and public access for fishing and
recreation.
0102030405060708090
100
FY07 FY08 FY09 FY10 FY11
Perc
ehnt
Sat
isfie
d
Attention and Timeliness Services
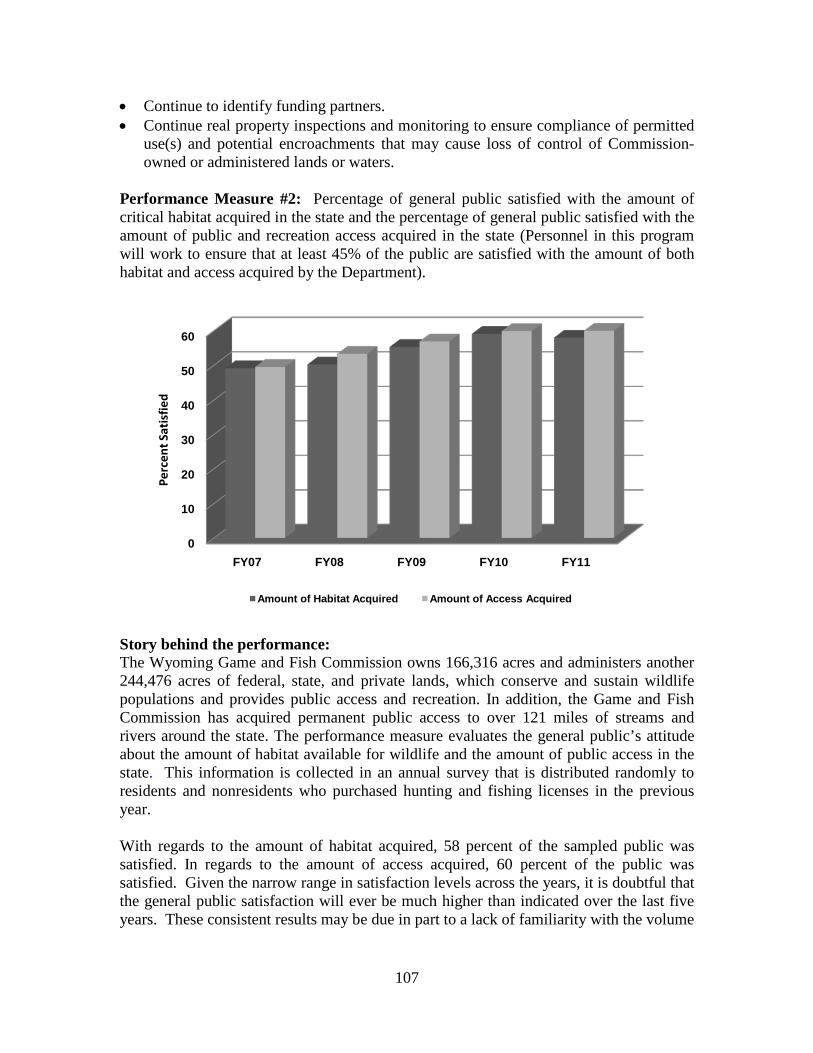
107
• Continue to identify funding partners. • Continue real property inspections and monitoring to ensure compliance of permitted
use(s) and potential encroachments that may cause loss of control of Commission-owned or administered lands or waters.
Performance Measure #2: Percentage of general public satisfied with the amount of critical habitat acquired in the state and the percentage of general public satisfied with the amount of public and recreation access acquired in the state (Personnel in this program will work to ensure that at least 45% of the public are satisfied with the amount of both habitat and access acquired by the Department).
Story behind the performance: The Wyoming Game and Fish Commission owns 166,316 acres and administers another 244,476 acres of federal, state, and private lands, which conserve and sustain wildlife populations and provides public access and recreation. In addition, the Game and Fish Commission has acquired permanent public access to over 121 miles of streams and rivers around the state. The performance measure evaluates the general public’s attitude about the amount of habitat available for wildlife and the amount of public access in the state. This information is collected in an annual survey that is distributed randomly to residents and nonresidents who purchased hunting and fishing licenses in the previous year. With regards to the amount of habitat acquired, 58 percent of the sampled public was satisfied. In regards to the amount of access acquired, 60 percent of the public was satisfied. Given the narrow range in satisfaction levels across the years, it is doubtful that the general public satisfaction will ever be much higher than indicated over the last five years. These consistent results may be due in part to a lack of familiarity with the volume
0
10
20
30
40
50
60
FY07 FY08 FY09 FY10 FY11
Perc
ent S
atis
fied
Amount of Habitat Acquired Amount of Access Acquired
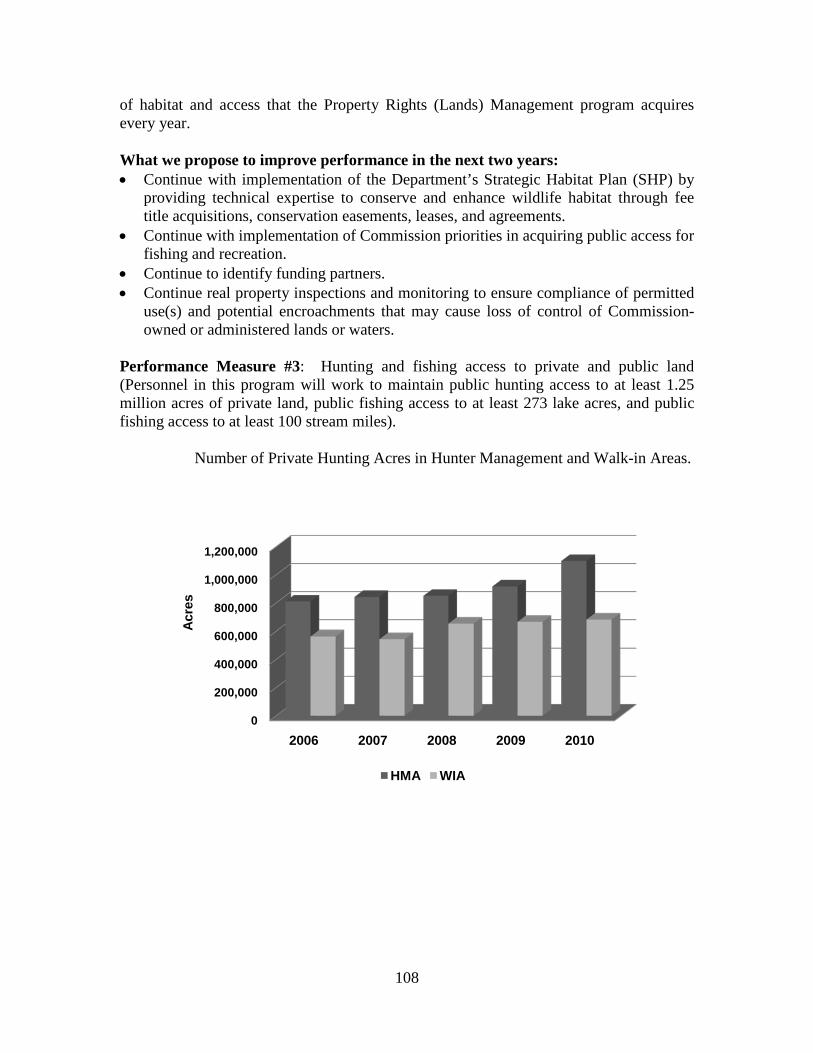
108
of habitat and access that the Property Rights (Lands) Management program acquires every year. What we propose to improve performance in the next two years: • Continue with implementation of the Department’s Strategic Habitat Plan (SHP) by
providing technical expertise to conserve and enhance wildlife habitat through fee title acquisitions, conservation easements, leases, and agreements.
• Continue with implementation of Commission priorities in acquiring public access for fishing and recreation.
• Continue to identify funding partners. • Continue real property inspections and monitoring to ensure compliance of permitted
use(s) and potential encroachments that may cause loss of control of Commission-owned or administered lands or waters.
Performance Measure #3: Hunting and fishing access to private and public land (Personnel in this program will work to maintain public hunting access to at least 1.25 million acres of private land, public fishing access to at least 273 lake acres, and public fishing access to at least 100 stream miles).
Number of Private Hunting Acres in Hunter Management and Walk-in Areas.
0
200,000
400,000
600,000
800,000
1,000,000
1,200,000
2006 2007 2008 2009 2010
HMA WIA
Acre
s
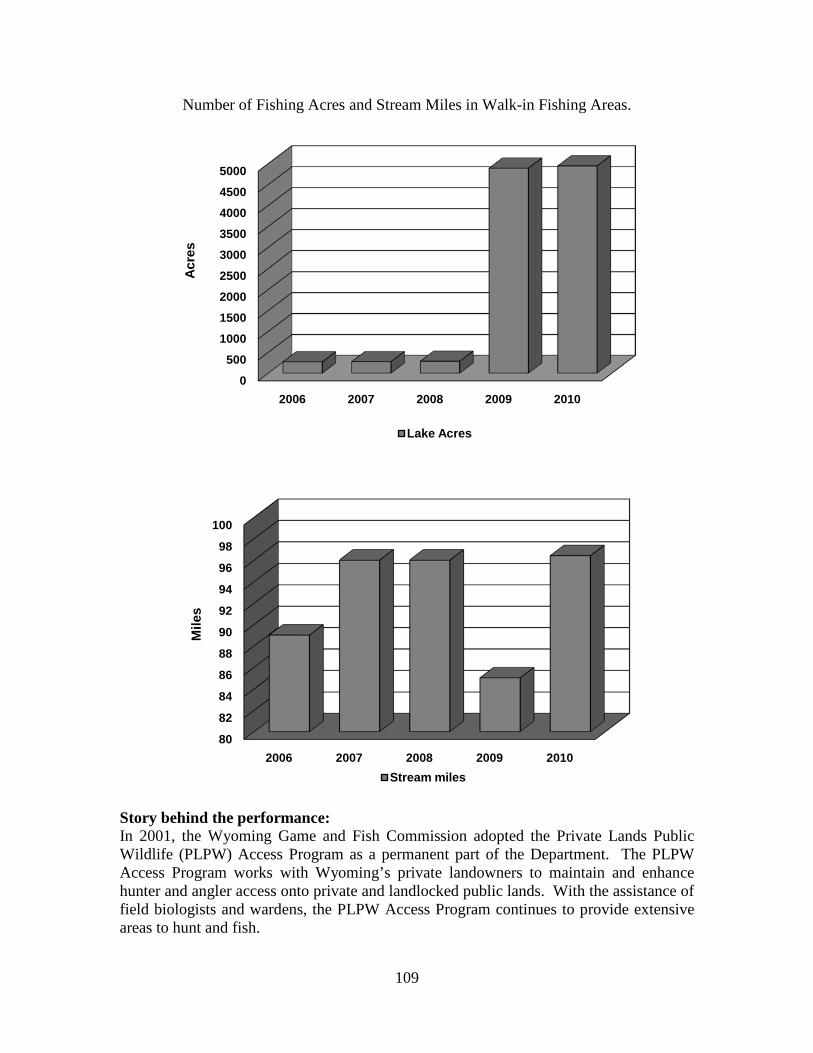
109
Number of Fishing Acres and Stream Miles in Walk-in Fishing Areas.
Story behind the performance: In 2001, the Wyoming Game and Fish Commission adopted the Private Lands Public Wildlife (PLPW) Access Program as a permanent part of the Department. The PLPW Access Program works with Wyoming’s private landowners to maintain and enhance hunter and angler access onto private and landlocked public lands. With the assistance of field biologists and wardens, the PLPW Access Program continues to provide extensive areas to hunt and fish.
0
500
1000
1500
2000
2500
3000
3500
4000
4500
5000
2006 2007 2008 2009 2010
Lake Acres
Acre
s
80
82
84
86
88
90
92
94
96
98
100
2006 2007 2008 2009 2010Stream miles
Mile
s
110
In addition to providing recreational access, the PLPW Access Program assists with increasing cooperation between the Department, landowners, and the public; population management of wildlife; and decreasing agriculture damage through harvest. What has been accomplished: The enrollment in each program for 2010 were: Hunter Management, 1,099,125 acres; Walk-in Hunting, 681,683 acres; Walk-in Fishing lake acres, 4,944 acres; and Walk-in Fishing stream miles, 96.4 miles. The average enrollment in each program for 2006-2010 is: Hunter Management, 904,166 acres; Walk-in Hunting, 621,607 acres; Walk-in Fishing lake acres, 2,134 acres; and Walk-in Fishing stream miles, 92 miles. Enrollment in either a Walk-in or Hunter Management Areas is dependent upon the amount of available Access Yes funds. During 2010, easement payments almost reached the Access Yes donations collected by the Department. The number of acres and stream miles should remain fairly constant, as long as, Access Yes funding levels are maintained. Combined with public lands that were associated with the enrolled private lands, the PLPW Access Program provided approximately 3.47 million acres of hunting access for the fall 2010/spring 2011 hunting seasons. Fishing opportunities are continually sought out for increased opportunity. Based upon comprehensive surveys for 2010, 88.9 percent of all landowners were satisfied with being enrolled in the PLPW Access Program. Additionally, 57.8 percent of all landowners indicated that their relationship with the Department has increased (41.1 percent remained the same) by being enrolled in the PLPW Access Program. What we propose to improve performance in the next two years: • PLPW staff will continue to encourage Access Yes donations from hunters and
anglers by working with License Selling Agents and an advertising program. • PLPW staff will continue to foster cooperative relationships with Department
employees for increased assistance with the program. • PLPW will continue to evaluate new funding sources based upon the LD1
recommendations. • PLPW will continue to pursue two additional regional PLPW access coordinators to
alleviate the workload on current employees and improve the quantity of services offered to Department personnel, landowners, and the general public.
Performance Measure # 4: Percent of Big Game Hunters Satisfied with the hunting opportunity provided by the PLPW Walk-In Area and Hunter Management Area programs. (Personnel in this program will work to ensure that at least 75 percent of big game hunters are satisfied with the hunting opportunities provided by the PLPW programs).
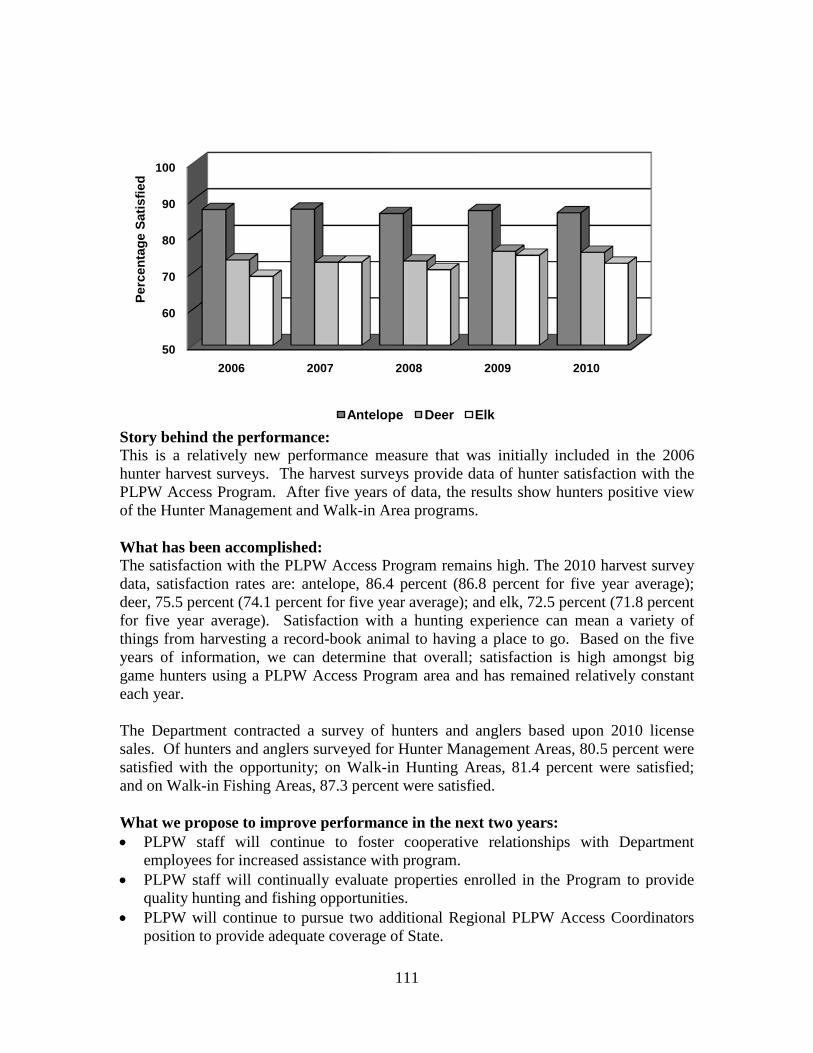
111
Story behind the performance: This is a relatively new performance measure that was initially included in the 2006 hunter harvest surveys. The harvest surveys provide data of hunter satisfaction with the PLPW Access Program. After five years of data, the results show hunters positive view of the Hunter Management and Walk-in Area programs. What has been accomplished: The satisfaction with the PLPW Access Program remains high. The 2010 harvest survey data, satisfaction rates are: antelope, 86.4 percent (86.8 percent for five year average); deer, 75.5 percent (74.1 percent for five year average); and elk, 72.5 percent (71.8 percent for five year average). Satisfaction with a hunting experience can mean a variety of things from harvesting a record-book animal to having a place to go. Based on the five years of information, we can determine that overall; satisfaction is high amongst big game hunters using a PLPW Access Program area and has remained relatively constant each year. The Department contracted a survey of hunters and anglers based upon 2010 license sales. Of hunters and anglers surveyed for Hunter Management Areas, 80.5 percent were satisfied with the opportunity; on Walk-in Hunting Areas, 81.4 percent were satisfied; and on Walk-in Fishing Areas, 87.3 percent were satisfied. What we propose to improve performance in the next two years: • PLPW staff will continue to foster cooperative relationships with Department
employees for increased assistance with program. • PLPW staff will continually evaluate properties enrolled in the Program to provide
quality hunting and fishing opportunities. • PLPW will continue to pursue two additional Regional PLPW Access Coordinators
position to provide adequate coverage of State.
50
60
70
80
90
100
2006 2007 2008 2009 2010
Antelope Deer Elk
Perc
enta
ge S
atis
fied
112
Program: Regional Information and Education Specialist Division: Services Mission: Work cooperatively with Department personnel to increase understanding and appreciation of Wyoming’s wildlife resources and the habitats upon which they depend. Provide media outreach and wildlife conservation education programs for students, teachers, and other citizens of Wyoming. Program Facts: The Regional Information and Education Specialist program consists of a single sub-program, listed below with staff numbers and 2011 (FY11) budget:
Sub-program # FTEs* 2011 Annual Budget
Regional Information & Education 5.0 $ 650,772
* Includes permanent positions authorized in FY11 budget. Any positions added during the budget cycle require Wyoming Game and Fish Commission authorization or must be funded from supplemental grants. This program is located statewide. One Regional Information and Education Specialist (RIES) is assigned to five of the eight Department regional offices. The Jackson position is assigned to both the Jackson and Pinedale regional offices. In September 2009, the Casper RIES position was assigned to assist in the production of Wyoming Wildlife News (WWN). This assignment occurred when the WWN editor resigned. The time period for which the Casper RIES position will continue as Casper RIES/WWN editor is undetermined. The Lander RIES position was eliminated following the 2010-2011 legislative session. The Laramie RIES supervisor/specialist was vacated in May 2010 and remained vacant for the remainder of fiscal year FY10. The duties of the Laramie RIES position were added to the current duties of a member of the Information Section. The RIES work unit was reorganized in August 2010 and melded into the Information Section. The duties of the work unit were changed to address the needs of the Lander region. The region was divided among four regional information and education specialists and additional duties were assigned to each. The assignments are as follows: the Jackson specialist—northwest Lander, Green River specialist—south Lander and the Cody specialist—north Lander. The Sheridan specialist was assigned the northern portion of the Casper Region and web page responsibilities for the Laramie and Lander regions. Primary Functions of the Regional Information and Education Specialist Program: • Work cooperatively with Department personnel to increase understanding and
appreciation of Wyoming’s wildlife resources by providing information and education support to other branches within the Services Division and other divisions
113
within the Department. The RIES program supports the Department’s Information program by contributing to the E-newsletter, Wyoming Wildlife News, Wyoming Wildlife Magazine, and the weekly Department news release packet. Each RIES also maintains a regional web page. The RIES program assists the Conservation Education program through the instruction of traditional hunter education courses, internet field days and the Hunter Education New Instructor Academy. It also assists with Becoming an Outdoors Woman, WILD About OREO (Outdoor Recreation Education Opportunities) educator and youth conservation camps, youth fishing and hunting days, the annual Hunting and Fishing Heritage Exposition (EXPO), 4-H Shooting Sports state shoot, and Wyoming's Wildlife Worth the Watching interpretive projects.
• Provide regional and statewide media outreach by developing and distributing news releases, conducting media tours designed to provide the media and public with detailed information on important issues facing wildlife, conducting radio programs, conducting radio and television interviews, and television and streaming video public service announcements.
• Provide regional wildlife conservation education programs through presentations and hands-on workshops to students, civic groups, conservation groups, and others.
Clearly, the personnel actions stated above have affected the overall performance of the RIES work unit, and the services provided. Major Accomplishments for FY11: 1) Incorporated information and education outreach priorities from staff and the regions
into regional I&E work plans and successfully addressed these priorities throughout the year.
2) Adapted to the temporary vacancy of two RIES positions and the Wyoming Wildlife News editor by accepting additional responsibility in the Lander and Laramie regions and headquarters office.
3) Continued the process for drafting criteria to differentiate between exceeds, meets, and needs improvement ratings for the nine appraisal standards, consistent with the Department as well as Services and RIES missions and strategic plans.
4) Maintained and updated for the third year, a grizzly bear management web page. The page is updated each Monday with information provided by the Large Predator Management Section, Human-Bear Conflict Management Section, and the RIES work unit.
5) Assisted the Conservation Education program with Wyoming Hunting and Fishing Heritage EXPO, Hunter Education, New Hunter Education Instructor Workshop, Hunter Education New Instructor Academy, Project WILD, WILD About OREO youth and educator camps, National Archery in the Schools Program, 4-H Shooting Sports State Shoot and aquatic education programs throughout the state.
6) Assisted both Wildlife and Fish Division personnel with community education projects. RIES personnel worked with Wildlife Division statewide bear management personnel to organize and publicize Living in Bear, Lion and Wolf Country seminars. Eleven seminars were attended by over 291 people in nine Wyoming communities around the state.
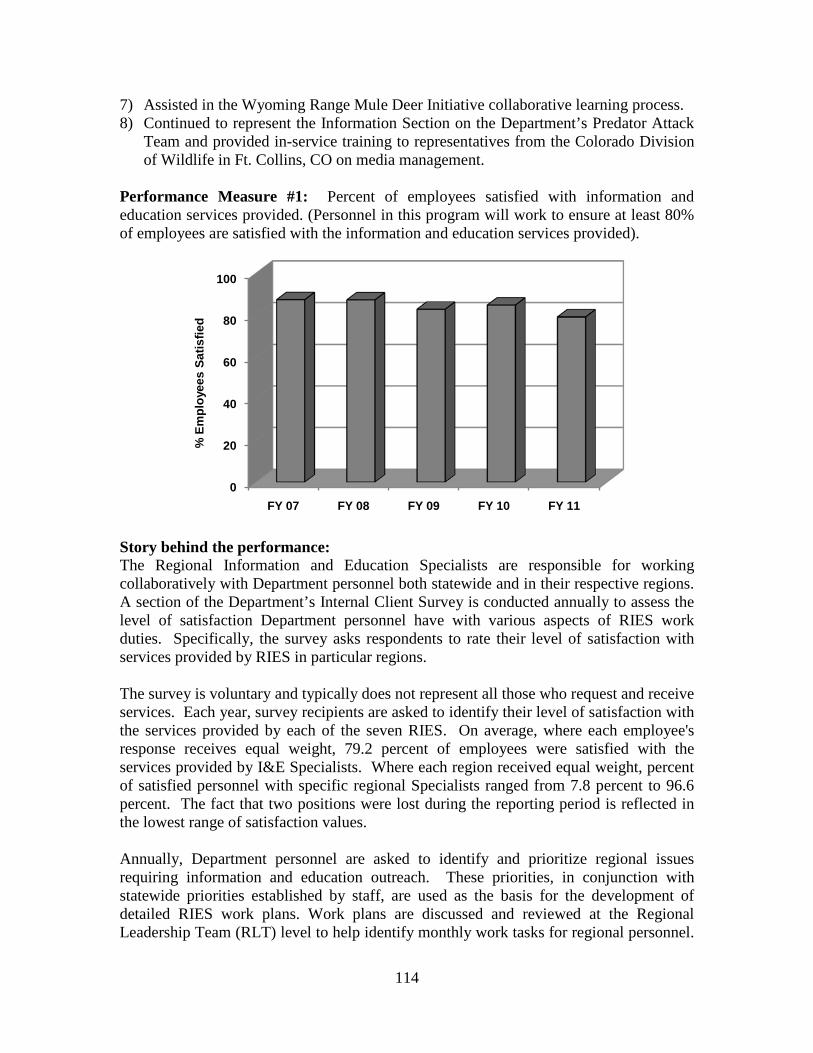
114
7) Assisted in the Wyoming Range Mule Deer Initiative collaborative learning process. 8) Continued to represent the Information Section on the Department’s Predator Attack
Team and provided in-service training to representatives from the Colorado Division of Wildlife in Ft. Collins, CO on media management.
Performance Measure #1: Percent of employees satisfied with information and education services provided. (Personnel in this program will work to ensure at least 80% of employees are satisfied with the information and education services provided).
Story behind the performance: The Regional Information and Education Specialists are responsible for working collaboratively with Department personnel both statewide and in their respective regions. A section of the Department’s Internal Client Survey is conducted annually to assess the level of satisfaction Department personnel have with various aspects of RIES work duties. Specifically, the survey asks respondents to rate their level of satisfaction with services provided by RIES in particular regions. The survey is voluntary and typically does not represent all those who request and receive services. Each year, survey recipients are asked to identify their level of satisfaction with the services provided by each of the seven RIES. On average, where each employee's response receives equal weight, 79.2 percent of employees were satisfied with the services provided by I&E Specialists. Where each region received equal weight, percent of satisfied personnel with specific regional Specialists ranged from 7.8 percent to 96.6 percent. The fact that two positions were lost during the reporting period is reflected in the lowest range of satisfaction values. Annually, Department personnel are asked to identify and prioritize regional issues requiring information and education outreach. These priorities, in conjunction with statewide priorities established by staff, are used as the basis for the development of detailed RIES work plans. Work plans are discussed and reviewed at the Regional Leadership Team (RLT) level to help identify monthly work tasks for regional personnel.
0
20
40
60
80
100
FY 07 FY 08 FY 09 FY 10 FY 11
% E
mpl
oyee
s Sa
tisfie
d
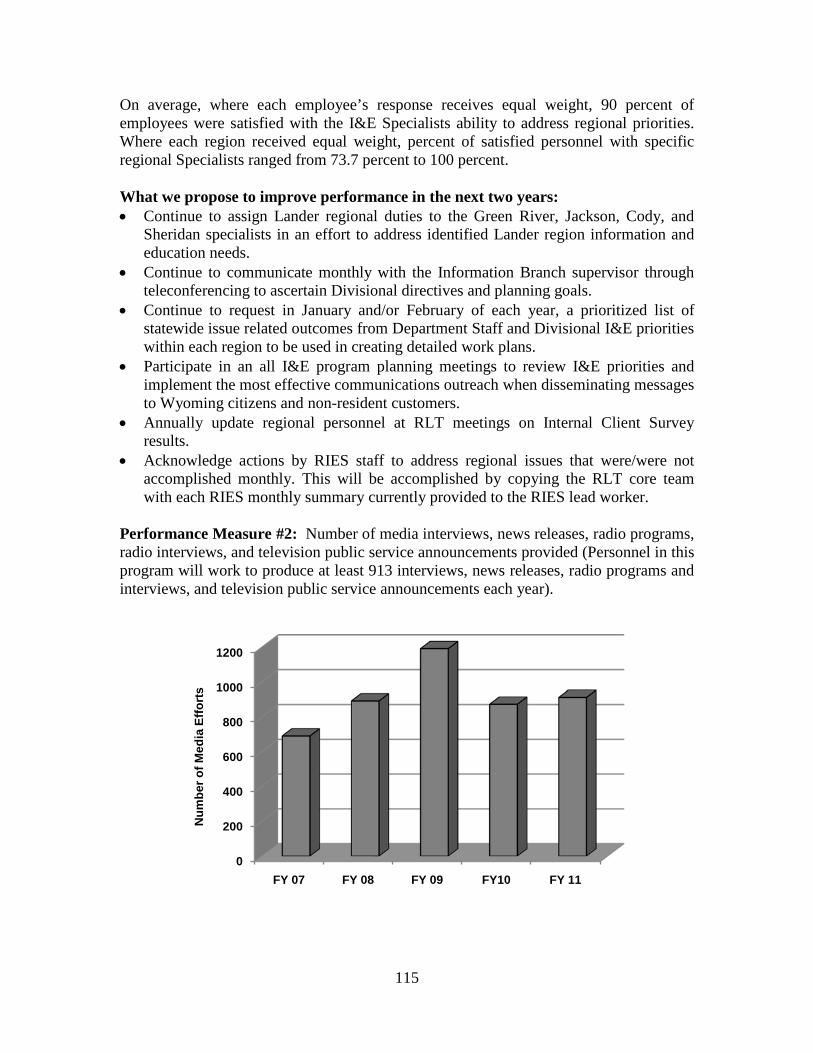
115
On average, where each employee’s response receives equal weight, 90 percent of employees were satisfied with the I&E Specialists ability to address regional priorities. Where each region received equal weight, percent of satisfied personnel with specific regional Specialists ranged from 73.7 percent to 100 percent. What we propose to improve performance in the next two years: • Continue to assign Lander regional duties to the Green River, Jackson, Cody, and
Sheridan specialists in an effort to address identified Lander region information and education needs.
• Continue to communicate monthly with the Information Branch supervisor through teleconferencing to ascertain Divisional directives and planning goals.
• Continue to request in January and/or February of each year, a prioritized list of statewide issue related outcomes from Department Staff and Divisional I&E priorities within each region to be used in creating detailed work plans.
• Participate in an all I&E program planning meetings to review I&E priorities and implement the most effective communications outreach when disseminating messages to Wyoming citizens and non-resident customers.
• Annually update regional personnel at RLT meetings on Internal Client Survey results.
• Acknowledge actions by RIES staff to address regional issues that were/were not accomplished monthly. This will be accomplished by copying the RLT core team with each RIES monthly summary currently provided to the RIES lead worker.
Performance Measure #2: Number of media interviews, news releases, radio programs, radio interviews, and television public service announcements provided (Personnel in this program will work to produce at least 913 interviews, news releases, radio programs and interviews, and television public service announcements each year).
0
200
400
600
800
1000
1200
FY 07 FY 08 FY 09 FY10 FY 11
Num
ber o
f Med
ia E
ffort
s
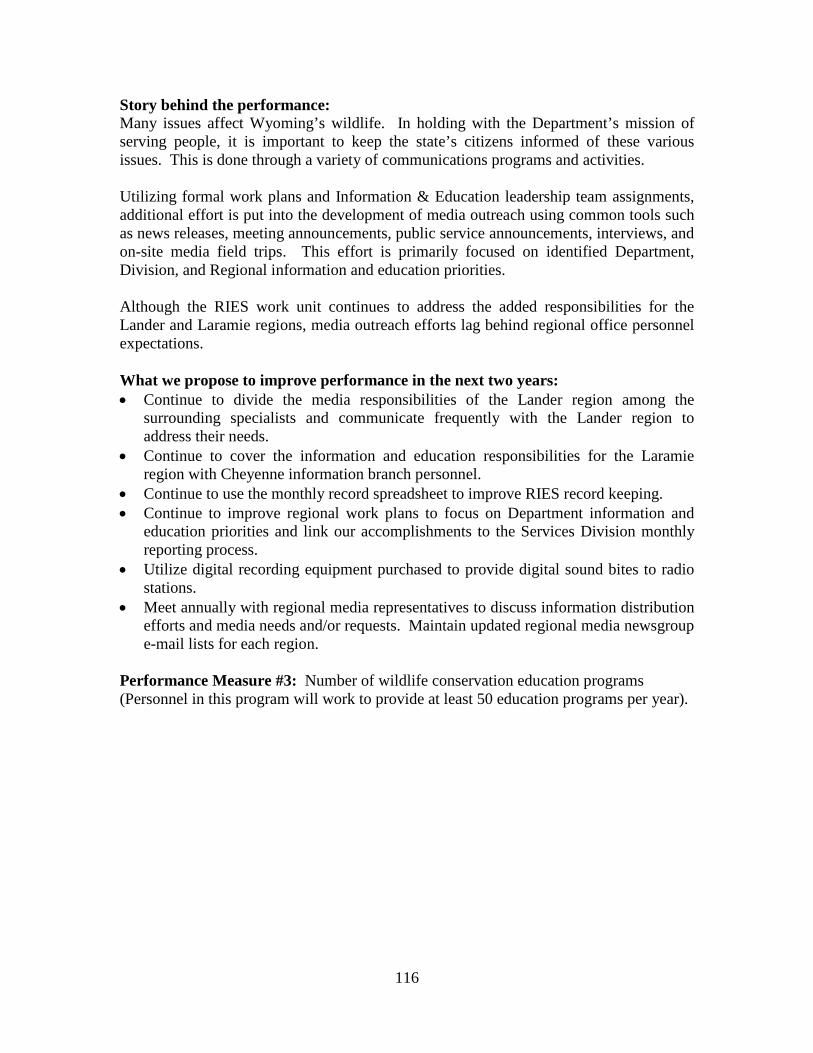
116
Story behind the performance: Many issues affect Wyoming’s wildlife. In holding with the Department’s mission of serving people, it is important to keep the state’s citizens informed of these various issues. This is done through a variety of communications programs and activities. Utilizing formal work plans and Information & Education leadership team assignments, additional effort is put into the development of media outreach using common tools such as news releases, meeting announcements, public service announcements, interviews, and on-site media field trips. This effort is primarily focused on identified Department, Division, and Regional information and education priorities. Although the RIES work unit continues to address the added responsibilities for the Lander and Laramie regions, media outreach efforts lag behind regional office personnel expectations. What we propose to improve performance in the next two years: • Continue to divide the media responsibilities of the Lander region among the
surrounding specialists and communicate frequently with the Lander region to address their needs.
• Continue to cover the information and education responsibilities for the Laramie region with Cheyenne information branch personnel.
• Continue to use the monthly record spreadsheet to improve RIES record keeping. • Continue to improve regional work plans to focus on Department information and
education priorities and link our accomplishments to the Services Division monthly reporting process.
• Utilize digital recording equipment purchased to provide digital sound bites to radio stations.
• Meet annually with regional media representatives to discuss information distribution efforts and media needs and/or requests. Maintain updated regional media newsgroup e-mail lists for each region.
Performance Measure #3: Number of wildlife conservation education programs (Personnel in this program will work to provide at least 50 education programs per year).
117
Story behind the performance: The Regional Information and Education Specialists work collaboratively with Education Branch personnel to provide conservation education programs to the public. Those programs include traditional Hunter Education courses and Internet field days; New Hunter Instructor Academy; National Archery in the Schools Program; Aquatic Education, Becoming An Outdoors Woman Workshop; WILD About OREO Educator and Youth camps; Project WILD workshops; Staying Safe in Bear; Lion, and Wolf Country seminars; Wyoming Hunting and Fishing Heritage EXPO, Youth Fishing Clinics; and 4-H Outdoor Skills Competition. The regional information and education specialists provide outdoor skills training, field trips, tours of Department education centers, and conservation education programs to primary and secondary schools and colleges, civic clubs, and conservation groups within their respective regions. What we propose to improve performance in the next two years: • Each region will continue to use a monthly record spreadsheet to improve RIES
record keeping. • Meet with the Conservation Education Branch personnel each winter/spring to plan
outreach efforts and to coordinate work schedules. • Balance work unit information outreach and conservation education outreach in
annual RIES work plans. • Actively seek opportunities to provide educational outreach specific to identified
Department and Regional information and education priorities.
050
100150200250300350400450500
FY 07 FY 08 FY 09 FY 10 FY 11
Con
serv
atio
n Pr
ogra
ms
118
Program: Regional Terrestrial Wildlife Management Division: Wildlife Mission Statement: Coordinate management of terrestrial wildlife and enforce laws and regulations to ensure the long-term health and viability of terrestrial wildlife for the people of Wyoming, while providing recreational opportunities and minimizing conflicts. Program Facts: The Regional Terrestrial Wildlife Management program is made up of three major sub-programs, listed below with the number of staff and 2011 (FY11) budget. Sub-programs # FTEs* 2011 Annual Budget Regional Terrestrial Wildlife Administration 11.8 $ 1,909,725** Regional Terrestrial Wildlife Biologists 27 3,309,701 Regional Game Wardens 54 6,713,584 TOTAL 92.8 $ 11,933,010 * Includes permanent positions authorized in the FY11 budget. Any positions added during the budget cycle require Wyoming Game and Fish Commission authorization or must be funded from supplemental grants. ** Does not include federal cost share dollars (50 percent) that support eight game warden positions. The sub-programs that comprise the Regional Terrestrial Wildlife Management program were previously part of the Terrestrial Wildlife Management program (Strategic Plan FY04-FY07, November 2003). The Regional Terrestrial Wildlife Management program is located statewide. Primary Functions of the Regional Terrestrial Wildlife Management Program: • Coordinate management of terrestrial wildlife to collect and analyze data; to ensure big
game management strategies are designed to achieve population objectives; to review projects with potential to impact wildlife and their habitats; to coordinate with other state and federal agencies; and to educate, inform, and seek public input on wildlife management issues. Support, training, and leadership are provided to ensure regional objectives and goals are met.
• Enforce laws and regulations to ensure viable wildlife populations and public safety; to inform and educate the public about wildlife laws, regulations, and their necessity; and to address wildlife damage and wildlife/human conflict complaints. Support, training, and leadership are provided to ensure the efficient enforcement of state laws and regulations, and to address wildlife damage and wildlife/human conflict complaints.
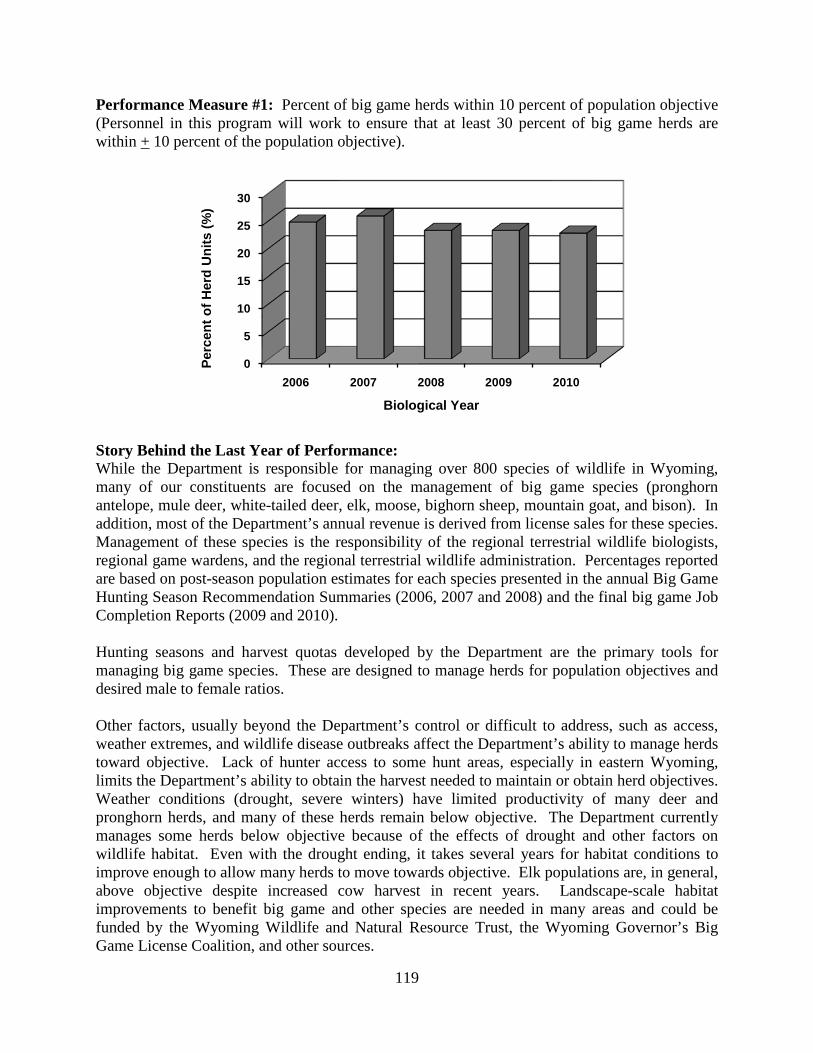
119
Performance Measure #1: Percent of big game herds within 10 percent of population objective (Personnel in this program will work to ensure that at least 30 percent of big game herds are within + 10 percent of the population objective).
Story Behind the Last Year of Performance: While the Department is responsible for managing over 800 species of wildlife in Wyoming, many of our constituents are focused on the management of big game species (pronghorn antelope, mule deer, white-tailed deer, elk, moose, bighorn sheep, mountain goat, and bison). In addition, most of the Department’s annual revenue is derived from license sales for these species. Management of these species is the responsibility of the regional terrestrial wildlife biologists, regional game wardens, and the regional terrestrial wildlife administration. Percentages reported are based on post-season population estimates for each species presented in the annual Big Game Hunting Season Recommendation Summaries (2006, 2007 and 2008) and the final big game Job Completion Reports (2009 and 2010). Hunting seasons and harvest quotas developed by the Department are the primary tools for managing big game species. These are designed to manage herds for population objectives and desired male to female ratios. Other factors, usually beyond the Department’s control or difficult to address, such as access, weather extremes, and wildlife disease outbreaks affect the Department’s ability to manage herds toward objective. Lack of hunter access to some hunt areas, especially in eastern Wyoming, limits the Department’s ability to obtain the harvest needed to maintain or obtain herd objectives. Weather conditions (drought, severe winters) have limited productivity of many deer and pronghorn herds, and many of these herds remain below objective. The Department currently manages some herds below objective because of the effects of drought and other factors on wildlife habitat. Even with the drought ending, it takes several years for habitat conditions to improve enough to allow many herds to move towards objective. Elk populations are, in general, above objective despite increased cow harvest in recent years. Landscape-scale habitat improvements to benefit big game and other species are needed in many areas and could be funded by the Wyoming Wildlife and Natural Resource Trust, the Wyoming Governor’s Big Game License Coalition, and other sources.
0
5
10
15
20
25
30
2006 2007 2008 2009 2010
Perc
ent o
f Her
d U
nits
(%)
Biological Year
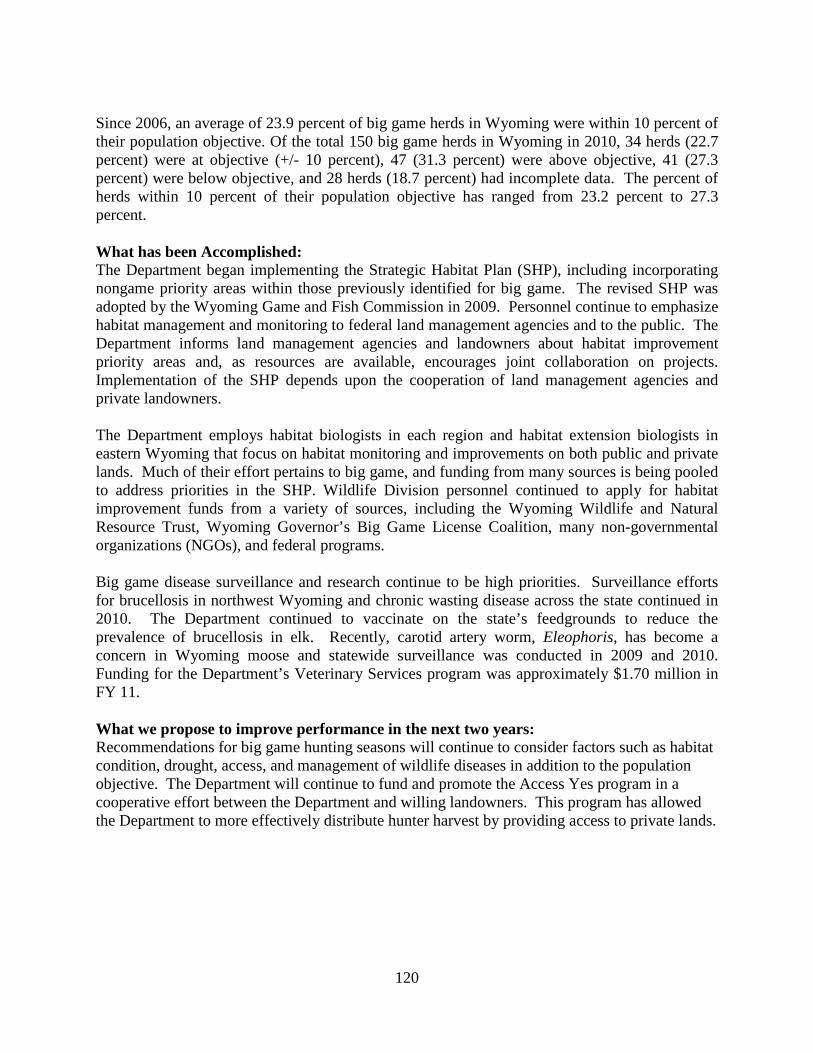
120
Since 2006, an average of 23.9 percent of big game herds in Wyoming were within 10 percent of their population objective. Of the total 150 big game herds in Wyoming in 2010, 34 herds (22.7 percent) were at objective (+/- 10 percent), 47 (31.3 percent) were above objective, 41 (27.3 percent) were below objective, and 28 herds (18.7 percent) had incomplete data. The percent of herds within 10 percent of their population objective has ranged from 23.2 percent to 27.3 percent. What has been Accomplished: The Department began implementing the Strategic Habitat Plan (SHP), including incorporating nongame priority areas within those previously identified for big game. The revised SHP was adopted by the Wyoming Game and Fish Commission in 2009. Personnel continue to emphasize habitat management and monitoring to federal land management agencies and to the public. The Department informs land management agencies and landowners about habitat improvement priority areas and, as resources are available, encourages joint collaboration on projects. Implementation of the SHP depends upon the cooperation of land management agencies and private landowners. The Department employs habitat biologists in each region and habitat extension biologists in eastern Wyoming that focus on habitat monitoring and improvements on both public and private lands. Much of their effort pertains to big game, and funding from many sources is being pooled to address priorities in the SHP. Wildlife Division personnel continued to apply for habitat improvement funds from a variety of sources, including the Wyoming Wildlife and Natural Resource Trust, Wyoming Governor’s Big Game License Coalition, many non-governmental organizations (NGOs), and federal programs. Big game disease surveillance and research continue to be high priorities. Surveillance efforts for brucellosis in northwest Wyoming and chronic wasting disease across the state continued in 2010. The Department continued to vaccinate on the state’s feedgrounds to reduce the prevalence of brucellosis in elk. Recently, carotid artery worm, Eleophoris, has become a concern in Wyoming moose and statewide surveillance was conducted in 2009 and 2010. Funding for the Department’s Veterinary Services program was approximately $1.70 million in FY 11. What we propose to improve performance in the next two years: Recommendations for big game hunting seasons will continue to consider factors such as habitat condition, drought, access, and management of wildlife diseases in addition to the population objective. The Department will continue to fund and promote the Access Yes program in a cooperative effort between the Department and willing landowners. This program has allowed the Department to more effectively distribute hunter harvest by providing access to private lands.
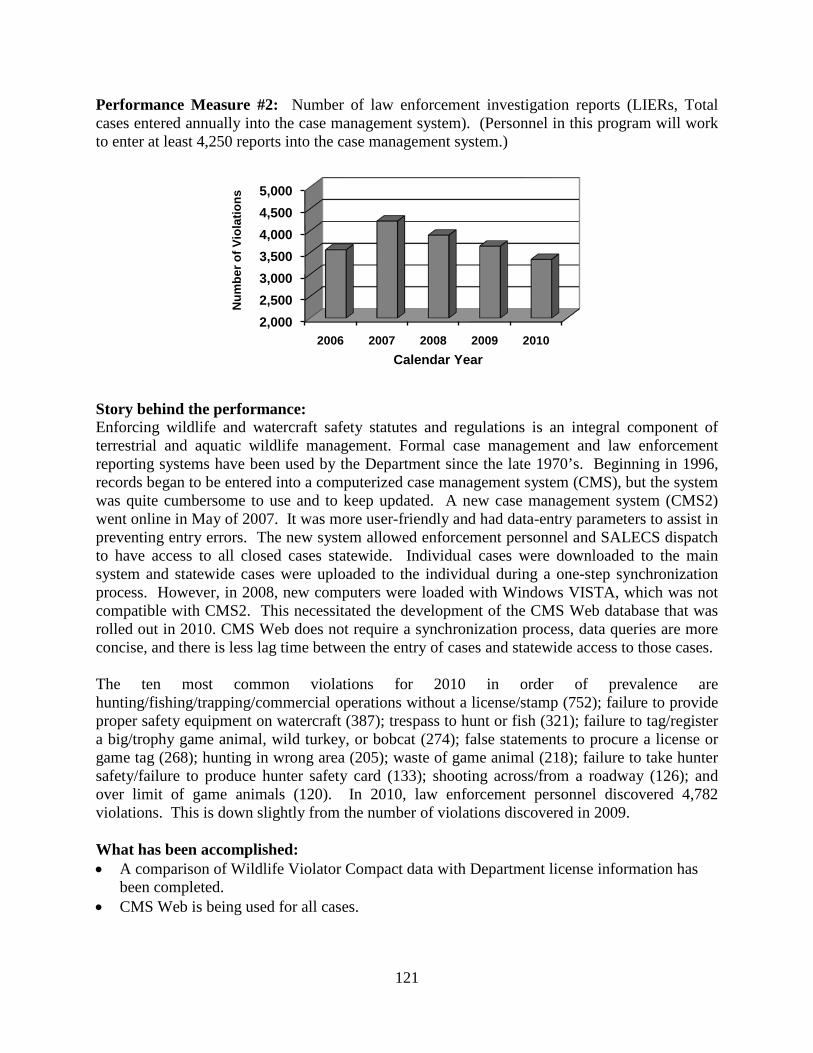
121
Performance Measure #2: Number of law enforcement investigation reports (LIERs, Total cases entered annually into the case management system). (Personnel in this program will work to enter at least 4,250 reports into the case management system.)
Story behind the performance: Enforcing wildlife and watercraft safety statutes and regulations is an integral component of terrestrial and aquatic wildlife management. Formal case management and law enforcement reporting systems have been used by the Department since the late 1970’s. Beginning in 1996, records began to be entered into a computerized case management system (CMS), but the system was quite cumbersome to use and to keep updated. A new case management system (CMS2) went online in May of 2007. It was more user-friendly and had data-entry parameters to assist in preventing entry errors. The new system allowed enforcement personnel and SALECS dispatch to have access to all closed cases statewide. Individual cases were downloaded to the main system and statewide cases were uploaded to the individual during a one-step synchronization process. However, in 2008, new computers were loaded with Windows VISTA, which was not compatible with CMS2. This necessitated the development of the CMS Web database that was rolled out in 2010. CMS Web does not require a synchronization process, data queries are more concise, and there is less lag time between the entry of cases and statewide access to those cases. The ten most common violations for 2010 in order of prevalence are hunting/fishing/trapping/commercial operations without a license/stamp (752); failure to provide proper safety equipment on watercraft (387); trespass to hunt or fish (321); failure to tag/register a big/trophy game animal, wild turkey, or bobcat (274); false statements to procure a license or game tag (268); hunting in wrong area (205); waste of game animal (218); failure to take hunter safety/failure to produce hunter safety card (133); shooting across/from a roadway (126); and over limit of game animals (120). In 2010, law enforcement personnel discovered 4,782 violations. This is down slightly from the number of violations discovered in 2009. What has been accomplished: • A comparison of Wildlife Violator Compact data with Department license information has
been completed. • CMS Web is being used for all cases.
2,0002,5003,0003,5004,0004,5005,000
2006 2007 2008 2009 2010
Num
ber o
f Vio
latio
ns
Calendar Year
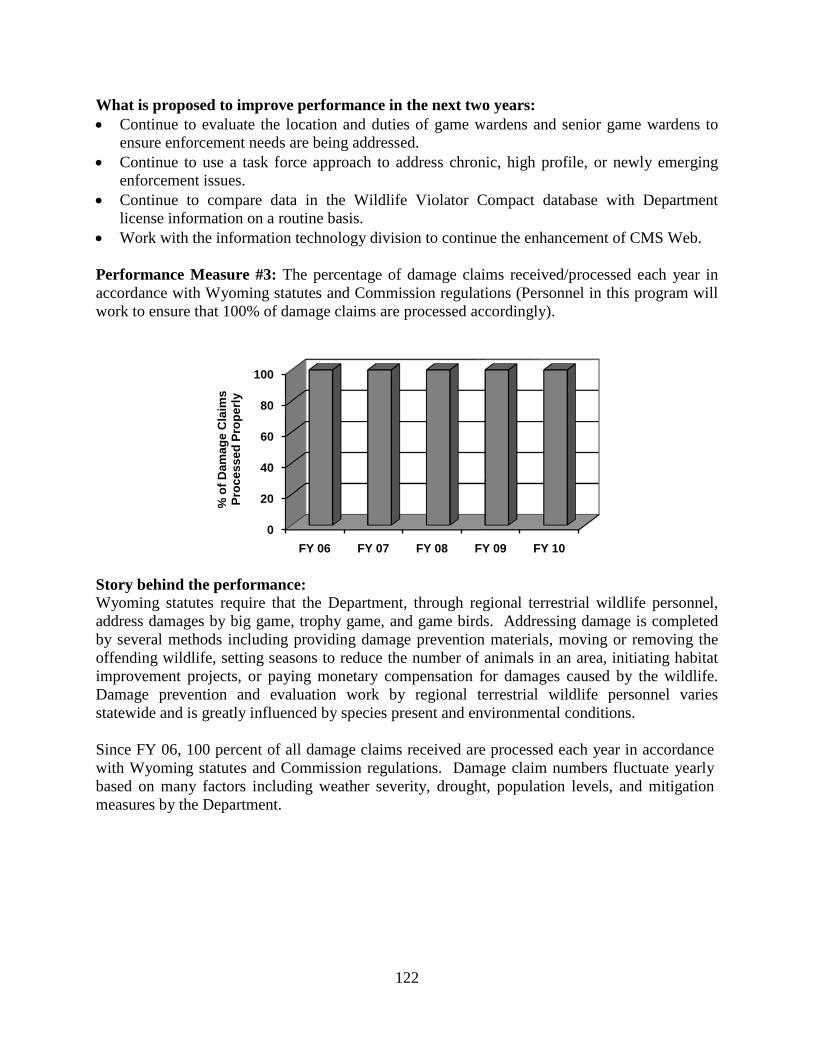
122
What is proposed to improve performance in the next two years: • Continue to evaluate the location and duties of game wardens and senior game wardens to
ensure enforcement needs are being addressed. • Continue to use a task force approach to address chronic, high profile, or newly emerging
enforcement issues. • Continue to compare data in the Wildlife Violator Compact database with Department
license information on a routine basis. • Work with the information technology division to continue the enhancement of CMS Web. Performance Measure #3: The percentage of damage claims received/processed each year in accordance with Wyoming statutes and Commission regulations (Personnel in this program will work to ensure that 100% of damage claims are processed accordingly).
Story behind the performance: Wyoming statutes require that the Department, through regional terrestrial wildlife personnel, address damages by big game, trophy game, and game birds. Addressing damage is completed by several methods including providing damage prevention materials, moving or removing the offending wildlife, setting seasons to reduce the number of animals in an area, initiating habitat improvement projects, or paying monetary compensation for damages caused by the wildlife. Damage prevention and evaluation work by regional terrestrial wildlife personnel varies statewide and is greatly influenced by species present and environmental conditions. Since FY 06, 100 percent of all damage claims received are processed each year in accordance with Wyoming statutes and Commission regulations. Damage claim numbers fluctuate yearly based on many factors including weather severity, drought, population levels, and mitigation measures by the Department.
0
20
40
60
80
100
FY 06 FY 07 FY 08 FY 09 FY 10
% o
f Dam
age
Cla
ims
Proc
esse
d Pr
oper
ly
123
What has been accomplished: Considerable efforts were made by Department personnel to prevent damage including hazing, zon guns, providing materials for stackyard fences, relocating trophy game animals, increasing harvest, depredation seasons, and as a last resort, “kill” permits. Department personnel continue to work to educate landowners and process damage claims. What we propose to improve performance in the next two years: • Continue to work with landowners to mitigate damages by providing damage materials,
moving or removing the offending animals, educating landowners, and processing damage claims.
124
Program: Specialized Statewide Law Enforcement Division: Wildlife Mission Statement: To provide support for Boating Safety and Stop Poaching programs throughout the state. To provide for specialized wildlife law enforcement investigations, issuance of permits and record keeping to all wildlife regions. Program Facts: The Specialized Statewide Law Enforcement program is made up of two major sub-programs, listed below with number of staff and 2011 (FY11) budget: Sub-programs # FTEs* 2011 Annual Budget Law Enforcement Administration & Boating Safety 3.0 $ 403,543** Law Enforcement Investigative Unit 7.0 752,839 TOTAL 10.0 $ 1,156,382 * Includes permanent positions authorized in the FY11 budget. Any positions added during the budget cycle require Wyoming Game and Fish Commission authorization or must be funded from supplemental grants. ** Does not include federal cost share dollars. The program is located statewide with personnel in Jackson, Green River, Cody, Sheridan, Laramie, Lander, Casper, and Cheyenne. These positions coordinate all the law enforcement programs and law enforcement reporting systems and administer the boating safety and stop poaching programs for the Department. Primary Functions of the Specialized Statewide Law Enforcement Program: • Provide support for Boating Safety Education and Enforcement by providing
boating safety courses for the public and providing boating safety enforcement on the State’s waterways
• Provide support for the Stop Poaching Program by increasing public involvement in detecting and reporting wildlife violators and by providing rewards for information relating to crimes against wildlife.
• Provide for specialized Wildlife Law Enforcement Investigations through the detection, apprehension, and prosecution of wildlife law violators via complex multi-suspect, multi-jurisdictional investigations.
• Provide for overall Law Enforcement Administration by handling permits, law enforcement record keeping, and routine law enforcement administration.
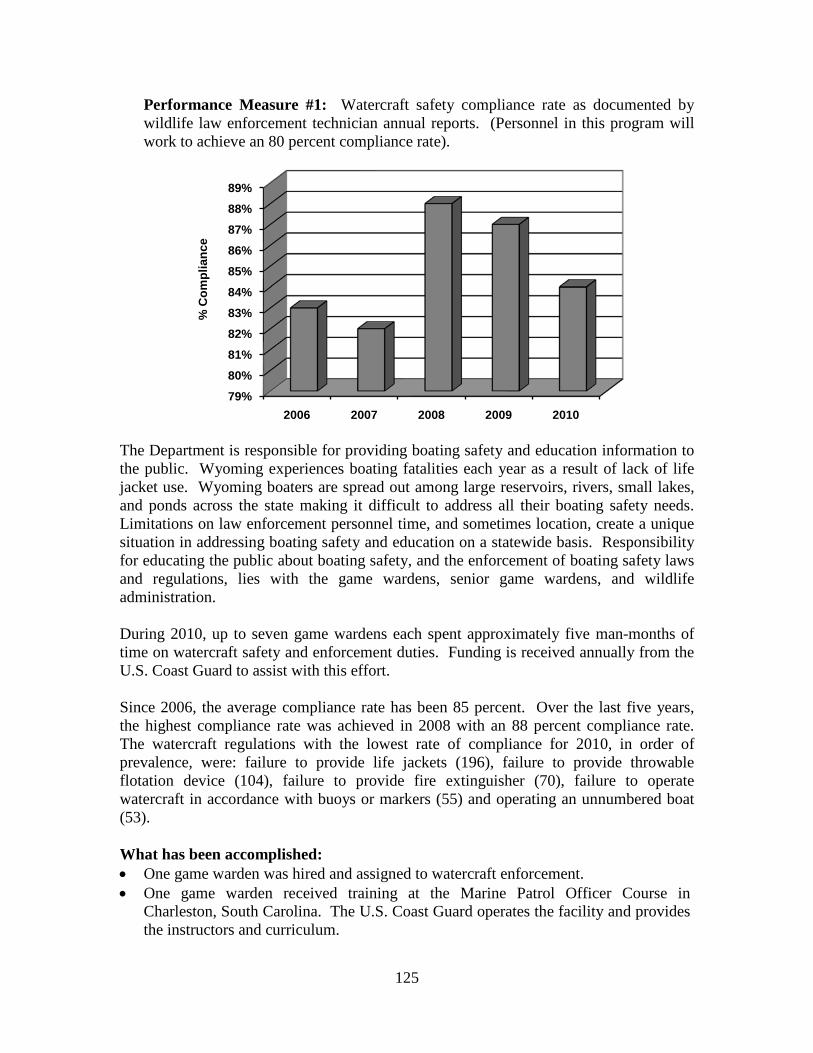
125
Performance Measure #1: Watercraft safety compliance rate as documented by wildlife law enforcement technician annual reports. (Personnel in this program will work to achieve an 80 percent compliance rate).
The Department is responsible for providing boating safety and education information to the public. Wyoming experiences boating fatalities each year as a result of lack of life jacket use. Wyoming boaters are spread out among large reservoirs, rivers, small lakes, and ponds across the state making it difficult to address all their boating safety needs. Limitations on law enforcement personnel time, and sometimes location, create a unique situation in addressing boating safety and education on a statewide basis. Responsibility for educating the public about boating safety, and the enforcement of boating safety laws and regulations, lies with the game wardens, senior game wardens, and wildlife administration. During 2010, up to seven game wardens each spent approximately five man-months of time on watercraft safety and enforcement duties. Funding is received annually from the U.S. Coast Guard to assist with this effort. Since 2006, the average compliance rate has been 85 percent. Over the last five years, the highest compliance rate was achieved in 2008 with an 88 percent compliance rate. The watercraft regulations with the lowest rate of compliance for 2010, in order of prevalence, were: failure to provide life jackets (196), failure to provide throwable flotation device (104), failure to provide fire extinguisher (70), failure to operate watercraft in accordance with buoys or markers (55) and operating an unnumbered boat (53). What has been accomplished: • One game warden was hired and assigned to watercraft enforcement. • One game warden received training at the Marine Patrol Officer Course in
Charleston, South Carolina. The U.S. Coast Guard operates the facility and provides the instructors and curriculum.
79%80%81%82%83%84%85%86%87%88%89%
2006 2007 2008 2009 2010
% C
ompl
ianc
e
126
• Two game wardens attended a boat accident investigation class. This class is facilitated through the U.S. Coast Guard, NASBLA (National Association of Boating Law Administrators).
• The Department continues to provide the Boating Basics correspondence course. • Special permit authorization letters were issued for eight watercraft events. The
events included such things as regattas, parades, and portable ski courses. The boating safety of both the participants and the public was evaluated before granting a request.
• Department personnel spent a total of 5,680 hours on boating safety. This includes time spent on law enforcement, safety and education programs, search and rescue events, accident investigation, and buoy maintenance.
• Officers responded to and investigated twenty accidents including one fatality. • A new Wyoming statute became effective in 2010 requiring watercraft to be titled
upon change of ownership. The Department is working together with Wyoming Department of Transportation and county clerks to ensure accurate watercraft titling.
What is proposed to improve performance in the next two years: • Continue to increase the availability of boating safety courses to the public by
utilizing Internet course providers and having our Boating Basics home study-course available at regional offices.
• Continue to administer a proactive boating safety program through public service announcements, boating education courses, and enforcement programs.
• Coordinate with U. S. Coast Guard to ensure funding is received for the Department’s recreational boating safety program.
• Annual evaluations are conducted on our boating safety program to maximize our education and enforcement efforts. Game wardens compile annual reports and statistics covering their boating season enforcement efforts.
• Continue a statewide inventory and evaluation of all regulatory buoys to ensure safe boating. Replace badly worn buoys before the 2011 boating season.
• Continue to work with the Wyoming Department of Transportation and county clerks to ensure accurate watercraft titling.
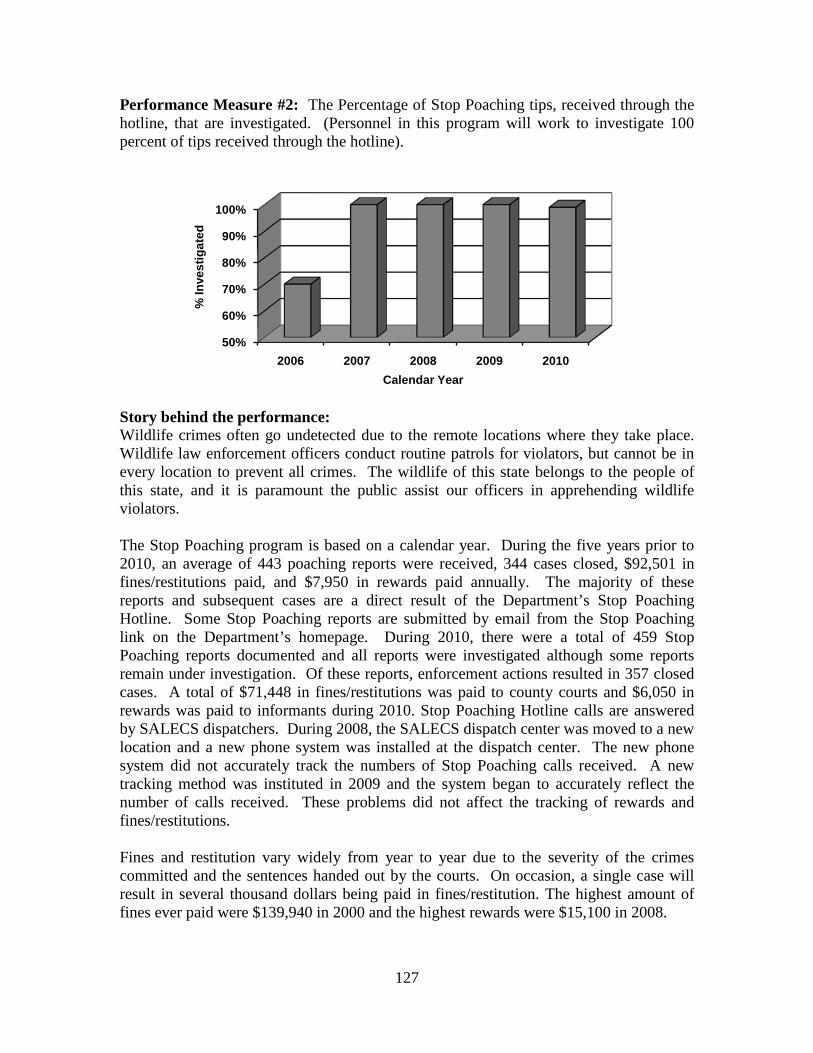
127
Performance Measure #2: The Percentage of Stop Poaching tips, received through the hotline, that are investigated. (Personnel in this program will work to investigate 100 percent of tips received through the hotline). Story behind the performance: Wildlife crimes often go undetected due to the remote locations where they take place. Wildlife law enforcement officers conduct routine patrols for violators, but cannot be in every location to prevent all crimes. The wildlife of this state belongs to the people of this state, and it is paramount the public assist our officers in apprehending wildlife violators. The Stop Poaching program is based on a calendar year. During the five years prior to 2010, an average of 443 poaching reports were received, 344 cases closed, $92,501 in fines/restitutions paid, and $7,950 in rewards paid annually. The majority of these reports and subsequent cases are a direct result of the Department’s Stop Poaching Hotline. Some Stop Poaching reports are submitted by email from the Stop Poaching link on the Department’s homepage. During 2010, there were a total of 459 Stop Poaching reports documented and all reports were investigated although some reports remain under investigation. Of these reports, enforcement actions resulted in 357 closed cases. A total of $71,448 in fines/restitutions was paid to county courts and $6,050 in rewards was paid to informants during 2010. Stop Poaching Hotline calls are answered by SALECS dispatchers. During 2008, the SALECS dispatch center was moved to a new location and a new phone system was installed at the dispatch center. The new phone system did not accurately track the numbers of Stop Poaching calls received. A new tracking method was instituted in 2009 and the system began to accurately reflect the number of calls received. These problems did not affect the tracking of rewards and fines/restitutions. Fines and restitution vary widely from year to year due to the severity of the crimes committed and the sentences handed out by the courts. On occasion, a single case will result in several thousand dollars being paid in fines/restitution. The highest amount of fines ever paid were $139,940 in 2000 and the highest rewards were $15,100 in 2008.
50%
60%
70%
80%
90%
100%
2006 2007 2008 2009 2010
% In
vest
igat
ed
Calendar Year
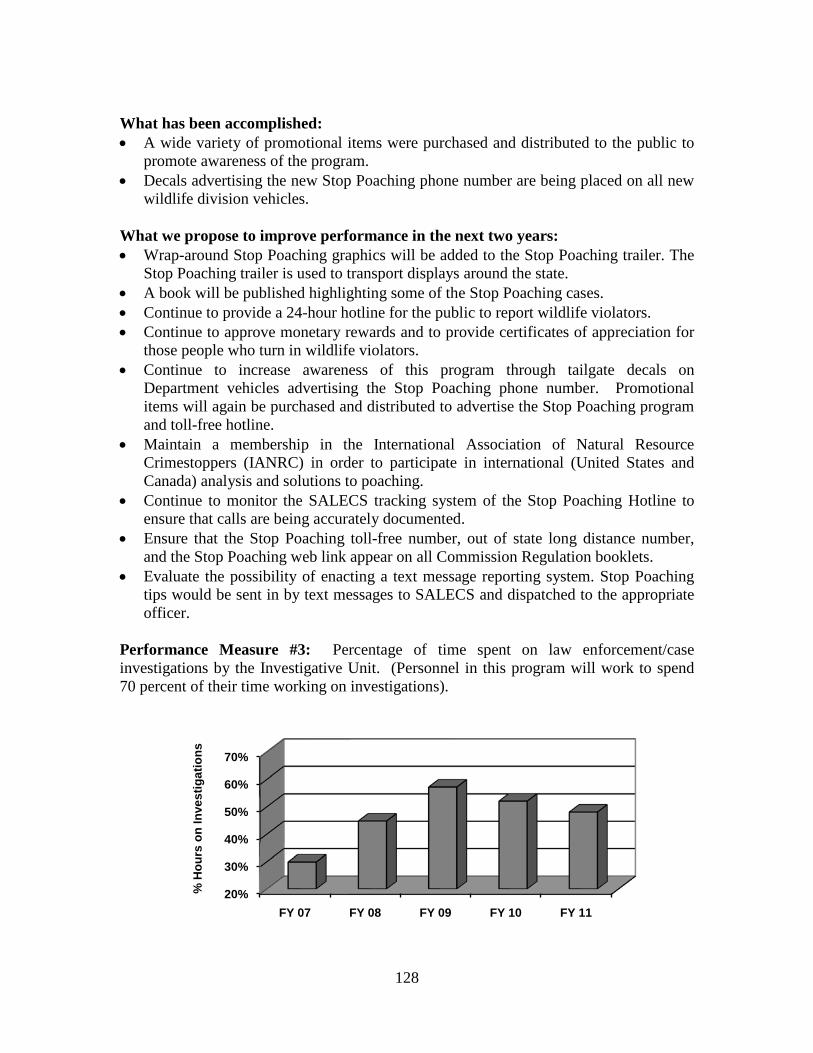
128
What has been accomplished: • A wide variety of promotional items were purchased and distributed to the public to
promote awareness of the program. • Decals advertising the new Stop Poaching phone number are being placed on all new
wildlife division vehicles. What we propose to improve performance in the next two years: • Wrap-around Stop Poaching graphics will be added to the Stop Poaching trailer. The
Stop Poaching trailer is used to transport displays around the state. • A book will be published highlighting some of the Stop Poaching cases. • Continue to provide a 24-hour hotline for the public to report wildlife violators. • Continue to approve monetary rewards and to provide certificates of appreciation for
those people who turn in wildlife violators. • Continue to increase awareness of this program through tailgate decals on
Department vehicles advertising the Stop Poaching phone number. Promotional items will again be purchased and distributed to advertise the Stop Poaching program and toll-free hotline.
• Maintain a membership in the International Association of Natural Resource Crimestoppers (IANRC) in order to participate in international (United States and Canada) analysis and solutions to poaching.
• Continue to monitor the SALECS tracking system of the Stop Poaching Hotline to ensure that calls are being accurately documented.
• Ensure that the Stop Poaching toll-free number, out of state long distance number, and the Stop Poaching web link appear on all Commission Regulation booklets.
• Evaluate the possibility of enacting a text message reporting system. Stop Poaching tips would be sent in by text messages to SALECS and dispatched to the appropriate officer.
Performance Measure #3: Percentage of time spent on law enforcement/case investigations by the Investigative Unit. (Personnel in this program will work to spend 70 percent of their time working on investigations).
20%
30%
40%
50%
60%
70%
FY 07 FY 08 FY 09 FY 10 FY 11
% H
ours
on
Inve
stig
atio
ns
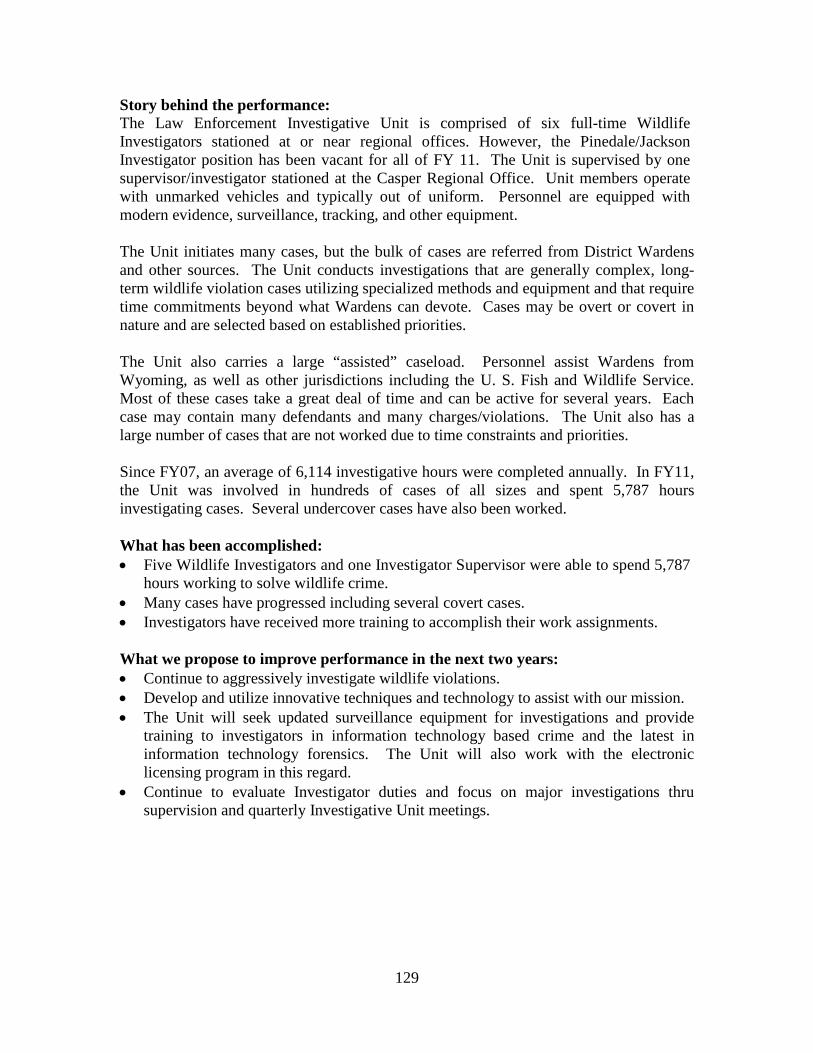
129
Story behind the performance: The Law Enforcement Investigative Unit is comprised of six full-time Wildlife Investigators stationed at or near regional offices. However, the Pinedale/Jackson Investigator position has been vacant for all of FY 11. The Unit is supervised by one supervisor/investigator stationed at the Casper Regional Office. Unit members operate with unmarked vehicles and typically out of uniform. Personnel are equipped with modern evidence, surveillance, tracking, and other equipment. The Unit initiates many cases, but the bulk of cases are referred from District Wardens and other sources. The Unit conducts investigations that are generally complex, long-term wildlife violation cases utilizing specialized methods and equipment and that require time commitments beyond what Wardens can devote. Cases may be overt or covert in nature and are selected based on established priorities. The Unit also carries a large “assisted” caseload. Personnel assist Wardens from Wyoming, as well as other jurisdictions including the U. S. Fish and Wildlife Service. Most of these cases take a great deal of time and can be active for several years. Each case may contain many defendants and many charges/violations. The Unit also has a large number of cases that are not worked due to time constraints and priorities. Since FY07, an average of 6,114 investigative hours were completed annually. In FY11, the Unit was involved in hundreds of cases of all sizes and spent 5,787 hours investigating cases. Several undercover cases have also been worked. What has been accomplished: • Five Wildlife Investigators and one Investigator Supervisor were able to spend 5,787
hours working to solve wildlife crime. • Many cases have progressed including several covert cases. • Investigators have received more training to accomplish their work assignments. What we propose to improve performance in the next two years: • Continue to aggressively investigate wildlife violations. • Develop and utilize innovative techniques and technology to assist with our mission. • The Unit will seek updated surveillance equipment for investigations and provide
training to investigators in information technology based crime and the latest in information technology forensics. The Unit will also work with the electronic licensing program in this regard.
• Continue to evaluate Investigator duties and focus on major investigations thru supervision and quarterly Investigative Unit meetings.
130
Program: Statewide Terrestrial Wildlife Management Division: Wildlife Mission: Lead specialized, statewide conservation and management of native terrestrial wildlife species, and assist with regional management of resident game species. Program Facts: The Statewide Terrestrial Wildlife Management program is made up of seven major sub-programs, listed below with number of staff and 2011 (FY11) budget.
Sub-programs # FTEs* 2011 Annual Budget Biological Services 6.5 $ 954,370 Terrestrial Nongame (CWCS) 10.3 796,416 Migratory Game Bird (Waterfowl) 1.0 178,306 Trophy Game Mgmt. & Research 4.5 516,855 Trophy Game Conflict Resolution 6.7 645,309 Sage-Grouse Conservation 2.0 903,823 Predator Management 0.0 100,000
TOTAL 31.0 $ 4,095,079 * Includes permanent and contract positions authorized in the FY11 budget. Any positions added during the budget cycle require Wyoming Game and Fish Commission authorization or must be funded from supplemental grants. The sub-programs that comprise the Statewide Terrestrial Wildlife Management program were previously part of the Terrestrial Wildlife Management program (Strategic Plan FY04-FY07, November 2003). The Migratory Game Bird sub-program was previously referred to as the Waterfowl sub-program. The Trophy Game Management and Research sub-program was previously referred to as the Trophy Game sub-program. In addition, the Sage-Grouse Conservation sub-program was created and added as its own sub-program. This program has statewide responsibilities that are based in various locations throughout the state. Primary Functions of the Statewide Terrestrial Wildlife Management Program: • Assist with recovery and conservation of species that are threatened,
endangered, or in greatest conservation need by developing and implementing plans and strategies, providing technical and financial assistance, collecting data, coordinating with other agencies and organizations, and conducting research.
• Participate in statewide terrestrial wildlife management by providing policy, data and environmental analyses, planning and evaluation, data collection, and trophy game conflict resolution; by compiling and administering statewide management data; and by representing the division or agency in multi-disciplinary and multi-organization conservation and management efforts.
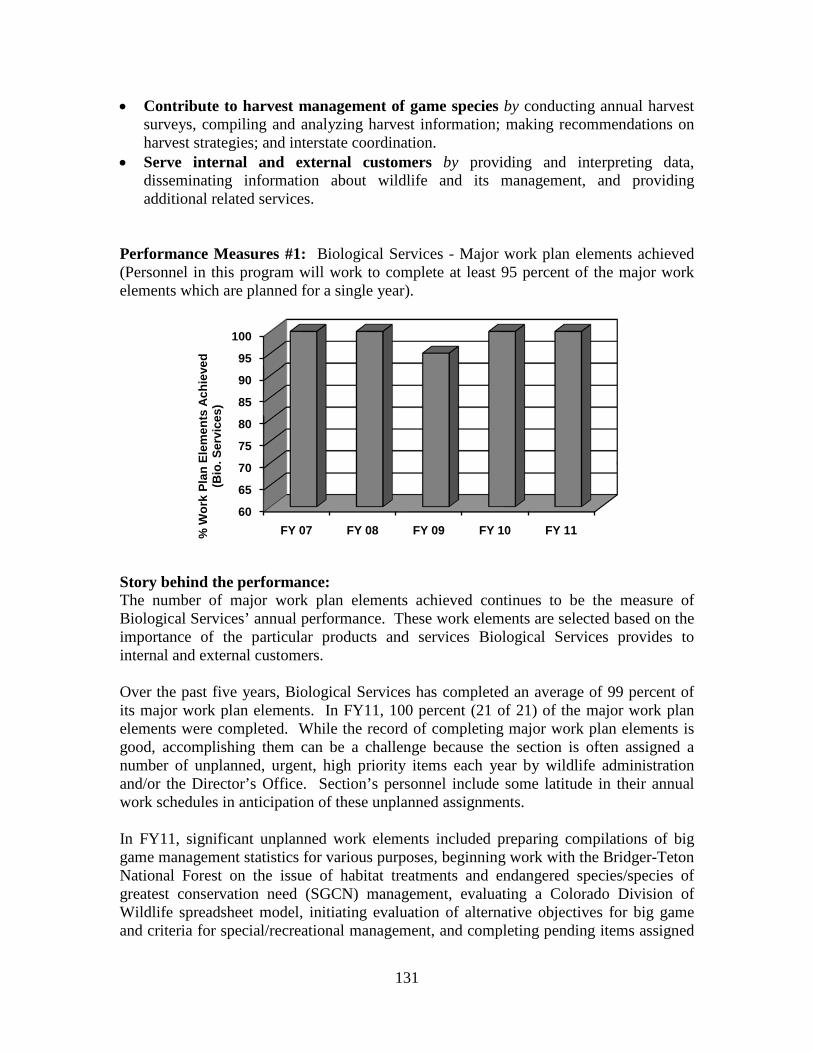
131
• Contribute to harvest management of game species by conducting annual harvest surveys, compiling and analyzing harvest information; making recommendations on harvest strategies; and interstate coordination.
• Serve internal and external customers by providing and interpreting data, disseminating information about wildlife and its management, and providing additional related services.
Performance Measures #1: Biological Services - Major work plan elements achieved (Personnel in this program will work to complete at least 95 percent of the major work elements which are planned for a single year).
Story behind the performance: The number of major work plan elements achieved continues to be the measure of Biological Services’ annual performance. These work elements are selected based on the importance of the particular products and services Biological Services provides to internal and external customers.
Over the past five years, Biological Services has completed an average of 99 percent of its major work plan elements. In FY11, 100 percent (21 of 21) of the major work plan elements were completed. While the record of completing major work plan elements is good, accomplishing them can be a challenge because the section is often assigned a number of unplanned, urgent, high priority items each year by wildlife administration and/or the Director’s Office. Section’s personnel include some latitude in their annual work schedules in anticipation of these unplanned assignments. In FY11, significant unplanned work elements included preparing compilations of big game management statistics for various purposes, beginning work with the Bridger-Teton National Forest on the issue of habitat treatments and endangered species/species of greatest conservation need (SGCN) management, evaluating a Colorado Division of Wildlife spreadsheet model, initiating evaluation of alternative objectives for big game and criteria for special/recreational management, and completing pending items assigned
60
65
70
75
80
85
90
95
100
FY 07 FY 08 FY 09 FY 10 FY 11% W
ork
Plan
Ele
men
ts A
chie
ved
(Bio
. Ser
vice
s)
132
to the section by administration. The Cheyenne Staff Biologist was required to continue helping with policy, regulation, and document reviews again this year. What has been accomplished: Major work plan elements identified annually constitute a large percentage of, but not all, the duties and tasks for which the Section is responsible. Each is important to someone, and in some cases, is significant to a broad range of internal and external customers. For FY11 these elements were: • Western Association of Fish and Wildlife Agencies sage-grouse team and in-state
sage-grouse duties. • Implement Governor Mead’s Executive Order 2011-5 (Greater Sage-Grouse Core
Area Protection) • Statewide waterfowl program administration/supervision • Pacific and Central Flyways – all related duties • State Wildlife Action Plan (SWAP) revision • Wyoming Landscape Conservation Initiative Science and Technical Advisory
Committee and Monitoring Committee • Coordinator/supervisor/biologist meetings - planning/attending/contributing • Habitat and Technical Advisory Group Committee duties other than SWAP • 6T50 Budget preparation and administration • Biological Services program administration/supervision • Maintenance and Operation research proposals – Review, edit, and recommendations
on funding, study tracking and follow-up • Regulation development review, and hunt area map revisions (big game, trophy
game, small game, migratory and upland game, furbearers) • Bobcat Convention on International Trade of Endangered Species (CITES) annual
report • Wildlife nuisance calls • Big and trophy game harvest survey, coordinate with external provider • Develop harvest survey request for proposal, review bids and award contract for
FY12 with renewal option for FY13 and FY14 • Moose, bighorn sheep, and mountain goat harvest surveys, conduct internally • Small, upland, and migratory game plus furbearer harvest surveys, conduct internally • Wildlife Observation System (WOS) administration and management • Job Completion Reports (JCR) - publication, database maintenance, and herd history
spreadsheets • Improve ease-of-use of the JCR database and develop a user’s manual • Maintenance of black bear and mountain lion hotlines What we propose to improve performance in the next two years: • Continue to develop work schedules for section personnel addressing essential and
high priority functions while allowing time to accommodate unplanned assignments. • Continue to cross-train on several databases the section maintains.
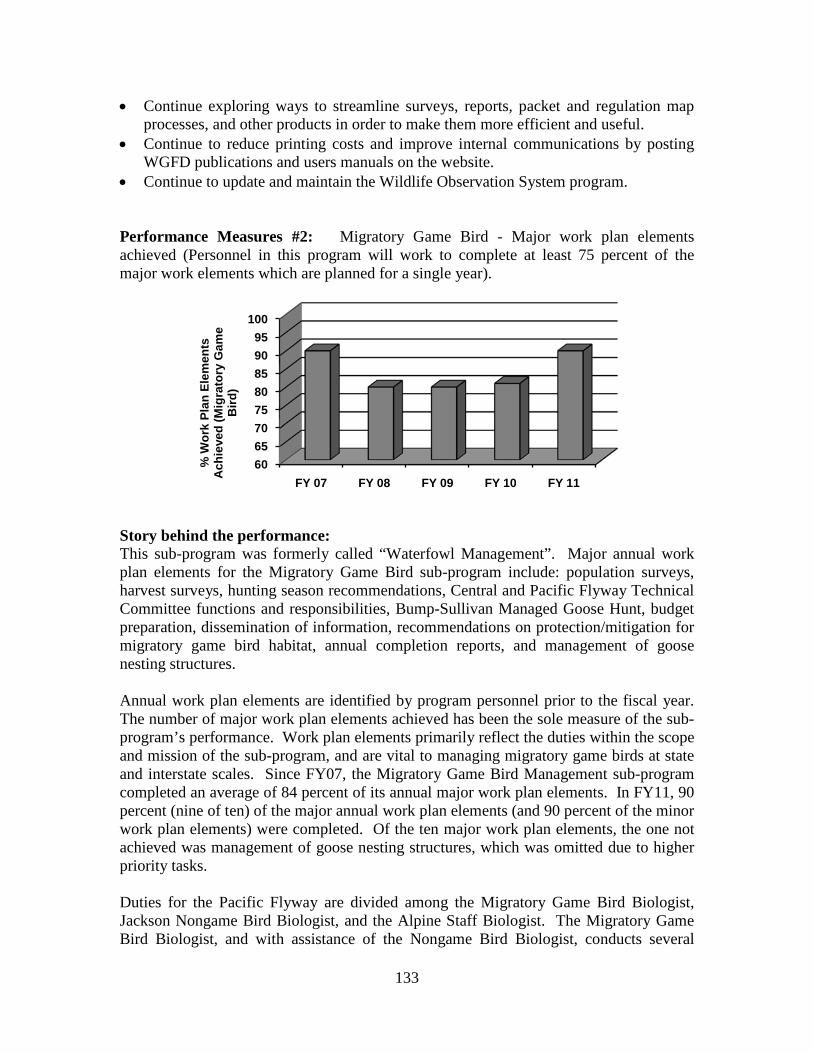
133
• Continue exploring ways to streamline surveys, reports, packet and regulation map processes, and other products in order to make them more efficient and useful.
• Continue to reduce printing costs and improve internal communications by posting WGFD publications and users manuals on the website.
• Continue to update and maintain the Wildlife Observation System program. Performance Measures #2: Migratory Game Bird - Major work plan elements achieved (Personnel in this program will work to complete at least 75 percent of the major work elements which are planned for a single year).
Story behind the performance: This sub-program was formerly called “Waterfowl Management”. Major annual work plan elements for the Migratory Game Bird sub-program include: population surveys, harvest surveys, hunting season recommendations, Central and Pacific Flyway Technical Committee functions and responsibilities, Bump-Sullivan Managed Goose Hunt, budget preparation, dissemination of information, recommendations on protection/mitigation for migratory game bird habitat, annual completion reports, and management of goose nesting structures. Annual work plan elements are identified by program personnel prior to the fiscal year. The number of major work plan elements achieved has been the sole measure of the sub-program’s performance. Work plan elements primarily reflect the duties within the scope and mission of the sub-program, and are vital to managing migratory game birds at state and interstate scales. Since FY07, the Migratory Game Bird Management sub-program completed an average of 84 percent of its annual major work plan elements. In FY11, 90 percent (nine of ten) of the major annual work plan elements (and 90 percent of the minor work plan elements) were completed. Of the ten major work plan elements, the one not achieved was management of goose nesting structures, which was omitted due to higher priority tasks. Duties for the Pacific Flyway are divided among the Migratory Game Bird Biologist, Jackson Nongame Bird Biologist, and the Alpine Staff Biologist. The Migratory Game Bird Biologist, and with assistance of the Nongame Bird Biologist, conducts several
6065707580859095
100
FY 07 FY 08 FY 09 FY 10 FY 11
% W
ork
Plan
Ele
men
ts
Ach
ieve
d (M
igra
tory
Gam
e B
ird)
134
surveys of migratory game birds. The Alpine Staff Biologist represents the Department at the Pacific Flyway Technical Committee meetings and prepares recommendations for migratory game bird hunting seasons in the Pacific Flyway in collaboration with the Migratory Game Bird Biologist. In FY10, banding was eliminated from the list of priority work plan elements. However, the Migratory Game Bird Section is providing financial support through the Central Flyway Council to help fund a preseason duck banding effort being carried out in the Central Flyway. Another priority is to maintain and evaluate over 800 goose nesting structures throughout the state. In response to reductions in personnel and funding, and considering the breeding population of Canada geese in Wyoming has increased 32 percent over the past 20 years, the Department is evaluating the need and ability to annually replace bedding and maintain the structures. Less effective structures, on which geese don’t regularly nest, are being eliminated where possible. The Migratory Game Bird Section participates in cooperative annual surveys to estimate waterfowl populations and provides information necessary for setting waterfowl seasons. Surveys include the September crane, mid-winter waterfowl, Canada goose winter classification, and Canada goose breeding surveys. The Migratory Game Bird Section remains strongly committed to migratory game bird management through the national flyway system. The Section’s involvement includes development and revision of management plans for the various migratory game bird populations, providing input on policy decisions, setting annual hunting seasons, and producing annual job completion reports for hunted populations in both the Central and Pacific Flyways. These processes require representatives from Wyoming to participate in the Flyway Technical Committee meetings held annually in December/January, March, and July. The Migratory Game Bird Section is also directly or indirectly involved in management of migratory nongame birds in the two Flyways. For example, the section has been increasingly involved with trumpeter swan management. What has been accomplished: The Migratory Game Bird Biologist coordinated surveys to collect waterfowl and sandhill crane harvest and population data, analyzed the data, prepared hunting season recommendations, and represented the Department at the Central Flyway Technical Committee meetings. The Alpine Staff Biologist represented the Department at the Pacific Flyway Technical Committee meetings and, in collaboration with the Migratory Game Bird Biologist, recommended hunting seasons in the Pacific Flyway. The Migratory Game Bird Biologist served as chair of the Central Flyway Waterfowl Technical Committee.
135
The Migratory Game Bird Section participated in several cooperative surveys coordinated annually by the U.S. Fish and Wildlife Service to estimate migratory game bird populations and provide information necessary for setting hunting seasons. These surveys included mourning dove, September crane, and mid-winter waterfowl surveys. The goose nesting structure database was updated with current information. The 2010 annual completion report was written and filed with Biological Services. Information and data were provided in response to all inquiries. The annual budget was prepared and included funding support for the Central Flyway preseason duck banding effort. Two crews banded ducks in North Dakota during FY11. Another spring light goose hunting season was held in the Central Flyway portion of the state in accordance with the Arctic Tundra Habitat Emergency Conservation Act. The Section advocated conservation of migratory game bird habitat through its involvement in the Intermountain West and Northern Great Plains Joint Ventures, and participation in the Wyoming Joint Ventures Steering Committee.
What we propose to improve performance in the next two years: • Prioritize work elements; some work simply will not get done due to staffing
limitations and other demands. Explore ways to streamline and economize the existing workload where possible.
• Improve coordination and communication with other Department personnel whose duties may have some bearing on goals and objectives of the Migratory Game Bird Section, and with those personnel who are occasionally requested to assist with surveys and other functions.
• Investigate options to secure additional technical and clerical assistance (e.g., student volunteers, outside funding).
• Continue to justify the need for another full-time Migratory Game Bird biologist to cover the western (Pacific Flyway) portion of the state.
• Continue to plan work schedules to accomplish those tasks that can be anticipated and accommodate unplanned assignments, possibly by deemphasizing some of the less critical work elements.
Data development agenda: The number of work elements achieved annually may not be an ideal measure of success, but seems to provide the most practical approach given the diversity of duties within the sub-program. An alternative would be the annual number of (hunter) recreation days supported by the migratory game bird sub-program. However, many factors outside the influence of Migratory Game Bird sub-program personnel can affect this metric, for example, bird production and survival in other parts of the continent, weather during the migration period, and changes in the federal hunting season frameworks. As well, the number of recreation days is only one of the outputs that might be important to the external customers of this sub-program. Personnel will continue to investigate better performance measures for the sub-program.
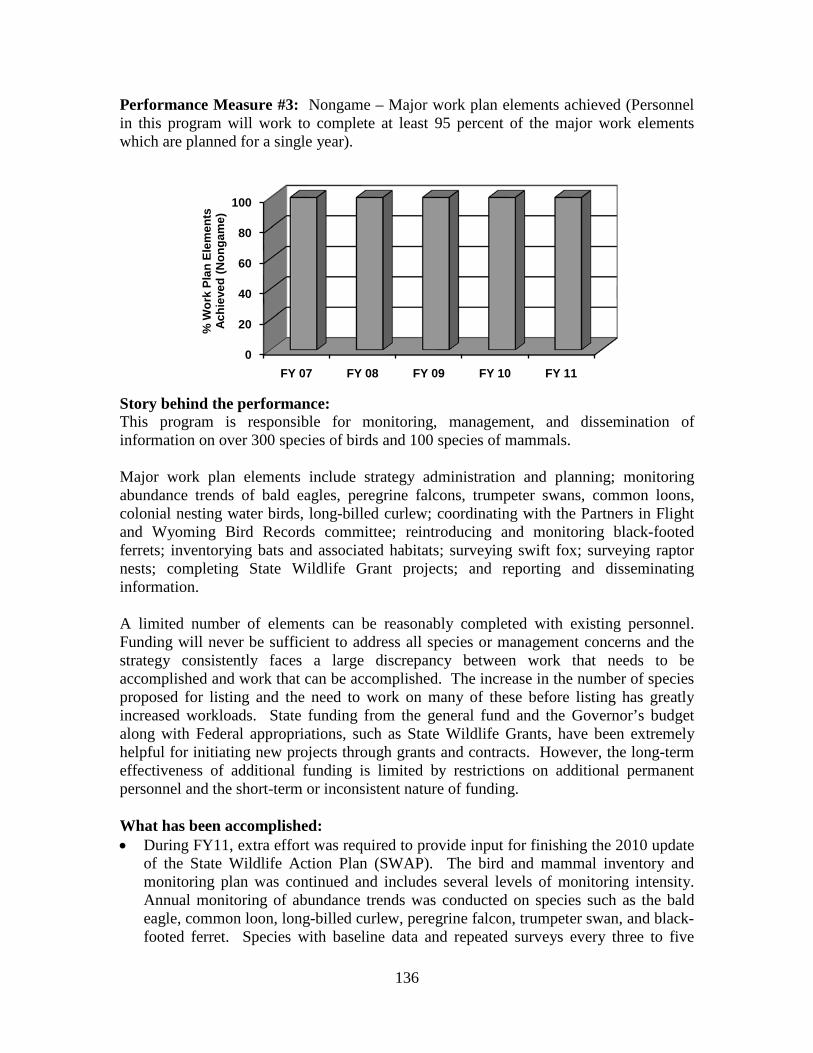
136
Performance Measure #3: Nongame – Major work plan elements achieved (Personnel in this program will work to complete at least 95 percent of the major work elements which are planned for a single year).
Story behind the performance: This program is responsible for monitoring, management, and dissemination of information on over 300 species of birds and 100 species of mammals. Major work plan elements include strategy administration and planning; monitoring abundance trends of bald eagles, peregrine falcons, trumpeter swans, common loons, colonial nesting water birds, long-billed curlew; coordinating with the Partners in Flight and Wyoming Bird Records committee; reintroducing and monitoring black-footed ferrets; inventorying bats and associated habitats; surveying swift fox; surveying raptor nests; completing State Wildlife Grant projects; and reporting and disseminating information. A limited number of elements can be reasonably completed with existing personnel. Funding will never be sufficient to address all species or management concerns and the strategy consistently faces a large discrepancy between work that needs to be accomplished and work that can be accomplished. The increase in the number of species proposed for listing and the need to work on many of these before listing has greatly increased workloads. State funding from the general fund and the Governor’s budget along with Federal appropriations, such as State Wildlife Grants, have been extremely helpful for initiating new projects through grants and contracts. However, the long-term effectiveness of additional funding is limited by restrictions on additional permanent personnel and the short-term or inconsistent nature of funding. What has been accomplished: • During FY11, extra effort was required to provide input for finishing the 2010 update
of the State Wildlife Action Plan (SWAP). The bird and mammal inventory and monitoring plan was continued and includes several levels of monitoring intensity. Annual monitoring of abundance trends was conducted on species such as the bald eagle, common loon, long-billed curlew, peregrine falcon, trumpeter swan, and black-footed ferret. Species with baseline data and repeated surveys every three to five
0
20
40
60
80
100
FY 07 FY 08 FY 09 FY 10 FY 11
% W
ork
Plan
Ele
men
ts
Achi
eved
(Non
gam
e)
137
years were surveyed and included colonial waterbirds, mountain plover, several species of bats, and swift fox. Continued monitoring efforts serve as a coarse filter for early detection of birds that may need to be included on the Wyoming’s Species of Greatest Conservation Need (SGCN) list. This effort included 54 roadside breeding bird survey routes, 197 point count transects, and several riparian transects, and one banding station.
• Recovery efforts for the black-footed ferret continued and included habitat mapping and monitoring a portion of the ferret population. In FY11, ferret surveys focused on the 8,094 hectare study area used to monitor population trends. Approximately 556 personnel hours resulted in an estimate of 229 ferrets, which is similar to estimates in 2006 and 2008 and indicates a stabilized healthy population.
• Progress continued on the Department’s Green River Basin Trumpeter Swan Summer Habitat Plan (State Wildlife Grant 2003-2004) to develop habitat for the expanding swan population and other wetland birds. The program has had excellent success in obtaining funding for these wetland projects from the Wyoming Landscape Conservation Initiative and the Wyoming Wildlife Natural Resource Trust. Additional funding sources appear promising. Monitoring of completed wetland projects on private lands in the Green River basin is ongoing and preliminary work for the initiation of an additional wetland project was completed.
• Along with the new funding sources, the necessary planning and administration allowed for the initiation of numerous grants and contracts to collect more baseline information on: sagebrush bird and mammal obligates, nesting raptors, expanded statewide grid sampling for birds, a monitoring program for important bird areas, an evaluation of the ferruginous hawk population status, Wyoming pocket gopher, pygmy rabbits, Preble’s meadow jumping mouse, northern river otter, and baseline inventories of small mammals in Thunder Basin.
What we propose to improve performance in the next two years: • Increase efforts for implementation planning to assure high priority major work plan
elements are attained while accommodating short-term projects. • Focus on writing proposals and attaining long-term funding allowing for necessary
planning. • Continue to seek additional permanent positions through legislative and other long-
term funding. • Continue to build a reliable base of volunteers and suitable projects through outreach
to conservation organizations and schools. Data development agenda: While the number of work elements achieved annually provides some measure of success, it does not adequately reflect accomplishments of the program that internal and external publics can readily evaluate. Personnel are currently investigating better performance measures.
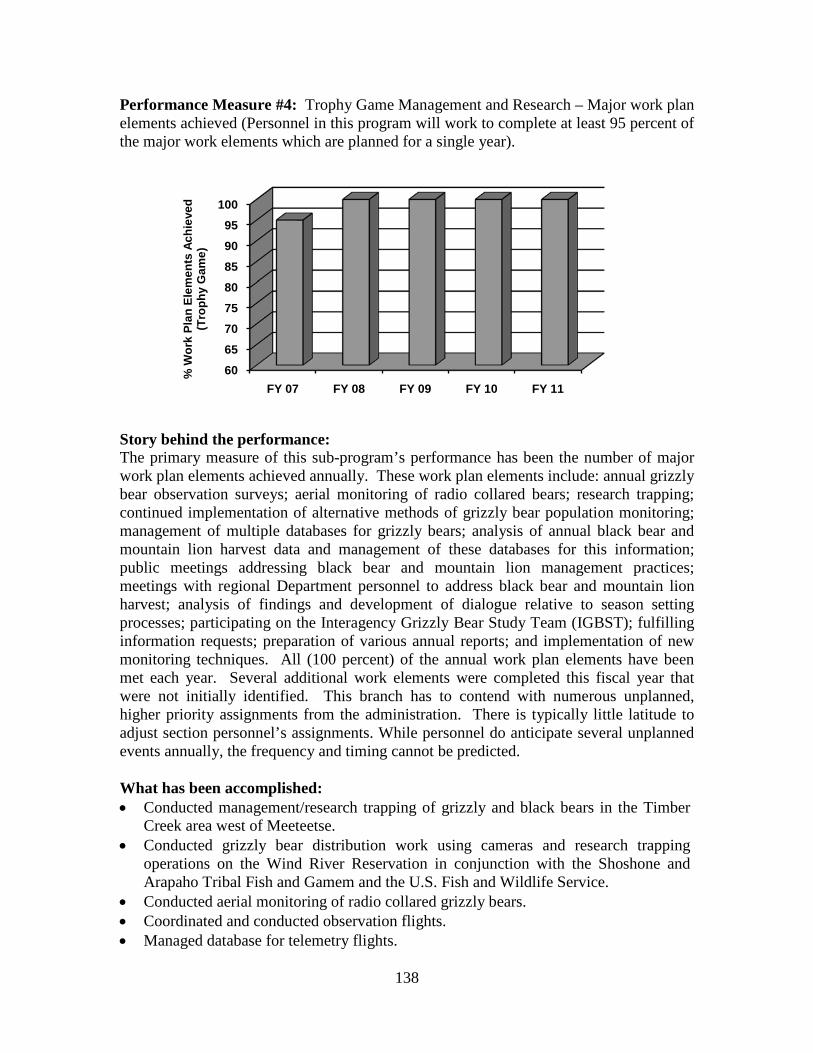
138
Performance Measure #4: Trophy Game Management and Research – Major work plan elements achieved (Personnel in this program will work to complete at least 95 percent of the major work elements which are planned for a single year).
Story behind the performance: The primary measure of this sub-program’s performance has been the number of major work plan elements achieved annually. These work plan elements include: annual grizzly bear observation surveys; aerial monitoring of radio collared bears; research trapping; continued implementation of alternative methods of grizzly bear population monitoring; management of multiple databases for grizzly bears; analysis of annual black bear and mountain lion harvest data and management of these databases for this information; public meetings addressing black bear and mountain lion management practices; meetings with regional Department personnel to address black bear and mountain lion harvest; analysis of findings and development of dialogue relative to season setting processes; participating on the Interagency Grizzly Bear Study Team (IGBST); fulfilling information requests; preparation of various annual reports; and implementation of new monitoring techniques. All (100 percent) of the annual work plan elements have been met each year. Several additional work elements were completed this fiscal year that were not initially identified. This branch has to contend with numerous unplanned, higher priority assignments from the administration. There is typically little latitude to adjust section personnel’s assignments. While personnel do anticipate several unplanned events annually, the frequency and timing cannot be predicted. What has been accomplished: • Conducted management/research trapping of grizzly and black bears in the Timber
Creek area west of Meeteetse. • Conducted grizzly bear distribution work using cameras and research trapping
operations on the Wind River Reservation in conjunction with the Shoshone and Arapaho Tribal Fish and Gamem and the U.S. Fish and Wildlife Service.
• Conducted aerial monitoring of radio collared grizzly bears. • Coordinated and conducted observation flights. • Managed database for telemetry flights.
6065707580859095
100
FY 07 FY 08 FY 09 FY 10 FY 11
% W
ork
Plan
Ele
men
ts A
chie
ved
(Tro
phy
Gam
e)
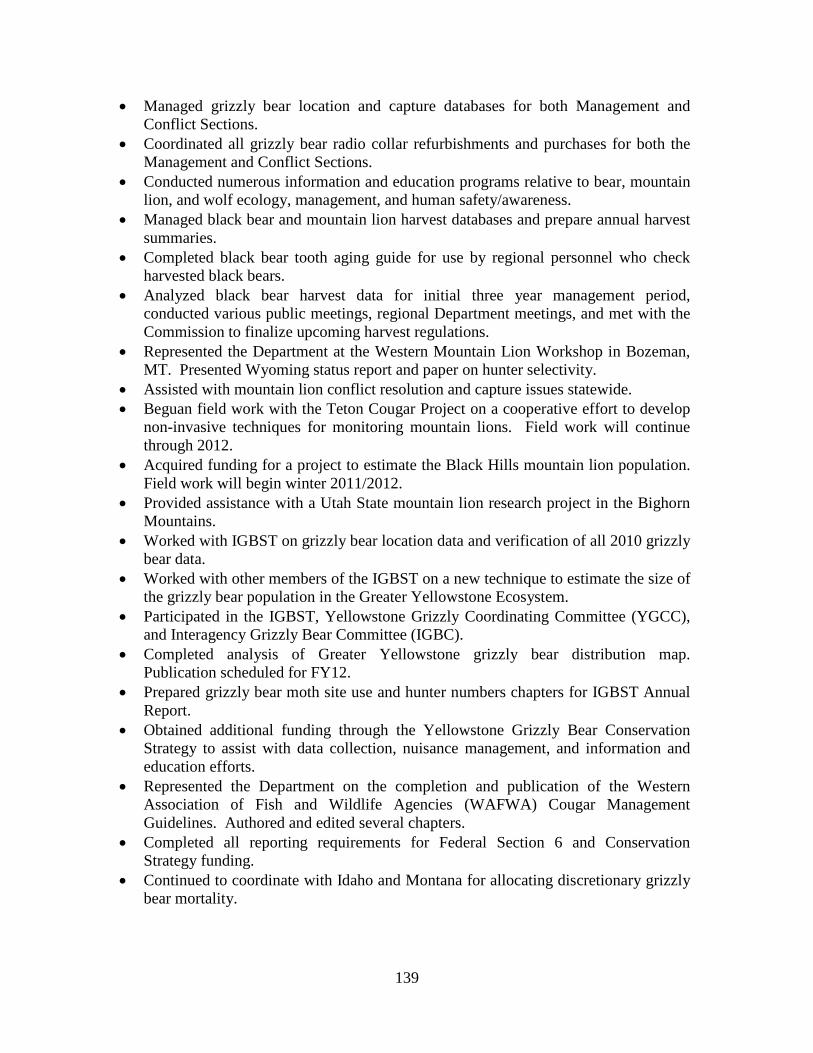
139
• Managed grizzly bear location and capture databases for both Management and Conflict Sections.
• Coordinated all grizzly bear radio collar refurbishments and purchases for both the Management and Conflict Sections.
• Conducted numerous information and education programs relative to bear, mountain lion, and wolf ecology, management, and human safety/awareness.
• Managed black bear and mountain lion harvest databases and prepare annual harvest summaries.
• Completed black bear tooth aging guide for use by regional personnel who check harvested black bears.
• Analyzed black bear harvest data for initial three year management period, conducted various public meetings, regional Department meetings, and met with the Commission to finalize upcoming harvest regulations.
• Represented the Department at the Western Mountain Lion Workshop in Bozeman, MT. Presented Wyoming status report and paper on hunter selectivity.
• Assisted with mountain lion conflict resolution and capture issues statewide. • Beguan field work with the Teton Cougar Project on a cooperative effort to develop
non-invasive techniques for monitoring mountain lions. Field work will continue through 2012.
• Acquired funding for a project to estimate the Black Hills mountain lion population. Field work will begin winter 2011/2012.
• Provided assistance with a Utah State mountain lion research project in the Bighorn Mountains.
• Worked with IGBST on grizzly bear location data and verification of all 2010 grizzly bear data.
• Worked with other members of the IGBST on a new technique to estimate the size of the grizzly bear population in the Greater Yellowstone Ecosystem.
• Participated in the IGBST, Yellowstone Grizzly Coordinating Committee (YGCC), and Interagency Grizzly Bear Committee (IGBC).
• Completed analysis of Greater Yellowstone grizzly bear distribution map. Publication scheduled for FY12.
• Prepared grizzly bear moth site use and hunter numbers chapters for IGBST Annual Report.
• Obtained additional funding through the Yellowstone Grizzly Bear Conservation Strategy to assist with data collection, nuisance management, and information and education efforts.
• Represented the Department on the completion and publication of the Western Association of Fish and Wildlife Agencies (WAFWA) Cougar Management Guidelines. Authored and edited several chapters.
• Completed all reporting requirements for Federal Section 6 and Conservation Strategy funding.
• Continued to coordinate with Idaho and Montana for allocating discretionary grizzly bear mortality.
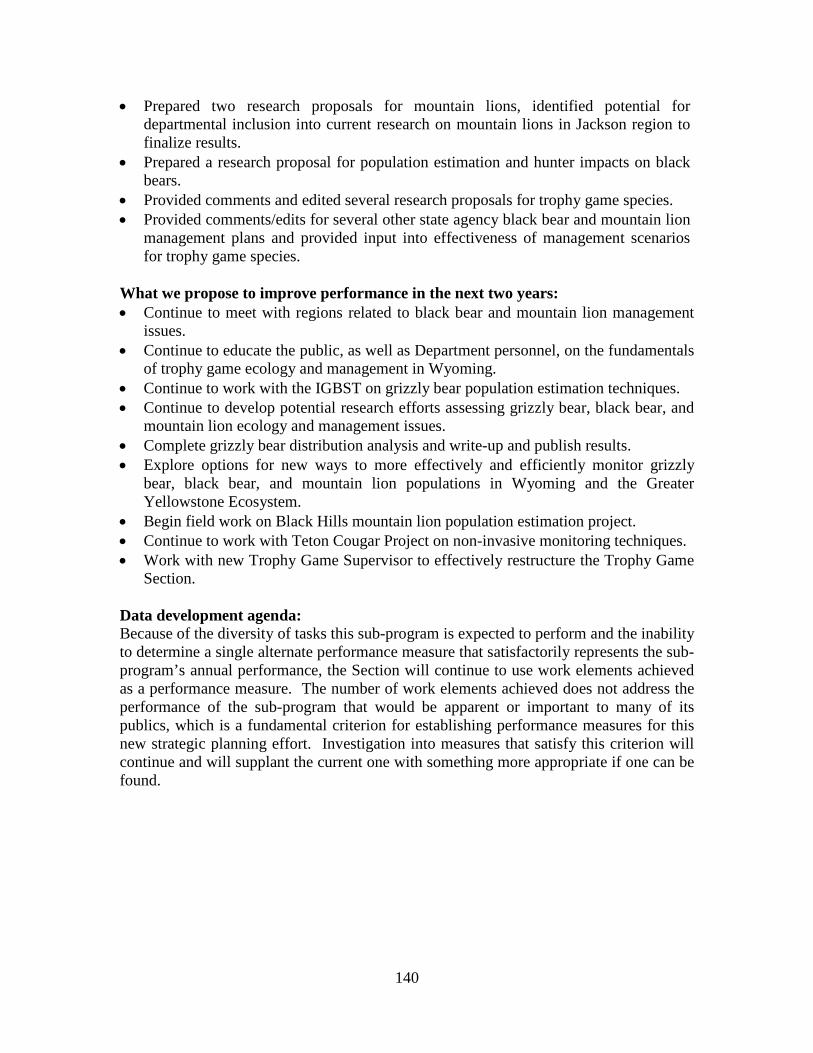
140
• Prepared two research proposals for mountain lions, identified potential for departmental inclusion into current research on mountain lions in Jackson region to finalize results.
• Prepared a research proposal for population estimation and hunter impacts on black bears.
• Provided comments and edited several research proposals for trophy game species. • Provided comments/edits for several other state agency black bear and mountain lion
management plans and provided input into effectiveness of management scenarios for trophy game species.
What we propose to improve performance in the next two years: • Continue to meet with regions related to black bear and mountain lion management
issues. • Continue to educate the public, as well as Department personnel, on the fundamentals
of trophy game ecology and management in Wyoming. • Continue to work with the IGBST on grizzly bear population estimation techniques. • Continue to develop potential research efforts assessing grizzly bear, black bear, and
mountain lion ecology and management issues. • Complete grizzly bear distribution analysis and write-up and publish results. • Explore options for new ways to more effectively and efficiently monitor grizzly
bear, black bear, and mountain lion populations in Wyoming and the Greater Yellowstone Ecosystem.
• Begin field work on Black Hills mountain lion population estimation project. • Continue to work with Teton Cougar Project on non-invasive monitoring techniques. • Work with new Trophy Game Supervisor to effectively restructure the Trophy Game
Section. Data development agenda: Because of the diversity of tasks this sub-program is expected to perform and the inability to determine a single alternate performance measure that satisfactorily represents the sub-program’s annual performance, the Section will continue to use work elements achieved as a performance measure. The number of work elements achieved does not address the performance of the sub-program that would be apparent or important to many of its publics, which is a fundamental criterion for establishing performance measures for this new strategic planning effort. Investigation into measures that satisfy this criterion will continue and will supplant the current one with something more appropriate if one can be found.
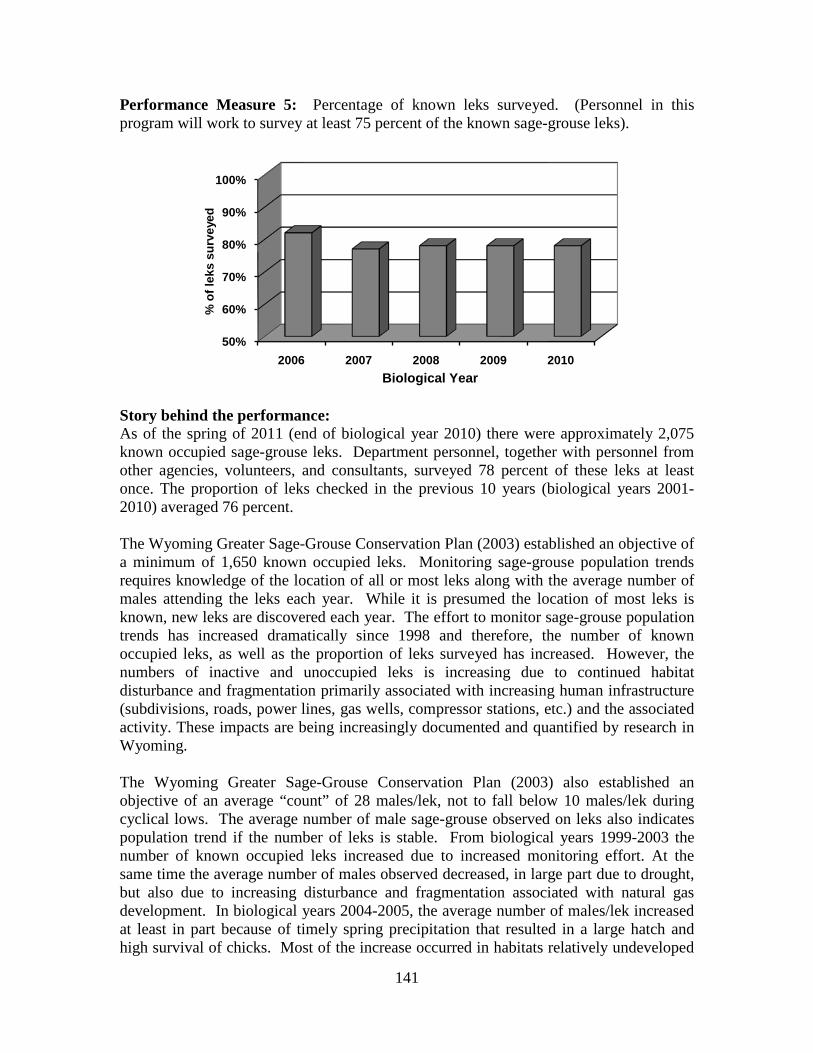
141
Performance Measure 5: Percentage of known leks surveyed. (Personnel in this program will work to survey at least 75 percent of the known sage-grouse leks).
Story behind the performance: As of the spring of 2011 (end of biological year 2010) there were approximately 2,075 known occupied sage-grouse leks. Department personnel, together with personnel from other agencies, volunteers, and consultants, surveyed 78 percent of these leks at least once. The proportion of leks checked in the previous 10 years (biological years 2001-2010) averaged 76 percent. The Wyoming Greater Sage-Grouse Conservation Plan (2003) established an objective of a minimum of 1,650 known occupied leks. Monitoring sage-grouse population trends requires knowledge of the location of all or most leks along with the average number of males attending the leks each year. While it is presumed the location of most leks is known, new leks are discovered each year. The effort to monitor sage-grouse population trends has increased dramatically since 1998 and therefore, the number of known occupied leks, as well as the proportion of leks surveyed has increased. However, the numbers of inactive and unoccupied leks is increasing due to continued habitat disturbance and fragmentation primarily associated with increasing human infrastructure (subdivisions, roads, power lines, gas wells, compressor stations, etc.) and the associated activity. These impacts are being increasingly documented and quantified by research in Wyoming. The Wyoming Greater Sage-Grouse Conservation Plan (2003) also established an objective of an average “count” of 28 males/lek, not to fall below 10 males/lek during cyclical lows. The average number of male sage-grouse observed on leks also indicates population trend if the number of leks is stable. From biological years 1999-2003 the number of known occupied leks increased due to increased monitoring effort. At the same time the average number of males observed decreased, in large part due to drought, but also due to increasing disturbance and fragmentation associated with natural gas development. In biological years 2004-2005, the average number of males/lek increased at least in part because of timely spring precipitation that resulted in a large hatch and high survival of chicks. Most of the increase occurred in habitats relatively undeveloped
50%
60%
70%
80%
90%
100%
2006 2007 2008 2009 2010
% o
f lek
s su
rvey
ed
Biological Year
142
with human infrastructure. The return of drought conditions in calendar years 2006 and 2007 contributed to declining sage-grouse numbers over the last four years. In the spring of 2011, the average number of males on “count” leks was 18, down from the recent high of 46/lek in the spring of 2006 but substantially higher than the low of nine/lek reported in 1995. Monitoring and research suggests sage-grouse populations cycle; similar to rabbits. This research and past history also suggests the statewide population is at or near the low point in the current cycle. In December 2007 a federal District Court judge ordered the U.S. Fish and Wildlife Service (Service) to reconsider its 2005 decision of “not warranted” for listing Greater Sage-grouse as threatened or endangered under the Endangered Species Act. On March 5, 2010 the Service issued its new decision of “warranted but precluded” which means Greater Sage-grouse have become a “candidate” for listing but are precluded from immediate listing due to higher priorities. This status is reviewed annually by the Service. In its decision document, the Service specifically cited Wyoming’s Core Area Strategy (described below) as a mechanism that, if implemented as envisioned, should ensure conservation of sage-grouse in Wyoming and therefore help preclude a future listing. The Wyoming Game and Fish Department and Commission maintain management authority over candidate species and management emphasis will continue to focus on implementation of Wyoming’s Core Area Strategy. What has been accomplished: • Governor Matt Mead issued an Executive Order on June 2, 2011 which reiterated and
clarified the intent of Wyoming’s Core Area Strategy originally developed under former Governor Freudenthal’s administration with the assistance of the Governor’s Sage-Grouse Implementation Team and the local sage-grouse working groups.
• Implementation of the Executive Order and the core area management concept has resulted in state and federal agency policy and stipulation changes, modifications of projects being implemented by the oil and gas industry, and curtailment or modification of some wind energy developments.
• The eight local sage-grouse working groups established in 2004 completed preparation of their respective conservation plans in 2006 and 2007. The plans are currently being implemented utilizing Wyoming General Fund appropriations ($3.7 million to date) together with other public and private funding sources. To date, approximately 115 individual projects have been implemented to benefit sage-grouse ranging from on-the-ground habitat improvements, applied research, monitoring, and public outreach. While the recent sage-grouse population trends cannot be attributed to these projects, long-term monitoring will ultimately measure their effectiveness.
• Annual job completion reports for sage-grouse were prepared. These reports provide sage-grouse population status and management updates from the eight conservation planning areas along with a statewide analysis. These documents aid in the analysis, interpretation, and distribution of sage-grouse population and management information in Wyoming.
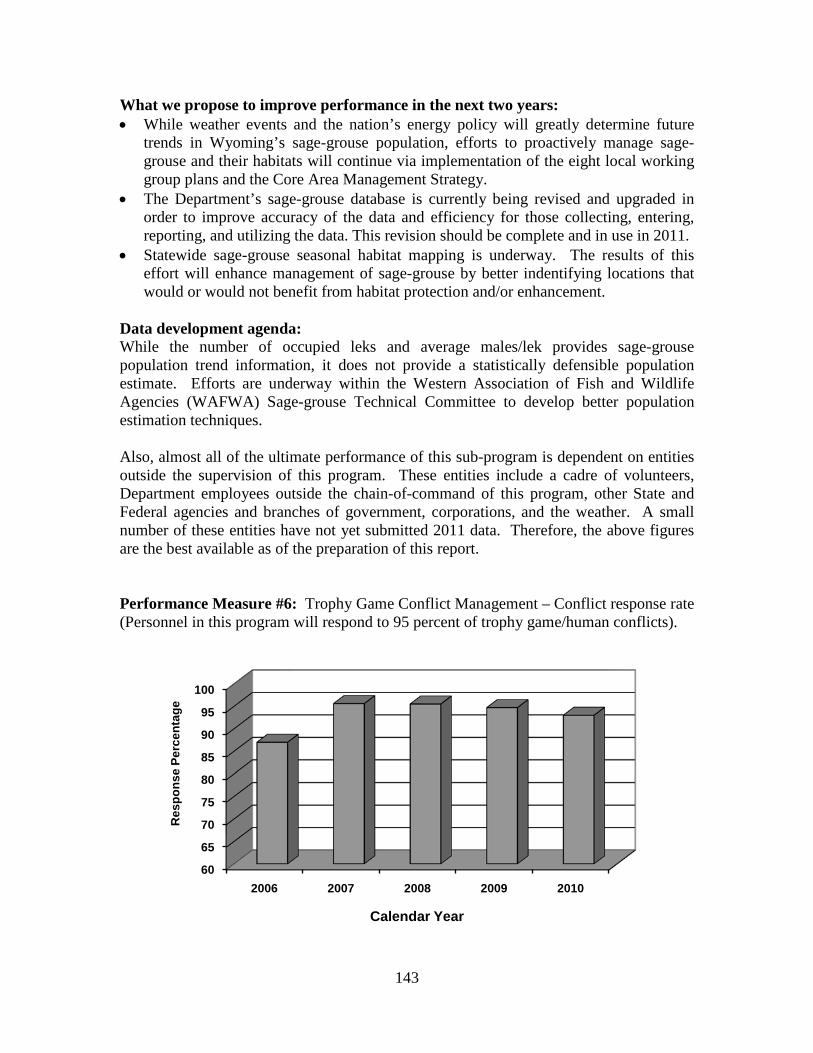
143
What we propose to improve performance in the next two years: • While weather events and the nation’s energy policy will greatly determine future
trends in Wyoming’s sage-grouse population, efforts to proactively manage sage-grouse and their habitats will continue via implementation of the eight local working group plans and the Core Area Management Strategy.
• The Department’s sage-grouse database is currently being revised and upgraded in order to improve accuracy of the data and efficiency for those collecting, entering, reporting, and utilizing the data. This revision should be complete and in use in 2011.
• Statewide sage-grouse seasonal habitat mapping is underway. The results of this effort will enhance management of sage-grouse by better indentifying locations that would or would not benefit from habitat protection and/or enhancement.
Data development agenda: While the number of occupied leks and average males/lek provides sage-grouse population trend information, it does not provide a statistically defensible population estimate. Efforts are underway within the Western Association of Fish and Wildlife Agencies (WAFWA) Sage-grouse Technical Committee to develop better population estimation techniques. Also, almost all of the ultimate performance of this sub-program is dependent on entities outside the supervision of this program. These entities include a cadre of volunteers, Department employees outside the chain-of-command of this program, other State and Federal agencies and branches of government, corporations, and the weather. A small number of these entities have not yet submitted 2011 data. Therefore, the above figures are the best available as of the preparation of this report. Performance Measure #6: Trophy Game Conflict Management – Conflict response rate (Personnel in this program will respond to 95 percent of trophy game/human conflicts).
60
65
70
75
80
85
90
95
100
2006 2007 2008 2009 2010
Res
pons
e Pe
rcen
tage
Calendar Year
144
Story behind the performance: The measure of this sub-program’s performance has been the response rate to the number of reported conflicts between trophy game animals and humans. Actions involved in responding to trophy game conflicts vary by incident type and severity, but may include relocating animals, removing animals, preventative measures, education, monitoring, investigation, or no action. During the five-year period 2006-2010, the Trophy Game Conflict Management Section has responded to an average of 93 percent of the conflicts reported by the public. Some conflicts are reported well beyond the time when a response is appropriate and are only logged into the database. Because the section spends a great deal of time responding to conflicts, the number and nature of which are difficult to predict, personnel allow for a certain amount of uncommitted time in their annual work schedules, especially during the black and grizzly bear non-denning period. The number of conflicts managed annually constitutes a large percentage of, but not all, the duties and tasks for which the section is responsible. What has been accomplished: The section responded to 93.0 percent (n=345) of reported (n=371) conflicts between humans and black bears, grizzly bears, gray wolves, and mountain lions during the reporting period. The section investigated, managed, or mitigated all conflicts where a response was appropriate. Some conflicts are reported long after the incident making a site response unnecessary. What we propose to improve performance in the next two years: • Continue to respond to and manage the majority of conflicts reported by the public. • Accommodate unplanned assignments. Data development agenda: The trend in number and types of conflicts will be documented as an index to response rate. The conflict management sub-program will determine its effectiveness by calculating the percentage of reported conflict situations responded to by section personnel.
145
Program: Strategic Management Division: Services Mission Statement: Facilitate the Department’s ability to make informed wildlife conservation decisions through improved future planning efforts and management effectiveness. Program Facts: The Strategic Management program is made up of one major sub-program, listed below with number of staff and 2011 (FY11) budget: Sub-program # FTEs* 2011 Annual Budget
Strategic Management 1.0 $ 111,479 *Includes permanent and contract positions authorized in FY11 budget. Any positions added during the budget cycle require Wyoming Game and Fish Commission authorization or must be funded from supplemental grants. This program is located in the Department Headquarters Office in Cheyenne. Primary Functions of the Strategic Management Program: • Facilitate the Department’s ability to make informed wildlife conservation
decisions through improved future planning efforts. By assisting in the development of strategic plans, the Department’s ability to set goals and measure progress in achieving them is improved.
• Facilitate the Department’s ability to make informed wildlife conservation decisions through improved management effectiveness. By applying social sciences to natural resource-related issues, the Department’s ability to identify and understand a diverse group of stakeholders is improved, thus leading to more informed and publicly supported management decisions.
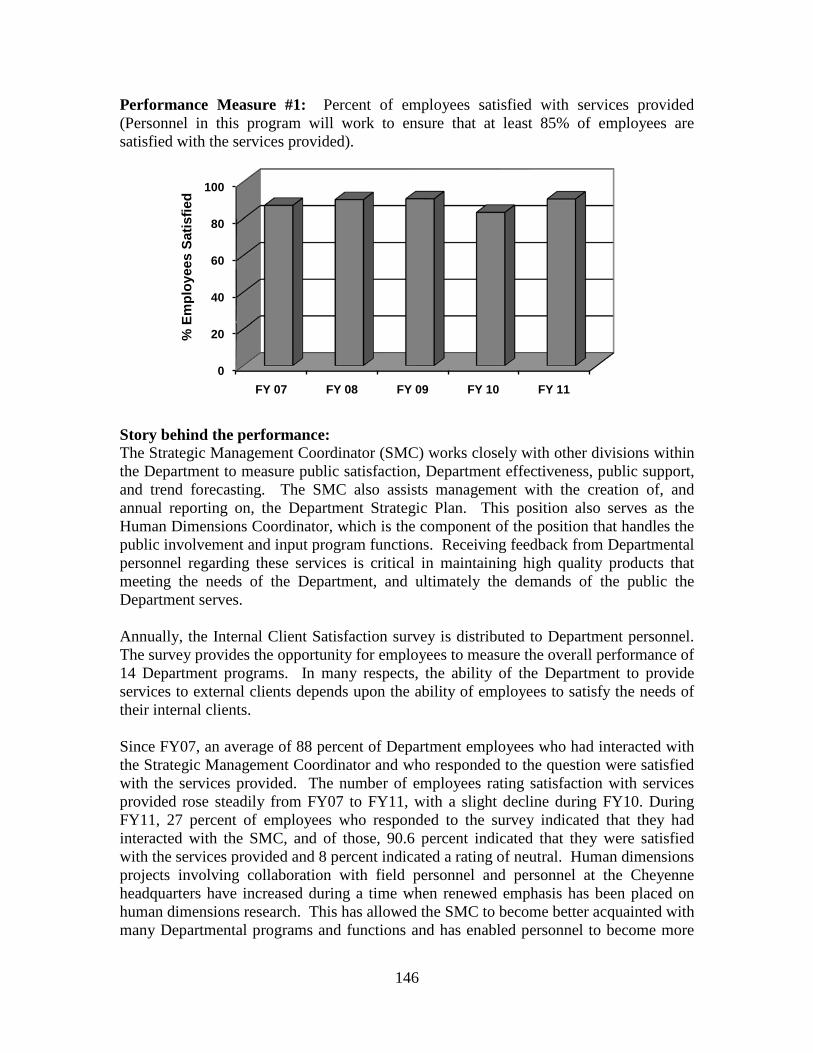
146
Performance Measure #1: Percent of employees satisfied with services provided (Personnel in this program will work to ensure that at least 85% of employees are satisfied with the services provided).
Story behind the performance: The Strategic Management Coordinator (SMC) works closely with other divisions within the Department to measure public satisfaction, Department effectiveness, public support, and trend forecasting. The SMC also assists management with the creation of, and annual reporting on, the Department Strategic Plan. This position also serves as the Human Dimensions Coordinator, which is the component of the position that handles the public involvement and input program functions. Receiving feedback from Departmental personnel regarding these services is critical in maintaining high quality products that meeting the needs of the Department, and ultimately the demands of the public the Department serves. Annually, the Internal Client Satisfaction survey is distributed to Department personnel. The survey provides the opportunity for employees to measure the overall performance of 14 Department programs. In many respects, the ability of the Department to provide services to external clients depends upon the ability of employees to satisfy the needs of their internal clients. Since FY07, an average of 88 percent of Department employees who had interacted with the Strategic Management Coordinator and who responded to the question were satisfied with the services provided. The number of employees rating satisfaction with services provided rose steadily from FY07 to FY11, with a slight decline during FY10. During FY11, 27 percent of employees who responded to the survey indicated that they had interacted with the SMC, and of those, 90.6 percent indicated that they were satisfied with the services provided and 8 percent indicated a rating of neutral. Human dimensions projects involving collaboration with field personnel and personnel at the Cheyenne headquarters have increased during a time when renewed emphasis has been placed on human dimensions research. This has allowed the SMC to become better acquainted with many Departmental programs and functions and has enabled personnel to become more
0
20
40
60
80
100
FY 07 FY 08 FY 09 FY 10 FY 11
% E
mpl
oyee
s Sa
tisfie
d
147
familiar with the information human dimensions research can provide. The process for prioritizing human dimensions projects through communication with each division and the Director’s Office in preparation for each upcoming fiscal year has continued. However, the expansion in scope of ongoing projects and the revision of the Departmental Strategic Plan increased workloads and hindered the ability to move to other prioritized projects. During FY11, the majority of the SMC’s time was spent on a few high-level projects, allowing the opportunity to focus attention and offer services at a higher level than in the previous fiscal year. Continued high satisfaction in results were found in survey questions about (1) attention and timeliness and (2) courteousness and professionalism. For FY11, satisfaction with the level of courteousness and professionalism displayed by the Strategic Management Coordinator was at 96.9 percent. Satisfaction with attention and timeliness increased from 88.5 percent in FY10 to 92.2 percent in FY11. What we propose to improve performance in the next two years: • Continue to create a prioritized list of projects for each year, created jointly with
Department administration. Work with Division administration to ensure practical timelines and priorities based on workload constraints. When other tasks are assigned that were not originally on the prioritized list, examine their level of importance and re-evaluate the list. Should it be determined that the proposed task is not a priority, or if the proposed task will take priority over other planned projects, in a timely and professional manner, clearly explain to requesting personnel the implications of new projects. This effort should maintain communication between the Strategic Management Coordinator and Department personnel.
• Develop a feedback loop for each human dimensions project. Identify personnel at the beginning of project development for feedback relative to each project in order to assess levels of timeliness and service throughout the fiscal year, and make corrections where needed on ensuing projects. This will allow for improved services based directly on the needs of the personnel with whom the Strategic Management Coordinator works most often and give insight relative to the annual satisfaction survey.
• Continue to work with Division personnel to refine the process of submitting and compiling necessary information for both the Department’s Strategic Plan and Annual Report. By doing so, communication with the Strategic Management Coordinator should be improved, adding to internal customer satisfaction both with that facet of collaboration and with timeliness of this service.
• Further identify the purview of the Strategic Management Coordinator to clarify the duties inherent to the position as well as anticipated time spent on each of the categories of duty in order to aid in the prioritization of projects and recurring Departmental needs.
148
Program: Support Facilities and Personnel Division: Fiscal and Services Division Mission: Provide adequate administrative support services and workspace for Cheyenne headquarters and regional office personnel in Department facilities. Program Facts: The Support Facilities and Personnel Program is listed below with number of staff and 2011 budget: Sub-programs # FTEs* 2011 Annual Budget
Regional Office Management 20.0 $ 1,376,639 Headquarters and Regional Office Buildings 2.5 1,306,501
TOTAL 22.5 $ 2,683,140 *Includes permanent, contract, and temporary positions authorized in the FY2011 budget. Any positions added during the budget cycle require Wyoming Game and Fish Commission authorization or must be funded from supplemental grants. This program is located in eight regional office locations statewide plus the Department Headquarters Office in Cheyenne. Primary Functions of the Support Facilities and Personnel Program: • We ensure administrative support levels at regional facilities to provide adequate
clerical, logistical, and financial services for field personnel so that their primary functions can be satisfactorily completed.
• We ensure that office environments are adequate for Department employees by ensuring routine maintenance is performed and adequate office space is provided so employees can accomplish their primary job functions.
Performance Measure #1: Employee satisfaction with level of regional office management support.
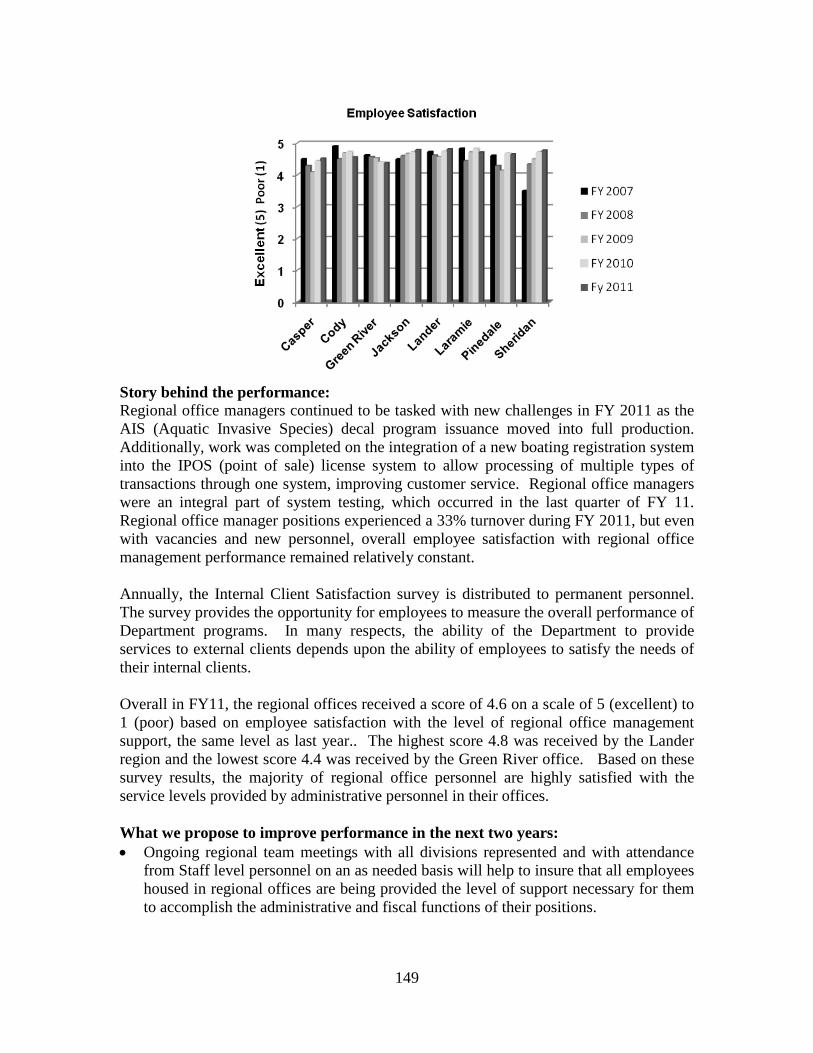
149
Story behind the performance: Regional office managers continued to be tasked with new challenges in FY 2011 as the AIS (Aquatic Invasive Species) decal program issuance moved into full production. Additionally, work was completed on the integration of a new boating registration system into the IPOS (point of sale) license system to allow processing of multiple types of transactions through one system, improving customer service. Regional office managers were an integral part of system testing, which occurred in the last quarter of FY 11. Regional office manager positions experienced a 33% turnover during FY 2011, but even with vacancies and new personnel, overall employee satisfaction with regional office management performance remained relatively constant. Annually, the Internal Client Satisfaction survey is distributed to permanent personnel. The survey provides the opportunity for employees to measure the overall performance of Department programs. In many respects, the ability of the Department to provide services to external clients depends upon the ability of employees to satisfy the needs of their internal clients. Overall in FY11, the regional offices received a score of 4.6 on a scale of 5 (excellent) to 1 (poor) based on employee satisfaction with the level of regional office management support, the same level as last year.. The highest score 4.8 was received by the Lander region and the lowest score 4.4 was received by the Green River office. Based on these survey results, the majority of regional office personnel are highly satisfied with the service levels provided by administrative personnel in their offices. What we propose to improve performance in the next two years: • Ongoing regional team meetings with all divisions represented and with attendance
from Staff level personnel on an as needed basis will help to insure that all employees housed in regional offices are being provided the level of support necessary for them to accomplish the administrative and fiscal functions of their positions.
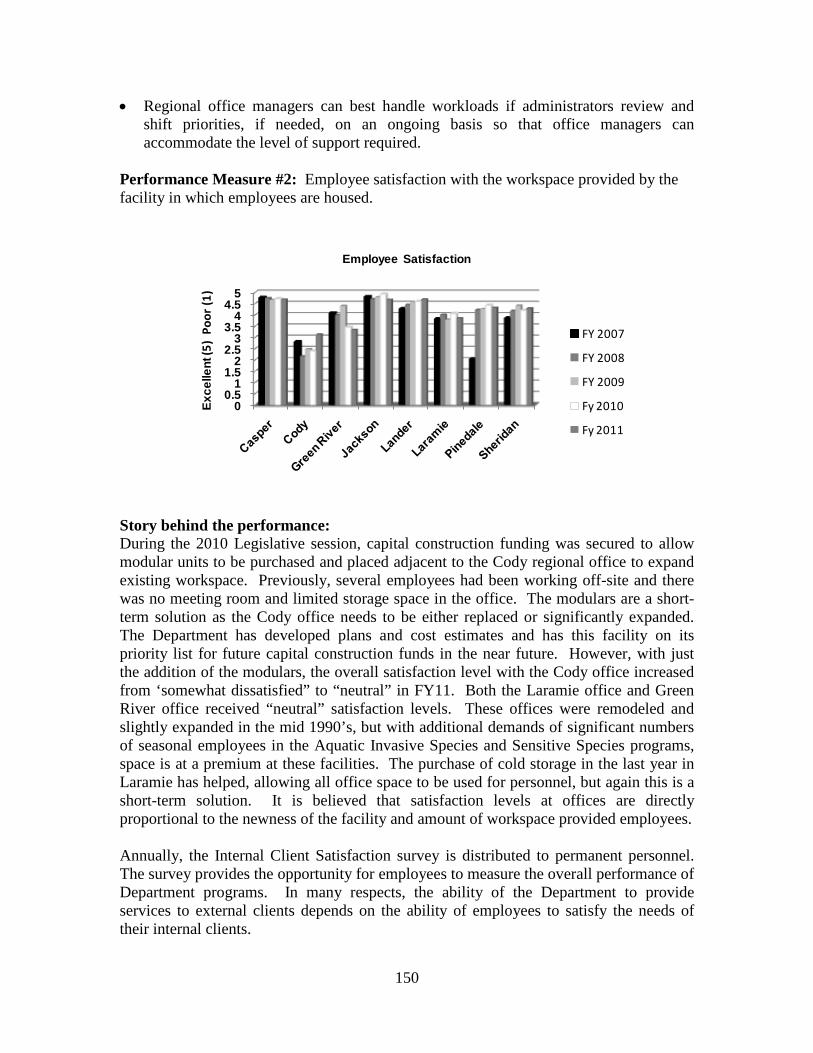
150
• Regional office managers can best handle workloads if administrators review and shift priorities, if needed, on an ongoing basis so that office managers can accommodate the level of support required.
Performance Measure #2: Employee satisfaction with the workspace provided by the facility in which employees are housed.
00.5
11.5
22.5
33.5
44.5
5
Exce
llent
(5)
Poor
(1)
Employee Satisfaction
FY 2007
FY 2008
FY 2009
Fy 2010
Fy 2011
Story behind the performance: During the 2010 Legislative session, capital construction funding was secured to allow modular units to be purchased and placed adjacent to the Cody regional office to expand existing workspace. Previously, several employees had been working off-site and there was no meeting room and limited storage space in the office. The modulars are a short-term solution as the Cody office needs to be either replaced or significantly expanded. The Department has developed plans and cost estimates and has this facility on its priority list for future capital construction funds in the near future. However, with just the addition of the modulars, the overall satisfaction level with the Cody office increased from ‘somewhat dissatisfied” to “neutral” in FY11. Both the Laramie office and Green River office received “neutral” satisfaction levels. These offices were remodeled and slightly expanded in the mid 1990’s, but with additional demands of significant numbers of seasonal employees in the Aquatic Invasive Species and Sensitive Species programs, space is at a premium at these facilities. The purchase of cold storage in the last year in Laramie has helped, allowing all office space to be used for personnel, but again this is a short-term solution. It is believed that satisfaction levels at offices are directly proportional to the newness of the facility and amount of workspace provided employees. Annually, the Internal Client Satisfaction survey is distributed to permanent personnel. The survey provides the opportunity for employees to measure the overall performance of Department programs. In many respects, the ability of the Department to provide services to external clients depends on the ability of employees to satisfy the needs of their internal clients.

151
Overall in FY11 the regional offices received a score of 4.1 on a scale of 5 (excellent) to 1 (poor) based on employee satisfaction with the workspace provided by the facility in which they are housed, approximately the same as in FY10. The highest score 4.7 was received by the Lander area, in which renovation of the old regional facility was completed last year, expanding storage and meeting space; the lowest score, 3.1, was in the Cody region; however, this was up from 2.4 in the previous year. What we propose to improve performance in the next two years: • The Department will be continue to work on obtaining funding for both the Cody and
Laramie offices in the near future, potentially including general fund capital construction requests for one or both of these facilities. The Cody regional office replacement/expansion remains the Department’s first priority for administrative facilities. The Department wants to insure that any evaluation considers location as it relates to meeting customer needs, in addition to adequate office and storage space.
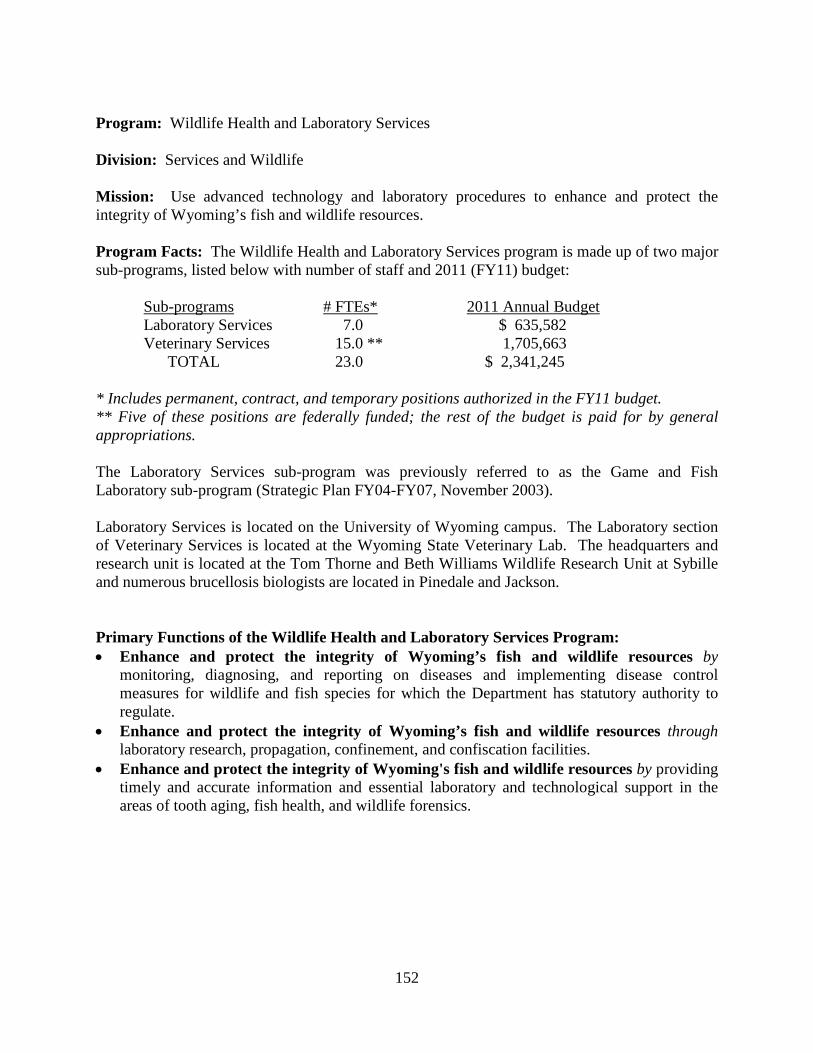
152
Program: Wildlife Health and Laboratory Services Division: Services and Wildlife Mission: Use advanced technology and laboratory procedures to enhance and protect the integrity of Wyoming’s fish and wildlife resources. Program Facts: The Wildlife Health and Laboratory Services program is made up of two major sub-programs, listed below with number of staff and 2011 (FY11) budget: Sub-programs # FTEs* 2011 Annual Budget Laboratory Services 7.0 $ 635,582 Veterinary Services 15.0 ** 1,705,663 TOTAL 23.0 $ 2,341,245 * Includes permanent, contract, and temporary positions authorized in the FY11 budget. ** Five of these positions are federally funded; the rest of the budget is paid for by general appropriations. The Laboratory Services sub-program was previously referred to as the Game and Fish Laboratory sub-program (Strategic Plan FY04-FY07, November 2003). Laboratory Services is located on the University of Wyoming campus. The Laboratory section of Veterinary Services is located at the Wyoming State Veterinary Lab. The headquarters and research unit is located at the Tom Thorne and Beth Williams Wildlife Research Unit at Sybille and numerous brucellosis biologists are located in Pinedale and Jackson. Primary Functions of the Wildlife Health and Laboratory Services Program: • Enhance and protect the integrity of Wyoming’s fish and wildlife resources by
monitoring, diagnosing, and reporting on diseases and implementing disease control measures for wildlife and fish species for which the Department has statutory authority to regulate.
• Enhance and protect the integrity of Wyoming’s fish and wildlife resources through laboratory research, propagation, confinement, and confiscation facilities.
• Enhance and protect the integrity of Wyoming's fish and wildlife resources by providing timely and accurate information and essential laboratory and technological support in the areas of tooth aging, fish health, and wildlife forensics.
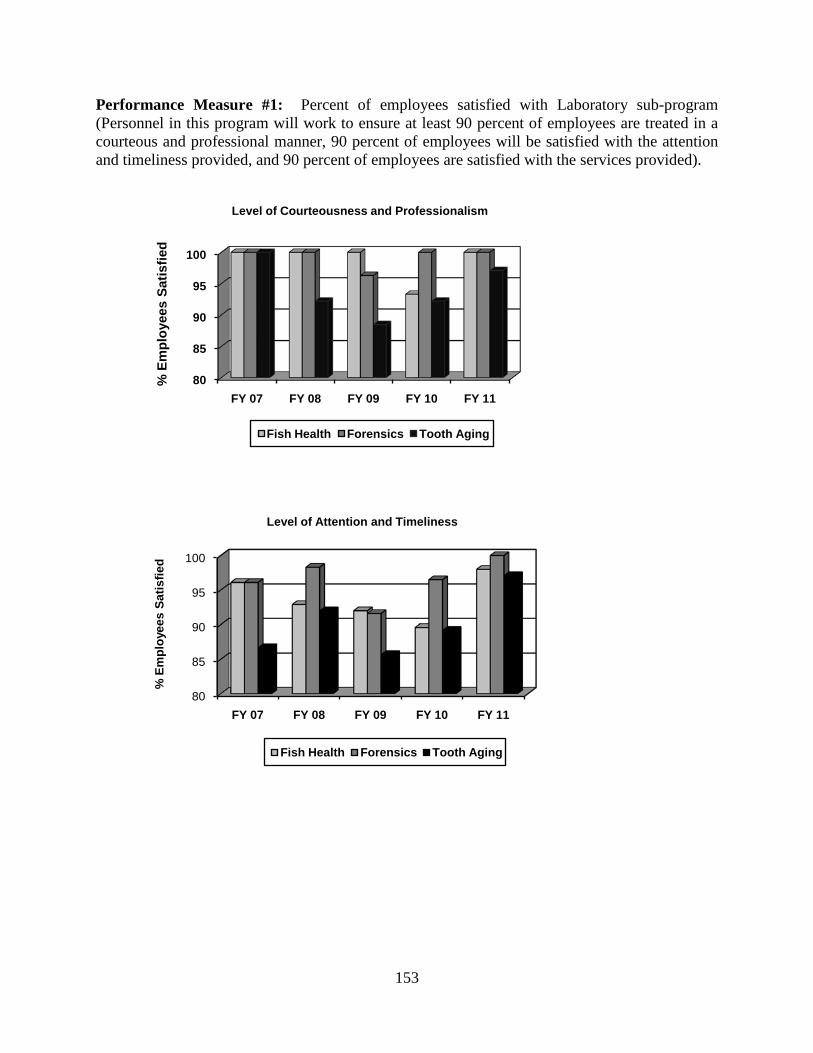
153
Performance Measure #1: Percent of employees satisfied with Laboratory sub-program (Personnel in this program will work to ensure at least 90 percent of employees are treated in a courteous and professional manner, 90 percent of employees will be satisfied with the attention and timeliness provided, and 90 percent of employees are satisfied with the services provided).
80
85
90
95
100
FY 07 FY 08 FY 09 FY 10 FY 11
% E
mpl
oyee
s Sa
tisfie
d
Level of Courteousness and Professionalism
Fish Health Forensics Tooth Aging
80
85
90
95
100
FY 07 FY 08 FY 09 FY 10 FY 11
% E
mpl
oyee
s Sa
tisfie
d
Level of Attention and Timeliness
Fish Health Forensics Tooth Aging
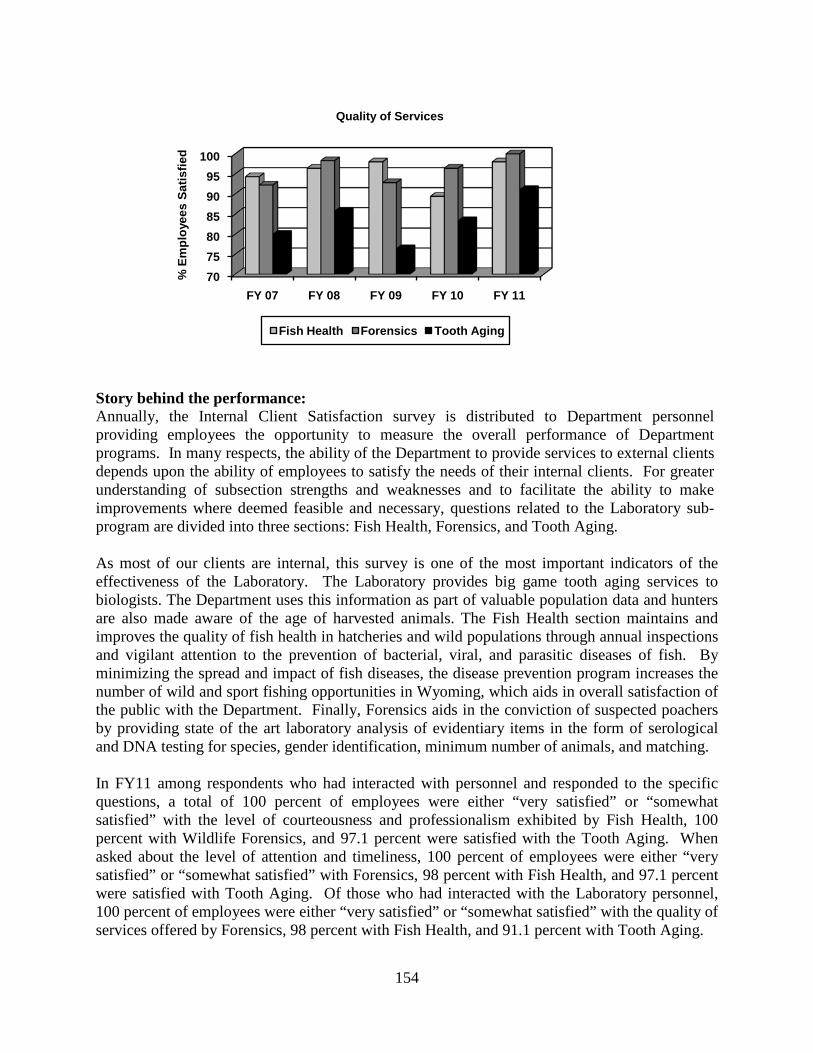
154
Story behind the performance: Annually, the Internal Client Satisfaction survey is distributed to Department personnel providing employees the opportunity to measure the overall performance of Department programs. In many respects, the ability of the Department to provide services to external clients depends upon the ability of employees to satisfy the needs of their internal clients. For greater understanding of subsection strengths and weaknesses and to facilitate the ability to make improvements where deemed feasible and necessary, questions related to the Laboratory sub-program are divided into three sections: Fish Health, Forensics, and Tooth Aging. As most of our clients are internal, this survey is one of the most important indicators of the effectiveness of the Laboratory. The Laboratory provides big game tooth aging services to biologists. The Department uses this information as part of valuable population data and hunters are also made aware of the age of harvested animals. The Fish Health section maintains and improves the quality of fish health in hatcheries and wild populations through annual inspections and vigilant attention to the prevention of bacterial, viral, and parasitic diseases of fish. By minimizing the spread and impact of fish diseases, the disease prevention program increases the number of wild and sport fishing opportunities in Wyoming, which aids in overall satisfaction of the public with the Department. Finally, Forensics aids in the conviction of suspected poachers by providing state of the art laboratory analysis of evidentiary items in the form of serological and DNA testing for species, gender identification, minimum number of animals, and matching. In FY11 among respondents who had interacted with personnel and responded to the specific questions, a total of 100 percent of employees were either “very satisfied” or “somewhat satisfied” with the level of courteousness and professionalism exhibited by Fish Health, 100 percent with Wildlife Forensics, and 97.1 percent were satisfied with the Tooth Aging. When asked about the level of attention and timeliness, 100 percent of employees were either “very satisfied” or “somewhat satisfied” with Forensics, 98 percent with Fish Health, and 97.1 percent were satisfied with Tooth Aging. Of those who had interacted with the Laboratory personnel, 100 percent of employees were either “very satisfied” or “somewhat satisfied” with the quality of services offered by Forensics, 98 percent with Fish Health, and 91.1 percent with Tooth Aging.
707580859095
100
FY 07 FY 08 FY 09 FY 10 FY 11
% E
mpl
oyee
s Sa
tisfie
d
Quality of Services
Fish Health Forensics Tooth Aging
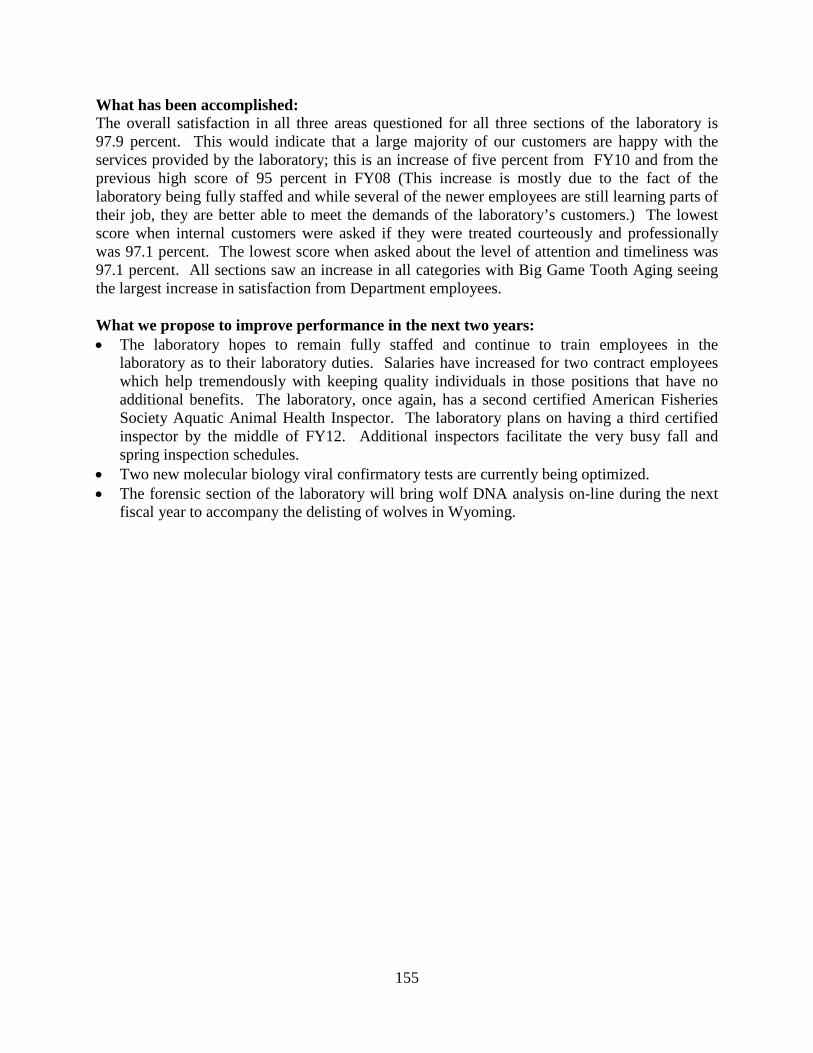
155
What has been accomplished: The overall satisfaction in all three areas questioned for all three sections of the laboratory is 97.9 percent. This would indicate that a large majority of our customers are happy with the services provided by the laboratory; this is an increase of five percent from FY10 and from the previous high score of 95 percent in FY08 (This increase is mostly due to the fact of the laboratory being fully staffed and while several of the newer employees are still learning parts of their job, they are better able to meet the demands of the laboratory’s customers.) The lowest score when internal customers were asked if they were treated courteously and professionally was 97.1 percent. The lowest score when asked about the level of attention and timeliness was 97.1 percent. All sections saw an increase in all categories with Big Game Tooth Aging seeing the largest increase in satisfaction from Department employees. What we propose to improve performance in the next two years: • The laboratory hopes to remain fully staffed and continue to train employees in the
laboratory as to their laboratory duties. Salaries have increased for two contract employees which help tremendously with keeping quality individuals in those positions that have no additional benefits. The laboratory, once again, has a second certified American Fisheries Society Aquatic Animal Health Inspector. The laboratory plans on having a third certified inspector by the middle of FY12. Additional inspectors facilitate the very busy fall and spring inspection schedules.
• Two new molecular biology viral confirmatory tests are currently being optimized. • The forensic section of the laboratory will bring wolf DNA analysis on-line during the next
fiscal year to accompany the delisting of wolves in Wyoming.
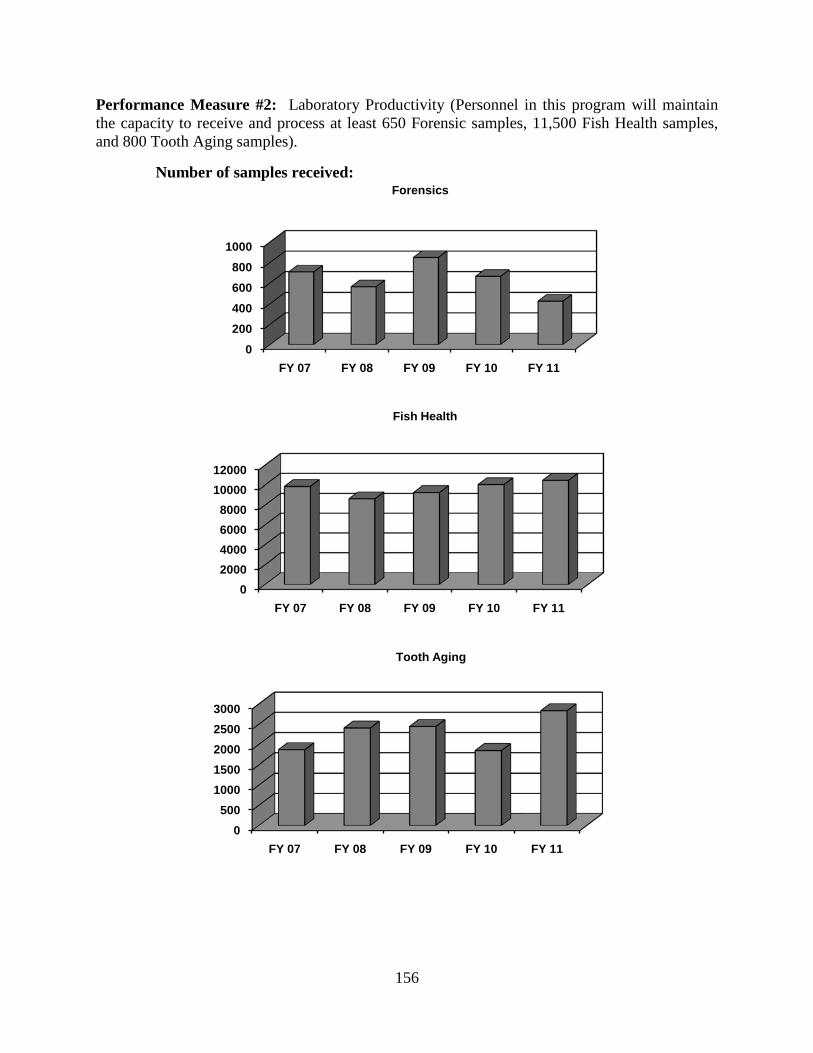
156
Performance Measure #2: Laboratory Productivity (Personnel in this program will maintain the capacity to receive and process at least 650 Forensic samples, 11,500 Fish Health samples, and 800 Tooth Aging samples).
Number of samples received:
0200400600800
1000
FY 07 FY 08 FY 09 FY 10 FY 11
Forensics
02000400060008000
1000012000
FY 07 FY 08 FY 09 FY 10 FY 11
Fish Health
0500
10001500200025003000
FY 07 FY 08 FY 09 FY 10 FY 11
Tooth Aging
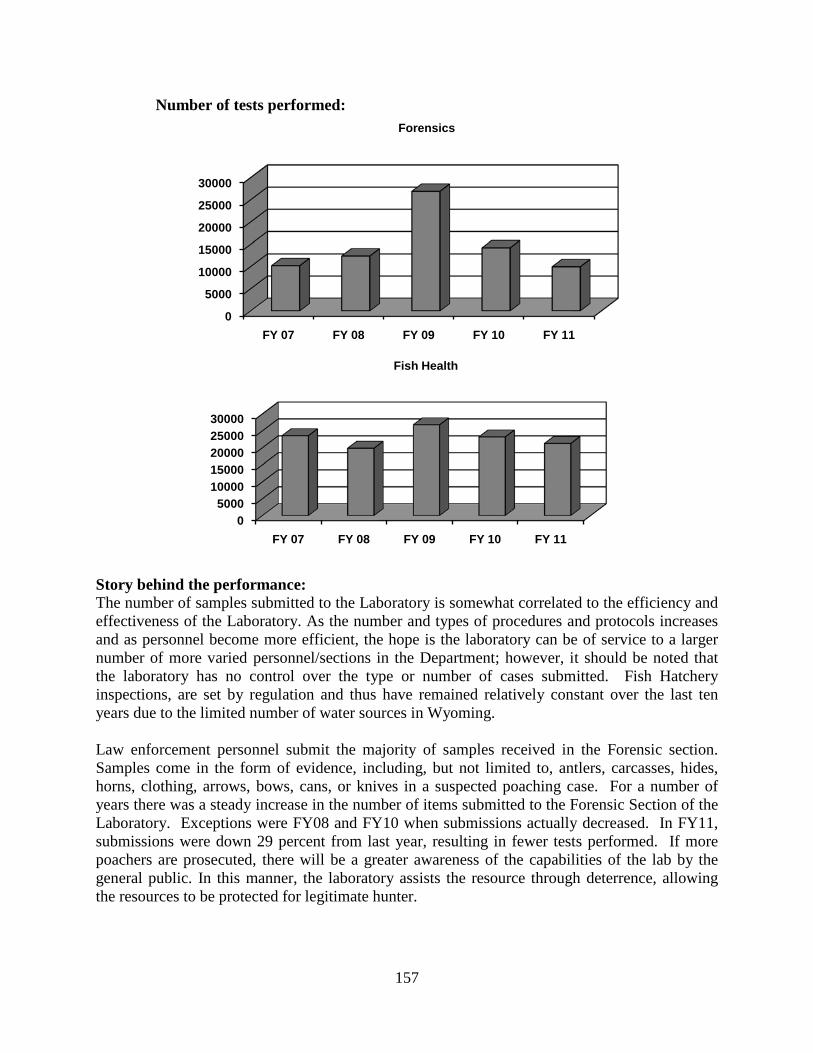
157
Number of tests performed:
Story behind the performance: The number of samples submitted to the Laboratory is somewhat correlated to the efficiency and effectiveness of the Laboratory. As the number and types of procedures and protocols increases and as personnel become more efficient, the hope is the laboratory can be of service to a larger number of more varied personnel/sections in the Department; however, it should be noted that the laboratory has no control over the type or number of cases submitted. Fish Hatchery inspections, are set by regulation and thus have remained relatively constant over the last ten years due to the limited number of water sources in Wyoming. Law enforcement personnel submit the majority of samples received in the Forensic section. Samples come in the form of evidence, including, but not limited to, antlers, carcasses, hides, horns, clothing, arrows, bows, cans, or knives in a suspected poaching case. For a number of years there was a steady increase in the number of items submitted to the Forensic Section of the Laboratory. Exceptions were FY08 and FY10 when submissions actually decreased. In FY11, submissions were down 29 percent from last year, resulting in fewer tests performed. If more poachers are prosecuted, there will be a greater awareness of the capabilities of the lab by the general public. In this manner, the laboratory assists the resource through deterrence, allowing the resources to be protected for legitimate hunter.
0
5000
10000
15000
20000
25000
30000
FY 07 FY 08 FY 09 FY 10 FY 11
Forensics
05000
1000015000200002500030000
FY 07 FY 08 FY 09 FY 10 FY 11
Fish Health
158
The majority of fish health samples submitted to the Laboratory come from inspections conducted by Fish Health Section personnel at state and private hatcheries, as well as fish from federal spawning operations. These samples most often consist of kidney, spleen, ovarian, or seminal samples, and fish heads. A number of fish are also submitted for necropsies or diagnostic analysis following die-offs or when fish become sick in a culture situation. The frequency of regulatory fish health inspections is set by Wyoming Game and Fish Commission Chapter 10 regulations and the Fish Health Section of the American Fisheries Society (AFS) sets sample size numbers. The number of hatchery inspections in Wyoming continues to remain relatively constant due the limited availability of water sources for state hatcheries and the restrictive commercial market for private hatcheries. In most instances, the number of tests conducted is directly correlated to the number of samples received in the Fish Health section. The number of diagnostic cases decreases in this year to 68 from a high of last year of 82. The decrease in cases has to do with many of the facilities completing construction projects and hatchery managers using decreased density of fish to manage for disease. As part of the disease prevention program, Wyoming Game and Fish regulations require all hatcheries have a certificate of disease free status prior to receiving approval for public or private stocking. This disease prevention program is essential to maintaining healthy fish populations in the state. The reoccurrence of whirling disease in two hatcheries greatly increased workloads in the area of whirling disease analysis. It should be noted that numerous tests are performed on each sample in both the Fish Health section and the Forensic section. The number of tests performed, is dependent on the sample type and the requested analysis by the submitting officer or biologist. This flexibility in analysis accounts for the variability in the number of tests performed annually. The number of samples submitted to the Tooth Aging section of the Laboratory is equal to the number of test performed; therefore, the first figure comprises both statistics. Hunters and Department biologists submit these samples. Only critical herd units/species are still being analyzed in the Laboratory. What has been accomplished: The Wyoming Game and Fish Wildlife Forensic laboratory continues to work with the Society for Wildlife Forensic Science to further the science of wildlife forensics. In the fall of 2010, the Society put together a Scientific Working Group for Wildlife Forensics (SWGWILD). The group is working closely with the Society on meeting new federal mandates that are anticipated to become law within the next three to five years. SWGWILD is nearing completion on a Certification Scheme as well as standardization utilizing a “Standards and Guidelines” document for non-human genetics and morphology. The Wyoming Game and Fish laboratory has two members participating on the new SWGWILD group; one is the chair of the white-paper sub-committee and the second is the Secretary for the group. SWGWILD also hopes to work with accreditation agencies to determine the appropriate requirements for non-human forensic laboratories. The Laboratory Director is serving as President of the Society for four more years and the Forensic Analyst is serving as Communication Director for the next year.
159
The Fish Health Section continues to study the American Fisheries Society Blue Book requirements and continuously changes and improves the protocols of the fish health laboratory to bring them up to this standard. While this has significantly increased the workload in this section, it will serve to increase the credibility of the laboratory. What we propose to improve performance in the next two years: • The Laboratory has set up an account/fund with the Wildlife Heritage Foundation called the
“Donation Fund for the Advancement of Wildlife Forensics”. Donations will be accepted in law enforcement cases, and outside agencies will be solicited for donations.
• Continue to work on expanding more open lines of communication between Laboratory personnel and Wildlife and Fish Division personnel by having annual joint coordination meetings with agency staff. Requests for new technical procedures are continually evaluated and feasibility studies initiated if needed. These new procedures will then be brought on-line in the Laboratory. These changes in procedures often result in expanded use of the Laboratory services by field personnel.
• Continued education of all new fish culture and law enforcement personnel in the Department will result in more knowledge about laboratory sampling requirements and will improve the quality of sample submission and will facilitate better overall utilization of the capabilities of the laboratory.
• Provide continuous formal education of all the employees in the laboratory whether through the University of Wyoming or through more specialized training of the laboratory professionals.
• The Fish Health Section is going through the Department’s Leadership Development program with one employee in LD1 and another in LD2.
• Additional disease confirmation tests will be brought on-line in the Fish Health Section of the Laboratory, following the current guidelines of the American Fisheries Society’s Standards.
• Additional analysis in the area of tooth aging is being pursued.
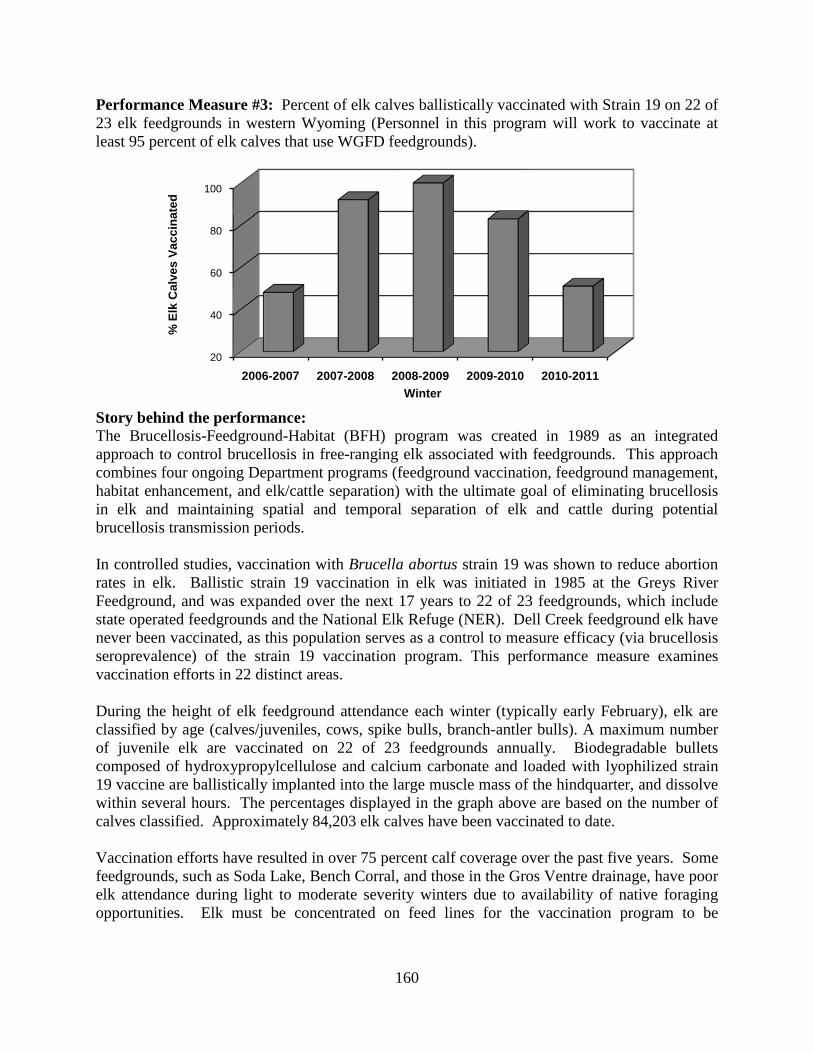
160
Performance Measure #3: Percent of elk calves ballistically vaccinated with Strain 19 on 22 of 23 elk feedgrounds in western Wyoming (Personnel in this program will work to vaccinate at least 95 percent of elk calves that use WGFD feedgrounds).
Story behind the performance: The Brucellosis-Feedground-Habitat (BFH) program was created in 1989 as an integrated approach to control brucellosis in free-ranging elk associated with feedgrounds. This approach combines four ongoing Department programs (feedground vaccination, feedground management, habitat enhancement, and elk/cattle separation) with the ultimate goal of eliminating brucellosis in elk and maintaining spatial and temporal separation of elk and cattle during potential brucellosis transmission periods. In controlled studies, vaccination with Brucella abortus strain 19 was shown to reduce abortion rates in elk. Ballistic strain 19 vaccination in elk was initiated in 1985 at the Greys River Feedground, and was expanded over the next 17 years to 22 of 23 feedgrounds, which include state operated feedgrounds and the National Elk Refuge (NER). Dell Creek feedground elk have never been vaccinated, as this population serves as a control to measure efficacy (via brucellosis seroprevalence) of the strain 19 vaccination program. This performance measure examines vaccination efforts in 22 distinct areas. During the height of elk feedground attendance each winter (typically early February), elk are classified by age (calves/juveniles, cows, spike bulls, branch-antler bulls). A maximum number of juvenile elk are vaccinated on 22 of 23 feedgrounds annually. Biodegradable bullets composed of hydroxypropylcellulose and calcium carbonate and loaded with lyophilized strain 19 vaccine are ballistically implanted into the large muscle mass of the hindquarter, and dissolve within several hours. The percentages displayed in the graph above are based on the number of calves classified. Approximately 84,203 elk calves have been vaccinated to date. Vaccination efforts have resulted in over 75 percent calf coverage over the past five years. Some feedgrounds, such as Soda Lake, Bench Corral, and those in the Gros Ventre drainage, have poor elk attendance during light to moderate severity winters due to availability of native foraging opportunities. Elk must be concentrated on feed lines for the vaccination program to be
20
40
60
80
100
2006-2007 2007-2008 2008-2009 2009-2010 2010-2011
% E
lk C
alve
s Va
ccin
ated
Winter
161
effective. Thus, recent year’s vaccination coverage should be considered the maximum and increased effort will not increase percent of calves vaccinated. Typically, deep snow conditions results in greater tolerance of elk to disturbances associated with vaccination efforts. During winter 2009-2010 winter conditions were moderate, which facilitated 83 percent of all elk calves attending feedgrounds to be vaccinated. This year, an equipment failure at the National Veterinary Services Laboratory (NVSL) in Iowa, the sole producer of Brucella S19 vaccine in the U.S., resulted in no vaccine produced. Thus, the only vaccine available for use during winter 2010-2011 were around 2,000 doses leftover from the previous winter stored in a deep freezer at the Pinedale regional office. To make the best use of these limited doses, feedgrounds were prioritized according to juxtaposition of cattle; elk calves attending those feedgrounds nearest cattle operations received vaccine, and those feedgrounds distant from wintering cattle were not vaccinated. Additionally, due to logistics of Federal agreements and hiring of temporary employees, vaccination of elk calves was implemented on the NER. What has been accomplished: Strain 19 calfhood vaccination was conducted on the following feedgrounds that were considered high priority due to their location in relation to wintering cattle and other logistics; the NER, Alpine, South Park, Horse Creek, Camp Creek, Alpine, McNeel, Franz, Black Butte, Jewett, and Finnegan. Among these, several sites reported over 100 percent coverage, which suggests yearling females were boosted. Vaccination did not occur on feedgrounds in the Gros Ventre, Dog Creek, Green River Lakes, Forest Park, or Bench Corral due to the vaccine shortage. Additionally, vaccination did not occur on the Fall, Scab, and Muddy Creek feedgrounds this winter to avoid complications with false positive titers during post test and slaughter project sero-surveillance. A total of 2,032 calves (83% of those classified among vaccinated feedgrounds) were vaccinated on 11 feedgrounds during winter 2009-2010. A total of 1,535 elk calves were not attempted to be vaccinated on 10 feedgrounds due to the vaccine shortage and concerns with the test and slaughter project follow-up sero-surveillance. Proposals to improve performance in the next two years: • Although winter conditions and availability of native forage affect elk tolerance of
vaccination efforts, and are likely the primary factors influencing this performance measure, BFH personnel will continue to maintain vaccination equipment in proper functioning condition and work closely with feedground personnel to ensure vaccination equipment is delivered promptly when conditions are most conducive for vaccination. The NVSL is in the process of installing and testing/certifying a new lyophilizing machine to avoid vaccine production failures in the future.
Data development agenda: The percent of elk calves vaccinated for those classified on feedgrounds is important information for documenting the success of the strain 19 vaccination program delivery method. However, the successful delivery of the vaccine does not ensure the program is efficacious in reducing the occurrence of brucellosis in elk, specifically brucellosis transmission among elk and from elk to cattle. Current research using vaginal implant transmitters has been expanded to vaccinated and
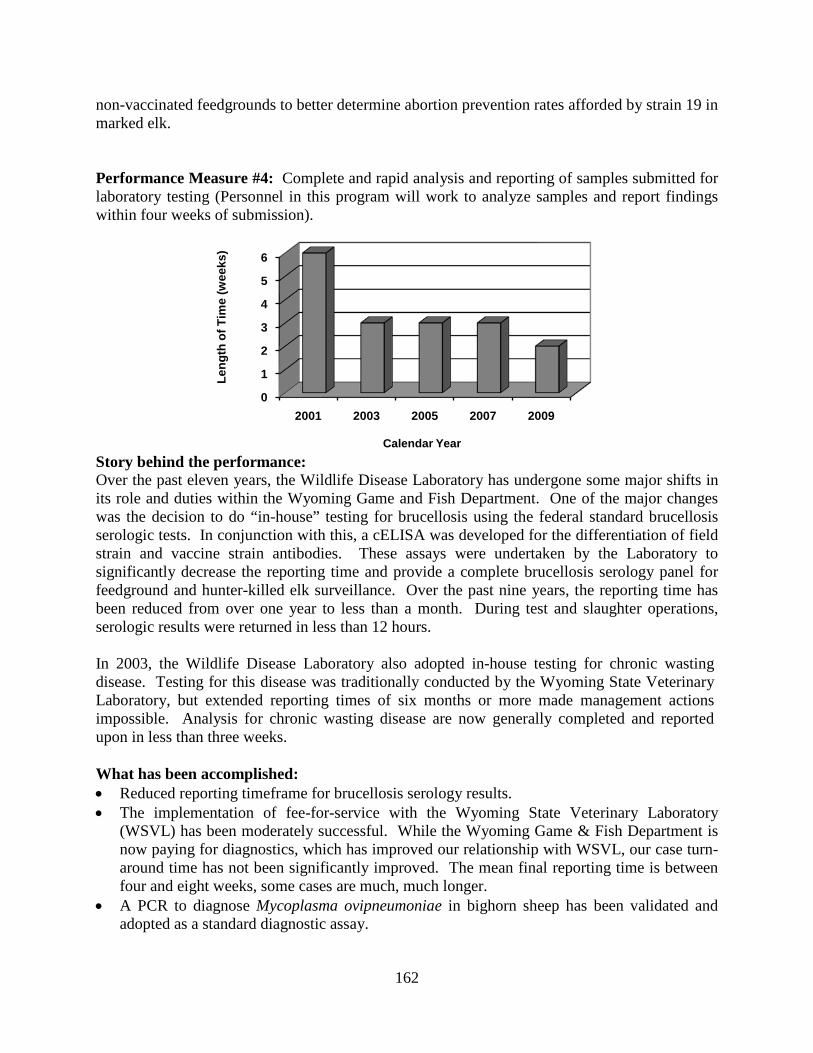
162
non-vaccinated feedgrounds to better determine abortion prevention rates afforded by strain 19 in marked elk. Performance Measure #4: Complete and rapid analysis and reporting of samples submitted for laboratory testing (Personnel in this program will work to analyze samples and report findings within four weeks of submission).
Story behind the performance: Over the past eleven years, the Wildlife Disease Laboratory has undergone some major shifts in its role and duties within the Wyoming Game and Fish Department. One of the major changes was the decision to do “in-house” testing for brucellosis using the federal standard brucellosis serologic tests. In conjunction with this, a cELISA was developed for the differentiation of field strain and vaccine strain antibodies. These assays were undertaken by the Laboratory to significantly decrease the reporting time and provide a complete brucellosis serology panel for feedground and hunter-killed elk surveillance. Over the past nine years, the reporting time has been reduced from over one year to less than a month. During test and slaughter operations, serologic results were returned in less than 12 hours. In 2003, the Wildlife Disease Laboratory also adopted in-house testing for chronic wasting disease. Testing for this disease was traditionally conducted by the Wyoming State Veterinary Laboratory, but extended reporting times of six months or more made management actions impossible. Analysis for chronic wasting disease are now generally completed and reported upon in less than three weeks. What has been accomplished: • Reduced reporting timeframe for brucellosis serology results. • The implementation of fee-for-service with the Wyoming State Veterinary Laboratory
(WSVL) has been moderately successful. While the Wyoming Game & Fish Department is now paying for diagnostics, which has improved our relationship with WSVL, our case turn-around time has not been significantly improved. The mean final reporting time is between four and eight weeks, some cases are much, much longer.
• A PCR to diagnose Mycoplasma ovipneumoniae in bighorn sheep has been validated and adopted as a standard diagnostic assay.
0
1
2
3
4
5
6
2001 2003 2005 2007 2009
Leng
th o
f Tim
e (w
eeks
)
Calendar Year
163
• Implemented culture and isolation of Fusobacterium necrophorum, the causative agent for necrotic stomatitis in elk.
• Aided in the design and construction oversight of new BSL-2 and BSL-3 laboratory space. In July of 2010, the laboratory moved into over 860 sq ft of new space for wildlife disease diagnostics.
• A Brucella spp. PCR was brought on line as part of our standard diagnostics to identify culture isolates within the Brucella family.
• Implemented Mannheimia haemolytica and Pasteurella multocida culture and isolation; two common causes of pneumonia in bighorn sheep.
• The implementation of Yersinia enterocolitica PCR and culture. Antibodies against this organism are known to cross-react on standard brucella serological assays, making accurate brucellosis diagnostics difficult.
• Implementation of quality assurance and quality control on all reagents, media, assay controls, and instrumentation used in disease diagnostics. All test results are now traceable to the certificate of analysis for reagents, quality control on media traceability, and verification of assay controls, as well as maintenance and calibration records on all instrumentation.
• Improved budget management and fiscal tracking of laboratory expenditures. This includes shortened GF-01 processing times and monitoring/tracking Wyoming State Veterinary Laboratory billing for diagnostic services.
• Increased and improved our collaborative research efforts with the University of Wyoming and other researchers; resulting in the co-authorship of eight scientific publications in the past two years.
• Continued statewide surveillance for chronic wasting disease in deer, elk, and moose. Results were returned to hunters in less than three weeks and a final departmental report in less than 90 days.
• Continued statewide brucellosis surveillance in hunter-killed elk and bison. Analysis and final reports were provided to department administration/personnel in less than 90 days.
What we propose to improve performance in the next two years: • Continue collaboration with the University of Wyoming and other researchers on the
development of a serological assay to differentiate Brucella abortus specific antibodies from those produced in response to Yersinia enterocolitica infection.
• Obtain American Association of Veterinary Laboratory Diagnosticians accreditation for the Wildlife Disease Laboratory.
• Validate and implement PHA/PHI serological testing for Yersinia pestis exposure. • Complete analysis of the test and slaughter program to determine which serological assay is
the best predictor of culture positive elk, as well as identifying those tissues most likely to harbor B. abortus.
• Develop, validate, and implement Fusobacterium necrophorum PCR as a standard diagnostic service.
• Improve the response time on field disease investigations, including field necropsy and carcass retrieval.
• Develop, validate, and implement Mannheimia haemolytica and Pasteurella multocida PCRs as standard diagnostic services.

164
• Aid in the CDC certification of the new BSL-3 select agent research and diagnostic laboratory at WSVL. This includes obtaining federal certification of Jessica Jennings-Gains for the select agent program as well as SOP development and practice.
• Develop, validate, and implement Mycoplasma spp. culture as a standard diagnostic service. • Research the need, practicality, and feasibility of implementing a bluetongue/EHD PCR for
rapid diagnosis of these diseases.
APPENDIX A:
INDIVIDUAL MANAGEMENT
PROGRAMS
BIG GAME
Pronghorn
Elk
Mule Deer
White-tailed Deer
Moose
Bighorn Sheep
Rocky Mountain Goat
Bison
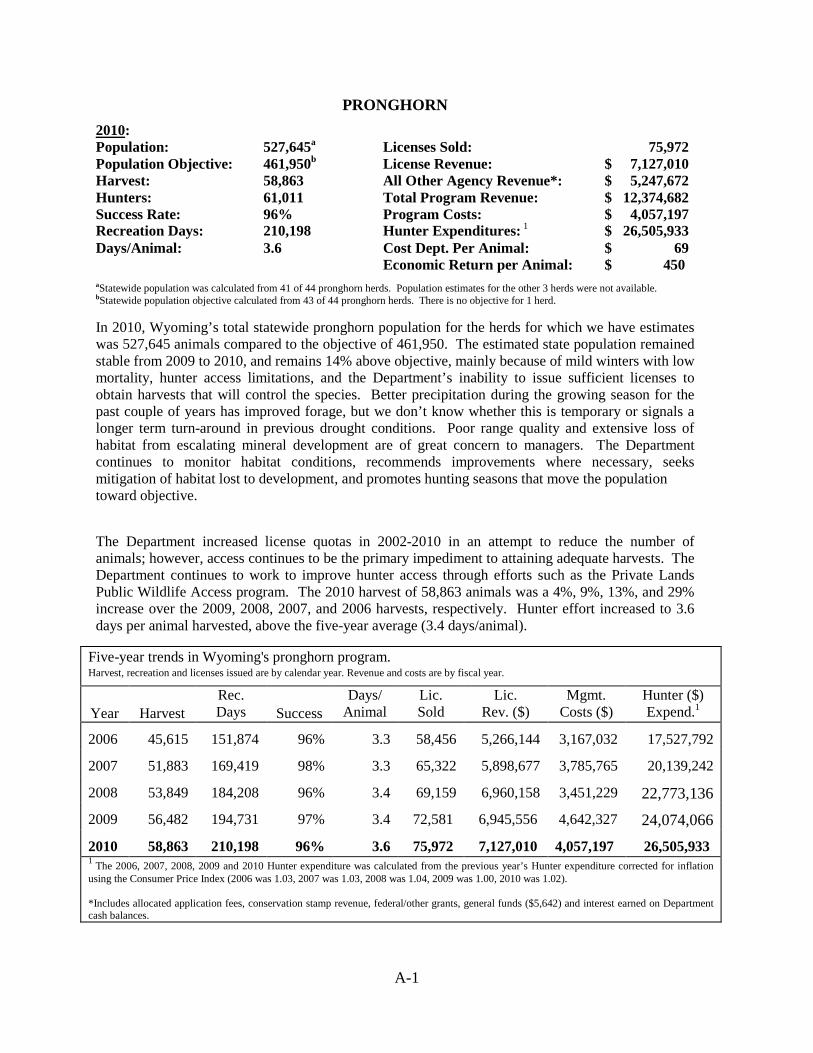
A-1
PRONGHORN
2010: Population: 527,645a Licenses Sold: 75,972 Population Objective: 461,950b License Revenue: $ 7,127,010 Harvest: 58,863 All Other Agency Revenue*: $ 5,247,672 Hunters: 61,011 Total Program Revenue: $ 12,374,682 Success Rate: 96% Program Costs: $ 4,057,197 Recreation Days: 210,198 Hunter Expenditures: 1 $ 26,505,933 Days/Animal: 3.6 Cost Dept. Per Animal: $ 69 Economic Return per Animal: $ 450 aStatewide population was calculated from 41 of 44 pronghorn herds. Population estimates for the other 3 herds were not available. bStatewide population objective calculated from 43 of 44 pronghorn herds. There is no objective for 1 herd. In 2010, Wyoming’s total statewide pronghorn population for the herds for which we have estimates was 527,645 animals compared to the objective of 461,950. The estimated state population remained stable from 2009 to 2010, and remains 14% above objective, mainly because of mild winters with low mortality, hunter access limitations, and the Department’s inability to issue sufficient licenses to obtain harvests that will control the species. Better precipitation during the growing season for the past couple of years has improved forage, but we don’t know whether this is temporary or signals a longer term turn-around in previous drought conditions. Poor range quality and extensive loss of habitat from escalating mineral development are of great concern to managers. The Department continues to monitor habitat conditions, recommends improvements where necessary, seeks mitigation of habitat lost to development, and promotes hunting seasons that move the population toward objective. The Department increased license quotas in 2002-2010 in an attempt to reduce the number of animals; however, access continues to be the primary impediment to attaining adequate harvests. The Department continues to work to improve hunter access through efforts such as the Private Lands Public Wildlife Access program. The 2010 harvest of 58,863 animals was a 4%, 9%, 13%, and 29% increase over the 2009, 2008, 2007, and 2006 harvests, respectively. Hunter effort increased to 3.6 days per animal harvested, above the five-year average (3.4 days/animal).
Five-year trends in Wyoming's pronghorn program. Harvest, recreation and licenses issued are by calendar year. Revenue and costs are by fiscal year.
Year
Harvest
Rec. Days
Success
Days/ Animal
Lic. Sold
Lic. Rev. ($)
Mgmt. Costs ($)
Hunter ($) Expend.1
2006 45,615 151,874 96% 3.3 58,456 5,266,144 3,167,032 17,527,792
2007 51,883 169,419 98% 3.3 65,322 5,898,677 3,785,765 20,139,242
2008 53,849 184,208 96% 3.4 69,159 6,960,158 3,451,229 22,773,136 2009 56,482 194,731 97% 3.4 72,581 6,945,556 4,642,327 24,074,066 2010 58,863 210,198 96% 3.6 75,972 7,127,010 4,057,197 26,505,933 1 The 2006, 2007, 2008, 2009 and 2010 Hunter expenditure was calculated from the previous year’s Hunter expenditure corrected for inflation using the Consumer Price Index (2006 was 1.03, 2007 was 1.03, 2008 was 1.04, 2009 was 1.00, 2010 was 1.02). *Includes allocated application fees, conservation stamp revenue, federal/other grants, general funds ($5,642) and interest earned on Department cash balances.
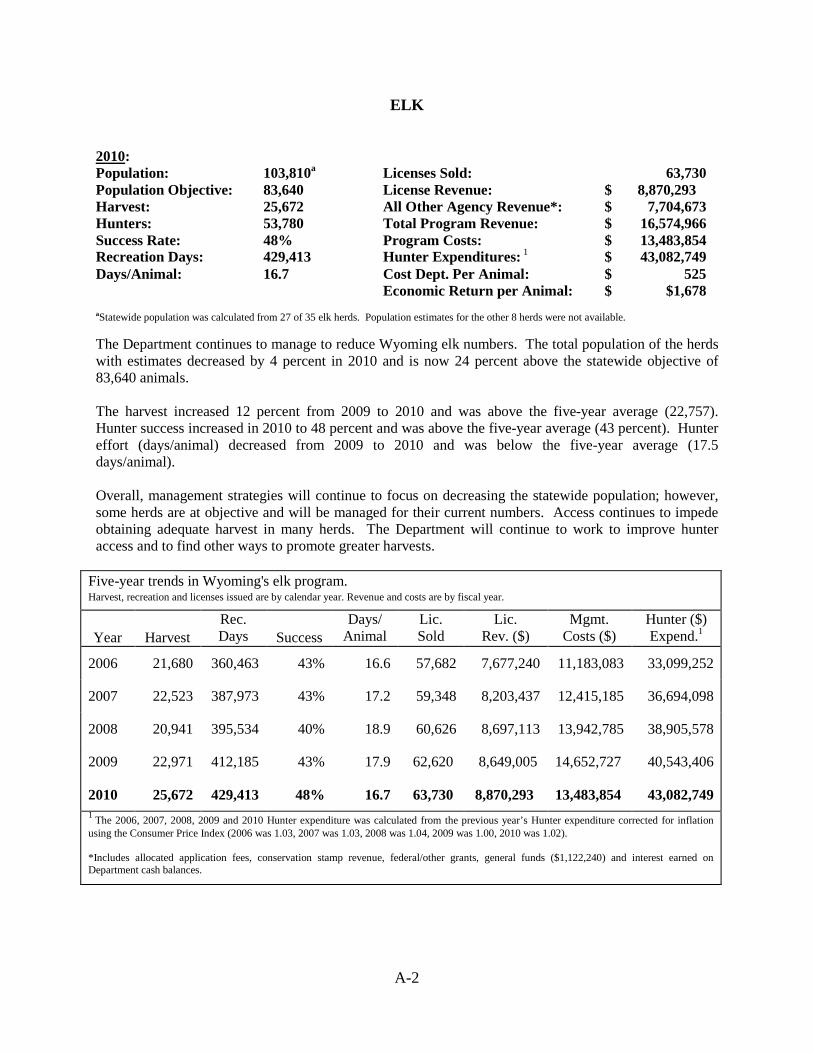
A-2
ELK 2010: Population: 103,810a Licenses Sold: 63,730 Population Objective: 83,640 License Revenue: $ 8,870,293 Harvest: 25,672 All Other Agency Revenue*: $ 7,704,673 Hunters: 53,780 Total Program Revenue: $ 16,574,966 Success Rate: 48% Program Costs: $ 13,483,854 Recreation Days: 429,413 Hunter Expenditures: 1 $ 43,082,749 Days/Animal: 16.7 Cost Dept. Per Animal: $ 525 Economic Return per Animal: $ $1,678 aStatewide population was calculated from 27 of 35 elk herds. Population estimates for the other 8 herds were not available. The Department continues to manage to reduce Wyoming elk numbers. The total population of the herds with estimates decreased by 4 percent in 2010 and is now 24 percent above the statewide objective of 83,640 animals. The harvest increased 12 percent from 2009 to 2010 and was above the five-year average (22,757). Hunter success increased in 2010 to 48 percent and was above the five-year average (43 percent). Hunter effort (days/animal) decreased from 2009 to 2010 and was below the five-year average (17.5 days/animal). Overall, management strategies will continue to focus on decreasing the statewide population; however, some herds are at objective and will be managed for their current numbers. Access continues to impede obtaining adequate harvest in many herds. The Department will continue to work to improve hunter access and to find other ways to promote greater harvests.
Five-year trends in Wyoming's elk program. Harvest, recreation and licenses issued are by calendar year. Revenue and costs are by fiscal year.
Year
Harvest
Rec. Days
Success
Days/ Animal
Lic. Sold
Lic. Rev. ($)
Mgmt. Costs ($)
Hunter ($) Expend.1
2006 21,680 360,463 43% 16.6 57,682 7,677,240 11,183,083 33,099,252
2007 22,523 387,973 43% 17.2 59,348 8,203,437 12,415,185 36,694,098
2008 20,941 395,534 40% 18.9 60,626 8,697,113 13,942,785 38,905,578
2009 22,971 412,185 43% 17.9 62,620 8,649,005 14,652,727 40,543,406
2010 25,672 429,413 48% 16.7 63,730 8,870,293 13,483,854 43,082,749 1 The 2006, 2007, 2008, 2009 and 2010 Hunter expenditure was calculated from the previous year’s Hunter expenditure corrected for inflation using the Consumer Price Index (2006 was 1.03, 2007 was 1.03, 2008 was 1.04, 2009 was 1.00, 2010 was 1.02). *Includes allocated application fees, conservation stamp revenue, federal/other grants, general funds ($1,122,240) and interest earned on Department cash balances.
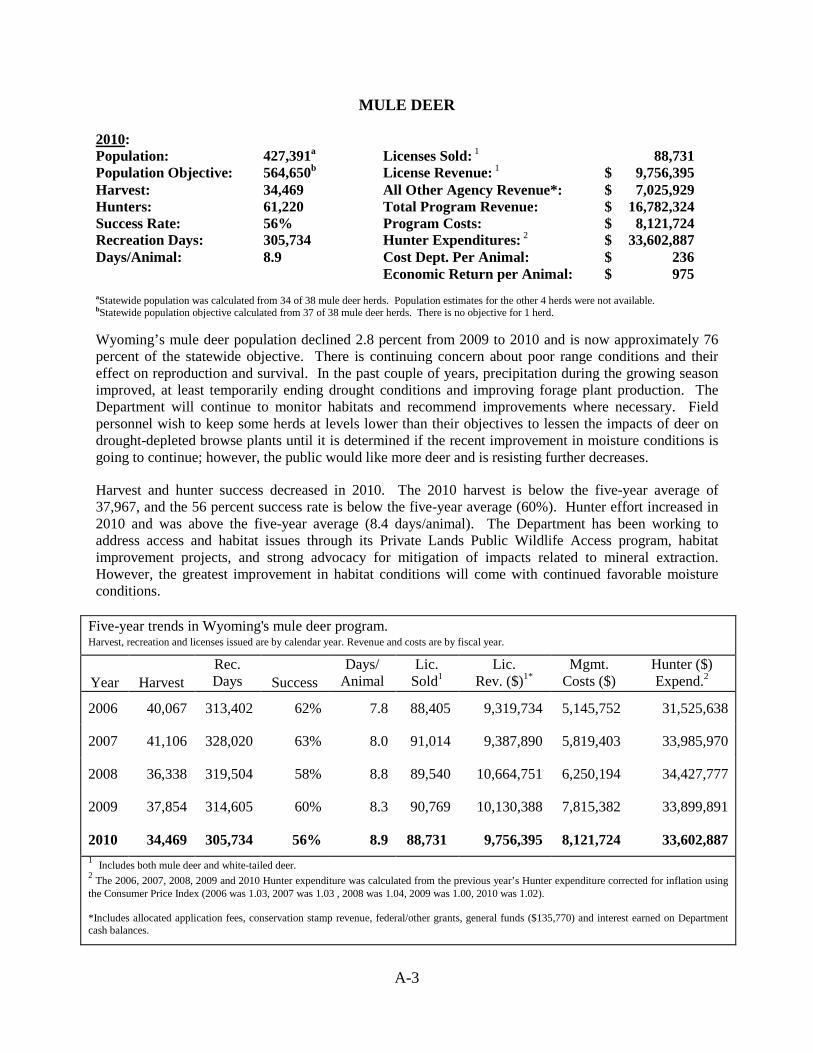
A-3
MULE DEER 2010: Population: 427,391a Licenses Sold: 1 88,731 Population Objective: 564,650b License Revenue: 1 $ 9,756,395 Harvest: 34,469 All Other Agency Revenue*: $ 7,025,929 Hunters: 61,220 Total Program Revenue: $ 16,782,324 Success Rate: 56% Program Costs: $ 8,121,724 Recreation Days: 305,734 Hunter Expenditures: 2 $ 33,602,887 Days/Animal: 8.9 Cost Dept. Per Animal: $ 236 Economic Return per Animal: $ 975
aStatewide population was calculated from 34 of 38 mule deer herds. Population estimates for the other 4 herds were not available. bStatewide population objective calculated from 37 of 38 mule deer herds. There is no objective for 1 herd. Wyoming’s mule deer population declined 2.8 percent from 2009 to 2010 and is now approximately 76 percent of the statewide objective. There is continuing concern about poor range conditions and their effect on reproduction and survival. In the past couple of years, precipitation during the growing season improved, at least temporarily ending drought conditions and improving forage plant production. The Department will continue to monitor habitats and recommend improvements where necessary. Field personnel wish to keep some herds at levels lower than their objectives to lessen the impacts of deer on drought-depleted browse plants until it is determined if the recent improvement in moisture conditions is going to continue; however, the public would like more deer and is resisting further decreases.
Harvest and hunter success decreased in 2010. The 2010 harvest is below the five-year average of 37,967, and the 56 percent success rate is below the five-year average (60%). Hunter effort increased in 2010 and was above the five-year average (8.4 days/animal). The Department has been working to address access and habitat issues through its Private Lands Public Wildlife Access program, habitat improvement projects, and strong advocacy for mitigation of impacts related to mineral extraction. However, the greatest improvement in habitat conditions will come with continued favorable moisture conditions.
Five-year trends in Wyoming's mule deer program. Harvest, recreation and licenses issued are by calendar year. Revenue and costs are by fiscal year.
Year
Harvest
Rec. Days
Success
Days/ Animal
Lic. Sold1
Lic. Rev. ($)1*
Mgmt. Costs ($)
Hunter ($) Expend.2
2006 40,067 313,402 62% 7.8 88,405 9,319,734 5,145,752 31,525,638
2007 41,106 328,020 63% 8.0 91,014 9,387,890 5,819,403 33,985,970
2008 36,338 319,504 58% 8.8 89,540 10,664,751 6,250,194 34,427,777
2009 37,854 314,605 60% 8.3 90,769 10,130,388 7,815,382 33,899,891
2010 34,469 305,734 56% 8.9 88,731 9,756,395 8,121,724 33,602,887 1 Includes both mule deer and white-tailed deer. 2 The 2006, 2007, 2008, 2009 and 2010 Hunter expenditure was calculated from the previous year’s Hunter expenditure corrected for inflation using the Consumer Price Index (2006 was 1.03, 2007 was 1.03 , 2008 was 1.04, 2009 was 1.00, 2010 was 1.02). *Includes allocated application fees, conservation stamp revenue, federal/other grants, general funds ($135,770) and interest earned on Department cash balances.
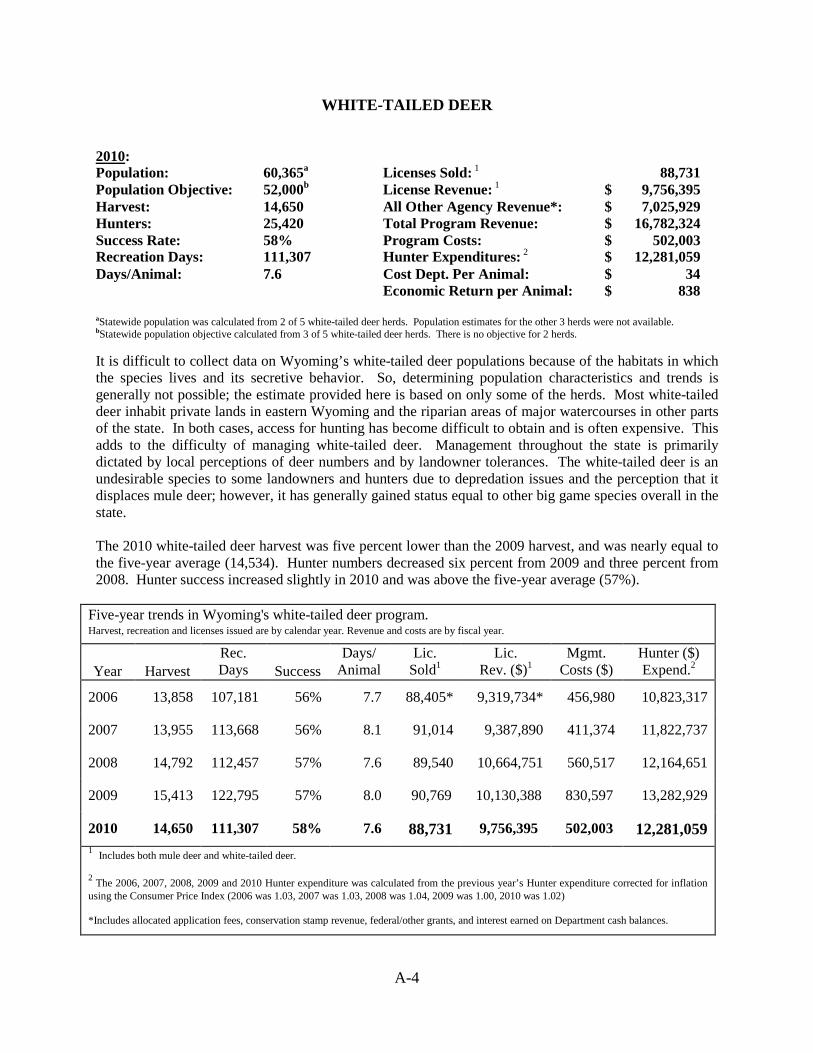
A-4
WHITE-TAILED DEER 2010: Population: 60,365a Licenses Sold: 1 88,731 Population Objective: 52,000b License Revenue: 1 $ 9,756,395
Harvest: 14,650 All Other Agency Revenue*: $ 7,025,929 Hunters: 25,420 Total Program Revenue: $ 16,782,324 Success Rate: 58% Program Costs: $ 502,003 Recreation Days: 111,307 Hunter Expenditures: 2 $ 12,281,059 Days/Animal: 7.6 Cost Dept. Per Animal: $ 34 Economic Return per Animal: $ 838 aStatewide population was calculated from 2 of 5 white-tailed deer herds. Population estimates for the other 3 herds were not available. bStatewide population objective calculated from 3 of 5 white-tailed deer herds. There is no objective for 2 herds. It is difficult to collect data on Wyoming’s white-tailed deer populations because of the habitats in which the species lives and its secretive behavior. So, determining population characteristics and trends is generally not possible; the estimate provided here is based on only some of the herds. Most white-tailed deer inhabit private lands in eastern Wyoming and the riparian areas of major watercourses in other parts of the state. In both cases, access for hunting has become difficult to obtain and is often expensive. This adds to the difficulty of managing white-tailed deer. Management throughout the state is primarily dictated by local perceptions of deer numbers and by landowner tolerances. The white-tailed deer is an undesirable species to some landowners and hunters due to depredation issues and the perception that it displaces mule deer; however, it has generally gained status equal to other big game species overall in the state. The 2010 white-tailed deer harvest was five percent lower than the 2009 harvest, and was nearly equal to the five-year average (14,534). Hunter numbers decreased six percent from 2009 and three percent from 2008. Hunter success increased slightly in 2010 and was above the five-year average (57%).
Five-year trends in Wyoming's white-tailed deer program. Harvest, recreation and licenses issued are by calendar year. Revenue and costs are by fiscal year.
Year
Harvest
Rec. Days
Success
Days/ Animal
Lic. Sold1
Lic. Rev. ($)1
Mgmt. Costs ($)
Hunter ($) Expend.2
2006 13,858 107,181 56% 7.7 88,405* 9,319,734* 456,980 10,823,317
2007 13,955 113,668 56% 8.1 91,014 9,387,890 411,374 11,822,737
2008 14,792 112,457 57% 7.6 89,540 10,664,751 560,517 12,164,651
2009 15,413 122,795 57% 8.0 90,769 10,130,388 830,597 13,282,929
2010 14,650 111,307 58% 7.6 88,731 9,756,395 502,003 12,281,059 1 Includes both mule deer and white-tailed deer.
2 The 2006, 2007, 2008, 2009 and 2010 Hunter expenditure was calculated from the previous year’s Hunter expenditure corrected for inflation using the Consumer Price Index (2006 was 1.03, 2007 was 1.03, 2008 was 1.04, 2009 was 1.00, 2010 was 1.02) *Includes allocated application fees, conservation stamp revenue, federal/other grants, and interest earned on Department cash balances.
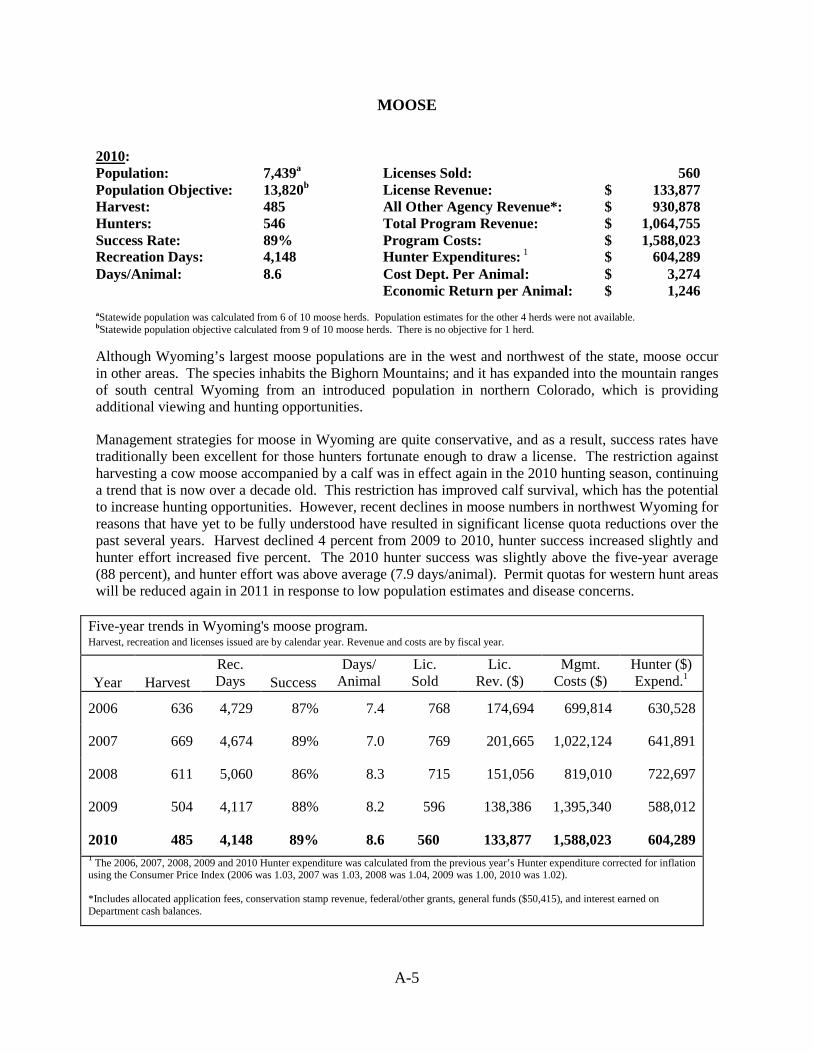
A-5
MOOSE 2010: Population: 7,439a Licenses Sold: 560 Population Objective: 13,820b License Revenue: $ 133,877 Harvest: 485 All Other Agency Revenue*: $ 930,878 Hunters: 546 Total Program Revenue: $ 1,064,755 Success Rate: 89% Program Costs: $ 1,588,023 Recreation Days: 4,148 Hunter Expenditures: 1 $ 604,289 Days/Animal: 8.6 Cost Dept. Per Animal: $ 3,274 Economic Return per Animal: $ 1,246 aStatewide population was calculated from 6 of 10 moose herds. Population estimates for the other 4 herds were not available. bStatewide population objective calculated from 9 of 10 moose herds. There is no objective for 1 herd. Although Wyoming’s largest moose populations are in the west and northwest of the state, moose occur in other areas. The species inhabits the Bighorn Mountains; and it has expanded into the mountain ranges of south central Wyoming from an introduced population in northern Colorado, which is providing additional viewing and hunting opportunities.
Management strategies for moose in Wyoming are quite conservative, and as a result, success rates have traditionally been excellent for those hunters fortunate enough to draw a license. The restriction against harvesting a cow moose accompanied by a calf was in effect again in the 2010 hunting season, continuing a trend that is now over a decade old. This restriction has improved calf survival, which has the potential to increase hunting opportunities. However, recent declines in moose numbers in northwest Wyoming for reasons that have yet to be fully understood have resulted in significant license quota reductions over the past several years. Harvest declined 4 percent from 2009 to 2010, hunter success increased slightly and hunter effort increased five percent. The 2010 hunter success was slightly above the five-year average (88 percent), and hunter effort was above average (7.9 days/animal). Permit quotas for western hunt areas will be reduced again in 2011 in response to low population estimates and disease concerns.
Five-year trends in Wyoming's moose program. Harvest, recreation and licenses issued are by calendar year. Revenue and costs are by fiscal year.
Year
Harvest
Rec. Days
Success
Days/ Animal
Lic. Sold
Lic. Rev. ($)
Mgmt. Costs ($)
Hunter ($) Expend.1
2006 636 4,729 87% 7.4 768 174,694 699,814 630,528
2007 669 4,674 89% 7.0 769 201,665 1,022,124 641,891
2008 611 5,060 86% 8.3 715 151,056 819,010 722,697
2009 504 4,117 88% 8.2 596 138,386 1,395,340 588,012
2010 485 4,148 89% 8.6 560 133,877 1,588,023 604,289 1 The 2006, 2007, 2008, 2009 and 2010 Hunter expenditure was calculated from the previous year’s Hunter expenditure corrected for inflation using the Consumer Price Index (2006 was 1.03, 2007 was 1.03, 2008 was 1.04, 2009 was 1.00, 2010 was 1.02). *Includes allocated application fees, conservation stamp revenue, federal/other grants, general funds ($50,415), and interest earned on Department cash balances.
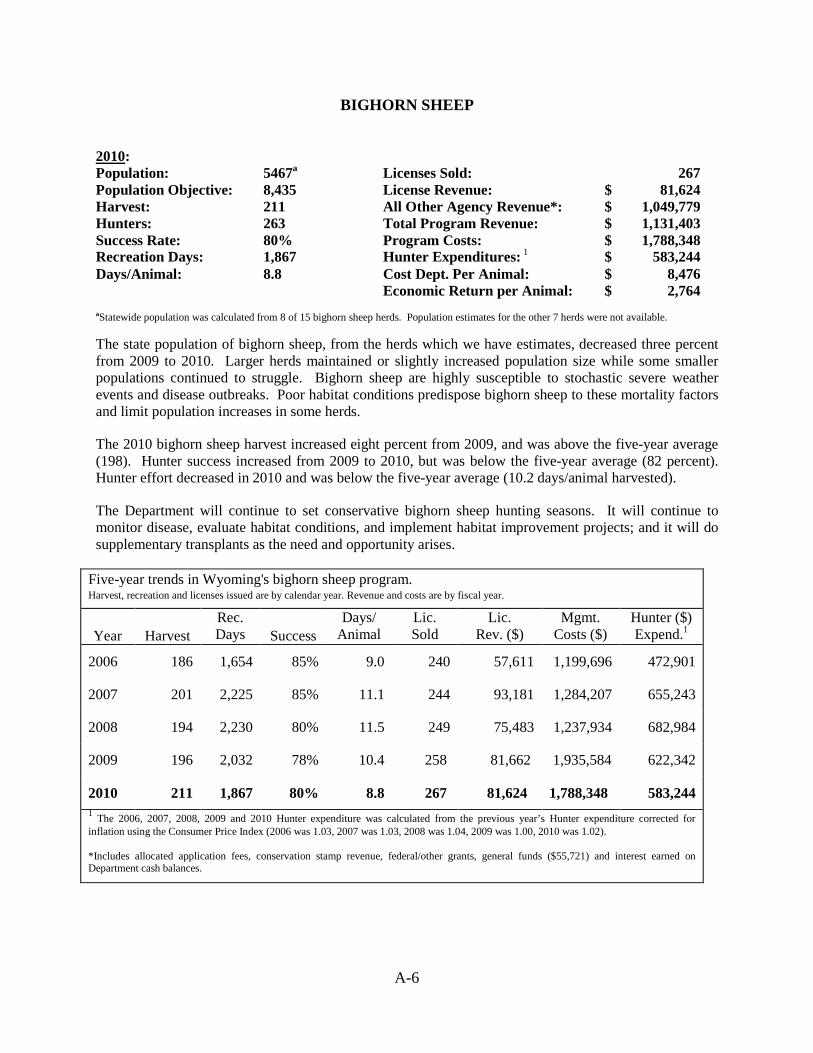
A-6
BIGHORN SHEEP 2010: Population: 5467a Licenses Sold: 267 Population Objective: 8,435 License Revenue: $ 81,624 Harvest: 211 All Other Agency Revenue*: $ 1,049,779 Hunters: 263 Total Program Revenue: $ 1,131,403 Success Rate: 80% Program Costs: $ 1,788,348 Recreation Days: 1,867 Hunter Expenditures: 1 $ 583,244 Days/Animal: 8.8 Cost Dept. Per Animal: $ 8,476 Economic Return per Animal: $ 2,764 aStatewide population was calculated from 8 of 15 bighorn sheep herds. Population estimates for the other 7 herds were not available. The state population of bighorn sheep, from the herds which we have estimates, decreased three percent from 2009 to 2010. Larger herds maintained or slightly increased population size while some smaller populations continued to struggle. Bighorn sheep are highly susceptible to stochastic severe weather events and disease outbreaks. Poor habitat conditions predispose bighorn sheep to these mortality factors and limit population increases in some herds.
The 2010 bighorn sheep harvest increased eight percent from 2009, and was above the five-year average (198). Hunter success increased from 2009 to 2010, but was below the five-year average (82 percent). Hunter effort decreased in 2010 and was below the five-year average (10.2 days/animal harvested).
The Department will continue to set conservative bighorn sheep hunting seasons. It will continue to monitor disease, evaluate habitat conditions, and implement habitat improvement projects; and it will do supplementary transplants as the need and opportunity arises.
Five-year trends in Wyoming's bighorn sheep program. Harvest, recreation and licenses issued are by calendar year. Revenue and costs are by fiscal year.
Year
Harvest
Rec. Days
Success
Days/ Animal
Lic. Sold
Lic. Rev. ($)
Mgmt. Costs ($)
Hunter ($) Expend.1
2006 186 1,654 85% 9.0 240 57,611 1,199,696 472,901
2007 201 2,225 85% 11.1 244 93,181 1,284,207 655,243
2008 194 2,230 80% 11.5 249 75,483 1,237,934 682,984
2009 196 2,032 78% 10.4 258 81,662 1,935,584 622,342
2010 211 1,867 80% 8.8 267 81,624 1,788,348 583,244 1 The 2006, 2007, 2008, 2009 and 2010 Hunter expenditure was calculated from the previous year’s Hunter expenditure corrected for inflation using the Consumer Price Index (2006 was 1.03, 2007 was 1.03, 2008 was 1.04, 2009 was 1.00, 2010 was 1.02). *Includes allocated application fees, conservation stamp revenue, federal/other grants, general funds ($55,721) and interest earned on Department cash balances.
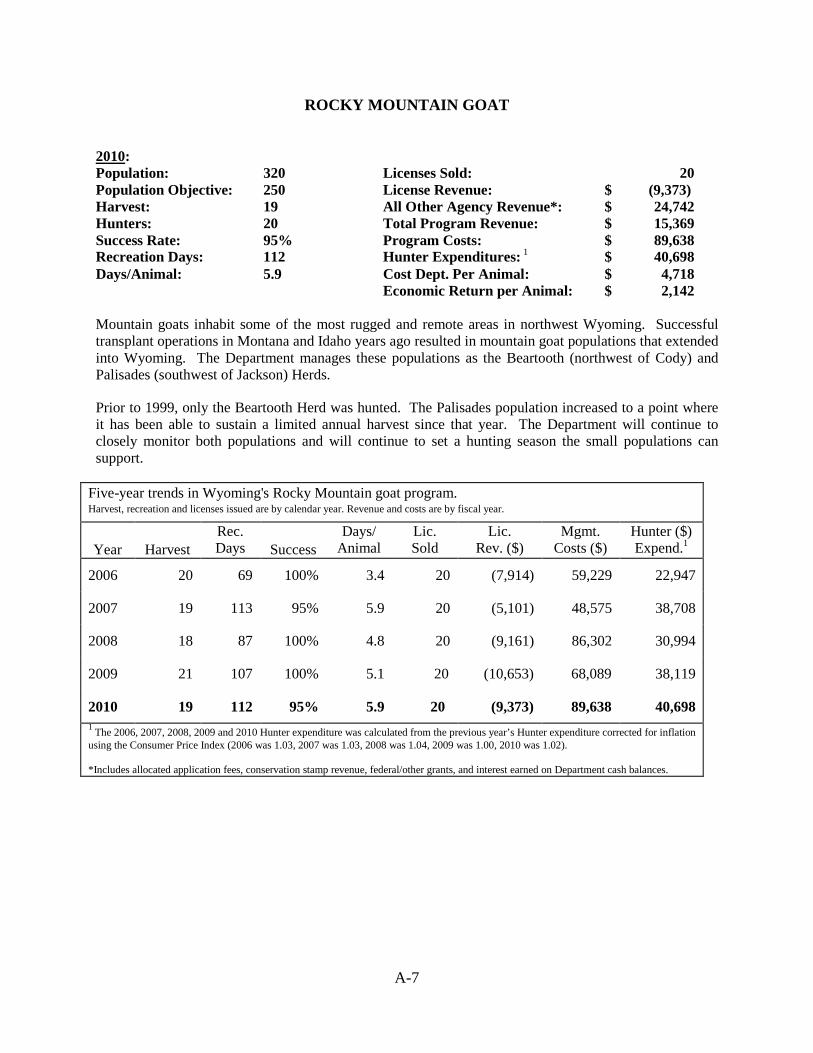
A-7
ROCKY MOUNTAIN GOAT 2010: Population: 320 Licenses Sold: 20 Population Objective: 250 License Revenue: $ (9,373) Harvest: 19 All Other Agency Revenue*: $ 24,742 Hunters: 20 Total Program Revenue: $ 15,369 Success Rate: 95% Program Costs: $ 89,638 Recreation Days: 112 Hunter Expenditures: 1 $ 40,698 Days/Animal: 5.9 Cost Dept. Per Animal: $ 4,718 Economic Return per Animal: $ 2,142 Mountain goats inhabit some of the most rugged and remote areas in northwest Wyoming. Successful transplant operations in Montana and Idaho years ago resulted in mountain goat populations that extended into Wyoming. The Department manages these populations as the Beartooth (northwest of Cody) and Palisades (southwest of Jackson) Herds.
Prior to 1999, only the Beartooth Herd was hunted. The Palisades population increased to a point where it has been able to sustain a limited annual harvest since that year. The Department will continue to closely monitor both populations and will continue to set a hunting season the small populations can support.
Five-year trends in Wyoming's Rocky Mountain goat program. Harvest, recreation and licenses issued are by calendar year. Revenue and costs are by fiscal year.
Year
Harvest
Rec. Days
Success
Days/ Animal
Lic. Sold
Lic. Rev. ($)
Mgmt. Costs ($)
Hunter ($) Expend.1
2006 20 69 100% 3.4 20 (7,914) 59,229 22,947
2007 19 113 95% 5.9 20 (5,101) 48,575 38,708
2008 18 87 100% 4.8 20 (9,161) 86,302 30,994
2009 21 107 100% 5.1 20 (10,653) 68,089 38,119
2010 19 112 95% 5.9 20 (9,373) 89,638 40,698 1 The 2006, 2007, 2008, 2009 and 2010 Hunter expenditure was calculated from the previous year’s Hunter expenditure corrected for inflation using the Consumer Price Index (2006 was 1.03, 2007 was 1.03, 2008 was 1.04, 2009 was 1.00, 2010 was 1.02). *Includes allocated application fees, conservation stamp revenue, federal/other grants, and interest earned on Department cash balances.
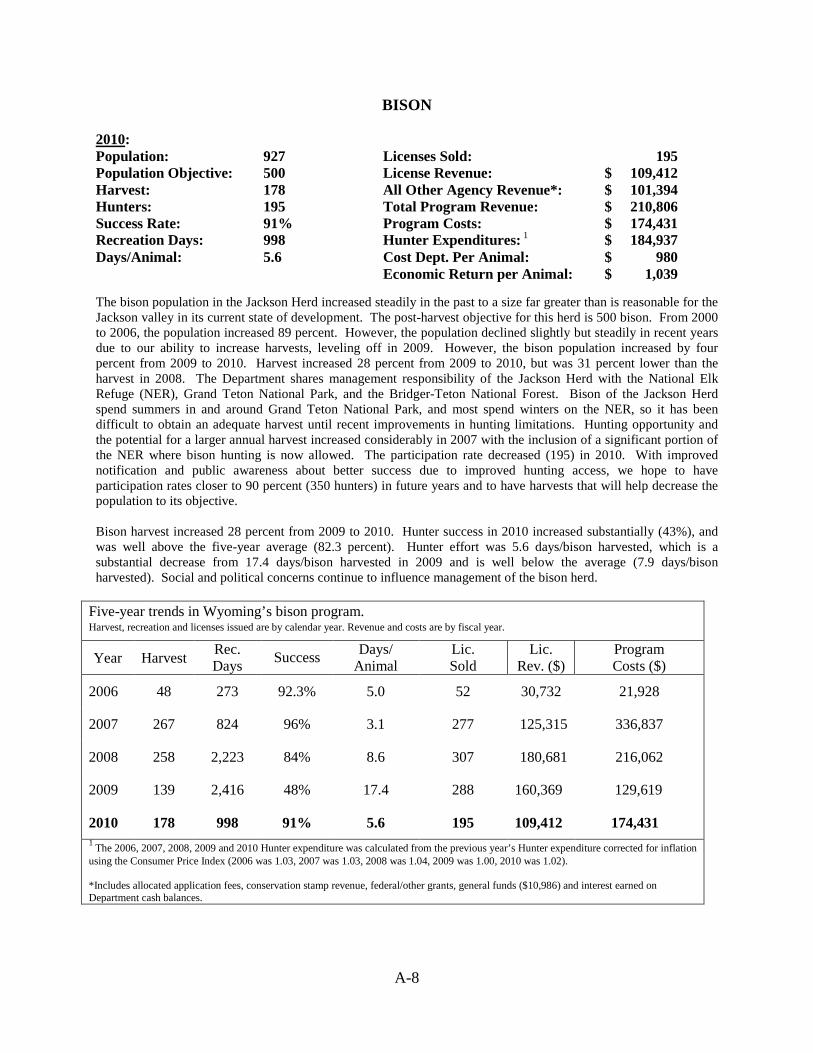
A-8
BISON 2010: Population: 927 Licenses Sold: 195 Population Objective: 500 License Revenue: $ 109,412 Harvest: 178 All Other Agency Revenue*: $ 101,394 Hunters: 195 Total Program Revenue: $ 210,806 Success Rate: 91% Program Costs: $ 174,431 Recreation Days: 998 Hunter Expenditures: 1 $ 184,937 Days/Animal: 5.6 Cost Dept. Per Animal: $ 980 Economic Return per Animal: $ 1,039 The bison population in the Jackson Herd increased steadily in the past to a size far greater than is reasonable for the Jackson valley in its current state of development. The post-harvest objective for this herd is 500 bison. From 2000 to 2006, the population increased 89 percent. However, the population declined slightly but steadily in recent years due to our ability to increase harvests, leveling off in 2009. However, the bison population increased by four percent from 2009 to 2010. Harvest increased 28 percent from 2009 to 2010, but was 31 percent lower than the harvest in 2008. The Department shares management responsibility of the Jackson Herd with the National Elk Refuge (NER), Grand Teton National Park, and the Bridger-Teton National Forest. Bison of the Jackson Herd spend summers in and around Grand Teton National Park, and most spend winters on the NER, so it has been difficult to obtain an adequate harvest until recent improvements in hunting limitations. Hunting opportunity and the potential for a larger annual harvest increased considerably in 2007 with the inclusion of a significant portion of the NER where bison hunting is now allowed. The participation rate decreased (195) in 2010. With improved notification and public awareness about better success due to improved hunting access, we hope to have participation rates closer to 90 percent (350 hunters) in future years and to have harvests that will help decrease the population to its objective. Bison harvest increased 28 percent from 2009 to 2010. Hunter success in 2010 increased substantially (43%), and was well above the five-year average (82.3 percent). Hunter effort was 5.6 days/bison harvested, which is a substantial decrease from 17.4 days/bison harvested in 2009 and is well below the average (7.9 days/bison harvested). Social and political concerns continue to influence management of the bison herd.
Five-year trends in Wyoming’s bison program. Harvest, recreation and licenses issued are by calendar year. Revenue and costs are by fiscal year.
Year Harvest Rec. Days Success Days/
Animal Lic. Sold
Lic. Rev. ($)
Program Costs ($)
2006 48 273 92.3% 5.0 52 30,732 21,928
2007 267 824 96% 3.1 277 125,315 336,837
2008 258 2,223 84% 8.6 307 180,681 216,062
2009 139 2,416 48% 17.4 288 160,369 129,619
2010 178 998 91% 5.6 195 109,412 174,431 1 The 2006, 2007, 2008, 2009 and 2010 Hunter expenditure was calculated from the previous year’s Hunter expenditure corrected for inflation using the Consumer Price Index (2006 was 1.03, 2007 was 1.03, 2008 was 1.04, 2009 was 1.00, 2010 was 1.02). *Includes allocated application fees, conservation stamp revenue, federal/other grants, general funds ($10,986) and interest earned on Department cash balances.
TROPHY GAME
Black Bear
Grizzly Bear Mountain Lion
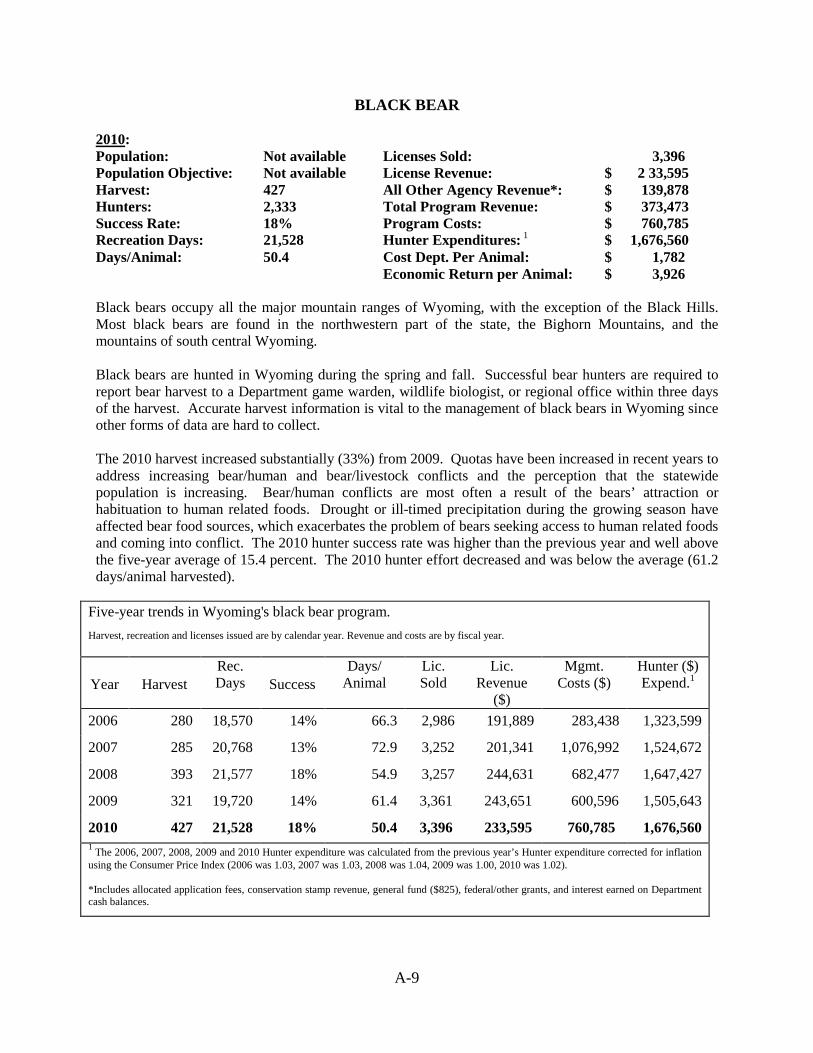
A-9
BLACK BEAR 2010: Population: Not available Licenses Sold: 3,396 Population Objective: Not available License Revenue: $ 2 33,595 Harvest: 427 All Other Agency Revenue*: $ 139,878 Hunters: 2,333 Total Program Revenue: $ 373,473 Success Rate: 18% Program Costs: $ 760,785 Recreation Days: 21,528 Hunter Expenditures: 1 $ 1,676,560 Days/Animal: 50.4 Cost Dept. Per Animal: $ 1,782 Economic Return per Animal: $ 3,926 Black bears occupy all the major mountain ranges of Wyoming, with the exception of the Black Hills. Most black bears are found in the northwestern part of the state, the Bighorn Mountains, and the mountains of south central Wyoming. Black bears are hunted in Wyoming during the spring and fall. Successful bear hunters are required to report bear harvest to a Department game warden, wildlife biologist, or regional office within three days of the harvest. Accurate harvest information is vital to the management of black bears in Wyoming since other forms of data are hard to collect. The 2010 harvest increased substantially (33%) from 2009. Quotas have been increased in recent years to address increasing bear/human and bear/livestock conflicts and the perception that the statewide population is increasing. Bear/human conflicts are most often a result of the bears’ attraction or habituation to human related foods. Drought or ill-timed precipitation during the growing season have affected bear food sources, which exacerbates the problem of bears seeking access to human related foods and coming into conflict. The 2010 hunter success rate was higher than the previous year and well above the five-year average of 15.4 percent. The 2010 hunter effort decreased and was below the average (61.2 days/animal harvested).
Five-year trends in Wyoming's black bear program. Harvest, recreation and licenses issued are by calendar year. Revenue and costs are by fiscal year.
Year
Harvest
Rec. Days
Success
Days/ Animal
Lic. Sold
Lic. Revenue
($)
Mgmt. Costs ($)
Hunter ($) Expend.1
2006 280 18,570 14% 66.3 2,986 191,889 283,438 1,323,599
2007 285 20,768 13% 72.9 3,252 201,341 1,076,992 1,524,672
2008 393 21,577 18% 54.9 3,257 244,631 682,477 1,647,427
2009 321 19,720 14% 61.4 3,361 243,651 600,596 1,505,643
2010 427 21,528 18% 50.4 3,396 233,595 760,785 1,676,560 1 The 2006, 2007, 2008, 2009 and 2010 Hunter expenditure was calculated from the previous year’s Hunter expenditure corrected for inflation using the Consumer Price Index (2006 was 1.03, 2007 was 1.03, 2008 was 1.04, 2009 was 1.00, 2010 was 1.02). *Includes allocated application fees, conservation stamp revenue, general fund ($825), federal/other grants, and interest earned on Department cash balances.
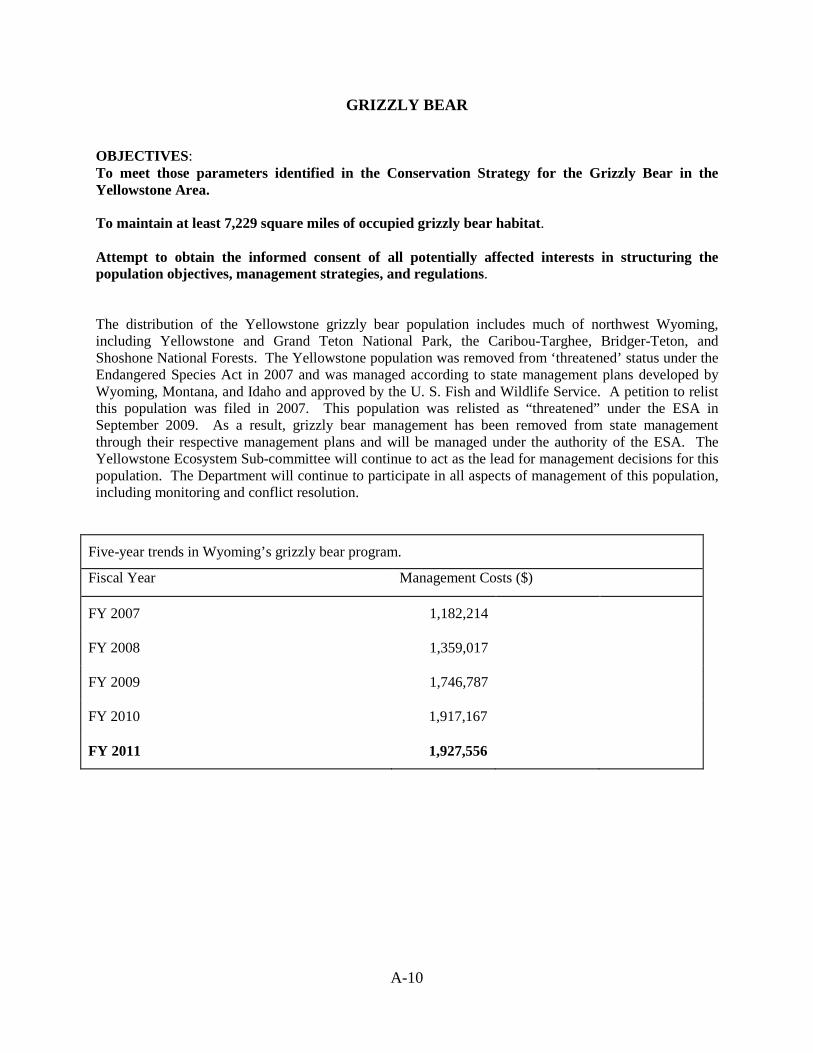
A-10
GRIZZLY BEAR OBJECTIVES: To meet those parameters identified in the Conservation Strategy for the Grizzly Bear in the Yellowstone Area. To maintain at least 7,229 square miles of occupied grizzly bear habitat. Attempt to obtain the informed consent of all potentially affected interests in structuring the population objectives, management strategies, and regulations. The distribution of the Yellowstone grizzly bear population includes much of northwest Wyoming, including Yellowstone and Grand Teton National Park, the Caribou-Targhee, Bridger-Teton, and Shoshone National Forests. The Yellowstone population was removed from ‘threatened’ status under the Endangered Species Act in 2007 and was managed according to state management plans developed by Wyoming, Montana, and Idaho and approved by the U. S. Fish and Wildlife Service. A petition to relist this population was filed in 2007. This population was relisted as “threatened” under the ESA in September 2009. As a result, grizzly bear management has been removed from state management through their respective management plans and will be managed under the authority of the ESA. The Yellowstone Ecosystem Sub-committee will continue to act as the lead for management decisions for this population. The Department will continue to participate in all aspects of management of this population, including monitoring and conflict resolution.
Five-year trends in Wyoming’s grizzly bear program. Fiscal Year Management Costs ($)
FY 2007 1,182,214
FY 2008 1,359,017
FY 2009 1,746,787
FY 2010 1,917,167
FY 2011 1,927,556
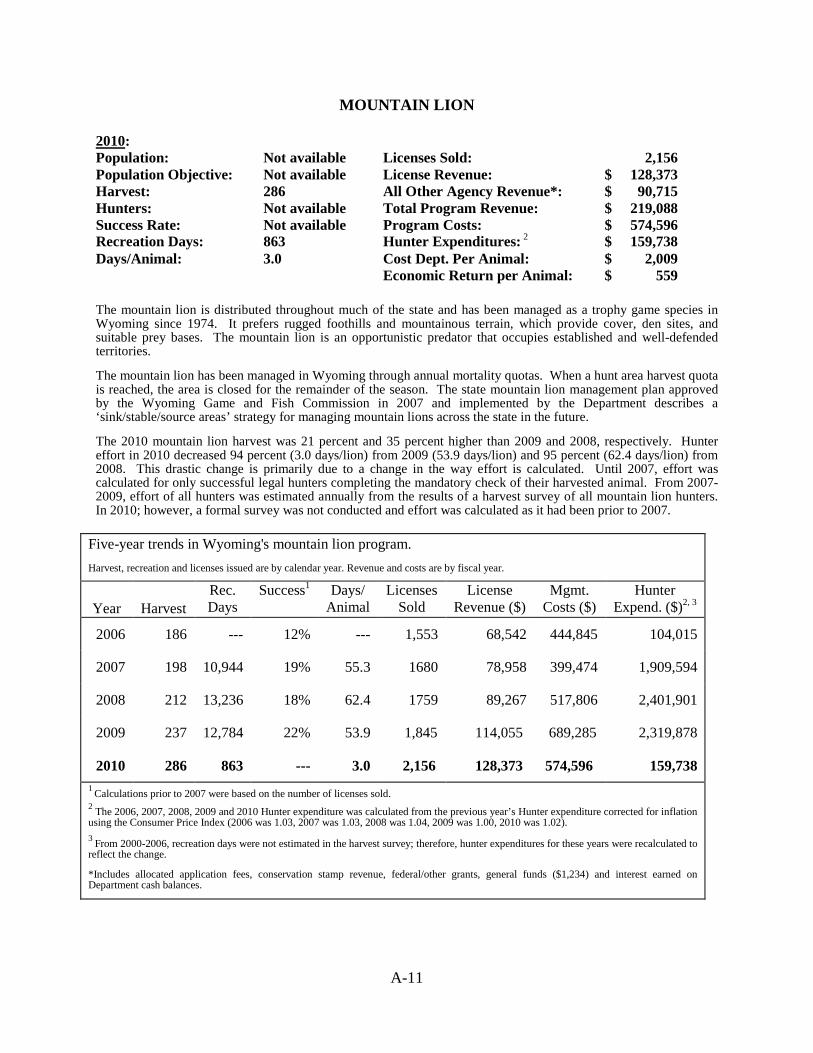
A-11
MOUNTAIN LION 2010: Population: Not available Licenses Sold: 2,156 Population Objective: Not available License Revenue: $ 128,373 Harvest: 286 All Other Agency Revenue*: $ 90,715 Hunters: Not available Total Program Revenue: $ 219,088 Success Rate: Not available Program Costs: $ 574,596 Recreation Days: 863 Hunter Expenditures: 2 $ 159,738 Days/Animal: 3.0 Cost Dept. Per Animal: $ 2,009 Economic Return per Animal: $ 559 The mountain lion is distributed throughout much of the state and has been managed as a trophy game species in Wyoming since 1974. It prefers rugged foothills and mountainous terrain, which provide cover, den sites, and suitable prey bases. The mountain lion is an opportunistic predator that occupies established and well-defended territories. The mountain lion has been managed in Wyoming through annual mortality quotas. When a hunt area harvest quota is reached, the area is closed for the remainder of the season. The state mountain lion management plan approved by the Wyoming Game and Fish Commission in 2007 and implemented by the Department describes a ‘sink/stable/source areas’ strategy for managing mountain lions across the state in the future. The 2010 mountain lion harvest was 21 percent and 35 percent higher than 2009 and 2008, respectively. Hunter effort in 2010 decreased 94 percent (3.0 days/lion) from 2009 (53.9 days/lion) and 95 percent (62.4 days/lion) from 2008. This drastic change is primarily due to a change in the way effort is calculated. Until 2007, effort was calculated for only successful legal hunters completing the mandatory check of their harvested animal. From 2007-2009, effort of all hunters was estimated annually from the results of a harvest survey of all mountain lion hunters. In 2010; however, a formal survey was not conducted and effort was calculated as it had been prior to 2007.
Five-year trends in Wyoming's mountain lion program. Harvest, recreation and licenses issued are by calendar year. Revenue and costs are by fiscal year.
Year
Harvest
Rec. Days
Success1 Days/ Animal
Licenses Sold
License Revenue ($)
Mgmt. Costs ($)
Hunter Expend. ($)2, 3
2006 186 --- 12% --- 1,553 68,542 444,845 104,015
2007 198 10,944 19% 55.3 1680 78,958 399,474 1,909,594
2008 212 13,236 18% 62.4 1759 89,267 517,806 2,401,901
2009 237 12,784 22% 53.9 1,845 114,055 689,285 2,319,878
2010 286 863 --- 3.0 2,156 128,373 574,596 159,738 1 Calculations prior to 2007 were based on the number of licenses sold. 2 The 2006, 2007, 2008, 2009 and 2010 Hunter expenditure was calculated from the previous year’s Hunter expenditure corrected for inflation using the Consumer Price Index (2006 was 1.03, 2007 was 1.03, 2008 was 1.04, 2009 was 1.00, 2010 was 1.02). 3 From 2000-2006, recreation days were not estimated in the harvest survey; therefore, hunter expenditures for these years were recalculated to reflect the change. *Includes allocated application fees, conservation stamp revenue, federal/other grants, general funds ($1,234) and interest earned on Department cash balances.
SMALL GAME
Cottontail
Snowshoe Hare Squirrel
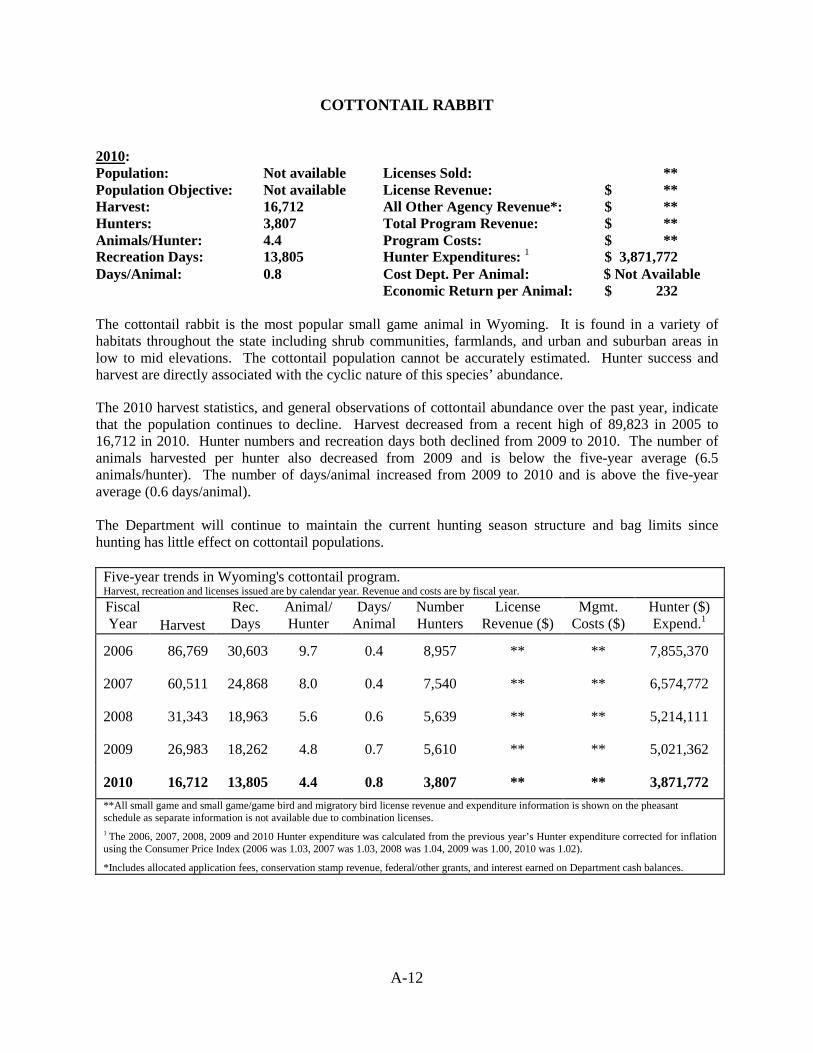
A-12
COTTONTAIL RABBIT 2010: Population: Not available Licenses Sold: **
Population Objective: Not available License Revenue: $ ** Harvest: 16,712 All Other Agency Revenue*: $ ** Hunters: 3,807 Total Program Revenue: $ ** Animals/Hunter: 4.4 Program Costs: $ ** Recreation Days: 13,805 Hunter Expenditures: 1 $ 3,871,772 Days/Animal: 0.8 Cost Dept. Per Animal: $ Not Available Economic Return per Animal: $ 232 The cottontail rabbit is the most popular small game animal in Wyoming. It is found in a variety of habitats throughout the state including shrub communities, farmlands, and urban and suburban areas in low to mid elevations. The cottontail population cannot be accurately estimated. Hunter success and harvest are directly associated with the cyclic nature of this species’ abundance.
The 2010 harvest statistics, and general observations of cottontail abundance over the past year, indicate that the population continues to decline. Harvest decreased from a recent high of 89,823 in 2005 to 16,712 in 2010. Hunter numbers and recreation days both declined from 2009 to 2010. The number of animals harvested per hunter also decreased from 2009 and is below the five-year average (6.5 animals/hunter). The number of days/animal increased from 2009 to 2010 and is above the five-year average (0.6 days/animal). The Department will continue to maintain the current hunting season structure and bag limits since hunting has little effect on cottontail populations.
Five-year trends in Wyoming's cottontail program. Harvest, recreation and licenses issued are by calendar year. Revenue and costs are by fiscal year. Fiscal Year
Harvest
Rec. Days
Animal/ Hunter
Days/ Animal
Number Hunters
License Revenue ($)
Mgmt. Costs ($)
Hunter ($) Expend.1
2006 86,769 30,603 9.7 0.4 8,957 ** ** 7,855,370
2007 60,511 24,868 8.0 0.4 7,540 ** ** 6,574,772
2008 31,343 18,963 5.6 0.6 5,639 ** ** 5,214,111
2009 26,983 18,262 4.8 0.7 5,610 ** ** 5,021,362
2010 16,712 13,805 4.4 0.8 3,807 ** ** 3,871,772 **All small game and small game/game bird and migratory bird license revenue and expenditure information is shown on the pheasant schedule as separate information is not available due to combination licenses. 1 The 2006, 2007, 2008, 2009 and 2010 Hunter expenditure was calculated from the previous year’s Hunter expenditure corrected for inflation using the Consumer Price Index (2006 was 1.03, 2007 was 1.03, 2008 was 1.04, 2009 was 1.00, 2010 was 1.02). *Includes allocated application fees, conservation stamp revenue, federal/other grants, and interest earned on Department cash balances.
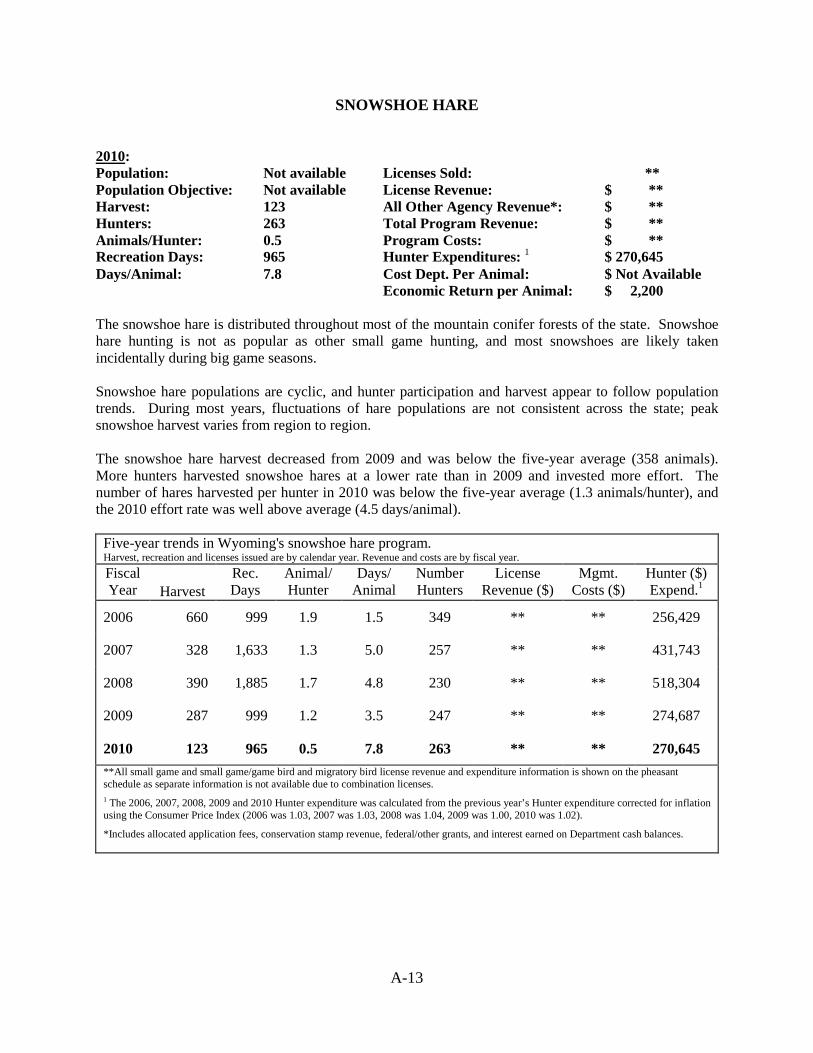
A-13
SNOWSHOE HARE 2010: Population: Not available Licenses Sold: **
Population Objective: Not available License Revenue: $ ** Harvest: 123 All Other Agency Revenue*: $ ** Hunters: 263 Total Program Revenue: $ ** Animals/Hunter: 0.5 Program Costs: $ ** Recreation Days: 965 Hunter Expenditures: 1 $ 270,645 Days/Animal: 7.8 Cost Dept. Per Animal: $ Not Available Economic Return per Animal: $ 2,200 The snowshoe hare is distributed throughout most of the mountain conifer forests of the state. Snowshoe hare hunting is not as popular as other small game hunting, and most snowshoes are likely taken incidentally during big game seasons. Snowshoe hare populations are cyclic, and hunter participation and harvest appear to follow population trends. During most years, fluctuations of hare populations are not consistent across the state; peak snowshoe harvest varies from region to region. The snowshoe hare harvest decreased from 2009 and was below the five-year average (358 animals). More hunters harvested snowshoe hares at a lower rate than in 2009 and invested more effort. The number of hares harvested per hunter in 2010 was below the five-year average (1.3 animals/hunter), and the 2010 effort rate was well above average (4.5 days/animal).
Five-year trends in Wyoming's snowshoe hare program. Harvest, recreation and licenses issued are by calendar year. Revenue and costs are by fiscal year. Fiscal Year
Harvest
Rec. Days
Animal/ Hunter
Days/ Animal
Number Hunters
License Revenue ($)
Mgmt. Costs ($)
Hunter ($) Expend.1
2006 660 999 1.9 1.5 349 ** ** 256,429
2007 328 1,633 1.3 5.0 257 ** ** 431,743
2008 390 1,885 1.7 4.8 230 ** ** 518,304
2009 287 999 1.2 3.5 247 ** ** 274,687
2010 123 965 0.5 7.8 263 ** ** 270,645 **All small game and small game/game bird and migratory bird license revenue and expenditure information is shown on the pheasant schedule as separate information is not available due to combination licenses. 1 The 2006, 2007, 2008, 2009 and 2010 Hunter expenditure was calculated from the previous year’s Hunter expenditure corrected for inflation using the Consumer Price Index (2006 was 1.03, 2007 was 1.03, 2008 was 1.04, 2009 was 1.00, 2010 was 1.02). *Includes allocated application fees, conservation stamp revenue, federal/other grants, and interest earned on Department cash balances.

A-14
SQUIRREL 2010: Population: Not available Licenses Sold: **
Population Objective: Not available License Revenue: $ ** Harvest: 1,595 All Other Agency Revenue*: $ ** Hunters: 352 Total Program Revenue: $ ** Animals/Hunter: 4.5 Program Costs: $ ** Recreation Days: 2,311 Hunter Expenditures: 1 $ 648,147 Days/Animal: 1.4 Cost Dept. Per Animal: $ Not Available Economic Return per Animal: $ 406 Red squirrels occupy mountain conifer forests at mid to upper elevations throughout the state. Fox squirrels occupy low elevation deciduous forests, cottonwood-riparian areas, agricultural, and urban areas. Squirrel hunter participation and harvest increased in 2010. According to the 2010 harvest survey, 352 hunters harvested an estimated 1,595 squirrels. Hunters invested more effort per squirrel harvested in 2010 than 2009, and each hunter harvested a higher number of squirrels in 2010 than the five-year average (4.2 animals/hunter). Squirrel hunting in Wyoming is not as popular as it is in other parts of the country. In Wyoming, most squirrel harvest is incidental to other hunting pursuits. The Department will maintain the current season structures since hunting has little effect on squirrel populations.
Five-year trends in Wyoming's squirrel program. Harvest, recreation and licenses issued are by calendar year. Revenue and costs are by fiscal year. Fiscal Year
Harvest
Rec. Days
Animal/ Hunter
Days/ Animal
Number Hunters
License Revenue ($)
Mgmt. Costs ($)
Hunter ($) Expend.1
2006 1,212 1,463 3.3 1.2 367 ** ** 375,532
2007 1,066 1,052 4.5 1.0 239 ** ** 278,135
2008 1,584 2,182 4.5 1.4 351 ** ** 599,968
2009 1,420 1,915 4.3 1.3 334 ** ** 526,553
2010 1,595 2,311 4.5 1.4 352 ** ** 648,147 **All small game and small game/game bird and migratory bird license revenue and expenditure information is shown on the pheasant schedule as separate information is not available due to combination licenses. 1 The 2006, 2007, 2008, 2009 and 2010 Hunter expenditure was calculated from the previous year’s Hunter expenditure corrected for inflation using the Consumer Price Index (2006 was 1.03, 2007 was 1.03, 2008 was 1.04, 2009 was 1.00, 2010 was 1.02). *Includes allocated application fees, conservation stamp revenue, federal/other grants, and interest earned on Department cash balances.

UPLAND GAME
Pheasant
Gray Partridge Chukar
Sage-Grouse Sharp-Tailed Grouse
Blue Grouse Ruffed Grouse
Mourning Dove Turkey
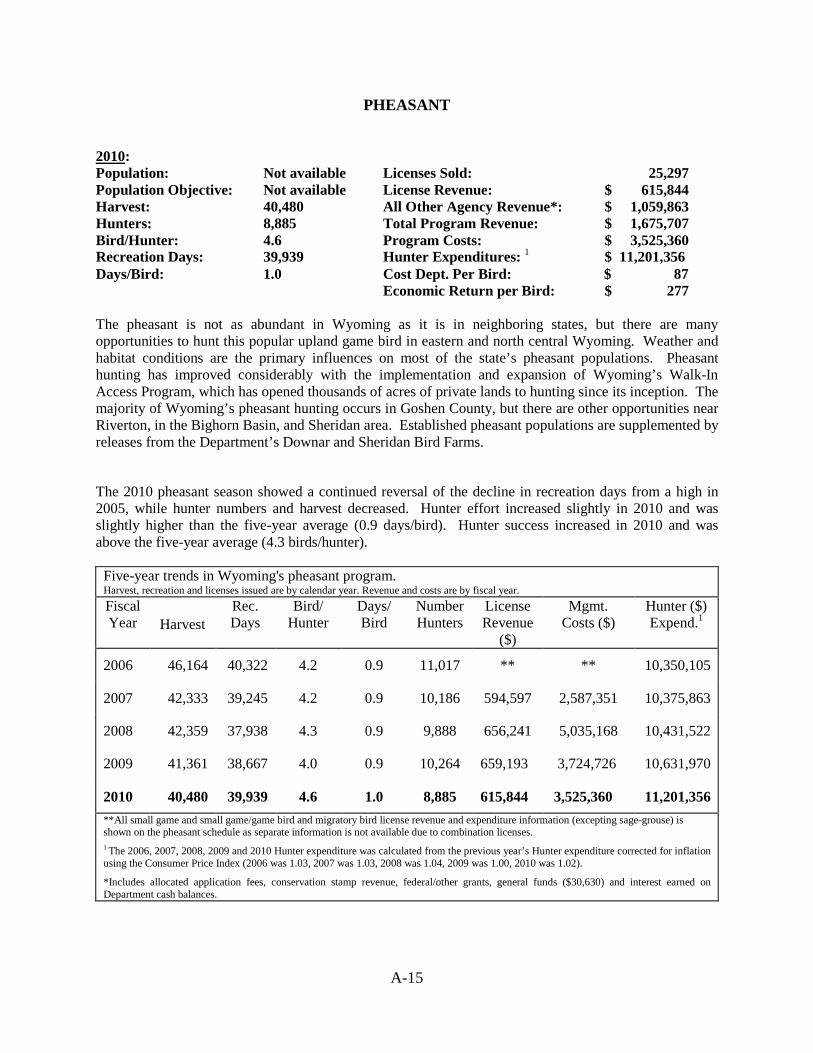
A-15
PHEASANT 2010: Population: Not available Licenses Sold: 25,297
Population Objective: Not available License Revenue: $ 615,844 Harvest: 40,480 All Other Agency Revenue*: $ 1,059,863 Hunters: 8,885 Total Program Revenue: $ 1,675,707 Bird/Hunter: 4.6 Program Costs: $ 3,525,360 Recreation Days: 39,939 Hunter Expenditures: 1 $ 11,201,356 Days/Bird: 1.0 Cost Dept. Per Bird: $ 87 Economic Return per Bird: $ 277 The pheasant is not as abundant in Wyoming as it is in neighboring states, but there are many opportunities to hunt this popular upland game bird in eastern and north central Wyoming. Weather and habitat conditions are the primary influences on most of the state’s pheasant populations. Pheasant hunting has improved considerably with the implementation and expansion of Wyoming’s Walk-In Access Program, which has opened thousands of acres of private lands to hunting since its inception. The majority of Wyoming’s pheasant hunting occurs in Goshen County, but there are other opportunities near Riverton, in the Bighorn Basin, and Sheridan area. Established pheasant populations are supplemented by releases from the Department’s Downar and Sheridan Bird Farms.
The 2010 pheasant season showed a continued reversal of the decline in recreation days from a high in 2005, while hunter numbers and harvest decreased. Hunter effort increased slightly in 2010 and was slightly higher than the five-year average (0.9 days/bird). Hunter success increased in 2010 and was above the five-year average (4.3 birds/hunter).
Five-year trends in Wyoming's pheasant program. Harvest, recreation and licenses issued are by calendar year. Revenue and costs are by fiscal year. Fiscal Year
Harvest
Rec. Days
Bird/ Hunter
Days/ Bird
Number Hunters
License Revenue
($)
Mgmt. Costs ($)
Hunter ($) Expend.1
2006 46,164 40,322 4.2 0.9 11,017 ** ** 10,350,105
2007 42,333 39,245 4.2 0.9 10,186 594,597 2,587,351 10,375,863
2008 42,359 37,938 4.3 0.9 9,888 656,241 5,035,168 10,431,522
2009 41,361 38,667 4.0 0.9 10,264 659,193 3,724,726 10,631,970
2010 40,480 39,939 4.6 1.0 8,885 615,844 3,525,360 11,201,356 **All small game and small game/game bird and migratory bird license revenue and expenditure information (excepting sage-grouse) is shown on the pheasant schedule as separate information is not available due to combination licenses. 1 The 2006, 2007, 2008, 2009 and 2010 Hunter expenditure was calculated from the previous year’s Hunter expenditure corrected for inflation using the Consumer Price Index (2006 was 1.03, 2007 was 1.03, 2008 was 1.04, 2009 was 1.00, 2010 was 1.02). *Includes allocated application fees, conservation stamp revenue, federal/other grants, general funds ($30,630) and interest earned on Department cash balances.
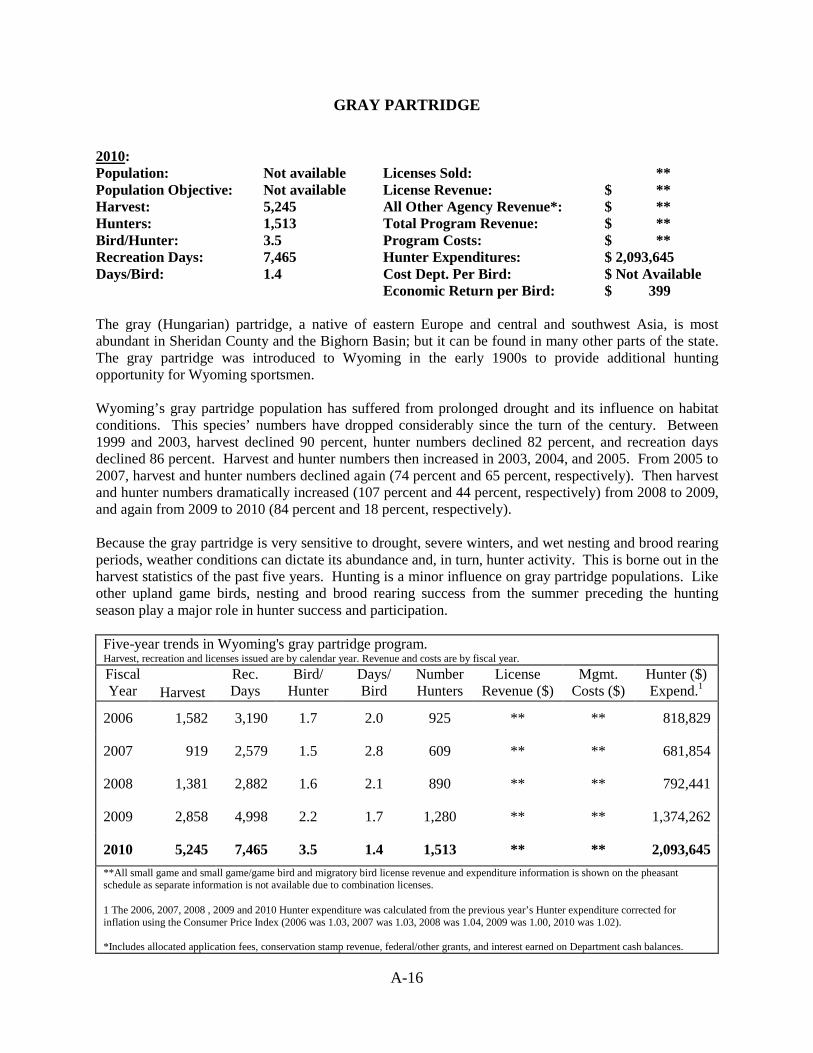
A-16
GRAY PARTRIDGE 2010: Population: Not available Licenses Sold: ** Population Objective: Not available License Revenue: $ ** Harvest: 5,245 All Other Agency Revenue*: $ ** Hunters: 1,513 Total Program Revenue: $ ** Bird/Hunter: 3.5 Program Costs: $ ** Recreation Days: 7,465 Hunter Expenditures: $ 2,093,645 Days/Bird: 1.4 Cost Dept. Per Bird: $ Not Available Economic Return per Bird: $ 399 The gray (Hungarian) partridge, a native of eastern Europe and central and southwest Asia, is most abundant in Sheridan County and the Bighorn Basin; but it can be found in many other parts of the state. The gray partridge was introduced to Wyoming in the early 1900s to provide additional hunting opportunity for Wyoming sportsmen. Wyoming’s gray partridge population has suffered from prolonged drought and its influence on habitat conditions. This species’ numbers have dropped considerably since the turn of the century. Between 1999 and 2003, harvest declined 90 percent, hunter numbers declined 82 percent, and recreation days declined 86 percent. Harvest and hunter numbers then increased in 2003, 2004, and 2005. From 2005 to 2007, harvest and hunter numbers declined again (74 percent and 65 percent, respectively). Then harvest and hunter numbers dramatically increased (107 percent and 44 percent, respectively) from 2008 to 2009, and again from 2009 to 2010 (84 percent and 18 percent, respectively). Because the gray partridge is very sensitive to drought, severe winters, and wet nesting and brood rearing periods, weather conditions can dictate its abundance and, in turn, hunter activity. This is borne out in the harvest statistics of the past five years. Hunting is a minor influence on gray partridge populations. Like other upland game birds, nesting and brood rearing success from the summer preceding the hunting season play a major role in hunter success and participation.
Five-year trends in Wyoming's gray partridge program. Harvest, recreation and licenses issued are by calendar year. Revenue and costs are by fiscal year. Fiscal Year
Harvest
Rec. Days
Bird/ Hunter
Days/ Bird
Number Hunters
License Revenue ($)
Mgmt. Costs ($)
Hunter ($) Expend.1
2006 1,582 3,190 1.7 2.0 925 ** ** 818,829
2007 919 2,579 1.5 2.8 609 ** ** 681,854
2008 1,381 2,882 1.6 2.1 890 ** ** 792,441
2009 2,858 4,998 2.2 1.7 1,280 ** ** 1,374,262
2010 5,245 7,465 3.5 1.4 1,513 ** ** 2,093,645 **All small game and small game/game bird and migratory bird license revenue and expenditure information is shown on the pheasant schedule as separate information is not available due to combination licenses. 1 The 2006, 2007, 2008 , 2009 and 2010 Hunter expenditure was calculated from the previous year’s Hunter expenditure corrected for inflation using the Consumer Price Index (2006 was 1.03, 2007 was 1.03, 2008 was 1.04, 2009 was 1.00, 2010 was 1.02). *Includes allocated application fees, conservation stamp revenue, federal/other grants, and interest earned on Department cash balances.
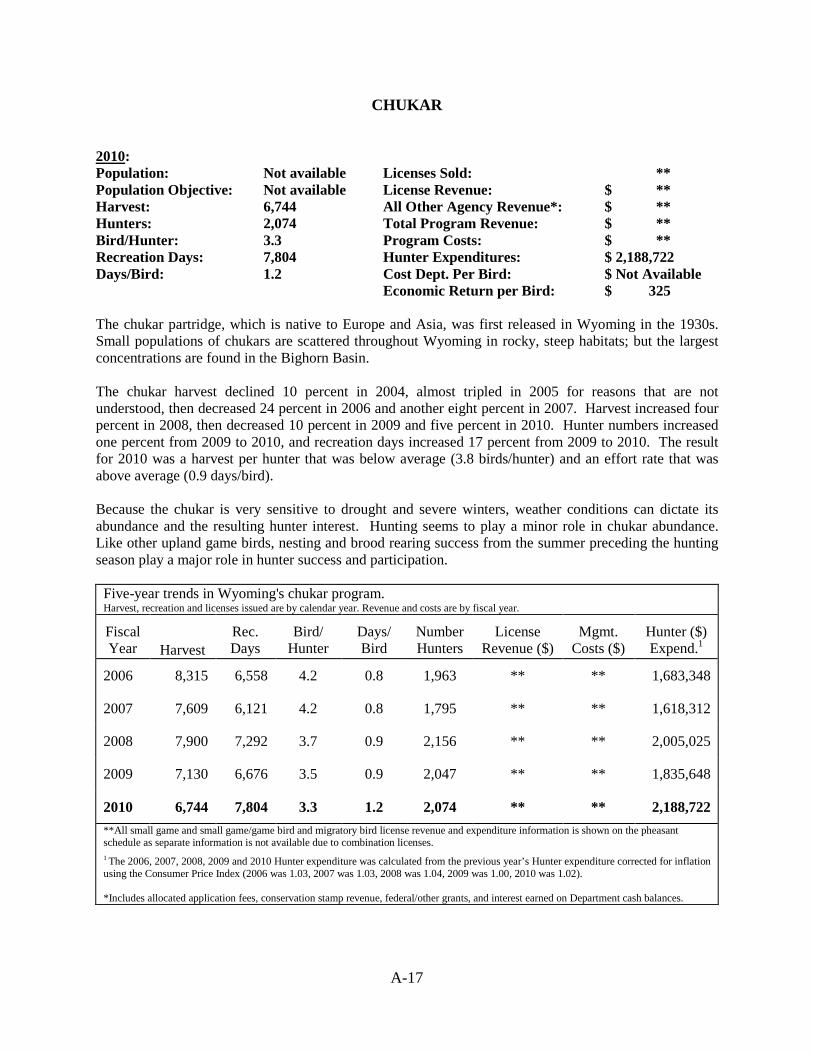
A-17
CHUKAR 2010: Population: Not available Licenses Sold: ** Population Objective: Not available License Revenue: $ ** Harvest: 6,744 All Other Agency Revenue*: $ ** Hunters: 2,074 Total Program Revenue: $ ** Bird/Hunter: 3.3 Program Costs: $ ** Recreation Days: 7,804 Hunter Expenditures: $ 2,188,722 Days/Bird: 1.2 Cost Dept. Per Bird: $ Not Available Economic Return per Bird: $ 325 The chukar partridge, which is native to Europe and Asia, was first released in Wyoming in the 1930s. Small populations of chukars are scattered throughout Wyoming in rocky, steep habitats; but the largest concentrations are found in the Bighorn Basin. The chukar harvest declined 10 percent in 2004, almost tripled in 2005 for reasons that are not understood, then decreased 24 percent in 2006 and another eight percent in 2007. Harvest increased four percent in 2008, then decreased 10 percent in 2009 and five percent in 2010. Hunter numbers increased one percent from 2009 to 2010, and recreation days increased 17 percent from 2009 to 2010. The result for 2010 was a harvest per hunter that was below average (3.8 birds/hunter) and an effort rate that was above average (0.9 days/bird). Because the chukar is very sensitive to drought and severe winters, weather conditions can dictate its abundance and the resulting hunter interest. Hunting seems to play a minor role in chukar abundance. Like other upland game birds, nesting and brood rearing success from the summer preceding the hunting season play a major role in hunter success and participation.
Five-year trends in Wyoming's chukar program. Harvest, recreation and licenses issued are by calendar year. Revenue and costs are by fiscal year. Fiscal Year
Harvest
Rec. Days
Bird/ Hunter
Days/ Bird
Number Hunters
License Revenue ($)
Mgmt. Costs ($)
Hunter ($) Expend.1
2006 8,315 6,558 4.2 0.8 1,963 ** ** 1,683,348
2007 7,609 6,121 4.2 0.8 1,795 ** ** 1,618,312
2008 7,900 7,292 3.7 0.9 2,156 ** ** 2,005,025
2009 7,130 6,676 3.5 0.9 2,047 ** ** 1,835,648
2010 6,744 7,804 3.3 1.2 2,074 ** ** 2,188,722 **All small game and small game/game bird and migratory bird license revenue and expenditure information is shown on the pheasant schedule as separate information is not available due to combination licenses. 1 The 2006, 2007, 2008, 2009 and 2010 Hunter expenditure was calculated from the previous year’s Hunter expenditure corrected for inflation using the Consumer Price Index (2006 was 1.03, 2007 was 1.03, 2008 was 1.04, 2009 was 1.00, 2010 was 1.02). *Includes allocated application fees, conservation stamp revenue, federal/other grants, and interest earned on Department cash balances.
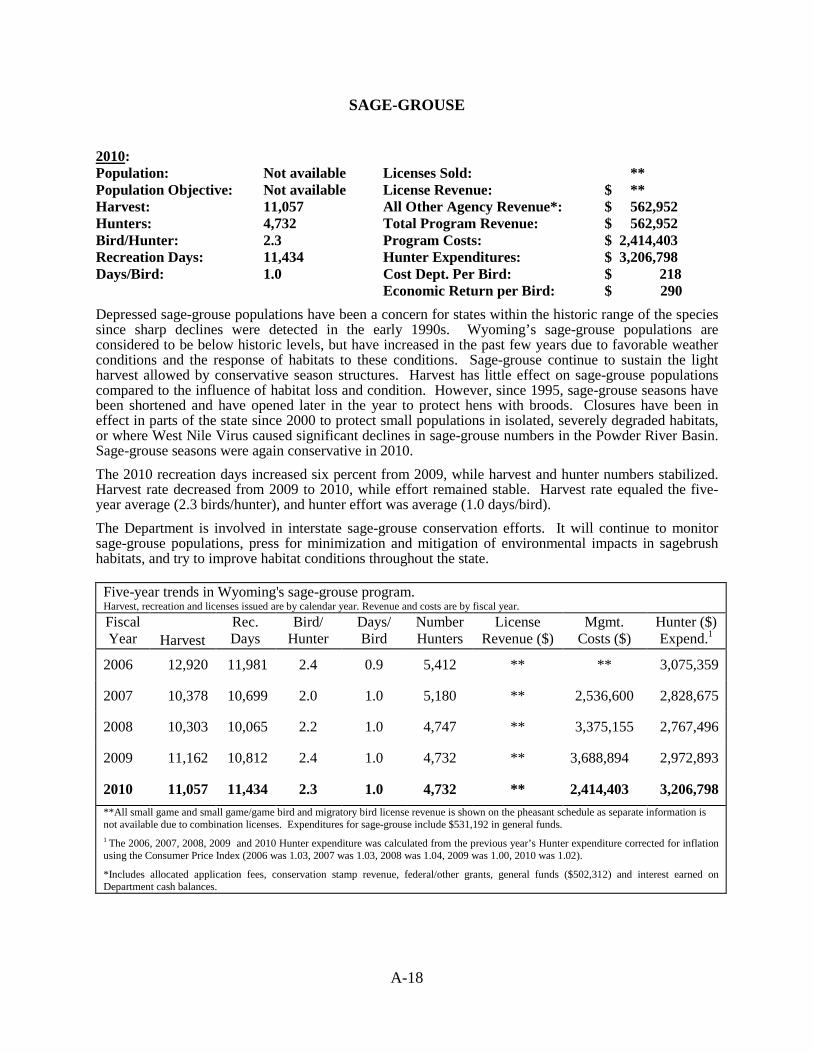
A-18
SAGE-GROUSE 2010: Population: Not available Licenses Sold: ** Population Objective: Not available License Revenue: $ ** Harvest: 11,057 All Other Agency Revenue*: $ 562,952 Hunters: 4,732 Total Program Revenue: $ 562,952 Bird/Hunter: 2.3 Program Costs: $ 2,414,403 Recreation Days: 11,434 Hunter Expenditures: $ 3,206,798 Days/Bird: 1.0 Cost Dept. Per Bird: $ 218 Economic Return per Bird: $ 290 Depressed sage-grouse populations have been a concern for states within the historic range of the species since sharp declines were detected in the early 1990s. Wyoming’s sage-grouse populations are considered to be below historic levels, but have increased in the past few years due to favorable weather conditions and the response of habitats to these conditions. Sage-grouse continue to sustain the light harvest allowed by conservative season structures. Harvest has little effect on sage-grouse populations compared to the influence of habitat loss and condition. However, since 1995, sage-grouse seasons have been shortened and have opened later in the year to protect hens with broods. Closures have been in effect in parts of the state since 2000 to protect small populations in isolated, severely degraded habitats, or where West Nile Virus caused significant declines in sage-grouse numbers in the Powder River Basin. Sage-grouse seasons were again conservative in 2010. The 2010 recreation days increased six percent from 2009, while harvest and hunter numbers stabilized. Harvest rate decreased from 2009 to 2010, while effort remained stable. Harvest rate equaled the five-year average (2.3 birds/hunter), and hunter effort was average (1.0 days/bird). The Department is involved in interstate sage-grouse conservation efforts. It will continue to monitor sage-grouse populations, press for minimization and mitigation of environmental impacts in sagebrush habitats, and try to improve habitat conditions throughout the state.
Five-year trends in Wyoming's sage-grouse program. Harvest, recreation and licenses issued are by calendar year. Revenue and costs are by fiscal year. Fiscal Year
Harvest
Rec. Days
Bird/ Hunter
Days/ Bird
Number Hunters
License Revenue ($)
Mgmt. Costs ($)
Hunter ($) Expend.1
2006 12,920 11,981 2.4 0.9 5,412 ** ** 3,075,359
2007 10,378 10,699 2.0 1.0 5,180 ** 2,536,600 2,828,675
2008 10,303 10,065 2.2 1.0 4,747 ** 3,375,155 2,767,496
2009 11,162 10,812 2.4 1.0 4,732 ** 3,688,894 2,972,893
2010 11,057 11,434 2.3 1.0 4,732 ** 2,414,403 3,206,798 **All small game and small game/game bird and migratory bird license revenue is shown on the pheasant schedule as separate information is not available due to combination licenses. Expenditures for sage-grouse include $531,192 in general funds. 1 The 2006, 2007, 2008, 2009 and 2010 Hunter expenditure was calculated from the previous year’s Hunter expenditure corrected for inflation using the Consumer Price Index (2006 was 1.03, 2007 was 1.03, 2008 was 1.04, 2009 was 1.00, 2010 was 1.02). *Includes allocated application fees, conservation stamp revenue, federal/other grants, general funds ($502,312) and interest earned on Department cash balances.
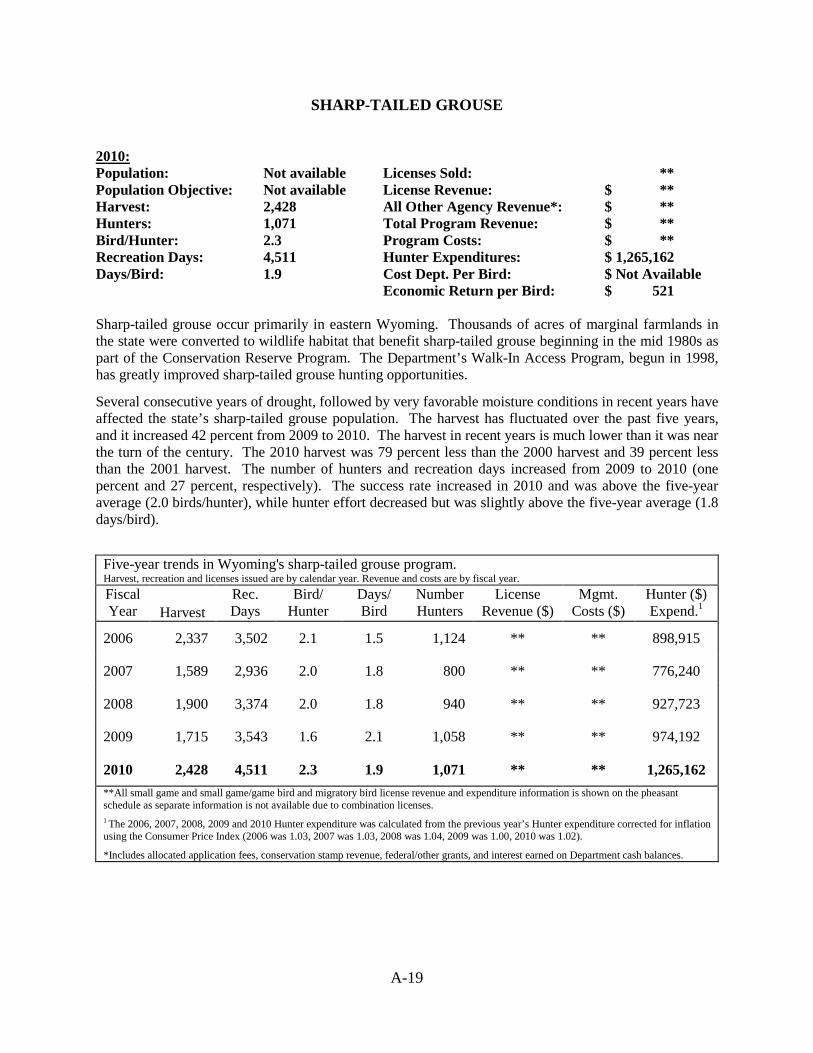
A-19
SHARP-TAILED GROUSE 2010: Population: Not available Licenses Sold: ** Population Objective: Not available License Revenue: $ ** Harvest: 2,428 All Other Agency Revenue*: $ ** Hunters: 1,071 Total Program Revenue: $ ** Bird/Hunter: 2.3 Program Costs: $ ** Recreation Days: 4,511 Hunter Expenditures: $ 1,265,162 Days/Bird: 1.9 Cost Dept. Per Bird: $ Not Available Economic Return per Bird: $ 521 Sharp-tailed grouse occur primarily in eastern Wyoming. Thousands of acres of marginal farmlands in the state were converted to wildlife habitat that benefit sharp-tailed grouse beginning in the mid 1980s as part of the Conservation Reserve Program. The Department’s Walk-In Access Program, begun in 1998, has greatly improved sharp-tailed grouse hunting opportunities. Several consecutive years of drought, followed by very favorable moisture conditions in recent years have affected the state’s sharp-tailed grouse population. The harvest has fluctuated over the past five years, and it increased 42 percent from 2009 to 2010. The harvest in recent years is much lower than it was near the turn of the century. The 2010 harvest was 79 percent less than the 2000 harvest and 39 percent less than the 2001 harvest. The number of hunters and recreation days increased from 2009 to 2010 (one percent and 27 percent, respectively). The success rate increased in 2010 and was above the five-year average (2.0 birds/hunter), while hunter effort decreased but was slightly above the five-year average (1.8 days/bird).
Five-year trends in Wyoming's sharp-tailed grouse program. Harvest, recreation and licenses issued are by calendar year. Revenue and costs are by fiscal year. Fiscal Year
Harvest
Rec. Days
Bird/ Hunter
Days/ Bird
Number Hunters
License Revenue ($)
Mgmt. Costs ($)
Hunter ($) Expend.1
2006 2,337 3,502 2.1 1.5 1,124 ** ** 898,915
2007 1,589 2,936 2.0 1.8 800 ** ** 776,240
2008 1,900 3,374 2.0 1.8 940 ** ** 927,723
2009 1,715 3,543 1.6 2.1 1,058 ** ** 974,192
2010 2,428 4,511 2.3 1.9 1,071 ** ** 1,265,162 **All small game and small game/game bird and migratory bird license revenue and expenditure information is shown on the pheasant schedule as separate information is not available due to combination licenses. 1 The 2006, 2007, 2008, 2009 and 2010 Hunter expenditure was calculated from the previous year’s Hunter expenditure corrected for inflation using the Consumer Price Index (2006 was 1.03, 2007 was 1.03, 2008 was 1.04, 2009 was 1.00, 2010 was 1.02). *Includes allocated application fees, conservation stamp revenue, federal/other grants, and interest earned on Department cash balances.
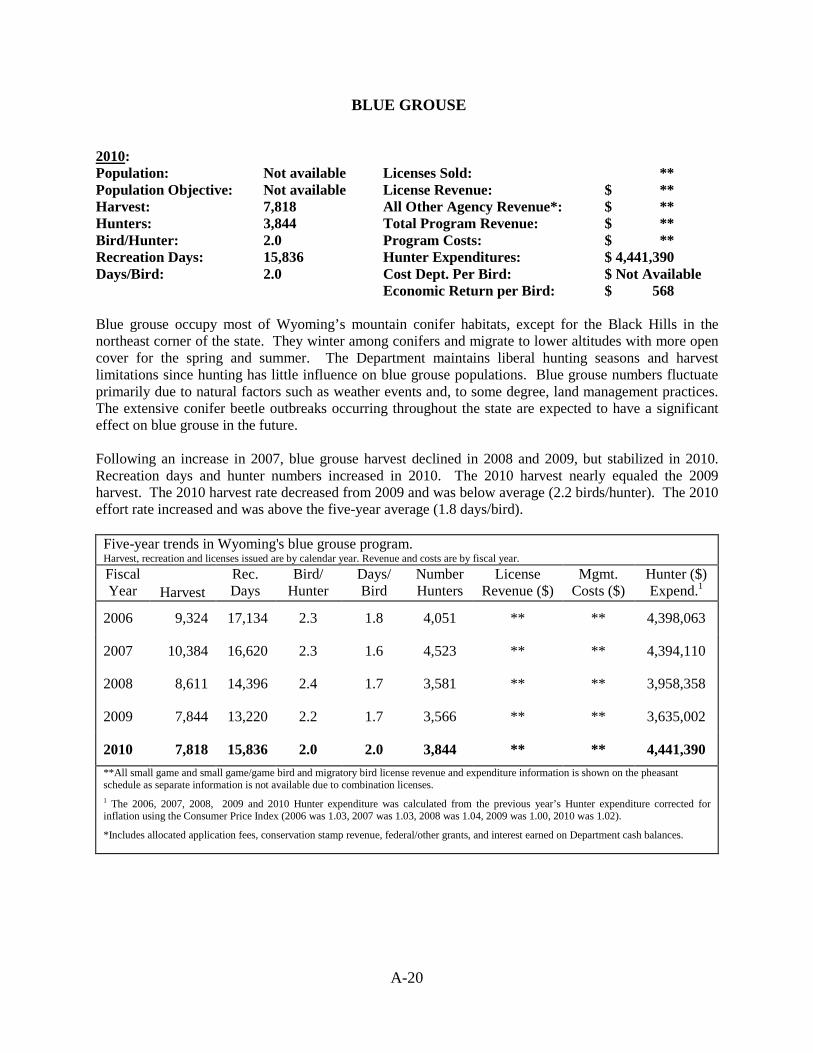
A-20
BLUE GROUSE 2010: Population: Not available Licenses Sold: ** Population Objective: Not available License Revenue: $ ** Harvest: 7,818 All Other Agency Revenue*: $ ** Hunters: 3,844 Total Program Revenue: $ ** Bird/Hunter: 2.0 Program Costs: $ ** Recreation Days: 15,836 Hunter Expenditures: $ 4,441,390 Days/Bird: 2.0 Cost Dept. Per Bird: $ Not Available Economic Return per Bird: $ 568 Blue grouse occupy most of Wyoming’s mountain conifer habitats, except for the Black Hills in the northeast corner of the state. They winter among conifers and migrate to lower altitudes with more open cover for the spring and summer. The Department maintains liberal hunting seasons and harvest limitations since hunting has little influence on blue grouse populations. Blue grouse numbers fluctuate primarily due to natural factors such as weather events and, to some degree, land management practices. The extensive conifer beetle outbreaks occurring throughout the state are expected to have a significant effect on blue grouse in the future. Following an increase in 2007, blue grouse harvest declined in 2008 and 2009, but stabilized in 2010. Recreation days and hunter numbers increased in 2010. The 2010 harvest nearly equaled the 2009 harvest. The 2010 harvest rate decreased from 2009 and was below average (2.2 birds/hunter). The 2010 effort rate increased and was above the five-year average (1.8 days/bird).
Five-year trends in Wyoming's blue grouse program. Harvest, recreation and licenses issued are by calendar year. Revenue and costs are by fiscal year. Fiscal Year
Harvest
Rec. Days
Bird/ Hunter
Days/ Bird
Number Hunters
License Revenue ($)
Mgmt. Costs ($)
Hunter ($) Expend.1
2006 9,324 17,134 2.3 1.8 4,051 ** ** 4,398,063
2007 10,384 16,620 2.3 1.6 4,523 ** ** 4,394,110
2008 8,611 14,396 2.4 1.7 3,581 ** ** 3,958,358
2009 7,844 13,220 2.2 1.7 3,566 ** ** 3,635,002
2010 7,818 15,836 2.0 2.0 3,844 ** ** 4,441,390 **All small game and small game/game bird and migratory bird license revenue and expenditure information is shown on the pheasant schedule as separate information is not available due to combination licenses. 1 The 2006, 2007, 2008, 2009 and 2010 Hunter expenditure was calculated from the previous year’s Hunter expenditure corrected for inflation using the Consumer Price Index (2006 was 1.03, 2007 was 1.03, 2008 was 1.04, 2009 was 1.00, 2010 was 1.02). *Includes allocated application fees, conservation stamp revenue, federal/other grants, and interest earned on Department cash balances.
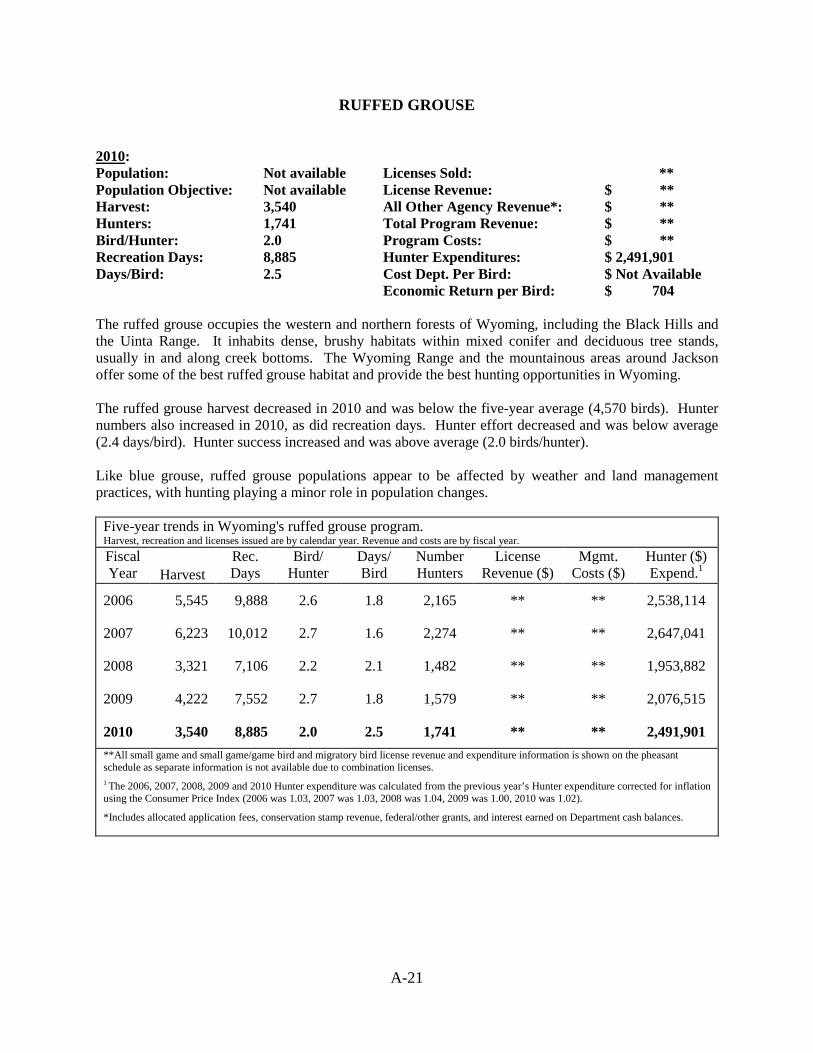
A-21
RUFFED GROUSE 2010: Population: Not available Licenses Sold: ** Population Objective: Not available License Revenue: $ ** Harvest: 3,540 All Other Agency Revenue*: $ ** Hunters: 1,741 Total Program Revenue: $ ** Bird/Hunter: 2.0 Program Costs: $ ** Recreation Days: 8,885 Hunter Expenditures: $ 2,491,901 Days/Bird: 2.5 Cost Dept. Per Bird: $ Not Available Economic Return per Bird: $ 704 The ruffed grouse occupies the western and northern forests of Wyoming, including the Black Hills and the Uinta Range. It inhabits dense, brushy habitats within mixed conifer and deciduous tree stands, usually in and along creek bottoms. The Wyoming Range and the mountainous areas around Jackson offer some of the best ruffed grouse habitat and provide the best hunting opportunities in Wyoming. The ruffed grouse harvest decreased in 2010 and was below the five-year average (4,570 birds). Hunter numbers also increased in 2010, as did recreation days. Hunter effort decreased and was below average (2.4 days/bird). Hunter success increased and was above average (2.0 birds/hunter). Like blue grouse, ruffed grouse populations appear to be affected by weather and land management practices, with hunting playing a minor role in population changes.
Five-year trends in Wyoming's ruffed grouse program. Harvest, recreation and licenses issued are by calendar year. Revenue and costs are by fiscal year. Fiscal Year
Harvest
Rec. Days
Bird/ Hunter
Days/ Bird
Number Hunters
License Revenue ($)
Mgmt. Costs ($)
Hunter ($) Expend.1
2006 5,545 9,888 2.6 1.8 2,165 ** ** 2,538,114
2007 6,223 10,012 2.7 1.6 2,274 ** ** 2,647,041
2008 3,321 7,106 2.2 2.1 1,482 ** ** 1,953,882
2009 4,222 7,552 2.7 1.8 1,579 ** ** 2,076,515
2010 3,540 8,885 2.0 2.5 1,741 ** ** 2,491,901 **All small game and small game/game bird and migratory bird license revenue and expenditure information is shown on the pheasant schedule as separate information is not available due to combination licenses. 1 The 2006, 2007, 2008, 2009 and 2010 Hunter expenditure was calculated from the previous year’s Hunter expenditure corrected for inflation using the Consumer Price Index (2006 was 1.03, 2007 was 1.03, 2008 was 1.04, 2009 was 1.00, 2010 was 1.02). *Includes allocated application fees, conservation stamp revenue, federal/other grants, and interest earned on Department cash balances.
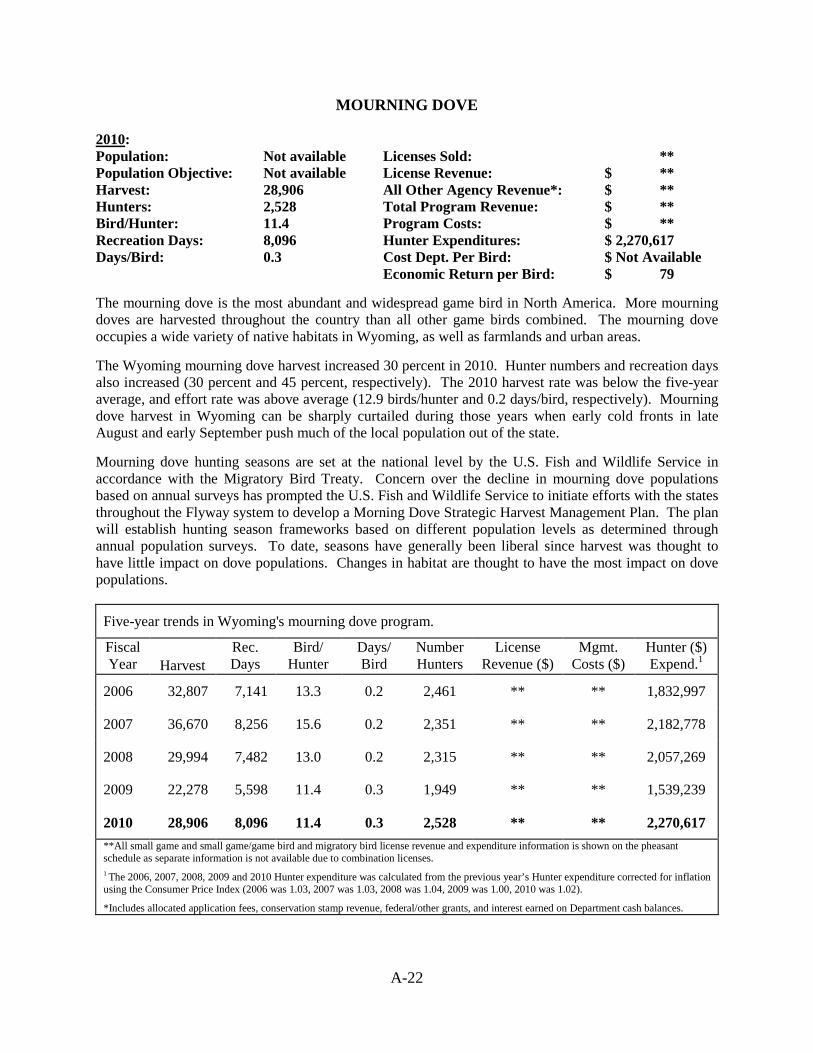
A-22
MOURNING DOVE 2010: Population: Not available Licenses Sold: ** Population Objective: Not available License Revenue: $ ** Harvest: 28,906 All Other Agency Revenue*: $ ** Hunters: 2,528 Total Program Revenue: $ ** Bird/Hunter: 11.4 Program Costs: $ ** Recreation Days: 8,096 Hunter Expenditures: $ 2,270,617 Days/Bird: 0.3 Cost Dept. Per Bird: $ Not Available Economic Return per Bird: $ 79 The mourning dove is the most abundant and widespread game bird in North America. More mourning doves are harvested throughout the country than all other game birds combined. The mourning dove occupies a wide variety of native habitats in Wyoming, as well as farmlands and urban areas. The Wyoming mourning dove harvest increased 30 percent in 2010. Hunter numbers and recreation days also increased (30 percent and 45 percent, respectively). The 2010 harvest rate was below the five-year average, and effort rate was above average (12.9 birds/hunter and 0.2 days/bird, respectively). Mourning dove harvest in Wyoming can be sharply curtailed during those years when early cold fronts in late August and early September push much of the local population out of the state. Mourning dove hunting seasons are set at the national level by the U.S. Fish and Wildlife Service in accordance with the Migratory Bird Treaty. Concern over the decline in mourning dove populations based on annual surveys has prompted the U.S. Fish and Wildlife Service to initiate efforts with the states throughout the Flyway system to develop a Morning Dove Strategic Harvest Management Plan. The plan will establish hunting season frameworks based on different population levels as determined through annual population surveys. To date, seasons have generally been liberal since harvest was thought to have little impact on dove populations. Changes in habitat are thought to have the most impact on dove populations.
Five-year trends in Wyoming's mourning dove program. Fiscal Year
Harvest
Rec. Days
Bird/ Hunter
Days/ Bird
Number Hunters
License Revenue ($)
Mgmt. Costs ($)
Hunter ($) Expend.1
2006 32,807 7,141 13.3 0.2 2,461 ** ** 1,832,997
2007 36,670 8,256 15.6 0.2 2,351 ** ** 2,182,778
2008 29,994 7,482 13.0 0.2 2,315 ** ** 2,057,269
2009 22,278 5,598 11.4 0.3 1,949 ** ** 1,539,239
2010 28,906 8,096 11.4 0.3 2,528 ** ** 2,270,617 **All small game and small game/game bird and migratory bird license revenue and expenditure information is shown on the pheasant schedule as separate information is not available due to combination licenses. 1 The 2006, 2007, 2008, 2009 and 2010 Hunter expenditure was calculated from the previous year’s Hunter expenditure corrected for inflation using the Consumer Price Index (2006 was 1.03, 2007 was 1.03, 2008 was 1.04, 2009 was 1.00, 2010 was 1.02). *Includes allocated application fees, conservation stamp revenue, federal/other grants, and interest earned on Department cash balances.
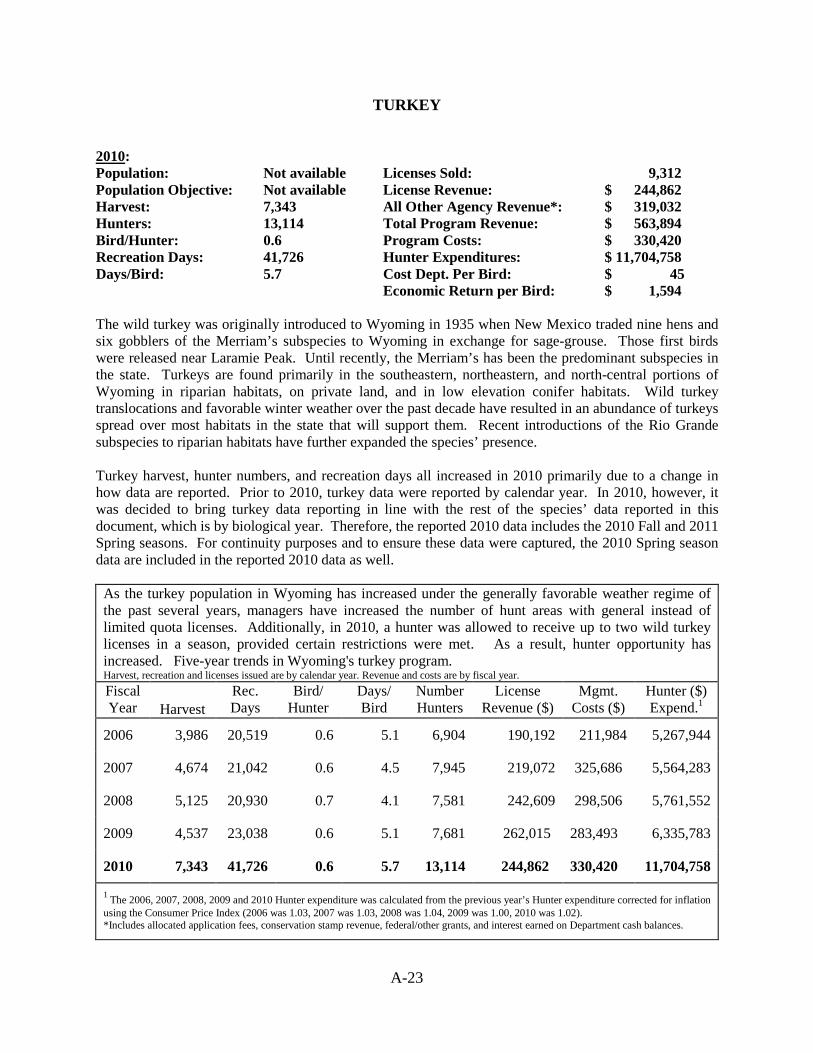
A-23
TURKEY 2010: Population: Not available Licenses Sold: 9,312 Population Objective: Not available License Revenue: $ 244,862 Harvest: 7,343 All Other Agency Revenue*: $ 319,032 Hunters: 13,114 Total Program Revenue: $ 563,894 Bird/Hunter: 0.6 Program Costs: $ 330,420 Recreation Days: 41,726 Hunter Expenditures: $ 11,704,758 Days/Bird: 5.7 Cost Dept. Per Bird: $ 45 Economic Return per Bird: $ 1,594 The wild turkey was originally introduced to Wyoming in 1935 when New Mexico traded nine hens and six gobblers of the Merriam’s subspecies to Wyoming in exchange for sage-grouse. Those first birds were released near Laramie Peak. Until recently, the Merriam’s has been the predominant subspecies in the state. Turkeys are found primarily in the southeastern, northeastern, and north-central portions of Wyoming in riparian habitats, on private land, and in low elevation conifer habitats. Wild turkey translocations and favorable winter weather over the past decade have resulted in an abundance of turkeys spread over most habitats in the state that will support them. Recent introductions of the Rio Grande subspecies to riparian habitats have further expanded the species’ presence. Turkey harvest, hunter numbers, and recreation days all increased in 2010 primarily due to a change in how data are reported. Prior to 2010, turkey data were reported by calendar year. In 2010, however, it was decided to bring turkey data reporting in line with the rest of the species’ data reported in this document, which is by biological year. Therefore, the reported 2010 data includes the 2010 Fall and 2011 Spring seasons. For continuity purposes and to ensure these data were captured, the 2010 Spring season data are included in the reported 2010 data as well.
As the turkey population in Wyoming has increased under the generally favorable weather regime of the past several years, managers have increased the number of hunt areas with general instead of limited quota licenses. Additionally, in 2010, a hunter was allowed to receive up to two wild turkey licenses in a season, provided certain restrictions were met. As a result, hunter opportunity has increased. Five-year trends in Wyoming's turkey program. Harvest, recreation and licenses issued are by calendar year. Revenue and costs are by fiscal year. Fiscal Year
Harvest
Rec. Days
Bird/ Hunter
Days/ Bird
Number Hunters
License Revenue ($)
Mgmt. Costs ($)
Hunter ($) Expend.1
2006 3,986 20,519 0.6 5.1 6,904 190,192 211,984 5,267,944
2007 4,674 21,042 0.6 4.5 7,945 219,072 325,686 5,564,283
2008 5,125 20,930 0.7 4.1 7,581 242,609 298,506 5,761,552
2009 4,537 23,038 0.6 5.1 7,681 262,015 283,493 6,335,783
2010 7,343 41,726 0.6 5.7 13,114 244,862 330,420 11,704,758
1 The 2006, 2007, 2008, 2009 and 2010 Hunter expenditure was calculated from the previous year’s Hunter expenditure corrected for inflation using the Consumer Price Index (2006 was 1.03, 2007 was 1.03, 2008 was 1.04, 2009 was 1.00, 2010 was 1.02). *Includes allocated application fees, conservation stamp revenue, federal/other grants, and interest earned on Department cash balances.
WATERFOWL
Duck Goose
Sandhill Crane Rail, Snipe, Coot
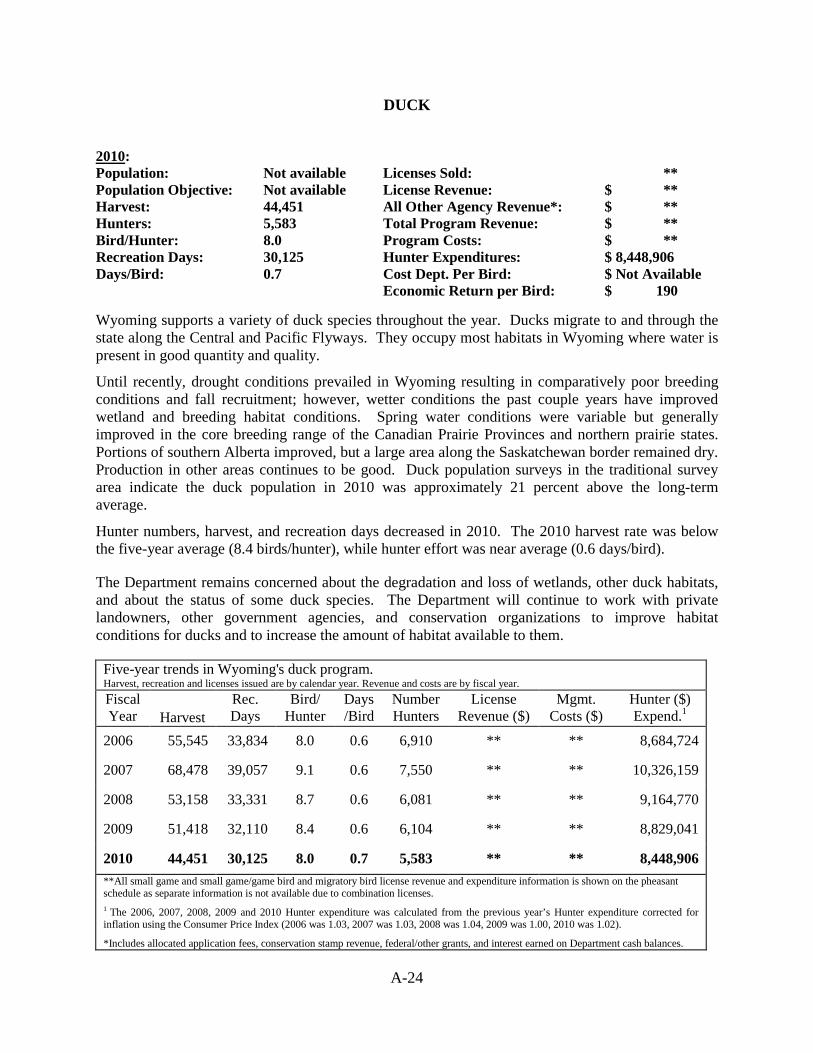
A-24
DUCK 2010: Population: Not available Licenses Sold: ** Population Objective: Not available License Revenue: $ ** Harvest: 44,451 All Other Agency Revenue*: $ ** Hunters: 5,583 Total Program Revenue: $ ** Bird/Hunter: 8.0 Program Costs: $ ** Recreation Days: 30,125 Hunter Expenditures: $ 8,448,906 Days/Bird: 0.7 Cost Dept. Per Bird: $ Not Available Economic Return per Bird: $ 190 Wyoming supports a variety of duck species throughout the year. Ducks migrate to and through the state along the Central and Pacific Flyways. They occupy most habitats in Wyoming where water is present in good quantity and quality. Until recently, drought conditions prevailed in Wyoming resulting in comparatively poor breeding conditions and fall recruitment; however, wetter conditions the past couple years have improved wetland and breeding habitat conditions. Spring water conditions were variable but generally improved in the core breeding range of the Canadian Prairie Provinces and northern prairie states. Portions of southern Alberta improved, but a large area along the Saskatchewan border remained dry. Production in other areas continues to be good. Duck population surveys in the traditional survey area indicate the duck population in 2010 was approximately 21 percent above the long-term average. Hunter numbers, harvest, and recreation days decreased in 2010. The 2010 harvest rate was below the five-year average (8.4 birds/hunter), while hunter effort was near average (0.6 days/bird).
The Department remains concerned about the degradation and loss of wetlands, other duck habitats, and about the status of some duck species. The Department will continue to work with private landowners, other government agencies, and conservation organizations to improve habitat conditions for ducks and to increase the amount of habitat available to them.
Five-year trends in Wyoming's duck program. Harvest, recreation and licenses issued are by calendar year. Revenue and costs are by fiscal year. Fiscal Year
Harvest
Rec. Days
Bird/ Hunter
Days/Bird
Number Hunters
License Revenue ($)
Mgmt. Costs ($)
Hunter ($) Expend.1
2006 55,545 33,834 8.0 0.6 6,910 ** ** 8,684,724
2007 68,478 39,057 9.1 0.6 7,550 ** ** 10,326,159
2008 53,158 33,331 8.7 0.6 6,081 ** ** 9,164,770
2009 51,418 32,110 8.4 0.6 6,104 ** ** 8,829,041
2010 44,451 30,125 8.0 0.7 5,583 ** ** 8,448,906 **All small game and small game/game bird and migratory bird license revenue and expenditure information is shown on the pheasant schedule as separate information is not available due to combination licenses. 1 The 2006, 2007, 2008, 2009 and 2010 Hunter expenditure was calculated from the previous year’s Hunter expenditure corrected for inflation using the Consumer Price Index (2006 was 1.03, 2007 was 1.03, 2008 was 1.04, 2009 was 1.00, 2010 was 1.02). *Includes allocated application fees, conservation stamp revenue, federal/other grants, and interest earned on Department cash balances.
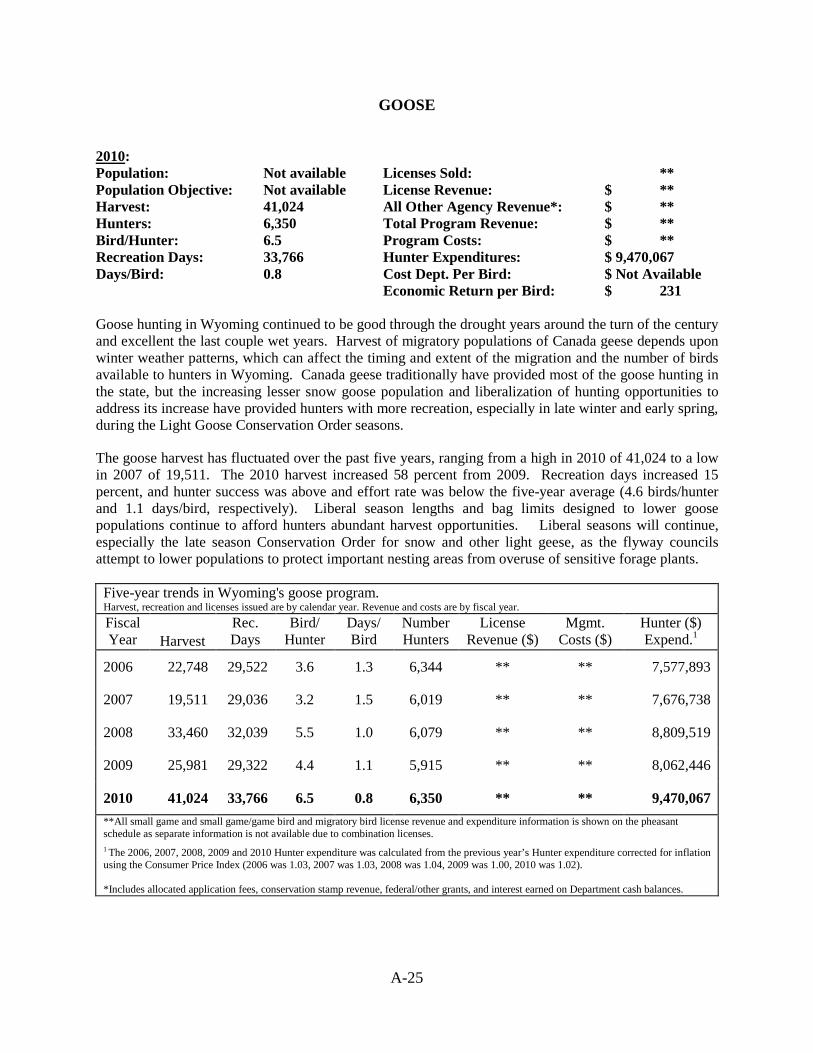
A-25
GOOSE 2010: Population: Not available Licenses Sold: ** Population Objective: Not available License Revenue: $ ** Harvest: 41,024 All Other Agency Revenue*: $ ** Hunters: 6,350 Total Program Revenue: $ ** Bird/Hunter: 6.5 Program Costs: $ ** Recreation Days: 33,766 Hunter Expenditures: $ 9,470,067 Days/Bird: 0.8 Cost Dept. Per Bird: $ Not Available Economic Return per Bird: $ 231 Goose hunting in Wyoming continued to be good through the drought years around the turn of the century and excellent the last couple wet years. Harvest of migratory populations of Canada geese depends upon winter weather patterns, which can affect the timing and extent of the migration and the number of birds available to hunters in Wyoming. Canada geese traditionally have provided most of the goose hunting in the state, but the increasing lesser snow goose population and liberalization of hunting opportunities to address its increase have provided hunters with more recreation, especially in late winter and early spring, during the Light Goose Conservation Order seasons.
The goose harvest has fluctuated over the past five years, ranging from a high in 2010 of 41,024 to a low in 2007 of 19,511. The 2010 harvest increased 58 percent from 2009. Recreation days increased 15 percent, and hunter success was above and effort rate was below the five-year average (4.6 birds/hunter and 1.1 days/bird, respectively). Liberal season lengths and bag limits designed to lower goose populations continue to afford hunters abundant harvest opportunities. Liberal seasons will continue, especially the late season Conservation Order for snow and other light geese, as the flyway councils attempt to lower populations to protect important nesting areas from overuse of sensitive forage plants.
Five-year trends in Wyoming's goose program. Harvest, recreation and licenses issued are by calendar year. Revenue and costs are by fiscal year. Fiscal Year
Harvest
Rec. Days
Bird/ Hunter
Days/ Bird
Number Hunters
License Revenue ($)
Mgmt. Costs ($)
Hunter ($) Expend.1
2006 22,748 29,522 3.6 1.3 6,344 ** ** 7,577,893
2007 19,511 29,036 3.2 1.5 6,019 ** ** 7,676,738
2008 33,460 32,039 5.5 1.0 6,079 ** ** 8,809,519
2009 25,981 29,322 4.4 1.1 5,915 ** ** 8,062,446
2010 41,024 33,766 6.5 0.8 6,350 ** ** 9,470,067 **All small game and small game/game bird and migratory bird license revenue and expenditure information is shown on the pheasant schedule as separate information is not available due to combination licenses. 1 The 2006, 2007, 2008, 2009 and 2010 Hunter expenditure was calculated from the previous year’s Hunter expenditure corrected for inflation using the Consumer Price Index (2006 was 1.03, 2007 was 1.03, 2008 was 1.04, 2009 was 1.00, 2010 was 1.02). *Includes allocated application fees, conservation stamp revenue, federal/other grants, and interest earned on Department cash balances.
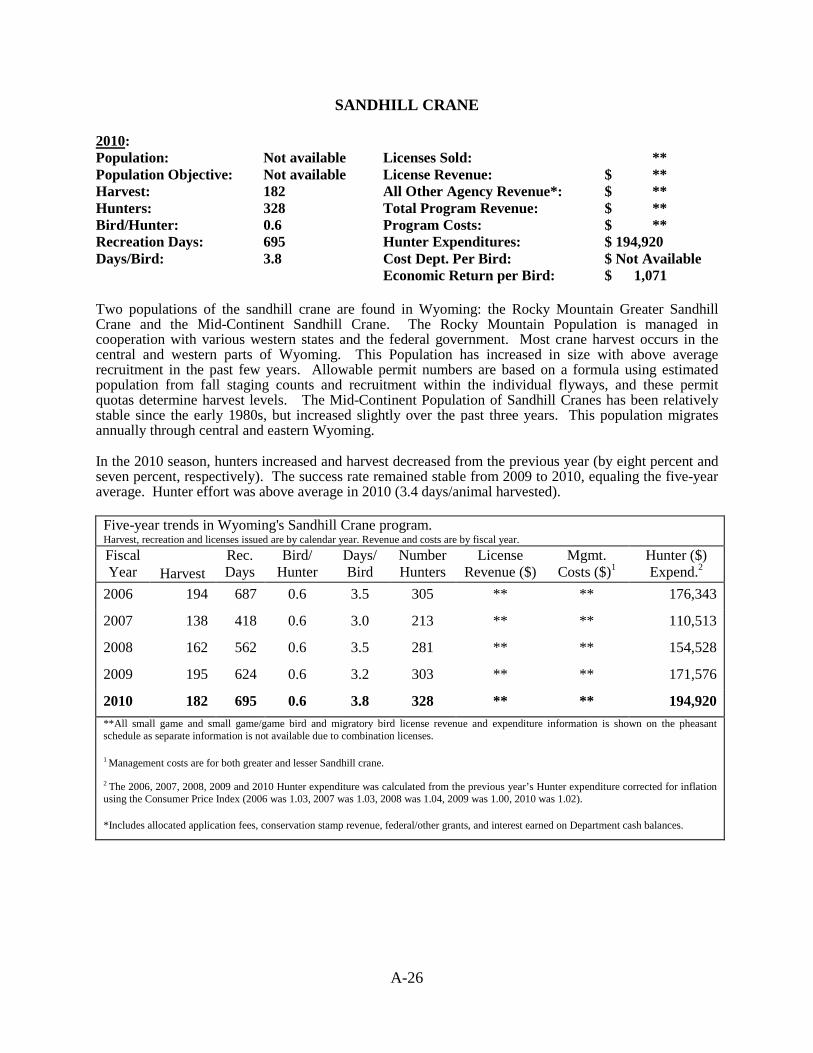
A-26
SANDHILL CRANE 2010: Population: Not available Licenses Sold: ** Population Objective: Not available License Revenue: $ ** Harvest: 182 All Other Agency Revenue*: $ ** Hunters: 328 Total Program Revenue: $ ** Bird/Hunter: 0.6 Program Costs: $ ** Recreation Days: 695 Hunter Expenditures: $ 194,920 Days/Bird: 3.8 Cost Dept. Per Bird: $ Not Available Economic Return per Bird: $ 1,071 Two populations of the sandhill crane are found in Wyoming: the Rocky Mountain Greater Sandhill Crane and the Mid-Continent Sandhill Crane. The Rocky Mountain Population is managed in cooperation with various western states and the federal government. Most crane harvest occurs in the central and western parts of Wyoming. This Population has increased in size with above average recruitment in the past few years. Allowable permit numbers are based on a formula using estimated population from fall staging counts and recruitment within the individual flyways, and these permit quotas determine harvest levels. The Mid-Continent Population of Sandhill Cranes has been relatively stable since the early 1980s, but increased slightly over the past three years. This population migrates annually through central and eastern Wyoming.
In the 2010 season, hunters increased and harvest decreased from the previous year (by eight percent and seven percent, respectively). The success rate remained stable from 2009 to 2010, equaling the five-year average. Hunter effort was above average in 2010 (3.4 days/animal harvested).
Five-year trends in Wyoming's Sandhill Crane program. Harvest, recreation and licenses issued are by calendar year. Revenue and costs are by fiscal year. Fiscal Year
Harvest
Rec. Days
Bird/ Hunter
Days/ Bird
Number Hunters
License Revenue ($)
Mgmt. Costs ($)1
Hunter ($) Expend.2
2006 194 687 0.6 3.5 305 ** ** 176,343
2007 138 418 0.6 3.0 213 ** ** 110,513
2008 162 562 0.6 3.5 281 ** ** 154,528
2009 195 624 0.6 3.2 303 ** ** 171,576
2010 182 695 0.6 3.8 328 ** ** 194,920 **All small game and small game/game bird and migratory bird license revenue and expenditure information is shown on the pheasant schedule as separate information is not available due to combination licenses. 1 Management costs are for both greater and lesser Sandhill crane. 2 The 2006, 2007, 2008, 2009 and 2010 Hunter expenditure was calculated from the previous year’s Hunter expenditure corrected for inflation using the Consumer Price Index (2006 was 1.03, 2007 was 1.03, 2008 was 1.04, 2009 was 1.00, 2010 was 1.02). *Includes allocated application fees, conservation stamp revenue, federal/other grants, and interest earned on Department cash balances.
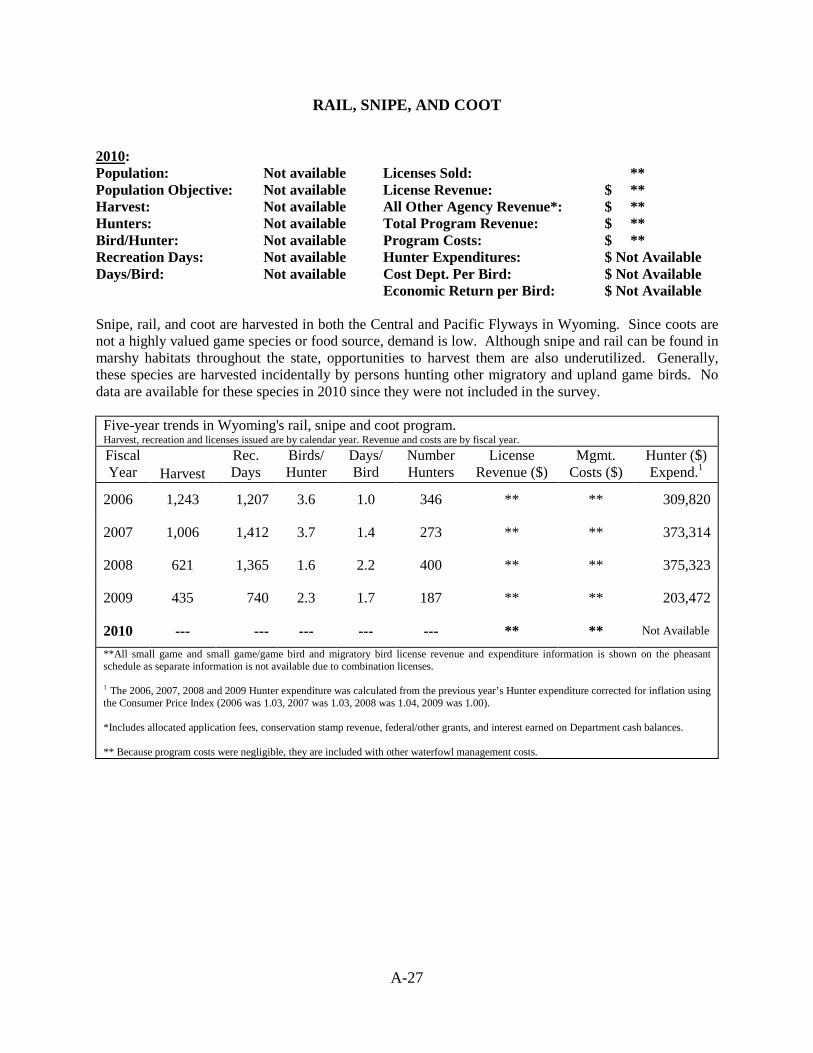
A-27
RAIL, SNIPE, AND COOT 2010: Population: Not available Licenses Sold: ** Population Objective: Not available License Revenue: $ ** Harvest: Not available All Other Agency Revenue*: $ ** Hunters: Not available Total Program Revenue: $ ** Bird/Hunter: Not available Program Costs: $ ** Recreation Days: Not available Hunter Expenditures: $ Not Available Days/Bird: Not available Cost Dept. Per Bird: $ Not Available Economic Return per Bird: $ Not Available Snipe, rail, and coot are harvested in both the Central and Pacific Flyways in Wyoming. Since coots are not a highly valued game species or food source, demand is low. Although snipe and rail can be found in marshy habitats throughout the state, opportunities to harvest them are also underutilized. Generally, these species are harvested incidentally by persons hunting other migratory and upland game birds. No data are available for these species in 2010 since they were not included in the survey.
Five-year trends in Wyoming's rail, snipe and coot program. Harvest, recreation and licenses issued are by calendar year. Revenue and costs are by fiscal year. Fiscal Year
Harvest
Rec. Days
Birds/ Hunter
Days/ Bird
Number Hunters
License Revenue ($)
Mgmt. Costs ($)
Hunter ($) Expend.1
2006 1,243 1,207 3.6 1.0 346 ** ** 309,820
2007 1,006 1,412 3.7 1.4 273 ** ** 373,314
2008 621 1,365 1.6 2.2 400 ** ** 375,323
2009 435 740 2.3 1.7 187 ** ** 203,472
2010 --- --- --- --- --- ** ** Not Available
**All small game and small game/game bird and migratory bird license revenue and expenditure information is shown on the pheasant schedule as separate information is not available due to combination licenses. 1 The 2006, 2007, 2008 and 2009 Hunter expenditure was calculated from the previous year’s Hunter expenditure corrected for inflation using the Consumer Price Index (2006 was 1.03, 2007 was 1.03, 2008 was 1.04, 2009 was 1.00). *Includes allocated application fees, conservation stamp revenue, federal/other grants, and interest earned on Department cash balances. ** Because program costs were negligible, they are included with other waterfowl management costs.
FISHERIES
Sport Fisheries
Commercial Fisheries
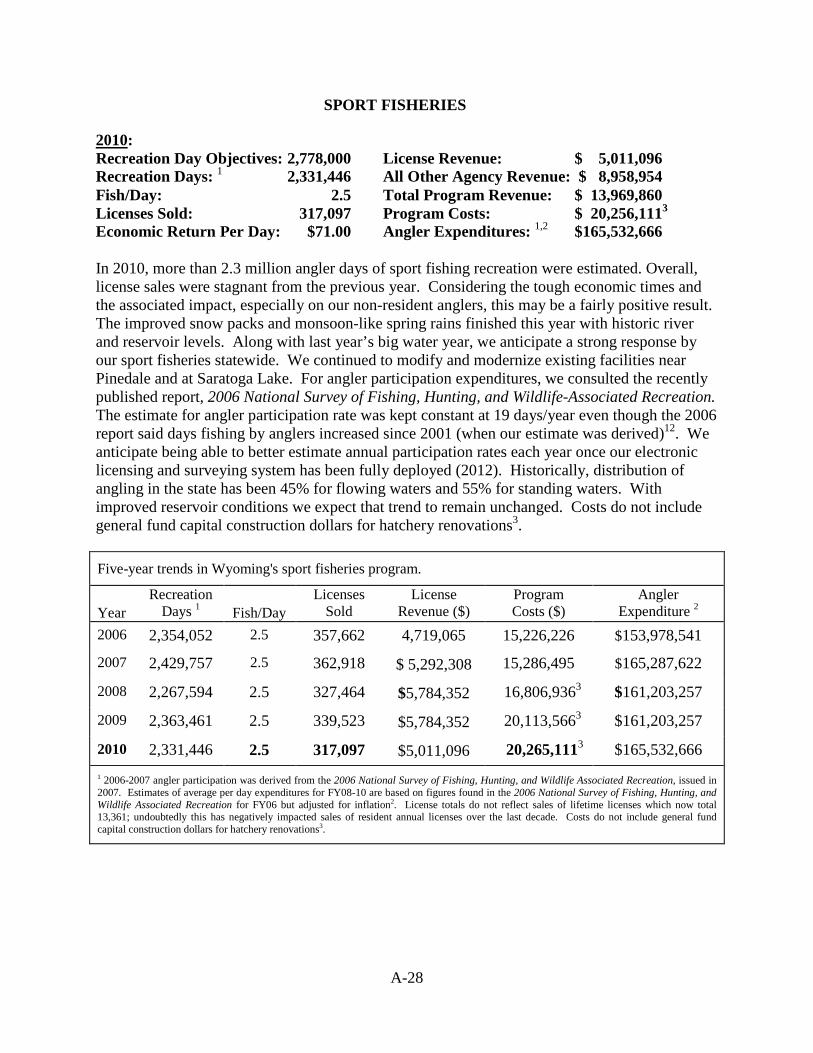
A-28
SPORT FISHERIES 2010: Recreation Day Objectives: 2,778,000 License Revenue: $ 5,011,096 Recreation Days: 1 2,331,446 All Other Agency Revenue: $ 8,958,954 Fish/Day: 2.5 Total Program Revenue: $ 13,969,860 Licenses Sold: 317,097 Program Costs: $ 20,256,1113 Economic Return Per Day: $71.00 Angler Expenditures: 1,2 $165,532,666 In 2010, more than 2.3 million angler days of sport fishing recreation were estimated. Overall, license sales were stagnant from the previous year. Considering the tough economic times and the associated impact, especially on our non-resident anglers, this may be a fairly positive result. The improved snow packs and monsoon-like spring rains finished this year with historic river and reservoir levels. Along with last year’s big water year, we anticipate a strong response by our sport fisheries statewide. We continued to modify and modernize existing facilities near Pinedale and at Saratoga Lake. For angler participation expenditures, we consulted the recently published report, 2006 National Survey of Fishing, Hunting, and Wildlife-Associated Recreation. The estimate for angler participation rate was kept constant at 19 days/year even though the 2006 report said days fishing by anglers increased since 2001 (when our estimate was derived)12. We anticipate being able to better estimate annual participation rates each year once our electronic licensing and surveying system has been fully deployed (2012). Historically, distribution of angling in the state has been 45% for flowing waters and 55% for standing waters. With improved reservoir conditions we expect that trend to remain unchanged. Costs do not include general fund capital construction dollars for hatchery renovations3.
Five-year trends in Wyoming's sport fisheries program.
Year
Recreation Days 1
Fish/Day
Licenses Sold
License Revenue ($)
Program Costs ($)
Angler Expenditure 2
2006 2,354,052 2.5 357,662 4,719,065 15,226,226 $153,978,541
2007 2,429,757 2.5 362,918 $ 5,292,308 15,286,495 $165,287,622
2008 2,267,594 2.5 327,464 $5,784,352 16,806,9363 $161,203,257
2009 2,363,461 2.5 339,523 $5,784,352 20,113,5663 $161,203,257
2010 2,331,446 2.5 317,097 $5,011,096 20,265,1113 $165,532,666 1 2006-2007 angler participation was derived from the 2006 National Survey of Fishing, Hunting, and Wildlife Associated Recreation, issued in 2007. Estimates of average per day expenditures for FY08-10 are based on figures found in the 2006 National Survey of Fishing, Hunting, and Wildlife Associated Recreation for FY06 but adjusted for inflation2. License totals do not reflect sales of lifetime licenses which now total 13,361; undoubtedly this has negatively impacted sales of resident annual licenses over the last decade. Costs do not include general fund capital construction dollars for hatchery renovations3.
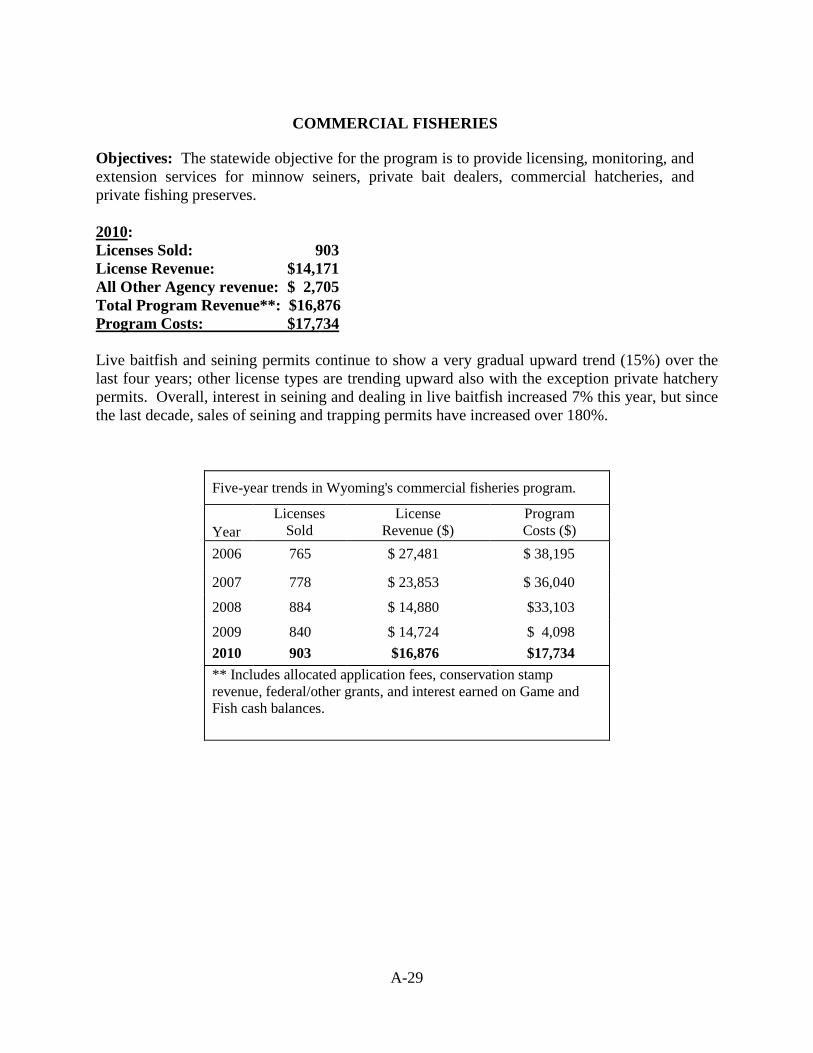
A-29
COMMERCIAL FISHERIES
Objectives: The statewide objective for the program is to provide licensing, monitoring, and extension services for minnow seiners, private bait dealers, commercial hatcheries, and private fishing preserves. 2010: Licenses Sold: 903 License Revenue: $14,171 All Other Agency revenue: $ 2,705 Total Program Revenue**: $16,876 Program Costs: $17,734 Live baitfish and seining permits continue to show a very gradual upward trend (15%) over the last four years; other license types are trending upward also with the exception private hatchery permits. Overall, interest in seining and dealing in live baitfish increased 7% this year, but since the last decade, sales of seining and trapping permits have increased over 180%.
Five-year trends in Wyoming's commercial fisheries program.
Year
Licenses Sold
License Revenue ($)
Program Costs ($)
2006 765 $ 27,481 $ 38,195
2007 778 $ 23,853 $ 36,040 2008 884 $ 14,880 $33,103 2009 2010
840 903
$ 14,724 $16,876
$ 4,098 $17,734
** Includes allocated application fees, conservation stamp revenue, federal/other grants, and interest earned on Game and Fish cash balances.
FURBEARERS Bobcat
Other Furbearers
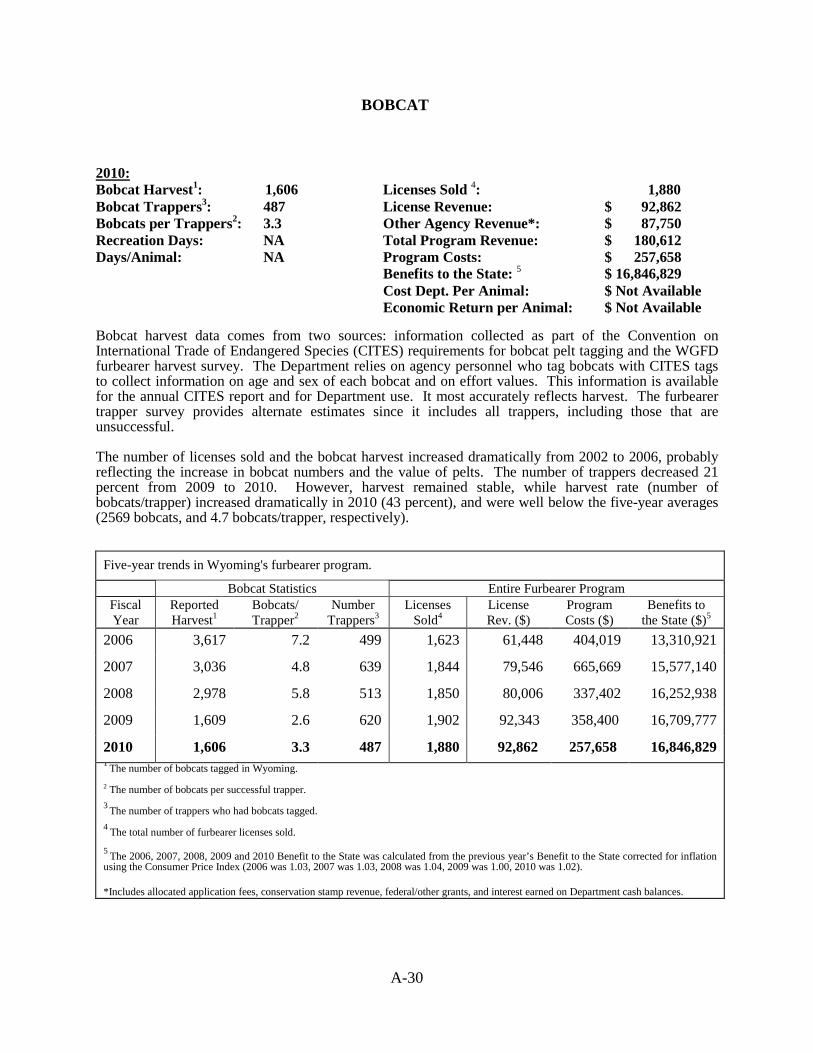
A-30
BOBCAT 2010: Bobcat Harvest1: 1,606 Licenses Sold 4: 1,880 Bobcat Trappers3: 487 License Revenue: $ 92,862 Bobcats per Trappers2: 3.3 Other Agency Revenue*: $ 87,750 Recreation Days: NA Total Program Revenue: $ 180,612 Days/Animal: NA Program Costs: $ 257,658 Benefits to the State: 5 $ 16,846,829 Cost Dept. Per Animal: $ Not Available Economic Return per Animal: $ Not Available Bobcat harvest data comes from two sources: information collected as part of the Convention on International Trade of Endangered Species (CITES) requirements for bobcat pelt tagging and the WGFD furbearer harvest survey. The Department relies on agency personnel who tag bobcats with CITES tags to collect information on age and sex of each bobcat and on effort values. This information is available for the annual CITES report and for Department use. It most accurately reflects harvest. The furbearer trapper survey provides alternate estimates since it includes all trappers, including those that are unsuccessful. The number of licenses sold and the bobcat harvest increased dramatically from 2002 to 2006, probably reflecting the increase in bobcat numbers and the value of pelts. The number of trappers decreased 21 percent from 2009 to 2010. However, harvest remained stable, while harvest rate (number of bobcats/trapper) increased dramatically in 2010 (43 percent), and were well below the five-year averages (2569 bobcats, and 4.7 bobcats/trapper, respectively).
Five-year trends in Wyoming's furbearer program.
Bobcat Statistics Entire Furbearer Program Fiscal Year
Reported Harvest1
Bobcats/ Trapper2
Number Trappers3
Licenses Sold4
License Rev. ($)
Program Costs ($)
Benefits to the State ($)5
2006 3,617 7.2 499 1,623 61,448 404,019 13,310,921
2007 3,036 4.8 639 1,844 79,546 665,669 15,577,140
2008 2,978 5.8 513 1,850 80,006 337,402 16,252,938
2009 1,609 2.6 620 1,902 92,343 358,400 16,709,777
2010 1,606 3.3 487 1,880 92,862 257,658 16,846,829 1 The number of bobcats tagged in Wyoming. 2 The number of bobcats per successful trapper. 3 The number of trappers who had bobcats tagged. 4 The total number of furbearer licenses sold. 5 The 2006, 2007, 2008, 2009 and 2010 Benefit to the State was calculated from the previous year’s Benefit to the State corrected for inflation using the Consumer Price Index (2006 was 1.03, 2007 was 1.03, 2008 was 1.04, 2009 was 1.00, 2010 was 1.02). *Includes allocated application fees, conservation stamp revenue, federal/other grants, and interest earned on Department cash balances.
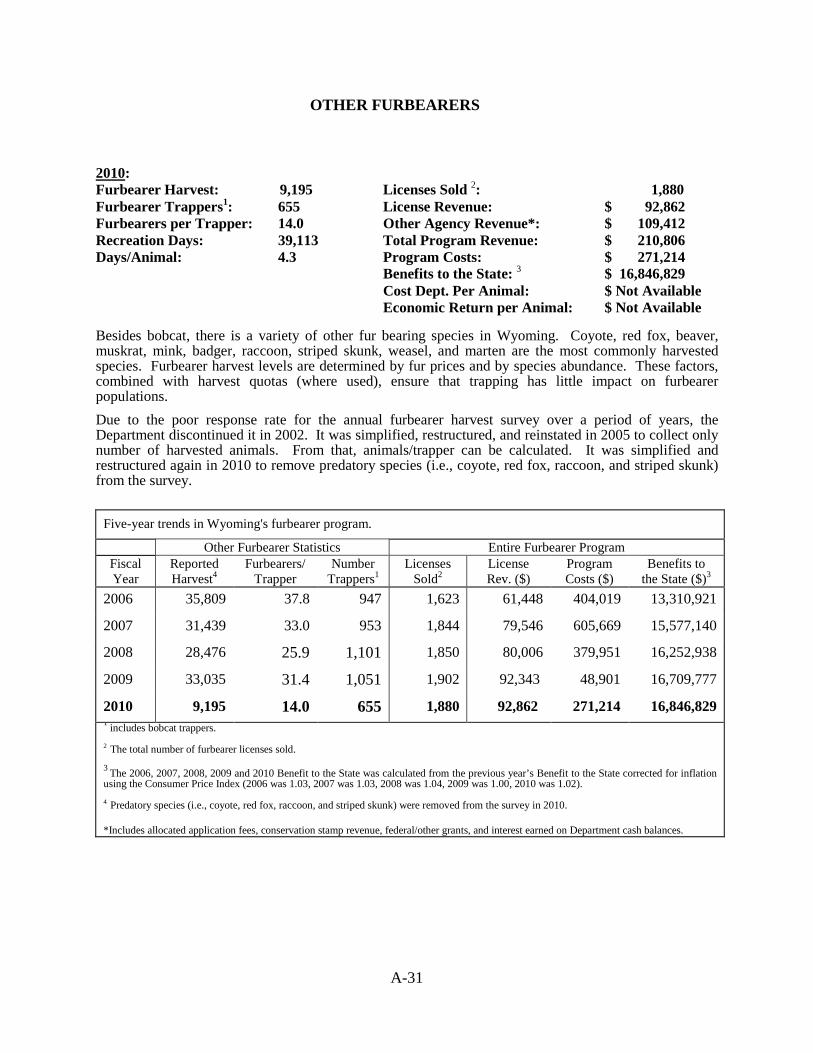
A-31
OTHER FURBEARERS 2010: Furbearer Harvest: 9,195 Licenses Sold 2: 1,880 Furbearer Trappers1: 655 License Revenue: $ 92,862 Furbearers per Trapper: 14.0 Other Agency Revenue*: $ 109,412 Recreation Days: 39,113 Total Program Revenue: $ 210,806 Days/Animal: 4.3 Program Costs: $ 271,214 Benefits to the State: 3 $ 16,846,829 Cost Dept. Per Animal: $ Not Available Economic Return per Animal: $ Not Available Besides bobcat, there is a variety of other fur bearing species in Wyoming. Coyote, red fox, beaver, muskrat, mink, badger, raccoon, striped skunk, weasel, and marten are the most commonly harvested species. Furbearer harvest levels are determined by fur prices and by species abundance. These factors, combined with harvest quotas (where used), ensure that trapping has little impact on furbearer populations. Due to the poor response rate for the annual furbearer harvest survey over a period of years, the Department discontinued it in 2002. It was simplified, restructured, and reinstated in 2005 to collect only number of harvested animals. From that, animals/trapper can be calculated. It was simplified and restructured again in 2010 to remove predatory species (i.e., coyote, red fox, raccoon, and striped skunk) from the survey.
Five-year trends in Wyoming's furbearer program.
Other Furbearer Statistics Entire Furbearer Program Fiscal Year
Reported Harvest4
Furbearers/ Trapper
Number Trappers1
Licenses Sold2
License Rev. ($)
Program Costs ($)
Benefits to the State ($)3
2006 35,809 37.8 947 1,623 61,448 404,019 13,310,921
2007 31,439 33.0 953 1,844 79,546 605,669 15,577,140
2008 28,476 25.9 1,101 1,850 80,006 379,951 16,252,938
2009 33,035 31.4 1,051 1,902 92,343 48,901 16,709,777
2010 9,195 14.0 655 1,880 92,862 271,214 16,846,829 1 includes bobcat trappers. 2 The total number of furbearer licenses sold. 3 The 2006, 2007, 2008, 2009 and 2010 Benefit to the State was calculated from the previous year’s Benefit to the State corrected for inflation using the Consumer Price Index (2006 was 1.03, 2007 was 1.03, 2008 was 1.04, 2009 was 1.00, 2010 was 1.02). 4 Predatory species (i.e., coyote, red fox, raccoon, and striped skunk) were removed from the survey in 2010. *Includes allocated application fees, conservation stamp revenue, federal/other grants, and interest earned on Department cash balances.

RAPTORS
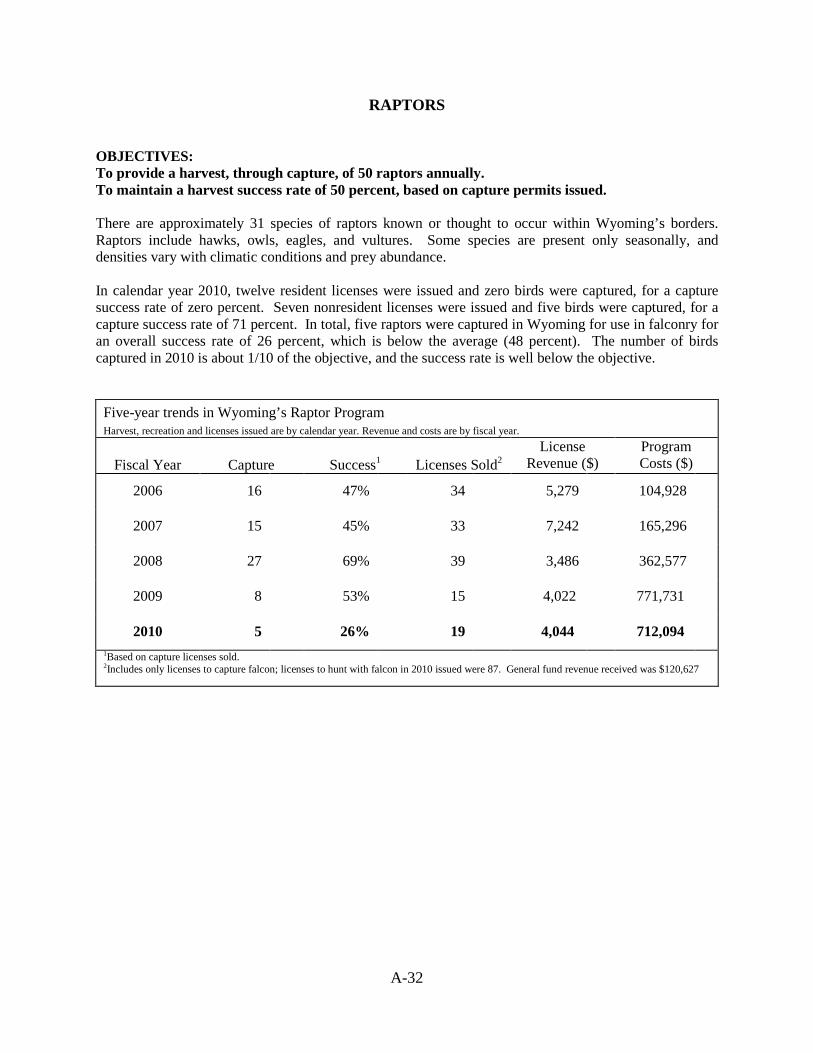
A-32
RAPTORS OBJECTIVES: To provide a harvest, through capture, of 50 raptors annually. To maintain a harvest success rate of 50 percent, based on capture permits issued. There are approximately 31 species of raptors known or thought to occur within Wyoming’s borders. Raptors include hawks, owls, eagles, and vultures. Some species are present only seasonally, and densities vary with climatic conditions and prey abundance. In calendar year 2010, twelve resident licenses were issued and zero birds were captured, for a capture success rate of zero percent. Seven nonresident licenses were issued and five birds were captured, for a capture success rate of 71 percent. In total, five raptors were captured in Wyoming for use in falconry for an overall success rate of 26 percent, which is below the average (48 percent). The number of birds captured in 2010 is about 1/10 of the objective, and the success rate is well below the objective.
Five-year trends in Wyoming’s Raptor Program Harvest, recreation and licenses issued are by calendar year. Revenue and costs are by fiscal year.
Fiscal Year
Capture
Success1
Licenses Sold2
License Revenue ($)
Program Costs ($)
2006 16 47% 34 5,279 104,928
2007 15 45% 33 7,242 165,296
2008 27 69% 39 3,486 362,577
2009 8 53% 15 4,022 771,731
2010 5 26% 19 4,044 712,094 1Based on capture licenses sold. 2Includes only licenses to capture falcon; licenses to hunt with falcon in 2010 issued were 87. General fund revenue received was $120,627

NON-GAME PROGRAMS
AND
NON-LICENSED USES
A-33
NONGAME PROGRAMS AND NON-LICENSED USES OF WILDLIFE The nongame program includes planning, information and education, environmental commenting, inventories, and monitoring specifically for a large variety of terrestrial species. Many of these are Species of Greatest Conservation Need, such as the swift fox, common loon, harlequin duck, ferruginous hawk, merlin, colonial nesting water birds, long-billed curlew, mountain plover, and several bat species. Also included under this heading are programs for sensitive species, such as trumpeter swan, bald eagle, peregrine falcon, black-footed ferret, wolverine, and lynx. The bald eagle and the peregrine falcon were recovered and had Endangered Species Act protections removed (they were delisted) in 2007. The other sensitive species are either federally listed as threatened or endangered, or national political pressures are pressing for listing. All continue to require special management attention and intensive restoration efforts. The Nongame Section participates in and coordinates monitoring of many species as part of broader efforts, such as the Breeding Bird Survey, Monitoring Avian Productivity and Survival Survey, and small mammal surveys. Nongame personnel are also involved in many committees and working groups that coordinate interstate and intrastate planning and implementation efforts to maintain wildlife diversity. The Nongame Section has been, and will continue to be, intensively involved in the implementation of Wyoming’s State Wildlife Action Plan (SWAP). The SWAP now, for the most part, directs the section’s inventory monitoring and survey activities. The Wyoming legislature award $1.3 million for sensitive species project funding for FY 2011 and FY 2012 during the 2010 budget session. The Governor’s Endangered Species Account also includes an additional $1.8 million. This will supplement significantly the federal State Wildlife Grant funds received annually and will accelerate surveys and research on aquatic and terrestrial Species of Greatest Conservation Need. Revisions to the SWAP were completed and approved by the Wyoming Game and Fish Commission in January 2011 for submission to the U.S. Fish and Wildlife Service according to the state’s five-year revision schedule. In 2010, non-consumptive users spent approximately $426,458,520 (corrected for inflation) in Wyoming based on the 2006 National Survey of Fishing, Hunting, and Wildlife-Associated Recreation, by using the Consumer Price Index. The number of recreation days, 3,009,000, listed for 2006-2007 is carried forward from the 2006 National Survey of Fishing, Hunting, And Wildlife-Associated Recreation. The Department’s “Wyoming’s Wildlife – Worth the Watching®” program has provided economic support for nongame, habitat, and non-consumptive wildlife projects. Department interpretive sites include the Tom Thorne/Beth Williams Wildlife Research Center at Sybille, Sheridan Visitor Center, Story Fish Hatchery, and Lander Visitor Center. Other interpretive efforts include signing at highway rest areas, cooperative Department/U.S. Forest Service signing, exhibits, nature trails on Department lands, The Wildlife Heritage Expo, and cooperative projects with some municipalities. In addition, wildlife-viewing guides have been developed, and a variety of publications have been produced to inform and educate the public about nongame wildlife. Interactive educational programs include: Project WILD, O.R.E.O. (Outdoor Recreation Education Opportunities), and BOW (Becoming and Outdoor Woman). Beginning in 2003, a percentage of the proceeds from the sale of big game licenses the Governor donates to conservation groups for fund raising are being made available for nongame programs in the state.
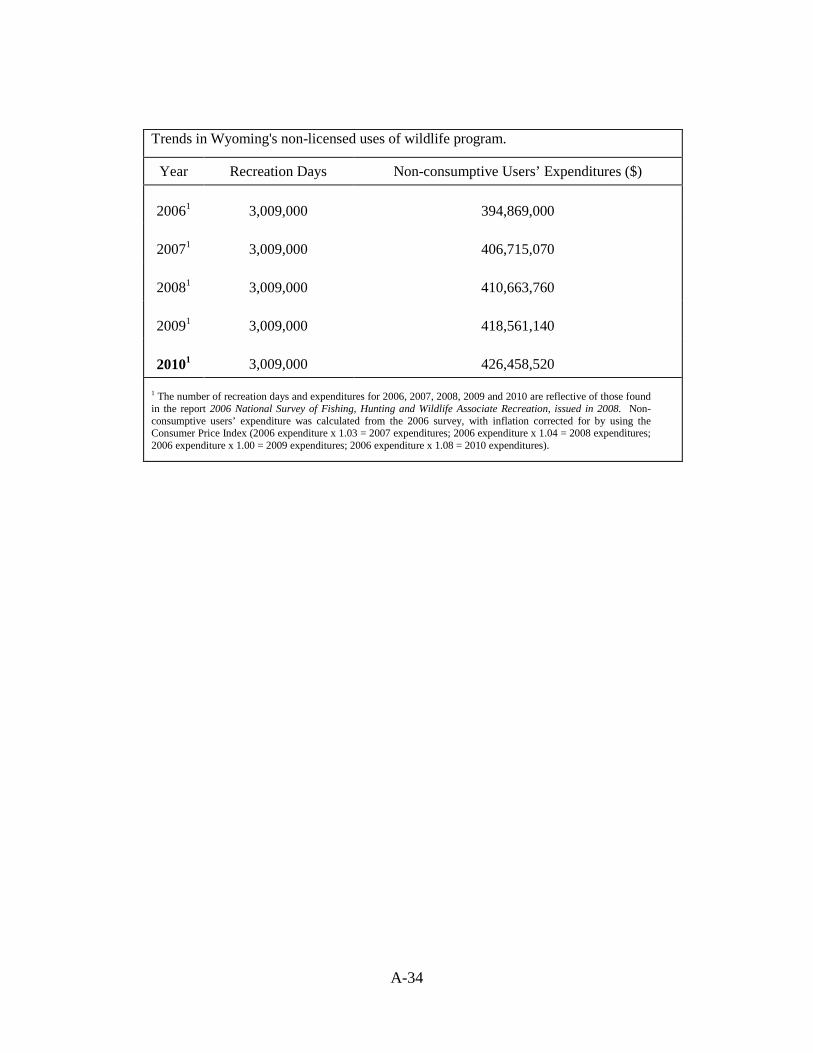
A-34
Trends in Wyoming's non-licensed uses of wildlife program.
Year Recreation Days Non-consumptive Users’ Expenditures ($)
20061
3,009,000
394,869,000
20071
3,009,000
406,715,070
20081
3,009,000
410,663,760
20091
3,009,000
418,561,140
20101
3,009,000
426,458,520
1 The number of recreation days and expenditures for 2006, 2007, 2008, 2009 and 2010 are reflective of those found in the report 2006 National Survey of Fishing, Hunting and Wildlife Associate Recreation, issued in 2008. Non-consumptive users’ expenditure was calculated from the 2006 survey, with inflation corrected for by using the Consumer Price Index (2006 expenditure x 1.03 = 2007 expenditures; 2006 expenditure x 1.04 = 2008 expenditures; 2006 expenditure x 1.00 = 2009 expenditures; 2006 expenditure x 1.08 = 2010 expenditures).
APPENDIX B:
HUNTER AND ANGLER
EXPENDITURE
Estimates of 2010 Expenditures in Wyoming
by Hunters and Anglers
Restitution Values of Game Animals
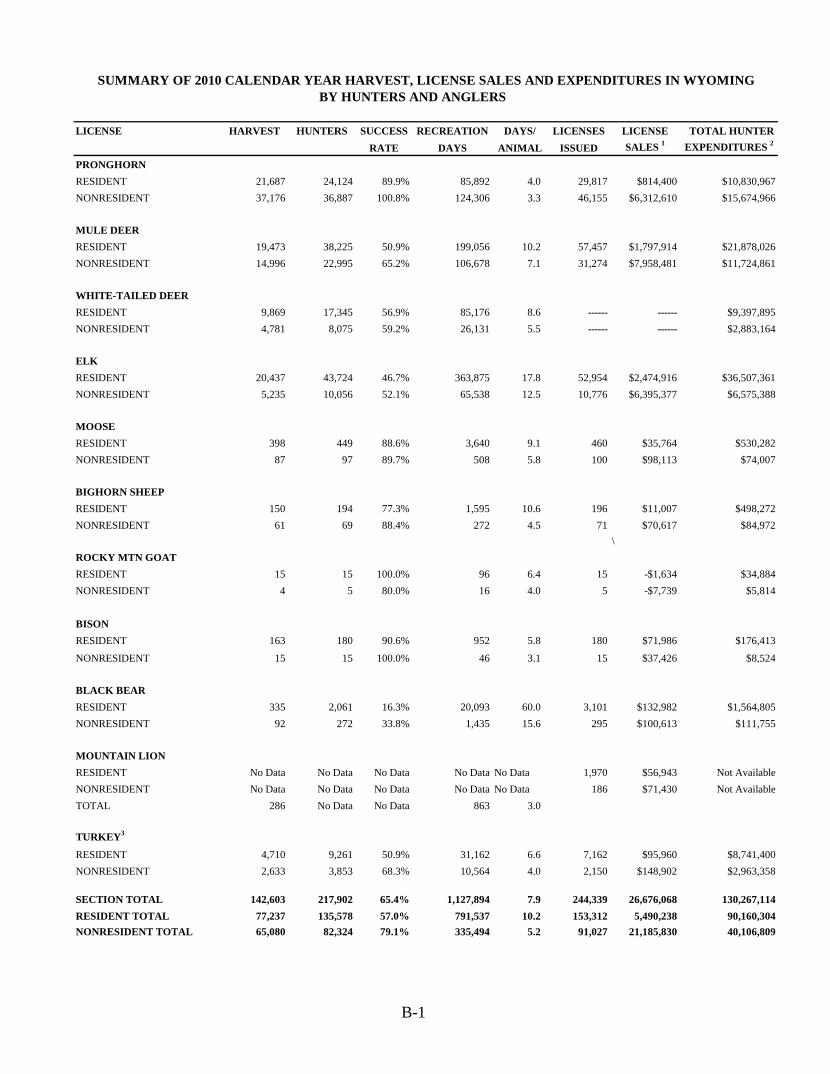
B-1
LICENSE HARVEST HUNTERS SUCCESS RECREATION DAYS/ LICENSES LICENSE TOTAL HUNTERRATE DAYS ANIMAL ISSUED SALES 1 EXPENDITURES 2
PRONGHORNRESIDENT 21,687 24,124 89.9% 85,892 4.0 29,817 $814,400 $10,830,967NONRESIDENT 37,176 36,887 100.8% 124,306 3.3 46,155 $6,312,610 $15,674,966
MULE DEERRESIDENT 19,473 38,225 50.9% 199,056 10.2 57,457 $1,797,914 $21,878,026NONRESIDENT 14,996 22,995 65.2% 106,678 7.1 31,274 $7,958,481 $11,724,861
WHITE-TAILED DEERRESIDENT 9,869 17,345 56.9% 85,176 8.6 ------ ------ $9,397,895NONRESIDENT 4,781 8,075 59.2% 26,131 5.5 ------ ------ $2,883,164
ELKRESIDENT 20,437 43,724 46.7% 363,875 17.8 52,954 $2,474,916 $36,507,361NONRESIDENT 5,235 10,056 52.1% 65,538 12.5 10,776 $6,395,377 $6,575,388
MOOSERESIDENT 398 449 88.6% 3,640 9.1 460 $35,764 $530,282NONRESIDENT 87 97 89.7% 508 5.8 100 $98,113 $74,007
BIGHORN SHEEPRESIDENT 150 194 77.3% 1,595 10.6 196 $11,007 $498,272NONRESIDENT 61 69 88.4% 272 4.5 71 $70,617 $84,972
\ROCKY MTN GOAT RESIDENT 15 15 100.0% 96 6.4 15 -$1,634 $34,884NONRESIDENT 4 5 80.0% 16 4.0 5 -$7,739 $5,814
BISONRESIDENT 163 180 90.6% 952 5.8 180 $71,986 $176,413
NONRESIDENT 15 15 100.0% 46 3.1 15 $37,426 $8,524
BLACK BEARRESIDENT 335 2,061 16.3% 20,093 60.0 3,101 $132,982 $1,564,805NONRESIDENT 92 272 33.8% 1,435 15.6 295 $100,613 $111,755
MOUNTAIN LIONRESIDENT No Data No Data No Data No Data No Data 1,970 $56,943 Not AvailableNONRESIDENT No Data No Data No Data No Data No Data 186 $71,430 Not AvailableTOTAL 286 No Data No Data 863 3.0
TURKEY3
RESIDENT 4,710 9,261 50.9% 31,162 6.6 7,162 $95,960 $8,741,400NONRESIDENT 2,633 3,853 68.3% 10,564 4.0 2,150 $148,902 $2,963,358
SECTION TOTAL 142,603 217,902 65.4% 1,127,894 7.9 244,339 26,676,068 130,267,114RESIDENT TOTAL 77,237 135,578 57.0% 791,537 10.2 153,312 5,490,238 90,160,304NONRESIDENT TOTAL 65,080 82,324 79.1% 335,494 5.2 91,027 21,185,830 40,106,809
SUMMARY OF 2010 CALENDAR YEAR HARVEST, LICENSE SALES AND EXPENDITURES IN WYOMINGBY HUNTERS AND ANGLERS
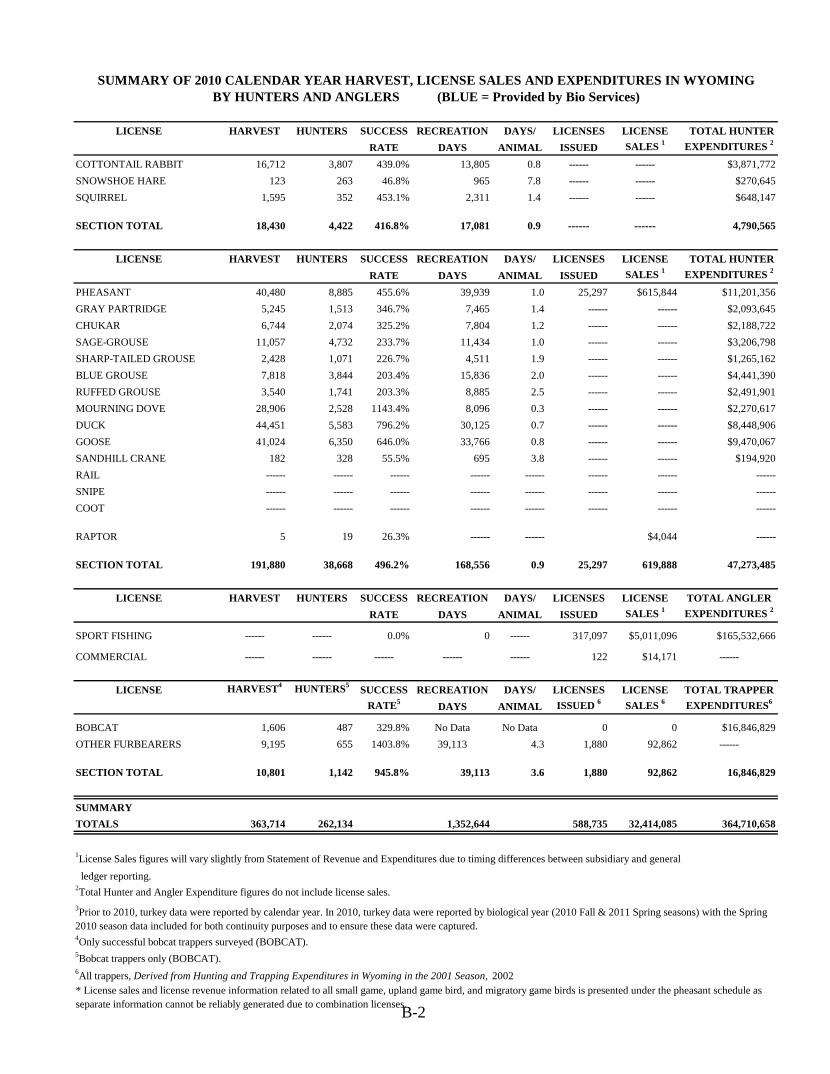
B-2
LICENSE HARVEST HUNTERS SUCCESS RECREATION DAYS/ LICENSES LICENSE TOTAL HUNTERRATE DAYS ANIMAL ISSUED SALES 1 EXPENDITURES 2
COTTONTAIL RABBIT 16,712 3,807 439.0% 13,805 0.8 ------ ------ $3,871,772SNOWSHOE HARE 123 263 46.8% 965 7.8 ------ ------ $270,645SQUIRREL 1,595 352 453.1% 2,311 1.4 ------ ------ $648,147
SECTION TOTAL 18,430 4,422 416.8% 17,081 0.9 ------ ------ 4,790,565
LICENSE HARVEST HUNTERS SUCCESS RECREATION DAYS/ LICENSES LICENSE TOTAL HUNTERRATE DAYS ANIMAL ISSUED SALES 1 EXPENDITURES 2
PHEASANT 40,480 8,885 455.6% 39,939 1.0 25,297 $615,844 $11,201,356GRAY PARTRIDGE 5,245 1,513 346.7% 7,465 1.4 ------ ------ $2,093,645CHUKAR 6,744 2,074 325.2% 7,804 1.2 ------ ------ $2,188,722SAGE-GROUSE 11,057 4,732 233.7% 11,434 1.0 ------ ------ $3,206,798SHARP-TAILED GROUSE 2,428 1,071 226.7% 4,511 1.9 ------ ------ $1,265,162BLUE GROUSE 7,818 3,844 203.4% 15,836 2.0 ------ ------ $4,441,390RUFFED GROUSE 3,540 1,741 203.3% 8,885 2.5 ------ ------ $2,491,901MOURNING DOVE 28,906 2,528 1143.4% 8,096 0.3 ------ ------ $2,270,617DUCK 44,451 5,583 796.2% 30,125 0.7 ------ ------ $8,448,906GOOSE 41,024 6,350 646.0% 33,766 0.8 ------ ------ $9,470,067SANDHILL CRANE 182 328 55.5% 695 3.8 ------ ------ $194,920RAIL ------ ------ ------ ------ ------ ------ ------ ------SNIPE ------ ------ ------ ------ ------ ------ ------ ------COOT ------ ------ ------ ------ ------ ------ ------ ------
RAPTOR 5 19 26.3% ------ ------ $4,044 ------
SECTION TOTAL 191,880 38,668 496.2% 168,556 0.9 25,297 619,888 47,273,485
LICENSE HARVEST HUNTERS SUCCESS RECREATION DAYS/ LICENSES LICENSE TOTAL ANGLERRATE DAYS ANIMAL ISSUED SALES 1 EXPENDITURES 2
SPORT FISHING ------ ------ 0.0% 0 ------ 317,097 $5,011,096 $165,532,666
COMMERCIAL ------ ------ ------ ------ ------ 122 $14,171 ------
LICENSE HARVEST4 HUNTERS5 SUCCESS RECREATION DAYS/ LICENSES LICENSE TOTAL TRAPPERRATE5 DAYS ANIMAL ISSUED 6 SALES 6 EXPENDITURES6
BOBCAT 1,606 487 329.8% No Data No Data 0 0 $16,846,829OTHER FURBEARERS 9,195 655 1403.8% 39,113 4.3 1,880 92,862 ------
SECTION TOTAL 10,801 1,142 945.8% 39,113 3.6 1,880 92,862 16,846,829
SUMMARYTOTALS 363,714 262,134 1,352,644 588,735 32,414,085 364,710,658
1License Sales figures will vary slightly from Statement of Revenue and Expenditures due to timing differences between subsidiary and general ledger reporting.2Total Hunter and Angler Expenditure figures do not include license sales.
4Only successful bobcat trappers surveyed (BOBCAT).5Bobcat trappers only (BOBCAT).
* License sales and license revenue information related to all small game, upland game bird, and migratory game birds is presented under the pheasant schedule as separate information cannot be reliably generated due to combination licenses.
6All trappers, Derived from Hunting and Trapping Expenditures in Wyoming in the 2001 Season, 2002
SUMMARY OF 2010 CALENDAR YEAR HARVEST, LICENSE SALES AND EXPENDITURES IN WYOMINGBY HUNTERS AND ANGLERS (BLUE = Provided by Bio Services)
3Prior to 2010, turkey data were reported by calendar year. In 2010, turkey data were reported by biological year (2010 Fall & 2011 Spring seasons) with the Spring 2010 season data included for both continuity purposes and to ensure these data were captured.
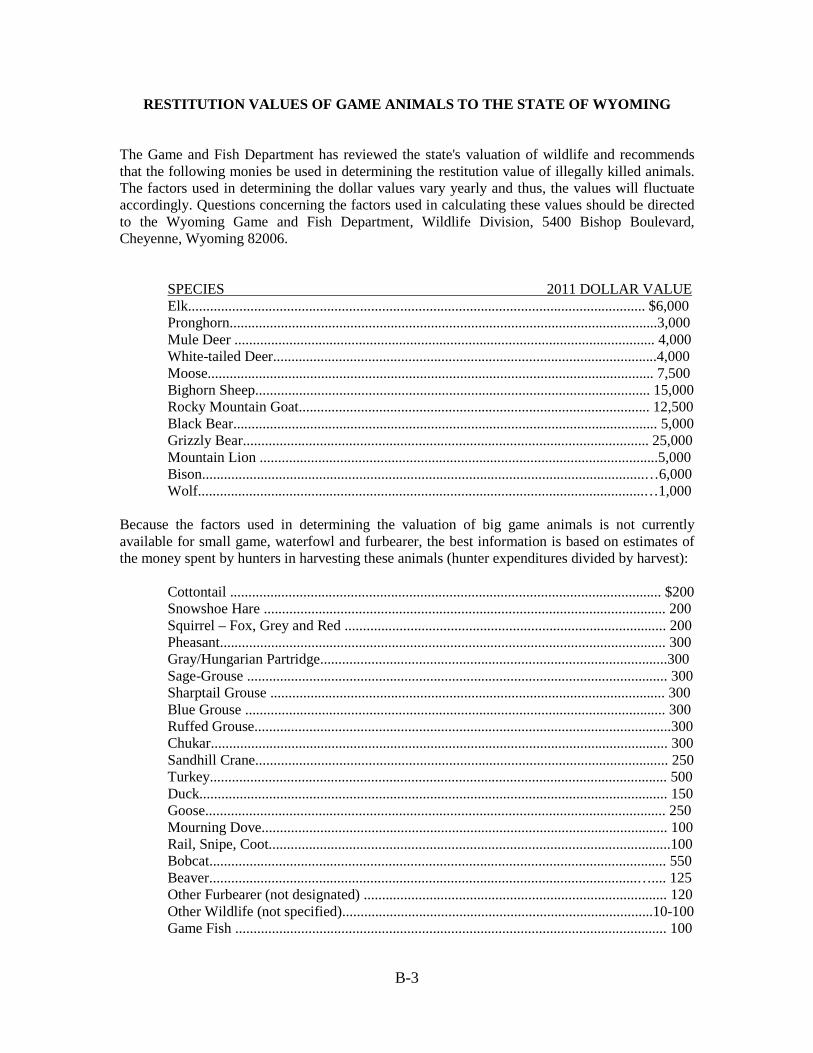
B-3
RESTITUTION VALUES OF GAME ANIMALS TO THE STATE OF WYOMING The Game and Fish Department has reviewed the state's valuation of wildlife and recommends that the following monies be used in determining the restitution value of illegally killed animals. The factors used in determining the dollar values vary yearly and thus, the values will fluctuate accordingly. Questions concerning the factors used in calculating these values should be directed to the Wyoming Game and Fish Department, Wildlife Division, 5400 Bishop Boulevard, Cheyenne, Wyoming 82006.
SPECIES 2011 DOLLAR VALUE Elk............................................................................................................................. $6,000 Pronghorn.....................................................................................................................3,000 Mule Deer ................................................................................................................... 4,000 White-tailed Deer.........................................................................................................4,000 Moose.......................................................................................................................... 7,500 Bighorn Sheep............................................................................................................ 15,000 Rocky Mountain Goat................................................................................................ 12,500 Black Bear.................................................................................................................... 5,000 Grizzly Bear............................................................................................................... 25,000 Mountain Lion .............................................................................................................5,000 Bison.........................................................................................................................…6,000 Wolf..........................................................................................................................…1,000
Because the factors used in determining the valuation of big game animals is not currently available for small game, waterfowl and furbearer, the best information is based on estimates of the money spent by hunters in harvesting these animals (hunter expenditures divided by harvest):
Cottontail ...................................................................................................................... $200 Snowshoe Hare .............................................................................................................. 200 Squirrel – Fox, Grey and Red ........................................................................................ 200 Pheasant.......................................................................................................................... 300 Gray/Hungarian Partridge...............................................................................................300 Sage-Grouse ................................................................................................................... 300 Sharptail Grouse ............................................................................................................ 300 Blue Grouse ................................................................................................................... 300 Ruffed Grouse..................................................................................................................300 Chukar............................................................................................................................. 300 Sandhill Crane................................................................................................................. 250 Turkey............................................................................................................................. 500 Duck................................................................................................................................ 150 Goose.............................................................................................................................. 250 Mourning Dove............................................................................................................... 100 Rail, Snipe, Coot..............................................................................................................100 Bobcat............................................................................................................................. 550 Beaver.....................................................................................................................….... 125 Other Furbearer (not designated) ................................................................................... 120 Other Wildlife (not specified).....................................................................................10-100 Game Fish ...................................................................................................................... 100

APPENDIX C:
BUDGETARY AND FINANCIAL SUMMARIES
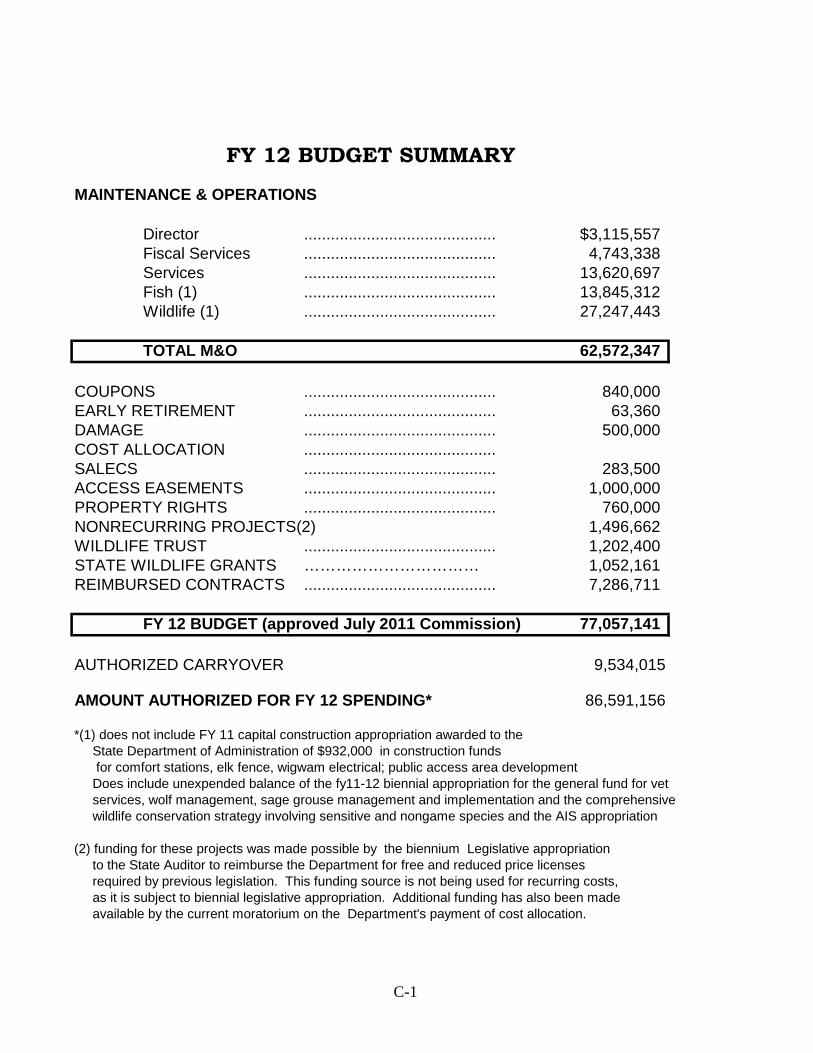
C-1
FY 12 BUDGET SUMMARY
MAINTENANCE & OPERATIONS Director ........................................... $3,115,557Fiscal Services ........................................... 4,743,338Services ........................................... 13,620,697Fish (1) ........................................... 13,845,312Wildlife (1) ........................................... 27,247,443
TOTAL M&O 62,572,347
COUPONS ........................................... 840,000EARLY RETIREMENT ........................................... 63,360DAMAGE ........................................... 500,000COST ALLOCATION ...........................................SALECS ........................................... 283,500ACCESS EASEMENTS ........................................... 1,000,000PROPERTY RIGHTS ........................................... 760,000NONRECURRING PROJECTS(2) 1,496,662WILDLIFE TRUST ........................................... 1,202,400STATE WILDLIFE GRANTS …………………………… 1,052,161REIMBURSED CONTRACTS ........................................... 7,286,711
FY 12 BUDGET (approved July 2011 Commission) 77,057,141
AUTHORIZED CARRYOVER 9,534,015
AMOUNT AUTHORIZED FOR FY 12 SPENDING* 86,591,156
*(1) does not include FY 11 capital construction appropriation awarded to the State Department of Administration of $932,000 in construction funds for comfort stations, elk fence, wigwam electrical; public access area development Does include unexpended balance of the fy11-12 biennial appropriation for the general fund for vet services, wolf management, sage grouse management and implementation and the comprehensive wildlife conservation strategy involving sensitive and nongame species and the AIS appropriation
(2) funding for these projects was made possible by the biennium Legislative appropriation to the State Auditor to reimburse the Department for free and reduced price licenses required by previous legislation. This funding source is not being used for recurring costs, as it is subject to biennial legislative appropriation. Additional funding has also been made available by the current moratorium on the Department's payment of cost allocation.
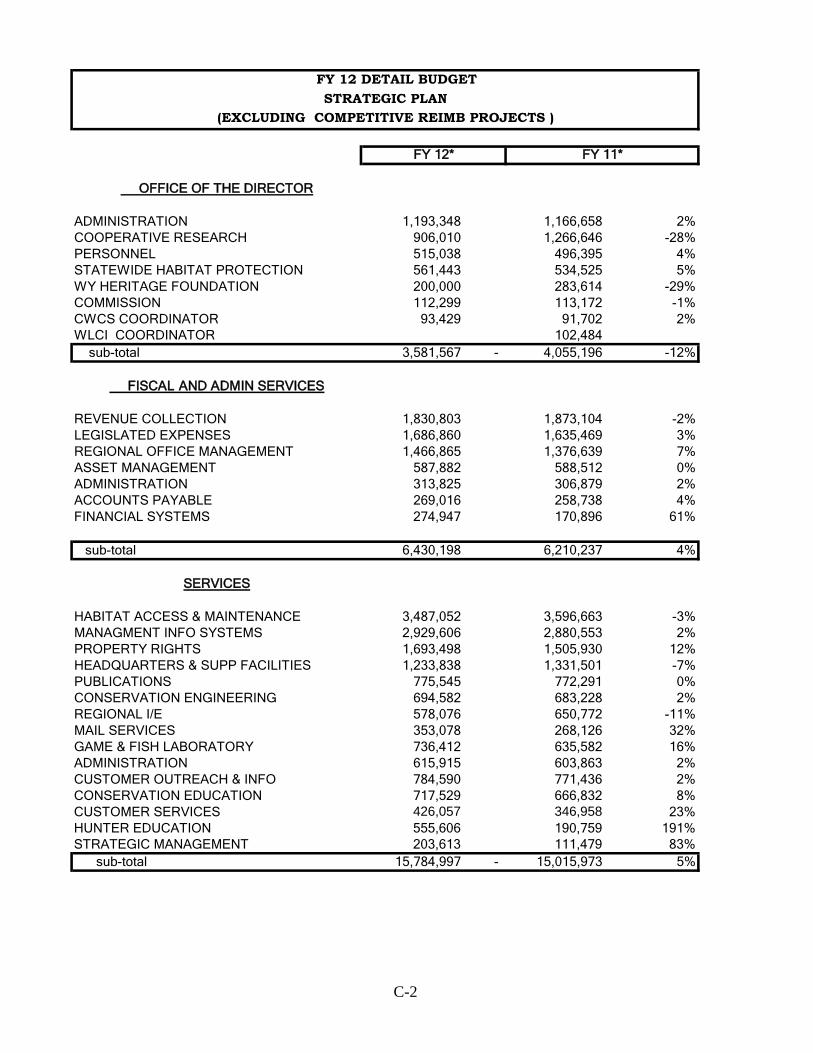
C-2
FY 12 DETAIL BUDGETSTRATEGIC PLAN
(EXCLUDING COMPETITIVE REIMB PROJECTS )
OFFICE OF THE DIRECTOR
ADMINISTRATION 1,193,348 1,166,658 2%COOPERATIVE RESEARCH 906,010 1,266,646 -28%PERSONNEL 515,038 496,395 4%STATEWIDE HABITAT PROTECTION 561,443 534,525 5%WY HERITAGE FOUNDATION 200,000 283,614 -29%COMMISSION 112,299 113,172 -1%CWCS COORDINATOR 93,429 91,702 2%WLCI COORDINATOR 102,484 sub-total 3,581,567 - 4,055,196 -12%
FISCAL AND ADMIN SERVICES
REVENUE COLLECTION 1,830,803 1,873,104 -2%LEGISLATED EXPENSES 1,686,860 1,635,469 3%REGIONAL OFFICE MANAGEMENT 1,466,865 1,376,639 7%ASSET MANAGEMENT 587,882 588,512 0%ADMINISTRATION 313,825 306,879 2%ACCOUNTS PAYABLE 269,016 258,738 4%FINANCIAL SYSTEMS 274,947 170,896 61%
sub-total 6,430,198 6,210,237 4%
SERVICES
HABITAT ACCESS & MAINTENANCE 3,487,052 3,596,663 -3%MANAGMENT INFO SYSTEMS 2,929,606 2,880,553 2%PROPERTY RIGHTS 1,693,498 1,505,930 12%HEADQUARTERS & SUPP FACILITIES 1,233,838 1,331,501 -7%PUBLICATIONS 775,545 772,291 0%CONSERVATION ENGINEERING 694,582 683,228 2%REGIONAL I/E 578,076 650,772 -11%MAIL SERVICES 353,078 268,126 32%GAME & FISH LABORATORY 736,412 635,582 16%ADMINISTRATION 615,915 603,863 2%CUSTOMER OUTREACH & INFO 784,590 771,436 2%CONSERVATION EDUCATION 717,529 666,832 8%CUSTOMER SERVICES 426,057 346,958 23%HUNTER EDUCATION 555,606 190,759 191%STRATEGIC MANAGEMENT 203,613 111,479 83% sub-total 15,784,997 - 15,015,973 5%
FY 12* FY 11*
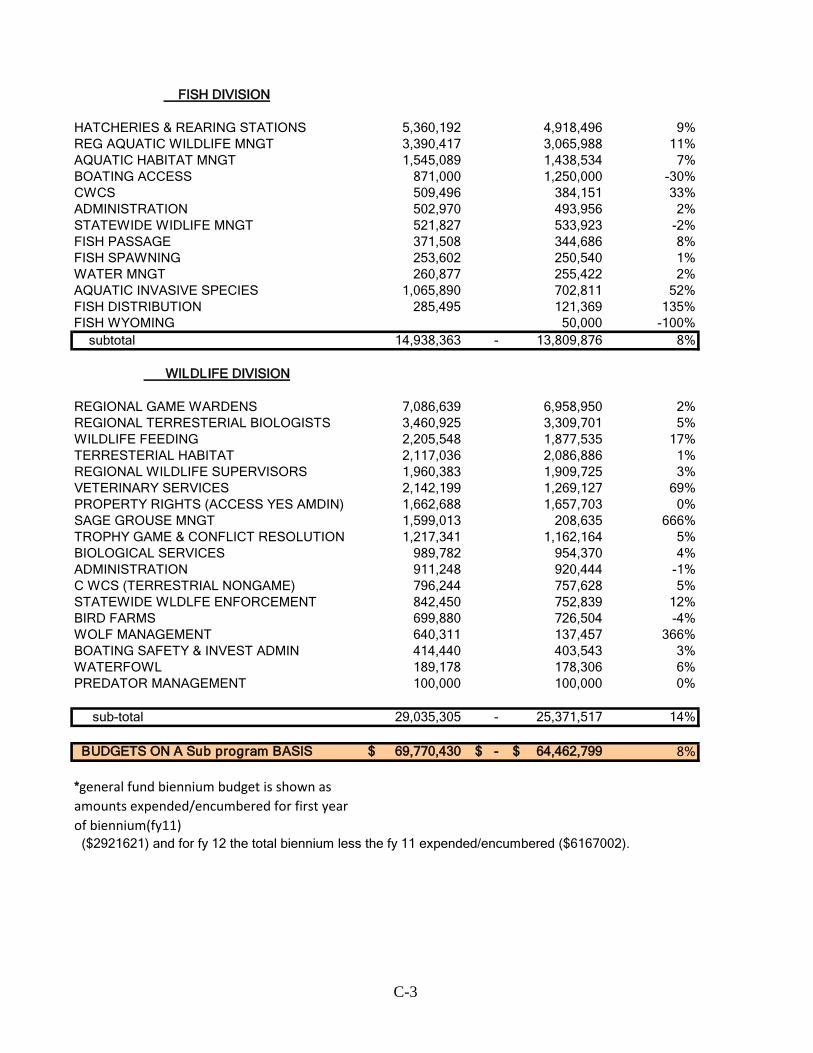
C-3
FISH DIVISION
HATCHERIES & REARING STATIONS 5,360,192 4,918,496 9%REG AQUATIC WILDLIFE MNGT 3,390,417 3,065,988 11%AQUATIC HABITAT MNGT 1,545,089 1,438,534 7%BOATING ACCESS 871,000 1,250,000 -30%CWCS 509,496 384,151 33%ADMINISTRATION 502,970 493,956 2%STATEWIDE WIDLIFE MNGT 521,827 533,923 -2%FISH PASSAGE 371,508 344,686 8%FISH SPAWNING 253,602 250,540 1%WATER MNGT 260,877 255,422 2%AQUATIC INVASIVE SPECIES 1,065,890 702,811 52%FISH DISTRIBUTION 285,495 121,369 135%FISH WYOMING 50,000 -100% subtotal 14,938,363 - 13,809,876 8%
WILDLIFE DIVISION
REGIONAL GAME WARDENS 7,086,639 6,958,950 2%REGIONAL TERRESTERIAL BIOLOGISTS 3,460,925 3,309,701 5%WILDLIFE FEEDING 2,205,548 1,877,535 17%TERRESTERIAL HABITAT 2,117,036 2,086,886 1%REGIONAL WILDLIFE SUPERVISORS 1,960,383 1,909,725 3%VETERINARY SERVICES 2,142,199 1,269,127 69%PROPERTY RIGHTS (ACCESS YES AMDIN) 1,662,688 1,657,703 0%SAGE GROUSE MNGT 1,599,013 208,635 666%TROPHY GAME & CONFLICT RESOLUTION 1,217,341 1,162,164 5%BIOLOGICAL SERVICES 989,782 954,370 4%ADMINISTRATION 911,248 920,444 -1%C WCS (TERRESTRIAL NONGAME) 796,244 757,628 5%STATEWIDE WLDLFE ENFORCEMENT 842,450 752,839 12%BIRD FARMS 699,880 726,504 -4%WOLF MANAGEMENT 640,311 137,457 366%BOATING SAFETY & INVEST ADMIN 414,440 403,543 3%WATERFOWL 189,178 178,306 6%PREDATOR MANAGEMENT 100,000 100,000 0%
sub-total 29,035,305 - 25,371,517 14%
BUDGETS ON A Sub program BASIS 69,770,430$ -$ 64,462,799$ 8%
*general fund biennium budget is shown as amounts expended/encumbered for first year of biennium(fy11) ($2921621) and for fy 12 the total biennium less the fy 11 expended/encumbered ($6167002).
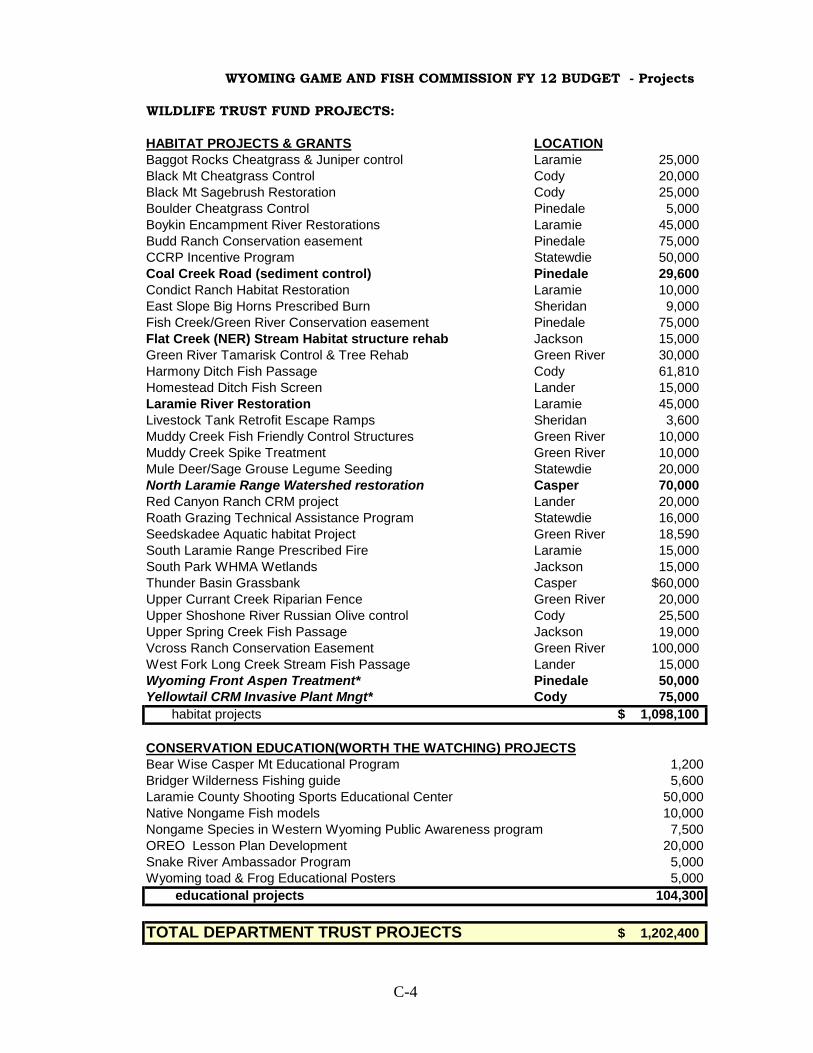
C-4
WYOMING GAME AND FISH COMMISSION FY 12 BUDGET - Projects
WILDLIFE TRUST FUND PROJECTS:
HABITAT PROJECTS & GRANTS LOCATIONBaggot Rocks Cheatgrass & Juniper control Laramie 25,000 Black Mt Cheatgrass Control Cody 20,000 Black Mt Sagebrush Restoration Cody 25,000 Boulder Cheatgrass Control Pinedale 5,000 Boykin Encampment River Restorations Laramie 45,000 Budd Ranch Conservation easement Pinedale 75,000 CCRP Incentive Program Statewdie 50,000 Coal Creek Road (sediment control) Pinedale 29,600 Condict Ranch Habitat Restoration Laramie 10,000 East Slope Big Horns Prescribed Burn Sheridan 9,000 Fish Creek/Green River Conservation easement Pinedale 75,000 Flat Creek (NER) Stream Habitat structure rehab Jackson 15,000 Green River Tamarisk Control & Tree Rehab Green River 30,000 Harmony Ditch Fish Passage Cody 61,810 Homestead Ditch Fish Screen Lander 15,000 Laramie River Restoration Laramie 45,000 Livestock Tank Retrofit Escape Ramps Sheridan 3,600 Muddy Creek Fish Friendly Control Structures Green River 10,000 Muddy Creek Spike Treatment Green River 10,000 Mule Deer/Sage Grouse Legume Seeding Statewdie 20,000 North Laramie Range Watershed restoration Casper 70,000 Red Canyon Ranch CRM project Lander 20,000 Roath Grazing Technical Assistance Program Statewdie 16,000 Seedskadee Aquatic habitat Project Green River 18,590 South Laramie Range Prescribed Fire Laramie 15,000 South Park WHMA Wetlands Jackson 15,000 Thunder Basin Grassbank Casper $60,000Upper Currant Creek Riparian Fence Green River 20,000 Upper Shoshone River Russian Olive control Cody 25,500 Upper Spring Creek Fish Passage Jackson 19,000 Vcross Ranch Conservation Easement Green River 100,000 West Fork Long Creek Stream Fish Passage Lander 15,000 Wyoming Front Aspen Treatment* Pinedale 50,000 Yellowtail CRM Invasive Plant Mngt* Cody 75,000 habitat projects 1,098,100$
CONSERVATION EDUCATION(WORTH THE WATCHING) PROJECTSBear Wise Casper Mt Educational Program 1,200Bridger Wilderness Fishing guide 5,600Laramie County Shooting Sports Educational Center 50,000Native Nongame Fish models 10,000Nongame Species in Western Wyoming Public Awareness program 7,500OREO Lesson Plan Development 20,000Snake River Ambassador Program 5,000Wyoming toad & Frog Educational Posters 5,000 educational projects 104,300
TOTAL DEPARTMENT TRUST PROJECTS 1,202,400$
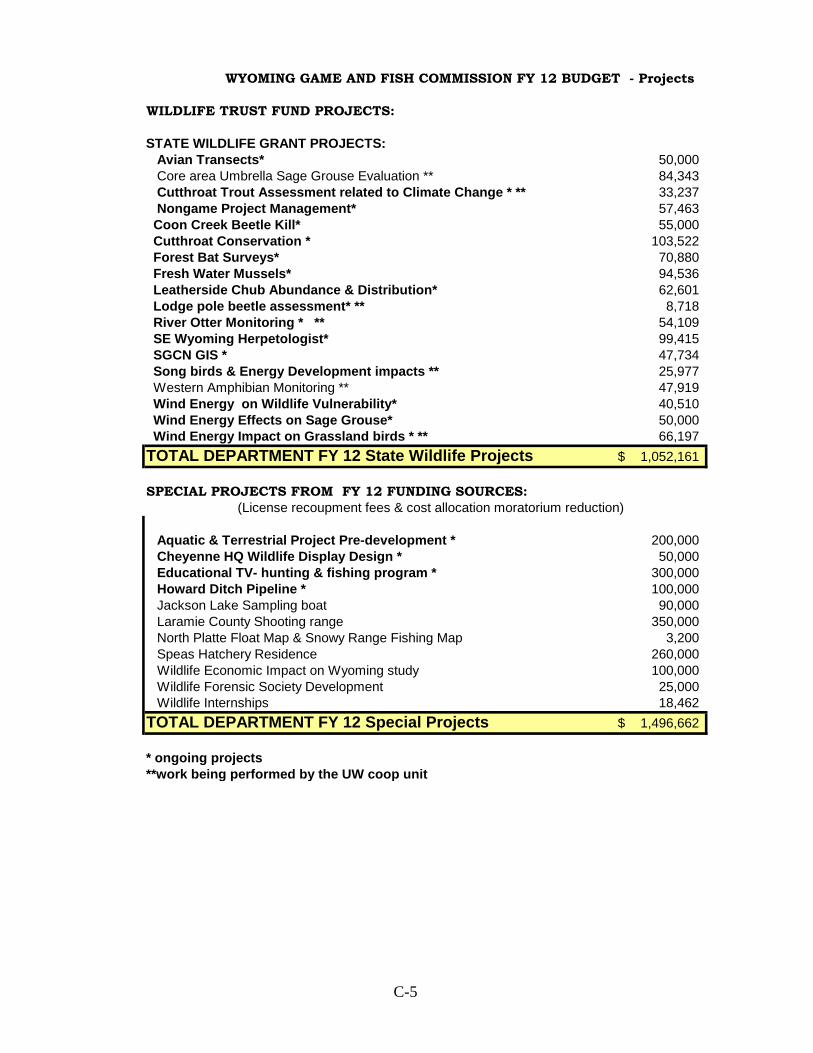
C-5
WYOMING GAME AND FISH COMMISSION FY 12 BUDGET - Projects
WILDLIFE TRUST FUND PROJECTS:
STATE WILDLIFE GRANT PROJECTS: Avian Transects* 50,000 Core area Umbrella Sage Grouse Evaluation ** 84,343 Cutthroat Trout Assessment related to Climate Change * ** 33,237 Nongame Project Management* 57,463 Coon Creek Beetle Kill* 55,000 Cutthroat Conservation * 103,522 Forest Bat Surveys* 70,880 Fresh Water Mussels* 94,536 Leatherside Chub Abundance & Distribution* 62,601 Lodge pole beetle assessment* ** 8,718 River Otter Monitoring * ** 54,109 SE Wyoming Herpetologist* 99,415 SGCN GIS * 47,734 Song birds & Energy Development impacts ** 25,977 Western Amphibian Monitoring ** 47,919 Wind Energy on Wildlife Vulnerability* 40,510 Wind Energy Effects on Sage Grouse* 50,000 Wind Energy Impact on Grassland birds * ** 66,197 TOTAL DEPARTMENT FY 12 State Wildlife Projects 1,052,161$
SPECIAL PROJECTS FROM FY 12 FUNDING SOURCES:
Aquatic & Terrestrial Project Pre-development * 200,000 Cheyenne HQ Wildlife Display Design * 50,000 Educational TV- hunting & fishing program * 300,000 Howard Ditch Pipeline * 100,000 Jackson Lake Sampling boat 90,000 Laramie County Shooting range 350,000 North Platte Float Map & Snowy Range Fishing Map 3,200 Speas Hatchery Residence 260,000 Wildlife Economic Impact on Wyoming study 100,000 Wildlife Forensic Society Development 25,000 Wildlife Internships 18,462 TOTAL DEPARTMENT FY 12 Special Projects 1,496,662$
* ongoing projects**work being performed by the UW coop unit
(License recoupment fees & cost allocation moratorium reduction)
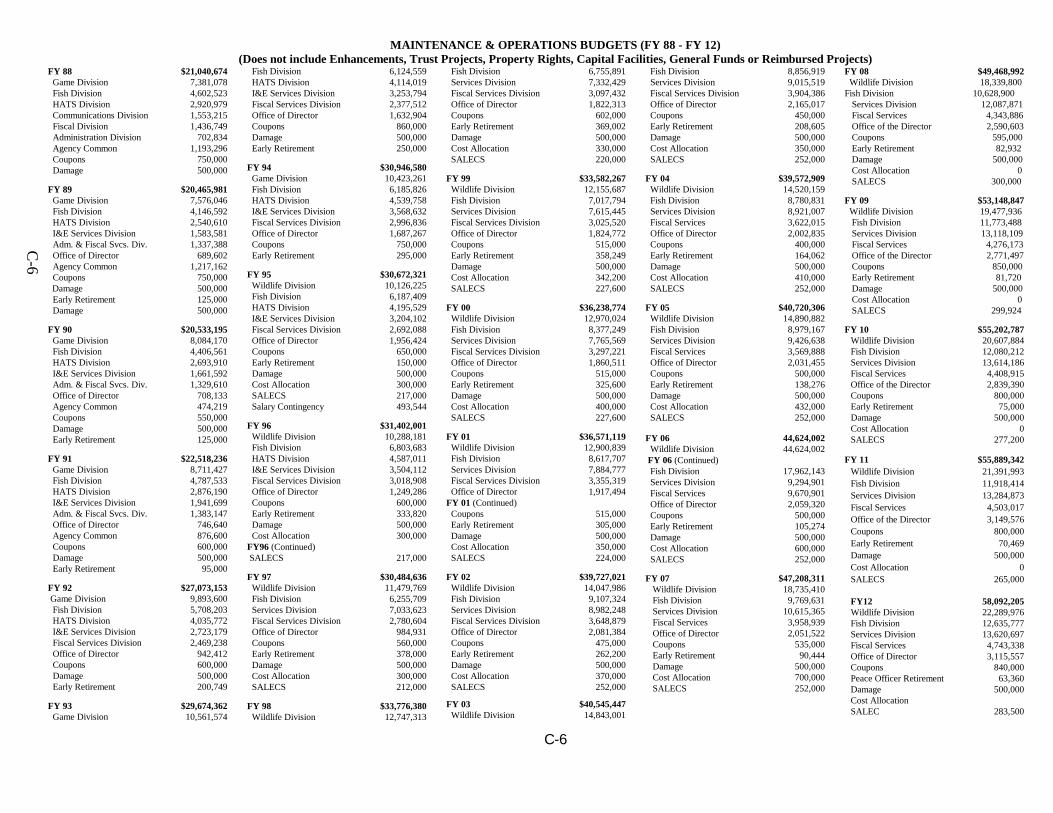
C-6
C-6
MAINTENANCE & OPERATIONS BUDGETS (FY 88 - FY 12) (Does not include Enhancements, Trust Projects, Property Rights, Capital Facilities, General Funds or Reimbursed Projects)
FY 88 $21,040,674 Game Division 7,381,078 Fish Division 4,602,523 HATS Division 2,920,979 Communications Division 1,553,215 Fiscal Division 1,436,749 Administration Division 702,834 Agency Common 1,193,296 Coupons 750,000 Damage 500,000 FY 89 $20,465,981 Game Division 7,576,046 Fish Division 4,146,592 HATS Division 2,540,610 I&E Services Division 1,583,581 Adm. & Fiscal Svcs. Div. 1,337,388 Office of Director 689,602 Agency Common 1,217,162 Coupons 750,000 Damage 500,000 Early Retirement 125,000 Damage 500,000 FY 90 $20,533,195 Game Division 8,084,170 Fish Division 4,406,561 HATS Division 2,693,910 I&E Services Division 1,661,592 Adm. & Fiscal Svcs. Div. 1,329,610 Office of Director 708,133 Agency Common 474,219 Coupons 550,000 Damage 500,000 Early Retirement 125,000 FY 91 $22,518,236 Game Division 8,711,427 Fish Division 4,787,533 HATS Division 2,876,190 I&E Services Division 1,941,699 Adm. & Fiscal Svcs. Div. 1,383,147 Office of Director 746,640 Agency Common 876,600 Coupons 600,000 Damage 500,000 Early Retirement 95,000 FY 92 $27,073,153 Game Division 9,893,600 Fish Division 5,708,203 HATS Division 4,035,772 I&E Services Division 2,723,179 Fiscal Services Division 2,469,238 Office of Director 942,412 Coupons 600,000 Damage 500,000 Early Retirement 200,749 FY 93 $29,674,362 Game Division 10,561,574
Fish Division 6,124,559 HATS Division 4,114,019 I&E Services Division 3,253,794 Fiscal Services Division 2,377,512 Office of Director 1,632,904 Coupons 860,000 Damage 500,000 Early Retirement 250,000 FY 94 $30,946,580 Game Division 10,423,261 Fish Division 6,185,826 HATS Division 4,539,758 I&E Services Division 3,568,632 Fiscal Services Division 2,996,836 Office of Director 1,687,267 Coupons 750,000 Early Retirement 295,000 FY 95 $30,672,321 Wildlife Division 10,126,225 Fish Division 6,187,409 HATS Division 4,195,529 I&E Services Division 3,204,102 Fiscal Services Division 2,692,088 Office of Director 1,956,424 Coupons 650,000 Early Retirement 150,000 Damage 500,000 Cost Allocation 300,000 SALECS 217,000 Salary Contingency 493,544 FY 96 $31,402,001 Wildlife Division 10,288,181 Fish Division 6,803,683 HATS Division 4,587,011 I&E Services Division 3,504,112 Fiscal Services Division 3,018,908 Office of Director 1,249,286 Coupons 600,000 Early Retirement 333,820 Damage 500,000 Cost Allocation 300,000 FY96 (Continued) SALECS 217,000 FY 97 $30,484,636 Wildlife Division 11,479,769 Fish Division 6,255,709 Services Division 7,033,623 Fiscal Services Division 2,780,604 Office of Director 984,931 Coupons 560,000 Early Retirement 378,000 Damage 500,000 Cost Allocation 300,000 SALECS 212,000 FY 98 $33,776,380 Wildlife Division 12,747,313
Fish Division 6,755,891 Services Division 7,332,429 Fiscal Services Division 3,097,432 Office of Director 1,822,313 Coupons 602,000 Early Retirement 369,002 Damage 500,000 Cost Allocation 330,000 SALECS 220,000 FY 99 $33,582,267 Wildlife Division 12,155,687 Fish Division 7,017,794 Services Division 7,615,445 Fiscal Services Division 3,025,520 Office of Director 1,824,772 Coupons 515,000 Early Retirement 358,249 Damage 500,000 Cost Allocation 342,200 SALECS 227,600 FY 00 $36,238,774 Wildlife Division 12,970,024 Fish Division 8,377,249 Services Division 7,765,569 Fiscal Services Division 3,297,221 Office of Director 1,860,511 Coupons 515,000 Early Retirement 325,600 Damage 500,000 Cost Allocation 400,000 SALECS 227,600 FY 01 $36,571,119 Wildlife Division 12,900,839 Fish Division 8,617,707 Services Division 7,884,777 Fiscal Services Division 3,355,319 Office of Director 1,917,494 FY 01 (Continued) Coupons 515,000 Early Retirement 305,000 Damage 500,000 Cost Allocation 350,000 SALECS 224,000 FY 02 $39,727,021 Wildlife Division 14,047,986 Fish Division 9,107,324 Services Division 8,982,248 Fiscal Services Division 3,648,879 Office of Director 2,081,384 Coupons 475,000 Early Retirement 262,200 Damage 500,000 Cost Allocation 370,000 SALECS 252,000
FY 03 $40,545,447 Wildlife Division 14,843,001
Fish Division 8,856,919 Services Division 9,015,519 Fiscal Services Division 3,904,386 Office of Director 2,165,017 Coupons 450,000 Early Retirement 208,605 Damage 500,000 Cost Allocation 350,000 SALECS 252,000 FY 04 $39,572,909 Wildlife Division 14,520,159 Fish Division 8,780,831 Services Division 8,921,007 Fiscal Services 3,622,015 Office of Director 2,002,835 Coupons 400,000 Early Retirement 164,062 Damage 500,000 Cost Allocation 410,000 SALECS 252,000 FY 05 $40,720,306 Wildlife Division 14,890,882 Fish Division 8,979,167 Services Division 9,426,638 Fiscal Services 3,569,888 Office of Director 2,031,455 Coupons 500,000 Early Retirement 138,276 Damage 500,000 Cost Allocation 432,000 SALECS 252,000 FY 06 44,624,002 Wildlife Division 44,624,002 FY 06 (Continued) Fish Division 17,962,143 Services Division 9,294,901 Fiscal Services 9,670,901 Office of Director 2,059,320 Coupons 500,000 Early Retirement 105,274 Damage 500,000 Cost Allocation 600,000 SALECS 252,000 FY 07 $47,208,311 Wildlife Division 18,735,410 Fish Division 9,769,631 Services Division 10,615,365 Fiscal Services 3,958,939 Office of Director 2,051,522 Coupons 535,000 Early Retirement 90,444 Damage 500,000 Cost Allocation 700,000 SALECS 252,000
FY 08 $49,468,992 Wildlife Division 18,339,800 Fish Division 10,628,900 Services Division 12,087,871 Fiscal Services 4,343,886 Office of the Director 2,590,603 Coupons 595,000 Early Retirement 82,932 Damage 500,000 Cost Allocation 0 SALECS 300,000 FY 09 $53,148,847 Wildlife Division 19,477,936 Fish Division 11,773,488 Services Division 13,118,109 Fiscal Services 4,276,173 Office of the Director 2,771,497 Coupons 850,000 Early Retirement 81,720 Damage 500,000 Cost Allocation 0 SALECS 299,924 FY 10 $55,202,787
Wildlife Division 20,607,884 Fish Division 12,080,212 Services Division 13,614,186 Fiscal Services 4,408,915 Office of the Director 2,839,390 Coupons 800,000 Early Retirement 75,000 Damage 500,000 Cost Allocation 0 SALECS 277,200
FY 11 $55,889,342 Wildlife Division 21,391,993 Fish Division 11,918,414 Services Division 13,284,873 Fiscal Services 4,503,017 Office of the Director 3,149,576 Coupons 800,000 Early Retirement 70,469 Damage 500,000 Cost Allocation 0 SALECS 265,000 FY12 58,092,205 Wildlife Division 22,289,976 Fish Division 12,635,777 Services Division 13,620,697 Fiscal Services 4,743,338 Office of Director 3,115,557 Coupons 840,000 Peace Officer Retirement 63,360 Damage 500,000 Cost Allocation SALEC 283,500
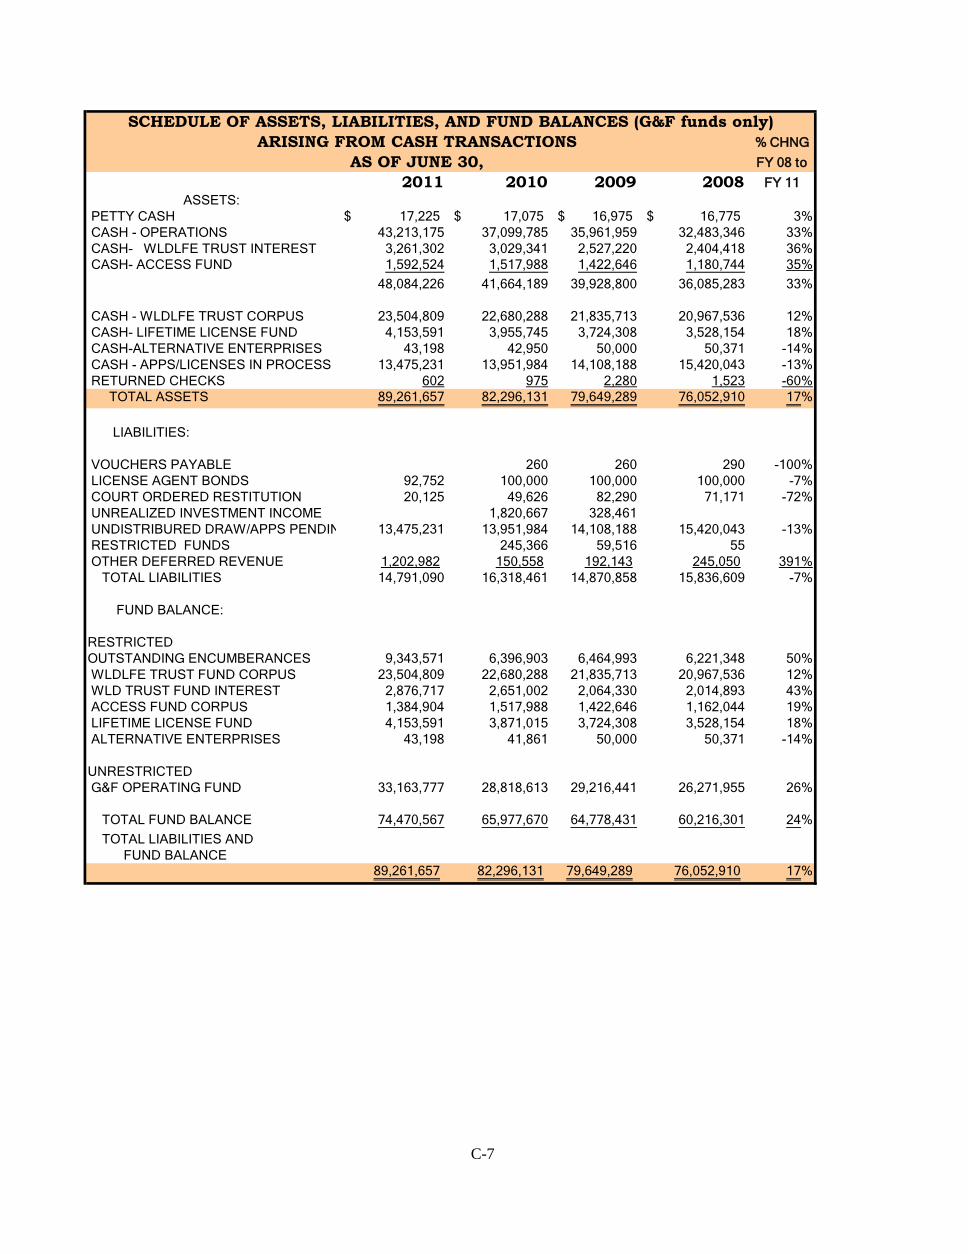
C-7
ARISING FROM CASH TRANSACTIONS % CHNG
AS OF JUNE 30, FY 08 to
2011 2010 2009 2008 FY 11ASSETS:
PETTY CASH 17,225$ 17,075$ 16,975$ 16,775$ 3% CASH - OPERATIONS 43,213,175 37,099,785 35,961,959 32,483,346 33% CASH- WLDLFE TRUST INTEREST 3,261,302 3,029,341 2,527,220 2,404,418 36% CASH- ACCESS FUND 1,592,524 1,517,988 1,422,646 1,180,744 35% 48,084,226 41,664,189 39,928,800 36,085,283 33%
CASH - WLDLFE TRUST CORPUS 23,504,809 22,680,288 21,835,713 20,967,536 12% CASH- LIFETIME LICENSE FUND 4,153,591 3,955,745 3,724,308 3,528,154 18% CASH-ALTERNATIVE ENTERPRISES 43,198 42,950 50,000 50,371 -14% CASH - APPS/LICENSES IN PROCESS 13,475,231 13,951,984 14,108,188 15,420,043 -13% RETURNED CHECKS 602 975 2,280 1,523 -60% TOTAL ASSETS 89,261,657 82,296,131 79,649,289 76,052,910 17%
LIABILITIES:
VOUCHERS PAYABLE 260 260 290 -100% LICENSE AGENT BONDS 92,752 100,000 100,000 100,000 -7% COURT ORDERED RESTITUTION 20,125 49,626 82,290 71,171 -72% UNREALIZED INVESTMENT INCOME 1,820,667 328,461 UNDISTRIBURED DRAW/APPS PENDIN 13,475,231 13,951,984 14,108,188 15,420,043 -13% RESTRICTED FUNDS 245,366 59,516 55 OTHER DEFERRED REVENUE 1,202,982 150,558 192,143 245,050 391% TOTAL LIABILITIES 14,791,090 16,318,461 14,870,858 15,836,609 -7%
FUND BALANCE:
RESTRICTED OUTSTANDING ENCUMBERANCES 9,343,571 6,396,903 6,464,993 6,221,348 50% WLDLFE TRUST FUND CORPUS 23,504,809 22,680,288 21,835,713 20,967,536 12% WLD TRUST FUND INTEREST 2,876,717 2,651,002 2,064,330 2,014,893 43% ACCESS FUND CORPUS 1,384,904 1,517,988 1,422,646 1,162,044 19% LIFETIME LICENSE FUND 4,153,591 3,871,015 3,724,308 3,528,154 18% ALTERNATIVE ENTERPRISES 43,198 41,861 50,000 50,371 -14%
UNRESTRICTED G&F OPERATING FUND 33,163,777 28,818,613 29,216,441 26,271,955 26% TOTAL FUND BALANCE 74,470,567 65,977,670 64,778,431 60,216,301 24% TOTAL LIABILITIES AND FUND BALANCE
89,261,657 82,296,131 79,649,289 76,052,910 17%
SCHEDULE OF ASSETS, LIABILITIES, AND FUND BALANCES (G&F funds only)
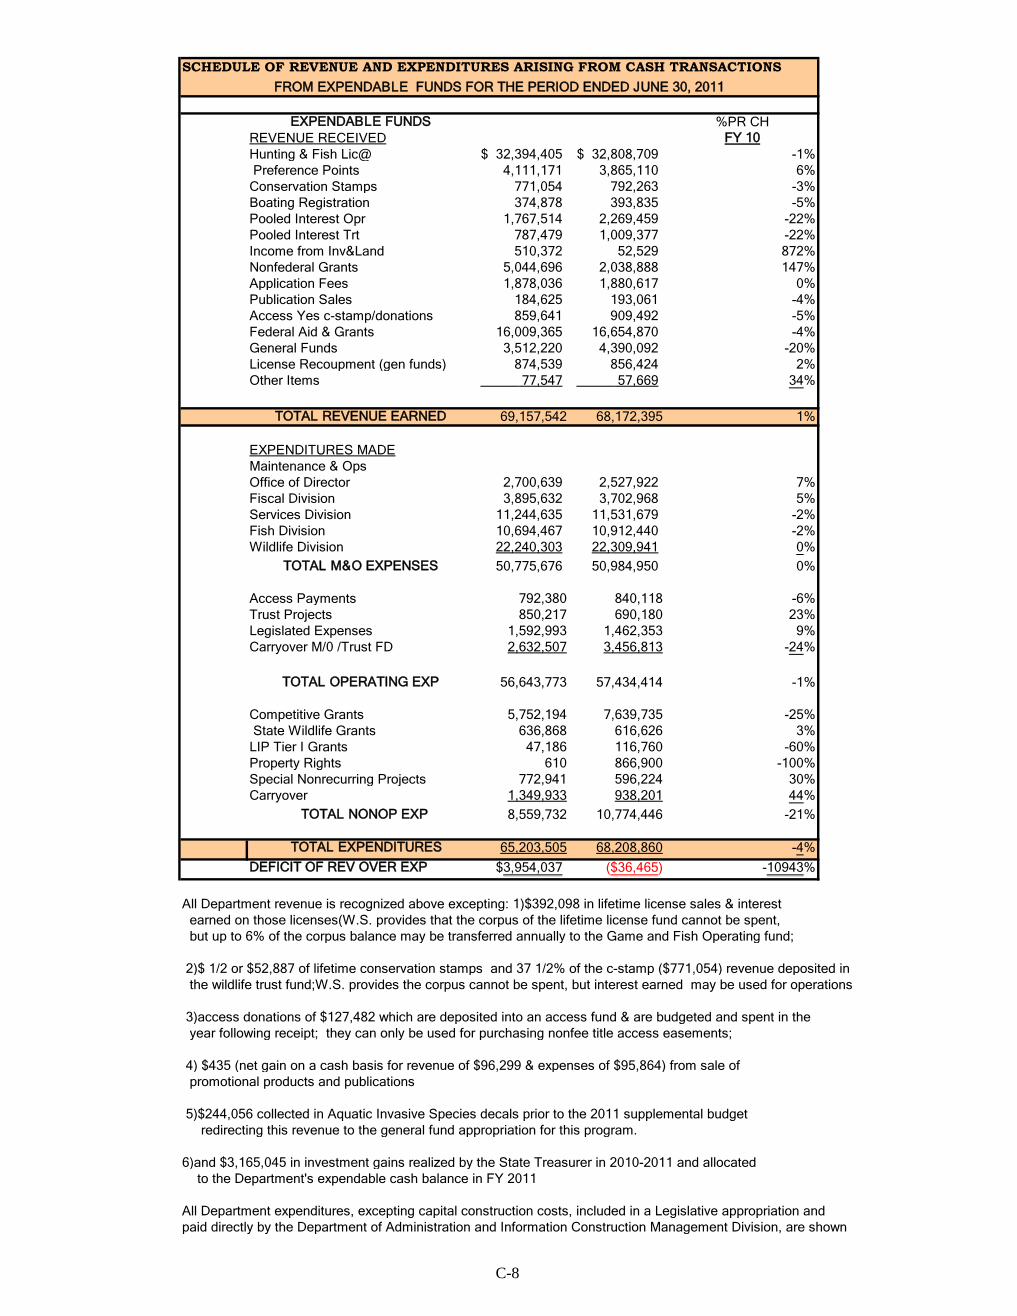
C-8
SCHEDULE OF REVENUE AND EXPENDITURES ARISING FROM CASH TRANSACTIONS
EXPENDABLE FUNDS %PR CHREVENUE RECEIVED FY 10Hunting & Fish Lic@ 32,394,405$ 32,808,709$ -1% Preference Points 4,111,171 3,865,110 6%Conservation Stamps 771,054 792,263 -3%Boating Registration 374,878 393,835 -5%Pooled Interest Opr 1,767,514 2,269,459 -22%Pooled Interest Trt 787,479 1,009,377 -22%Income from Inv&Land 510,372 52,529 872%Nonfederal Grants 5,044,696 2,038,888 147%Application Fees 1,878,036 1,880,617 0%Publication Sales 184,625 193,061 -4%Access Yes c-stamp/donations 859,641 909,492 -5%Federal Aid & Grants 16,009,365 16,654,870 -4%General Funds 3,512,220 4,390,092 -20%License Recoupment (gen funds) 874,539 856,424 2%Other Items 77,547 57,669 34%
TOTAL REVENUE EARNED 69,157,542 68,172,395 1%
EXPENDITURES MADE Maintenance & Ops Office of Director 2,700,639 2,527,922 7%Fiscal Division 3,895,632 3,702,968 5%Services Division 11,244,635 11,531,679 -2%Fish Division 10,694,467 10,912,440 -2%Wildlife Division 22,240,303 22,309,941 0%
TOTAL M&O EXPENSES 50,775,676 50,984,950 0%
Access Payments 792,380 840,118 -6%Trust Projects 850,217 690,180 23%Legislated Expenses 1,592,993 1,462,353 9%Carryover M/0 /Trust FD 2,632,507 3,456,813 -24%
TOTAL OPERATING EXP 56,643,773 57,434,414 -1%
Competitive Grants 5,752,194 7,639,735 -25% State Wildlife Grants 636,868 616,626 3%LIP Tier I Grants 47,186 116,760 -60%Property Rights 610 866,900 -100%Special Nonrecurring Projects 772,941 596,224 30%Carryover 1,349,933 938,201 44%
TOTAL NONOP EXP 8,559,732 10,774,446 -21%
TOTAL EXPENDITURES 65,203,505 68,208,860 -4%DEFICIT OF REV OVER EXP $3,954,037 ($36,465) -10943%
All Department revenue is recognized above excepting: 1)$392,098 in lifetime license sales & interest earned on those licenses(W.S. provides that the corpus of the lifetime license fund cannot be spent, but up to 6% of the corpus balance may be transferred annually to the Game and Fish Operating fund;
2)$ 1/2 or $52,887 of lifetime conservation stamps and 37 1/2% of the c-stamp ($771,054) revenue deposited in the wildlife trust fund;W.S. provides the corpus cannot be spent, but interest earned may be used for operations 3)access donations of $127,482 which are deposited into an access fund & are budgeted and spent in the year following receipt; they can only be used for purchasing nonfee title access easements;
4) $435 (net gain on a cash basis for revenue of $96,299 & expenses of $95,864) from sale of promotional products and publications 5)$244,056 collected in Aquatic Invasive Species decals prior to the 2011 supplemental budget redirecting this revenue to the general fund appropriation for this program.
6)and $3,165,045 in investment gains realized by the State Treasurer in 2010-2011 and allocated to the Department's expendable cash balance in FY 2011
All Department expenditures, excepting capital construction costs, included in a Legislative appropriation andpaid directly by the Department of Administration and Information Construction Management Division, are shown
FROM EXPENDABLE FUNDS FOR THE PERIOD ENDED JUNE 30, 2011
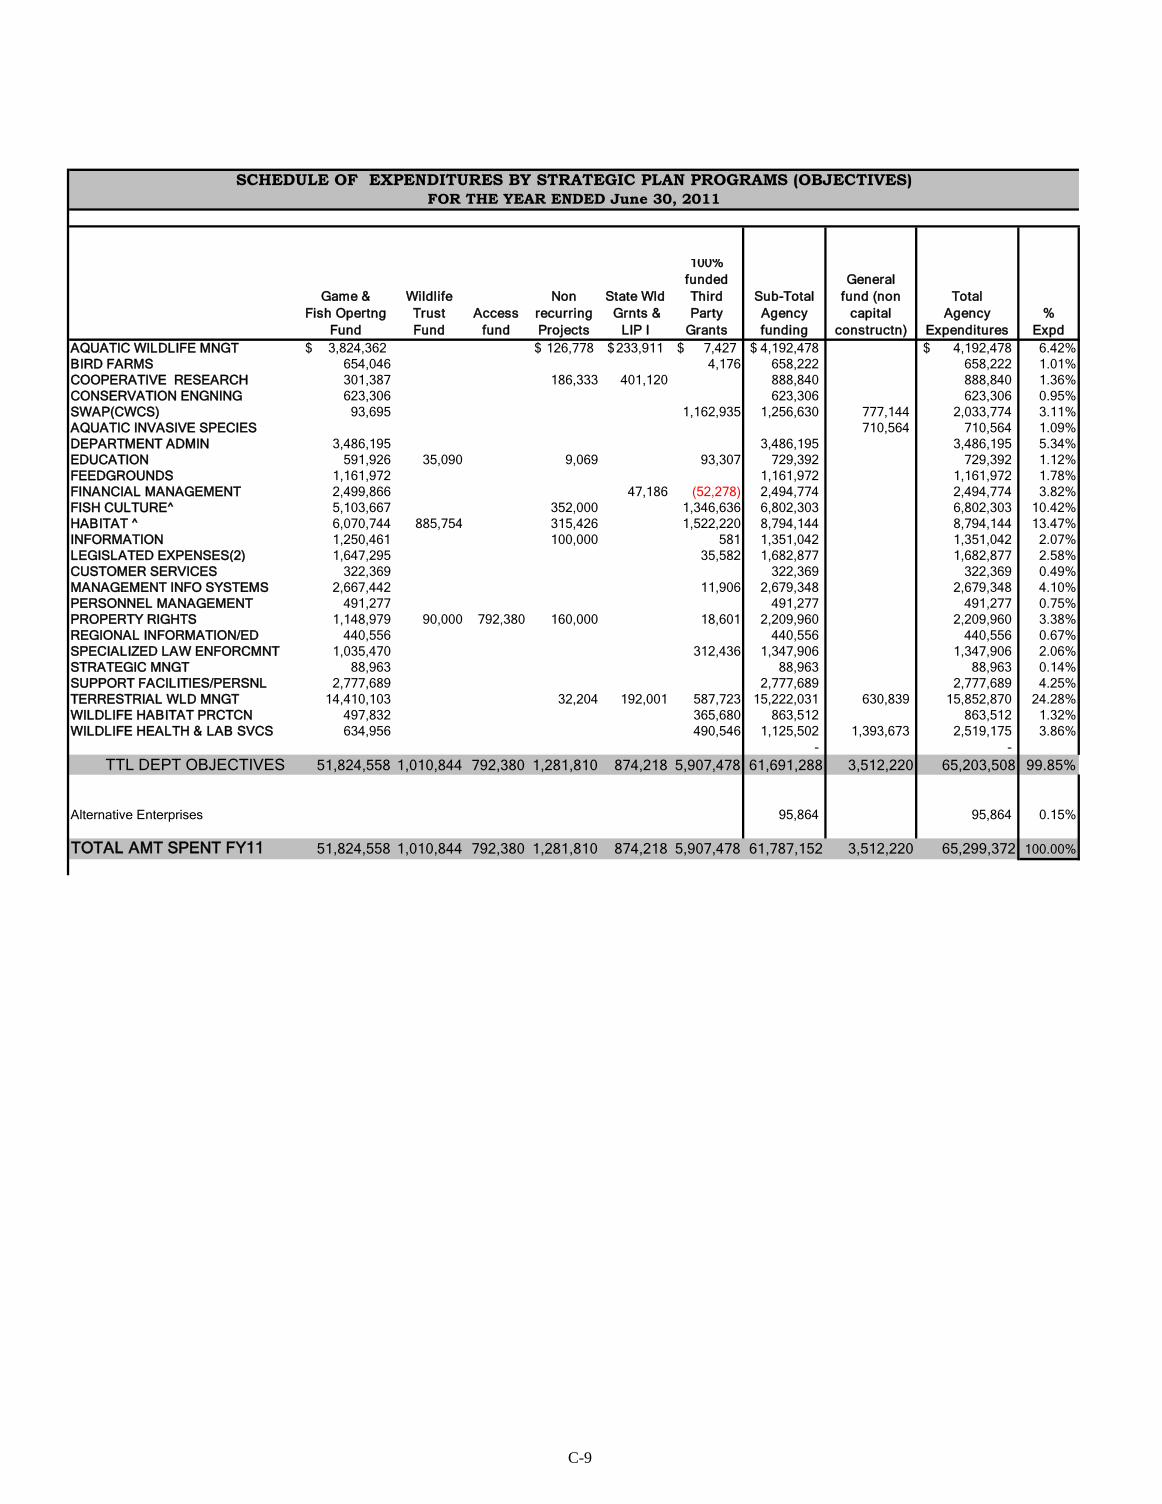
C-9
SCHEDULE OF EXPENDITURES BY STRATEGIC PLAN PROGRAMS (OBJECTIVES)FOR THE YEAR ENDED June 30, 2011
Game &Fish Opertng
Fund
WildlifeTrust Fund
Accessfund
NonrecurringProjects
State Wld Grnts &
LIP I
100% funded ThirdParty
Grants
Sub-Total Agencyfunding
Generalfund (non
capitalconstructn)
TotalAgency
Expenditures%
ExpdAQUATIC WILDLIFE MNGT 3,824,362$ 126,778$ 233,911$ 7,427$ 4,192,478$ 4,192,478$ 6.42%BIRD FARMS 654,046 4,176 658,222 658,222 1.01%COOPERATIVE RESEARCH 301,387 186,333 401,120 888,840 888,840 1.36%CONSERVATION ENGNING 623,306 623,306 623,306 0.95%SWAP(CWCS) 93,695 1,162,935 1,256,630 777,144 2,033,774 3.11%AQUATIC INVASIVE SPECIES 710,564 710,564 1.09%DEPARTMENT ADMIN 3,486,195 3,486,195 3,486,195 5.34%EDUCATION 591,926 35,090 9,069 93,307 729,392 729,392 1.12%FEEDGROUNDS 1,161,972 1,161,972 1,161,972 1.78%FINANCIAL MANAGEMENT 2,499,866 47,186 (52,278) 2,494,774 2,494,774 3.82%FISH CULTURE^ 5,103,667 352,000 1,346,636 6,802,303 6,802,303 10.42%HABITAT ^ 6,070,744 885,754 315,426 1,522,220 8,794,144 8,794,144 13.47%INFORMATION 1,250,461 100,000 581 1,351,042 1,351,042 2.07%LEGISLATED EXPENSES(2) 1,647,295 35,582 1,682,877 1,682,877 2.58%CUSTOMER SERVICES 322,369 322,369 322,369 0.49%MANAGEMENT INFO SYSTEMS 2,667,442 11,906 2,679,348 2,679,348 4.10%PERSONNEL MANAGEMENT 491,277 491,277 491,277 0.75%PROPERTY RIGHTS 1,148,979 90,000 792,380 160,000 18,601 2,209,960 2,209,960 3.38%REGIONAL INFORMATION/ED 440,556 440,556 440,556 0.67%SPECIALIZED LAW ENFORCMNT 1,035,470 312,436 1,347,906 1,347,906 2.06%STRATEGIC MNGT 88,963 88,963 88,963 0.14%SUPPORT FACILITIES/PERSNL 2,777,689 2,777,689 2,777,689 4.25%TERRESTRIAL WLD MNGT 14,410,103 32,204 192,001 587,723 15,222,031 630,839 15,852,870 24.28%WILDLIFE HABITAT PRCTCN 497,832 365,680 863,512 863,512 1.32%WILDLIFE HEALTH & LAB SVCS 634,956 490,546 1,125,502 1,393,673 2,519,175 3.86%
- - TTL DEPT OBJECTIVES 51,824,558 1,010,844 792,380 1,281,810 874,218 5,907,478 61,691,288 3,512,220 65,203,508 99.85%
Alternative Enterprises 95,864 95,864 0.15%
TOTAL AMT SPENT FY11 51,824,558 1,010,844 792,380 1,281,810 874,218 5,907,478 61,787,152 3,512,220 65,299,372 100.00%
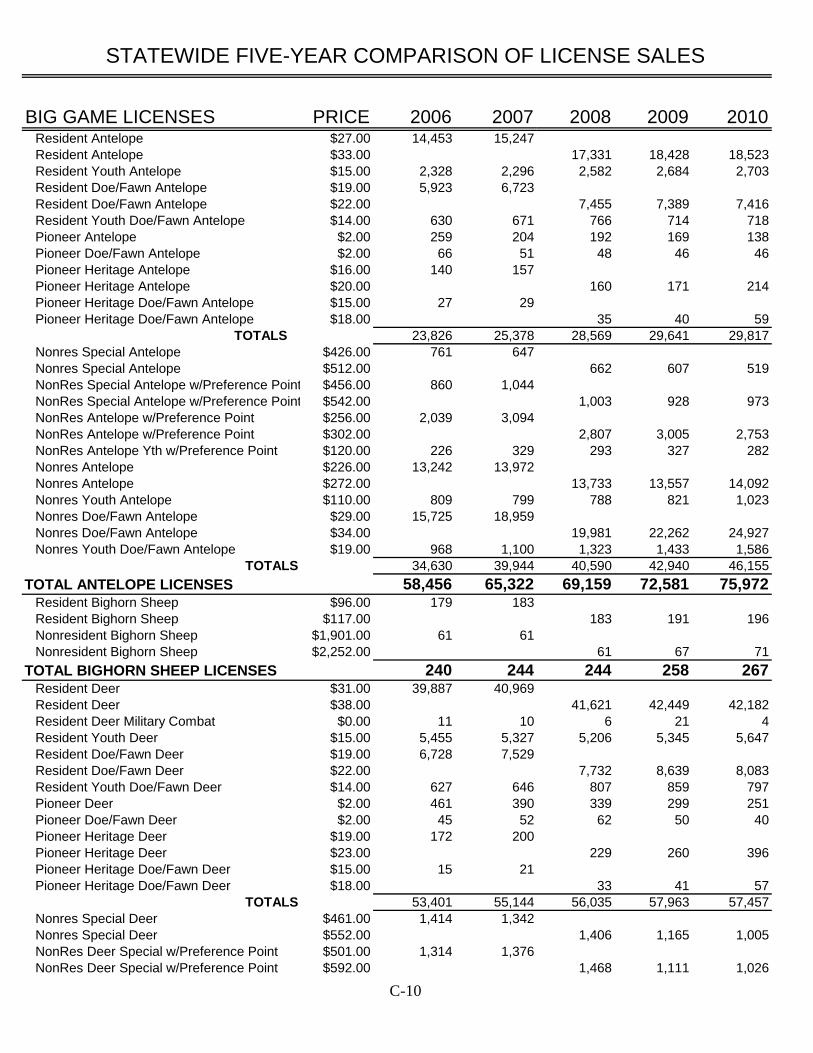
STATEWIDE FIVE-YEAR COMPARISON OF LICENSE SALES
C-10
BIG GAME LICENSES PRICE 2006 2007 2008 2009 2010 Resident Antelope $27.00 14,453 15,247 Resident Antelope $33.00 17,331 18,428 18,523 Resident Youth Antelope $15.00 2,328 2,296 2,582 2,684 2,703 Resident Doe/Fawn Antelope $19.00 5,923 6,723 Resident Doe/Fawn Antelope $22.00 7,455 7,389 7,416 Resident Youth Doe/Fawn Antelope $14.00 630 671 766 714 718 Pioneer Antelope $2.00 259 204 192 169 138 Pioneer Doe/Fawn Antelope $2.00 66 51 48 46 46 Pioneer Heritage Antelope $16.00 140 157 Pioneer Heritage Antelope $20.00 160 171 214 Pioneer Heritage Doe/Fawn Antelope $15.00 27 29 Pioneer Heritage Doe/Fawn Antelope $18.00 35 40 59
TOTALS 23,826 25,378 28,569 29,641 29,817 Nonres Special Antelope $426.00 761 647 Nonres Special Antelope $512.00 662 607 519 NonRes Special Antelope w/Preference Point $456.00 860 1,044 NonRes Special Antelope w/Preference Point $542.00 1,003 928 973 NonRes Antelope w/Preference Point $256.00 2,039 3,094 NonRes Antelope w/Preference Point $302.00 2,807 3,005 2,753 NonRes Antelope Yth w/Preference Point $120.00 226 329 293 327 282 Nonres Antelope $226.00 13,242 13,972 Nonres Antelope $272.00 13,733 13,557 14,092 Nonres Youth Antelope $110.00 809 799 788 821 1,023 Nonres Doe/Fawn Antelope $29.00 15,725 18,959 Nonres Doe/Fawn Antelope $34.00 19,981 22,262 24,927 Nonres Youth Doe/Fawn Antelope $19.00 968 1,100 1,323 1,433 1,586
TOTALS 34,630 39,944 40,590 42,940 46,155TOTAL ANTELOPE LICENSES 58,456 65,322 69,159 72,581 75,972 Resident Bighorn Sheep $96.00 179 183 Resident Bighorn Sheep $117.00 183 191 196 Nonresident Bighorn Sheep $1,901.00 61 61 Nonresident Bighorn Sheep $2,252.00 61 67 71TOTAL BIGHORN SHEEP LICENSES 240 244 244 258 267 Resident Deer $31.00 39,887 40,969 Resident Deer $38.00 41,621 42,449 42,182 Resident Deer Military Combat $0.00 11 10 6 21 4 Resident Youth Deer $15.00 5,455 5,327 5,206 5,345 5,647 Resident Doe/Fawn Deer $19.00 6,728 7,529 Resident Doe/Fawn Deer $22.00 7,732 8,639 8,083 Resident Youth Doe/Fawn Deer $14.00 627 646 807 859 797 Pioneer Deer $2.00 461 390 339 299 251 Pioneer Doe/Fawn Deer $2.00 45 52 62 50 40 Pioneer Heritage Deer $19.00 172 200 Pioneer Heritage Deer $23.00 229 260 396 Pioneer Heritage Doe/Fawn Deer $15.00 15 21 Pioneer Heritage Doe/Fawn Deer $18.00 33 41 57
TOTALS 53,401 55,144 56,035 57,963 57,457 Nonres Special Deer $461.00 1,414 1,342 Nonres Special Deer $552.00 1,406 1,165 1,005 NonRes Deer Special w/Preference Point $501.00 1,314 1,376 NonRes Deer Special w/Preference Point $592.00 1,468 1,111 1,026
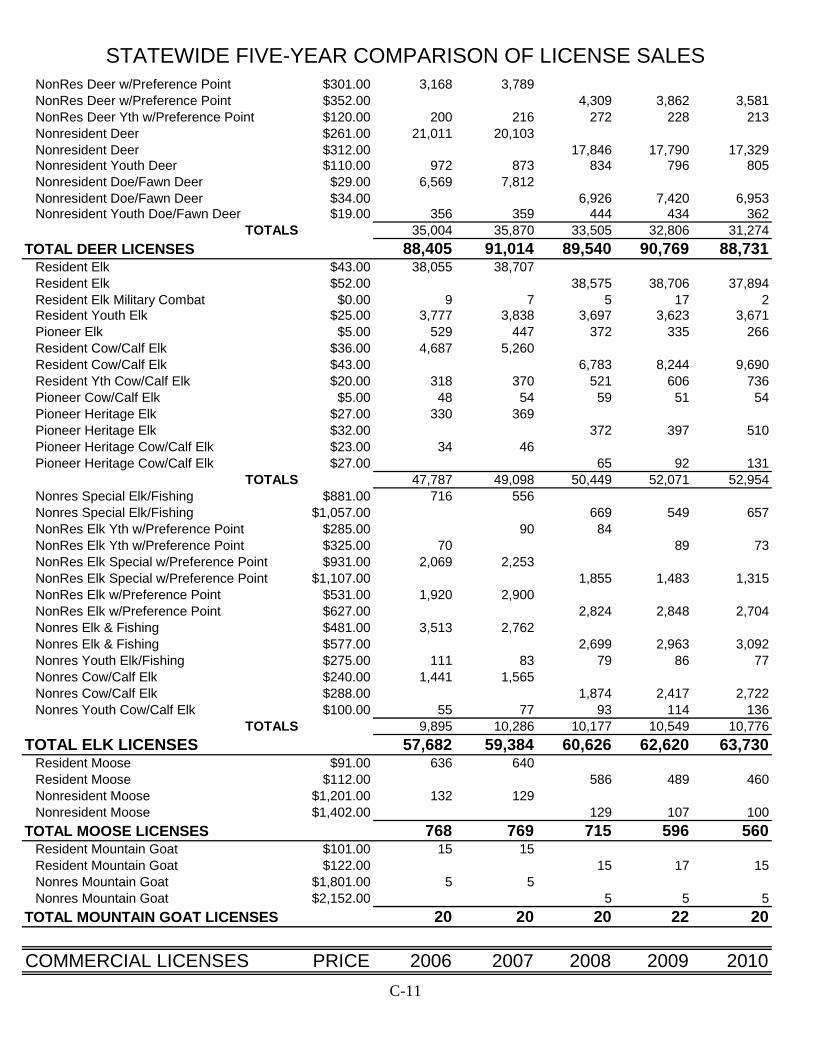
STATEWIDE FIVE-YEAR COMPARISON OF LICENSE SALES
C-11
NonRes Deer w/Preference Point $301.00 3,168 3,789 NonRes Deer w/Preference Point $352.00 4,309 3,862 3,581 NonRes Deer Yth w/Preference Point $120.00 200 216 272 228 213 Nonresident Deer $261.00 21,011 20,103 Nonresident Deer $312.00 17,846 17,790 17,329 Nonresident Youth Deer $110.00 972 873 834 796 805 Nonresident Doe/Fawn Deer $29.00 6,569 7,812 Nonresident Doe/Fawn Deer $34.00 6,926 7,420 6,953 Nonresident Youth Doe/Fawn Deer $19.00 356 359 444 434 362
TOTALS 35,004 35,870 33,505 32,806 31,274TOTAL DEER LICENSES 88,405 91,014 89,540 90,769 88,731 Resident Elk $43.00 38,055 38,707 Resident Elk $52.00 38,575 38,706 37,894 Resident Elk Military Combat $0.00 9 7 5 17 2 Resident Youth Elk $25.00 3,777 3,838 3,697 3,623 3,671 Pioneer Elk $5.00 529 447 372 335 266 Resident Cow/Calf Elk $36.00 4,687 5,260 Resident Cow/Calf Elk $43.00 6,783 8,244 9,690 Resident Yth Cow/Calf Elk $20.00 318 370 521 606 736 Pioneer Cow/Calf Elk $5.00 48 54 59 51 54 Pioneer Heritage Elk $27.00 330 369 Pioneer Heritage Elk $32.00 372 397 510 Pioneer Heritage Cow/Calf Elk $23.00 34 46 Pioneer Heritage Cow/Calf Elk $27.00 65 92 131
TOTALS 47,787 49,098 50,449 52,071 52,954 Nonres Special Elk/Fishing $881.00 716 556 Nonres Special Elk/Fishing $1,057.00 669 549 657 NonRes Elk Yth w/Preference Point $285.00 90 84 NonRes Elk Yth w/Preference Point $325.00 70 89 73 NonRes Elk Special w/Preference Point $931.00 2,069 2,253 NonRes Elk Special w/Preference Point $1,107.00 1,855 1,483 1,315 NonRes Elk w/Preference Point $531.00 1,920 2,900 NonRes Elk w/Preference Point $627.00 2,824 2,848 2,704 Nonres Elk & Fishing $481.00 3,513 2,762 Nonres Elk & Fishing $577.00 2,699 2,963 3,092 Nonres Youth Elk/Fishing $275.00 111 83 79 86 77 Nonres Cow/Calf Elk $240.00 1,441 1,565 Nonres Cow/Calf Elk $288.00 1,874 2,417 2,722 Nonres Youth Cow/Calf Elk $100.00 55 77 93 114 136
TOTALS 9,895 10,286 10,177 10,549 10,776TOTAL ELK LICENSES 57,682 59,384 60,626 62,620 63,730 Resident Moose $91.00 636 640 Resident Moose $112.00 586 489 460 Nonresident Moose $1,201.00 132 129 Nonresident Moose $1,402.00 129 107 100TOTAL MOOSE LICENSES 768 769 715 596 560 Resident Mountain Goat $101.00 15 15 Resident Mountain Goat $122.00 15 17 15 Nonres Mountain Goat $1,801.00 5 5 Nonres Mountain Goat $2,152.00 5 5 5TOTAL MOUNTAIN GOAT LICENSES 20 20 20 22 20
COMMERCIAL LICENSES PRICE 2006 2007 2008 2009 2010
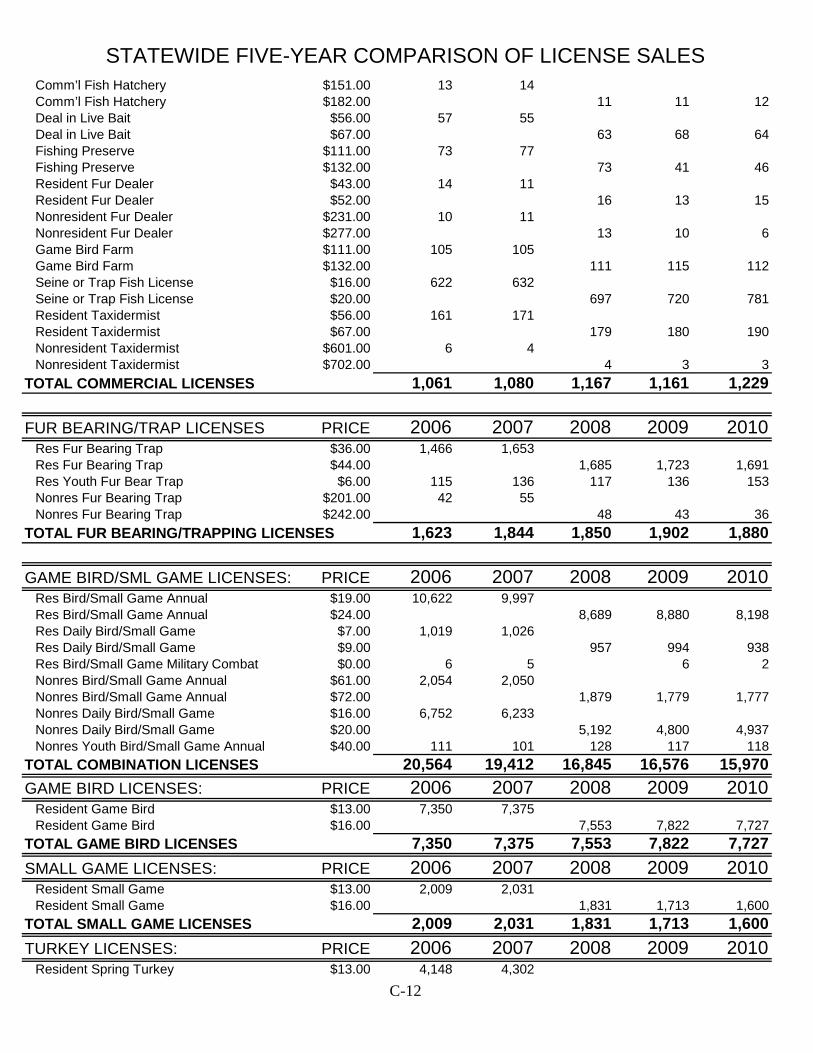
STATEWIDE FIVE-YEAR COMPARISON OF LICENSE SALES
C-12
Comm’l Fish Hatchery $151.00 13 14 Comm’l Fish Hatchery $182.00 11 11 12 Deal in Live Bait $56.00 57 55 Deal in Live Bait $67.00 63 68 64 Fishing Preserve $111.00 73 77 Fishing Preserve $132.00 73 41 46 Resident Fur Dealer $43.00 14 11 Resident Fur Dealer $52.00 16 13 15 Nonresident Fur Dealer $231.00 10 11 Nonresident Fur Dealer $277.00 13 10 6 Game Bird Farm $111.00 105 105 Game Bird Farm $132.00 111 115 112 Seine or Trap Fish License $16.00 622 632 Seine or Trap Fish License $20.00 697 720 781 Resident Taxidermist $56.00 161 171 Resident Taxidermist $67.00 179 180 190 Nonresident Taxidermist $601.00 6 4 Nonresident Taxidermist $702.00 4 3 3TOTAL COMMERCIAL LICENSES 1,061 1,080 1,167 1,161 1,229
FUR BEARING/TRAP LICENSES PRICE 2006 2007 2008 2009 2010 Res Fur Bearing Trap $36.00 1,466 1,653 Res Fur Bearing Trap $44.00 1,685 1,723 1,691 Res Youth Fur Bear Trap $6.00 115 136 117 136 153 Nonres Fur Bearing Trap $201.00 42 55 Nonres Fur Bearing Trap $242.00 48 43 36TOTAL FUR BEARING/TRAPPING LICENSES 1,623 1,844 1,850 1,902 1,880
GAME BIRD/SML GAME LICENSES: PRICE 2006 2007 2008 2009 2010 Res Bird/Small Game Annual $19.00 10,622 9,997 Res Bird/Small Game Annual $24.00 8,689 8,880 8,198 Res Daily Bird/Small Game $7.00 1,019 1,026 Res Daily Bird/Small Game $9.00 957 994 938 Res Bird/Small Game Military Combat $0.00 6 5 6 2 Nonres Bird/Small Game Annual $61.00 2,054 2,050 Nonres Bird/Small Game Annual $72.00 1,879 1,779 1,777 Nonres Daily Bird/Small Game $16.00 6,752 6,233 Nonres Daily Bird/Small Game $20.00 5,192 4,800 4,937 Nonres Youth Bird/Small Game Annual $40.00 111 101 128 117 118TOTAL COMBINATION LICENSES 20,564 19,412 16,845 16,576 15,970GAME BIRD LICENSES: PRICE 2006 2007 2008 2009 2010 Resident Game Bird $13.00 7,350 7,375 Resident Game Bird $16.00 7,553 7,822 7,727TOTAL GAME BIRD LICENSES 7,350 7,375 7,553 7,822 7,727SMALL GAME LICENSES: PRICE 2006 2007 2008 2009 2010 Resident Small Game $13.00 2,009 2,031 Resident Small Game $16.00 1,831 1,713 1,600TOTAL SMALL GAME LICENSES 2,009 2,031 1,831 1,713 1,600TURKEY LICENSES: PRICE 2006 2007 2008 2009 2010 Resident Spring Turkey $13.00 4,148 4,302
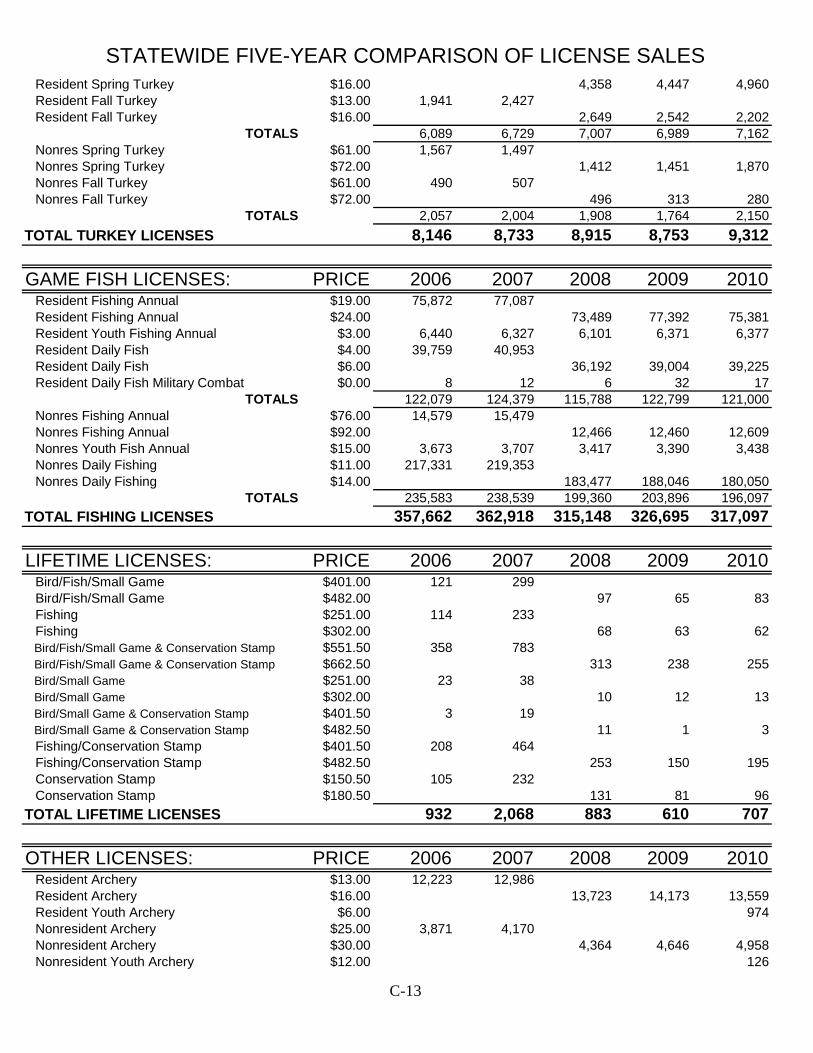
STATEWIDE FIVE-YEAR COMPARISON OF LICENSE SALES
C-13
Resident Spring Turkey $16.00 4,358 4,447 4,960 Resident Fall Turkey $13.00 1,941 2,427 Resident Fall Turkey $16.00 2,649 2,542 2,202
TOTALS 6,089 6,729 7,007 6,989 7,162 Nonres Spring Turkey $61.00 1,567 1,497 Nonres Spring Turkey $72.00 1,412 1,451 1,870 Nonres Fall Turkey $61.00 490 507 Nonres Fall Turkey $72.00 496 313 280
TOTALS 2,057 2,004 1,908 1,764 2,150TOTAL TURKEY LICENSES 8,146 8,733 8,915 8,753 9,312
GAME FISH LICENSES: PRICE 2006 2007 2008 2009 2010 Resident Fishing Annual $19.00 75,872 77,087 Resident Fishing Annual $24.00 73,489 77,392 75,381 Resident Youth Fishing Annual $3.00 6,440 6,327 6,101 6,371 6,377 Resident Daily Fish $4.00 39,759 40,953 Resident Daily Fish $6.00 36,192 39,004 39,225 Resident Daily Fish Military Combat $0.00 8 12 6 32 17
TOTALS 122,079 124,379 115,788 122,799 121,000 Nonres Fishing Annual $76.00 14,579 15,479 Nonres Fishing Annual $92.00 12,466 12,460 12,609 Nonres Youth Fish Annual $15.00 3,673 3,707 3,417 3,390 3,438 Nonres Daily Fishing $11.00 217,331 219,353 Nonres Daily Fishing $14.00 183,477 188,046 180,050
TOTALS 235,583 238,539 199,360 203,896 196,097TOTAL FISHING LICENSES 357,662 362,918 315,148 326,695 317,097
LIFETIME LICENSES: PRICE 2006 2007 2008 2009 2010 Bird/Fish/Small Game $401.00 121 299 Bird/Fish/Small Game $482.00 97 65 83 Fishing $251.00 114 233 Fishing $302.00 68 63 62 Bird/Fish/Small Game & Conservation Stamp $551.50 358 783 Bird/Fish/Small Game & Conservation Stamp $662.50 313 238 255 Bird/Small Game $251.00 23 38 Bird/Small Game $302.00 10 12 13 Bird/Small Game & Conservation Stamp $401.50 3 19 Bird/Small Game & Conservation Stamp $482.50 11 1 3 Fishing/Conservation Stamp $401.50 208 464 Fishing/Conservation Stamp $482.50 253 150 195 Conservation Stamp $150.50 105 232 Conservation Stamp $180.50 131 81 96TOTAL LIFETIME LICENSES 932 2,068 883 610 707
OTHER LICENSES: PRICE 2006 2007 2008 2009 2010 Resident Archery $13.00 12,223 12,986 Resident Archery $16.00 13,723 14,173 13,559 Resident Youth Archery $6.00 974 Nonresident Archery $25.00 3,871 4,170 Nonresident Archery $30.00 4,364 4,646 4,958 Nonresident Youth Archery $12.00 126
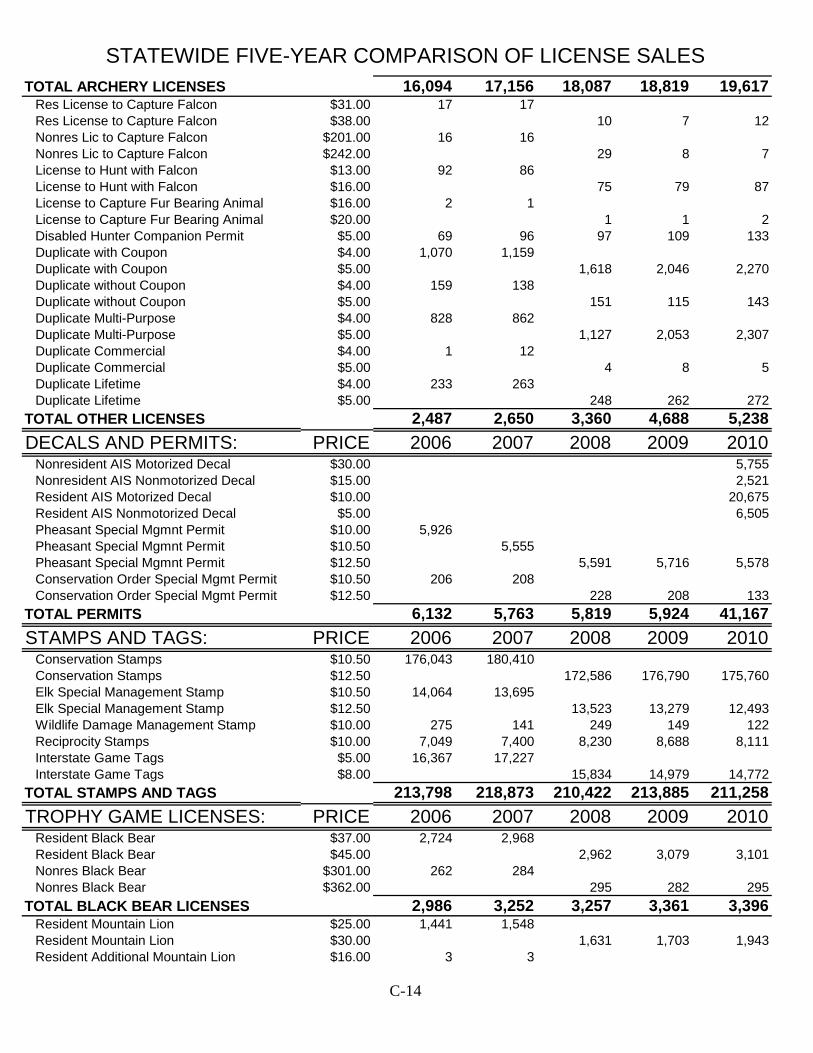
STATEWIDE FIVE-YEAR COMPARISON OF LICENSE SALES
C-14
TOTAL ARCHERY LICENSES 16,094 17,156 18,087 18,819 19,617 Res License to Capture Falcon $31.00 17 17 Res License to Capture Falcon $38.00 10 7 12 Nonres Lic to Capture Falcon $201.00 16 16 Nonres Lic to Capture Falcon $242.00 29 8 7 License to Hunt with Falcon $13.00 92 86 License to Hunt with Falcon $16.00 75 79 87 License to Capture Fur Bearing Animal $16.00 2 1 License to Capture Fur Bearing Animal $20.00 1 1 2 Disabled Hunter Companion Permit $5.00 69 96 97 109 133 Duplicate with Coupon $4.00 1,070 1,159 Duplicate with Coupon $5.00 1,618 2,046 2,270 Duplicate without Coupon $4.00 159 138 Duplicate without Coupon $5.00 151 115 143 Duplicate Multi-Purpose $4.00 828 862 Duplicate Multi-Purpose $5.00 1,127 2,053 2,307 Duplicate Commercial $4.00 1 12 Duplicate Commercial $5.00 4 8 5 Duplicate Lifetime $4.00 233 263 Duplicate Lifetime $5.00 248 262 272TOTAL OTHER LICENSES 2,487 2,650 3,360 4,688 5,238DECALS AND PERMITS: PRICE 2006 2007 2008 2009 2010 Nonresident AIS Motorized Decal $30.00 5,755 Nonresident AIS Nonmotorized Decal $15.00 2,521 Resident AIS Motorized Decal $10.00 20,675 Resident AIS Nonmotorized Decal $5.00 6,505 Pheasant Special Mgmnt Permit $10.00 5,926 Pheasant Special Mgmnt Permit $10.50 5,555 Pheasant Special Mgmnt Permit $12.50 5,591 5,716 5,578 Conservation Order Special Mgmt Permit $10.50 206 208 Conservation Order Special Mgmt Permit $12.50 228 208 133TOTAL PERMITS 6,132 5,763 5,819 5,924 41,167STAMPS AND TAGS: PRICE 2006 2007 2008 2009 2010 Conservation Stamps $10.50 176,043 180,410 Conservation Stamps $12.50 172,586 176,790 175,760 Elk Special Management Stamp $10.50 14,064 13,695 Elk Special Management Stamp $12.50 13,523 13,279 12,493 Wildlife Damage Management Stamp $10.00 275 141 249 149 122 Reciprocity Stamps $10.00 7,049 7,400 8,230 8,688 8,111 Interstate Game Tags $5.00 16,367 17,227 Interstate Game Tags $8.00 15,834 14,979 14,772TOTAL STAMPS AND TAGS 213,798 218,873 210,422 213,885 211,258TROPHY GAME LICENSES: PRICE 2006 2007 2008 2009 2010 Resident Black Bear $37.00 2,724 2,968 Resident Black Bear $45.00 2,962 3,079 3,101 Nonres Black Bear $301.00 262 284 Nonres Black Bear $362.00 295 282 295TOTAL BLACK BEAR LICENSES 2,986 3,252 3,257 3,361 3,396 Resident Mountain Lion $25.00 1,441 1,548 Resident Mountain Lion $30.00 1,631 1,703 1,943 Resident Additional Mountain Lion $16.00 3 3
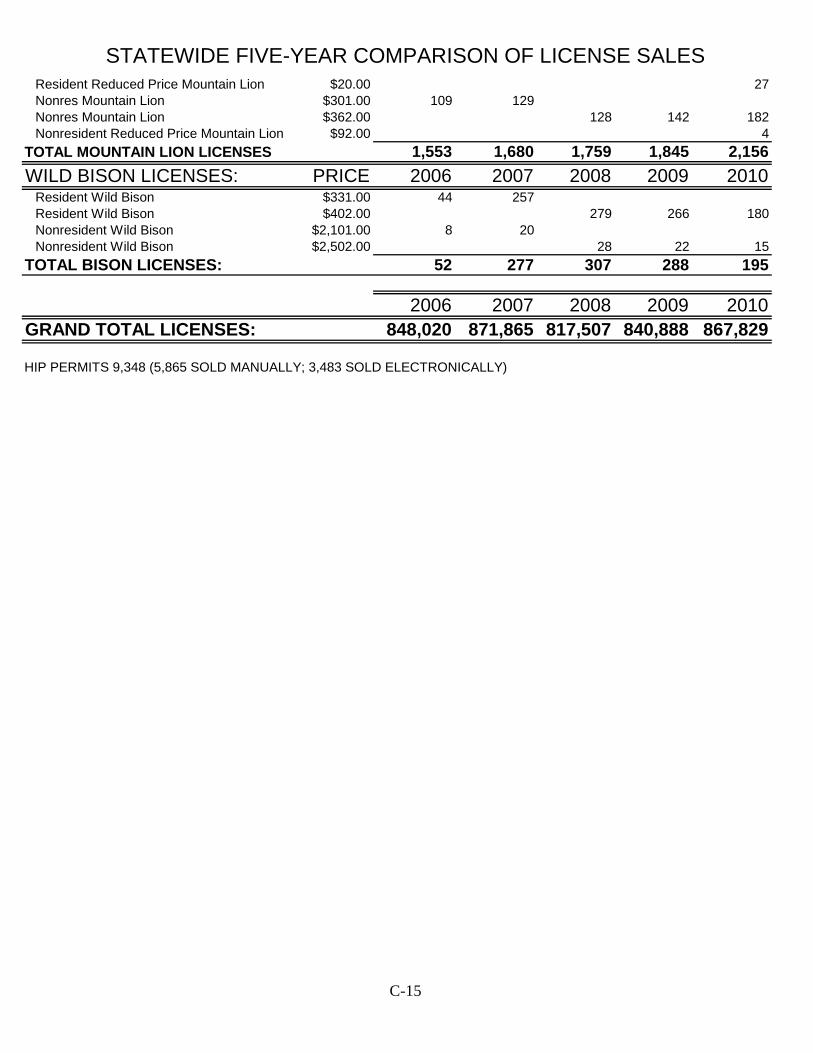
STATEWIDE FIVE-YEAR COMPARISON OF LICENSE SALES
C-15
Resident Reduced Price Mountain Lion $20.00 27 Nonres Mountain Lion $301.00 109 129 Nonres Mountain Lion $362.00 128 142 182 Nonresident Reduced Price Mountain Lion $92.00 4TOTAL MOUNTAIN LION LICENSES 1,553 1,680 1,759 1,845 2,156WILD BISON LICENSES: PRICE 2006 2007 2008 2009 2010 Resident Wild Bison $331.00 44 257 Resident Wild Bison $402.00 279 266 180 Nonresident Wild Bison $2,101.00 8 20 Nonresident Wild Bison $2,502.00 28 22 15TOTAL BISON LICENSES: 52 277 307 288 195
2006 2007 2008 2009 2010GRAND TOTAL LICENSES: 848,020 871,865 817,507 840,888 867,829
HIP PERMITS 9,348 (5,865 SOLD MANUALLY; 3,483 SOLD ELECTRONICALLY)
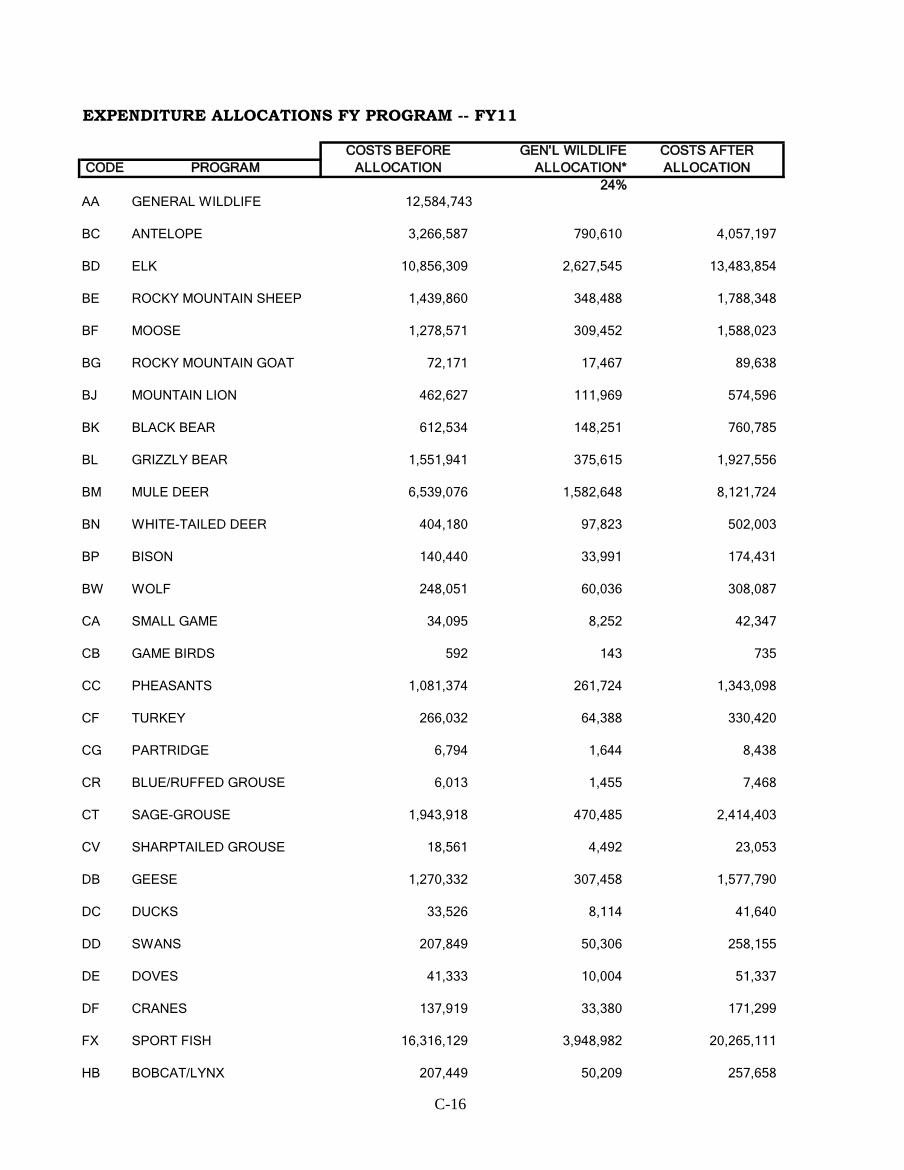
C-16
EXPENDITURE ALLOCATIONS FY PROGRAM -- FY11
COSTS BEFORE GEN'L WILDLIFE COSTS AFTERCODE PROGRAM ALLOCATION ALLOCATION* ALLOCATION
24%AA GENERAL WILDLIFE 12,584,743
BC ANTELOPE 3,266,587 790,610 4,057,197
BD ELK 10,856,309 2,627,545 13,483,854
BE ROCKY MOUNTAIN SHEEP 1,439,860 348,488 1,788,348
BF MOOSE 1,278,571 309,452 1,588,023
BG ROCKY MOUNTAIN GOAT 72,171 17,467 89,638
BJ MOUNTAIN LION 462,627 111,969 574,596
BK BLACK BEAR 612,534 148,251 760,785
BL GRIZZLY BEAR 1,551,941 375,615 1,927,556
BM MULE DEER 6,539,076 1,582,648 8,121,724
BN WHITE-TAILED DEER 404,180 97,823 502,003
BP BISON 140,440 33,991 174,431
BW WOLF 248,051 60,036 308,087
CA SMALL GAME 34,095 8,252 42,347
CB GAME BIRDS 592 143 735
CC PHEASANTS 1,081,374 261,724 1,343,098
CF TURKEY 266,032 64,388 330,420
CG PARTRIDGE 6,794 1,644 8,438 CR BLUE/RUFFED GROUSE 6,013 1,455 7,468 CT SAGE-GROUSE 1,943,918 470,485 2,414,403 CV SHARPTAILED GROUSE 18,561 4,492 23,053
DB GEESE 1,270,332 307,458 1,577,790
DC DUCKS 33,526 8,114 41,640
DD SWANS 207,849 50,306 258,155
DE DOVES 41,333 10,004 51,337
DF CRANES 137,919 33,380 171,299
FX SPORT FISH 16,316,129 3,948,982 20,265,111
HB BOBCAT/LYNX 207,449 50,209 257,658
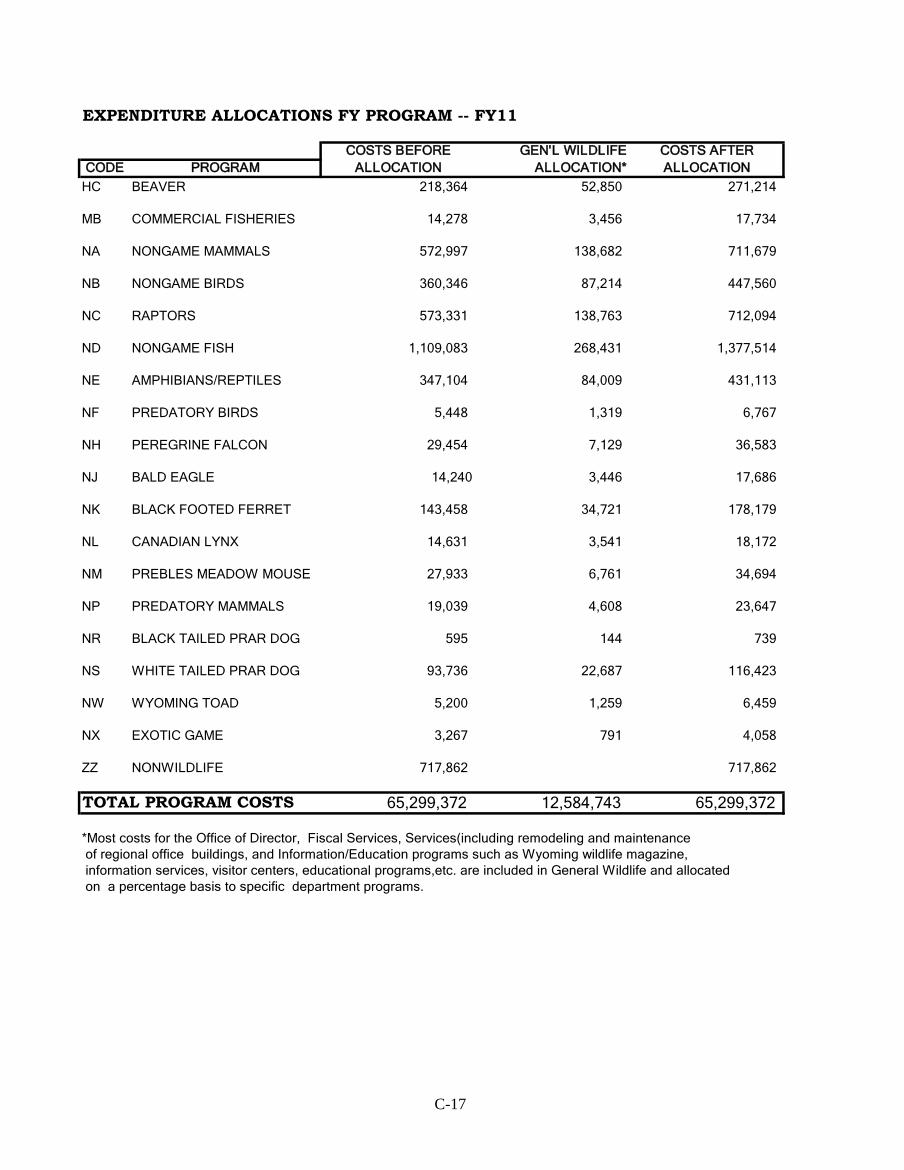
C-17
EXPENDITURE ALLOCATIONS FY PROGRAM -- FY11
COSTS BEFORE GEN'L WILDLIFE COSTS AFTERCODE PROGRAM ALLOCATION ALLOCATION* ALLOCATION
HC BEAVER 218,364 52,850 271,214
MB COMMERCIAL FISHERIES 14,278 3,456 17,734
NA NONGAME MAMMALS 572,997 138,682 711,679
NB NONGAME BIRDS 360,346 87,214 447,560
NC RAPTORS 573,331 138,763 712,094
ND NONGAME FISH 1,109,083 268,431 1,377,514
NE AMPHIBIANS/REPTILES 347,104 84,009 431,113
NF PREDATORY BIRDS 5,448 1,319 6,767 NH PEREGRINE FALCON 29,454 7,129 36,583 NJ BALD EAGLE 14,240 3,446 17,686
NK BLACK FOOTED FERRET 143,458 34,721 178,179
NL CANADIAN LYNX 14,631 3,541 18,172
NM PREBLES MEADOW MOUSE 27,933 6,761 34,694
NP PREDATORY MAMMALS 19,039 4,608 23,647
NR BLACK TAILED PRAR DOG 595 144 739
NS WHITE TAILED PRAR DOG 93,736 22,687 116,423
NW WYOMING TOAD 5,200 1,259 6,459
NX EXOTIC GAME 3,267 791 4,058
ZZ NONWILDLIFE 717,862 717,862
TOTAL PROGRAM COSTS 65,299,372 12,584,743 65,299,372 *Most costs for the Office of Director, Fiscal Services, Services(including remodeling and maintenance of regional office buildings, and Information/Education programs such as Wyoming wildlife magazine, information services, visitor centers, educational programs,etc. are included in General Wildlife and allocated on a percentage basis to specific department programs.
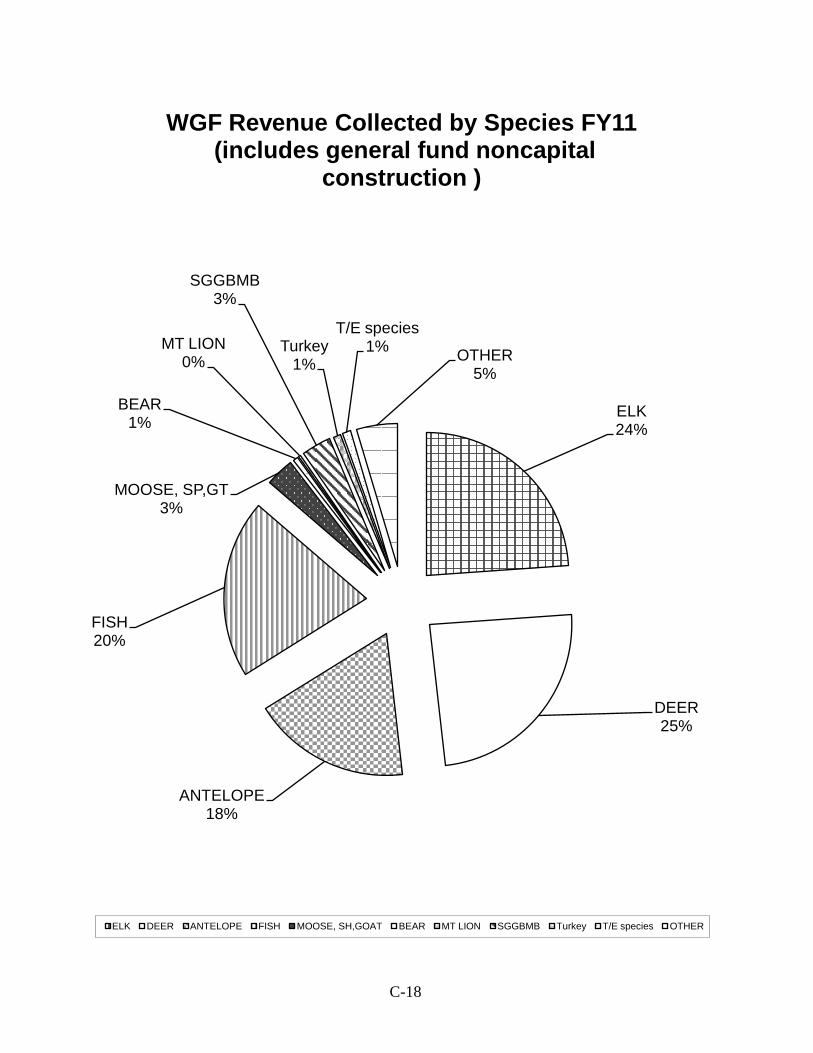
C-18
ELK24%
DEER25%
ANTELOPE18%
FISH20%
MOOSE, SP,GT3%
BEAR1%
MT LION0%
SGGBMB3%
Turkey1%
T/E species1% OTHER
5%
WGF Revenue Collected by Species FY11(includes general fund noncapital
construction )
ELK DEER ANTELOPE FISH MOOSE, SH,GOAT BEAR MT LION SGGBMB Turkey T/E species OTHER
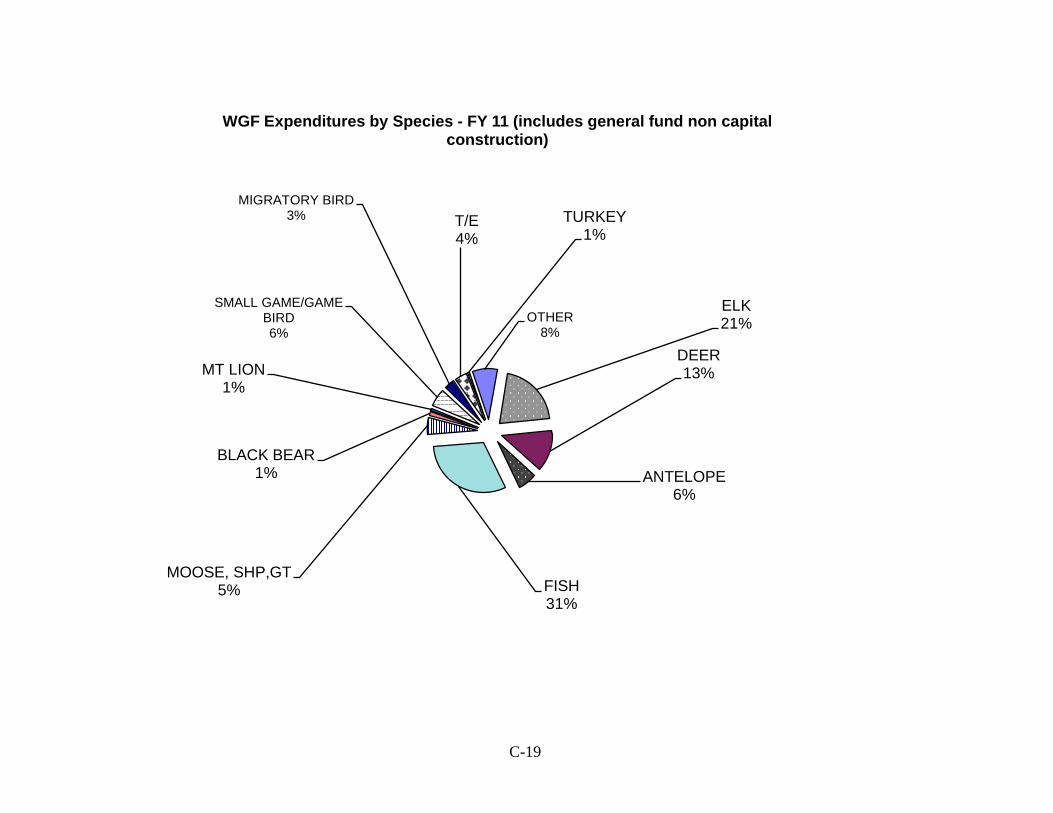
C-19
ELK21%
DEER13%
ANTELOPE6%
FISH31%
MOOSE, SHP,GT5%
BLACK BEAR1%
MT LION1%
SMALL GAME/GAME BIRD6%
MIGRATORY BIRD3% T/E
4%TURKEY
1%
OTHER8%
WGF Expenditures by Species - FY 11 (includes general fund non capital construction)
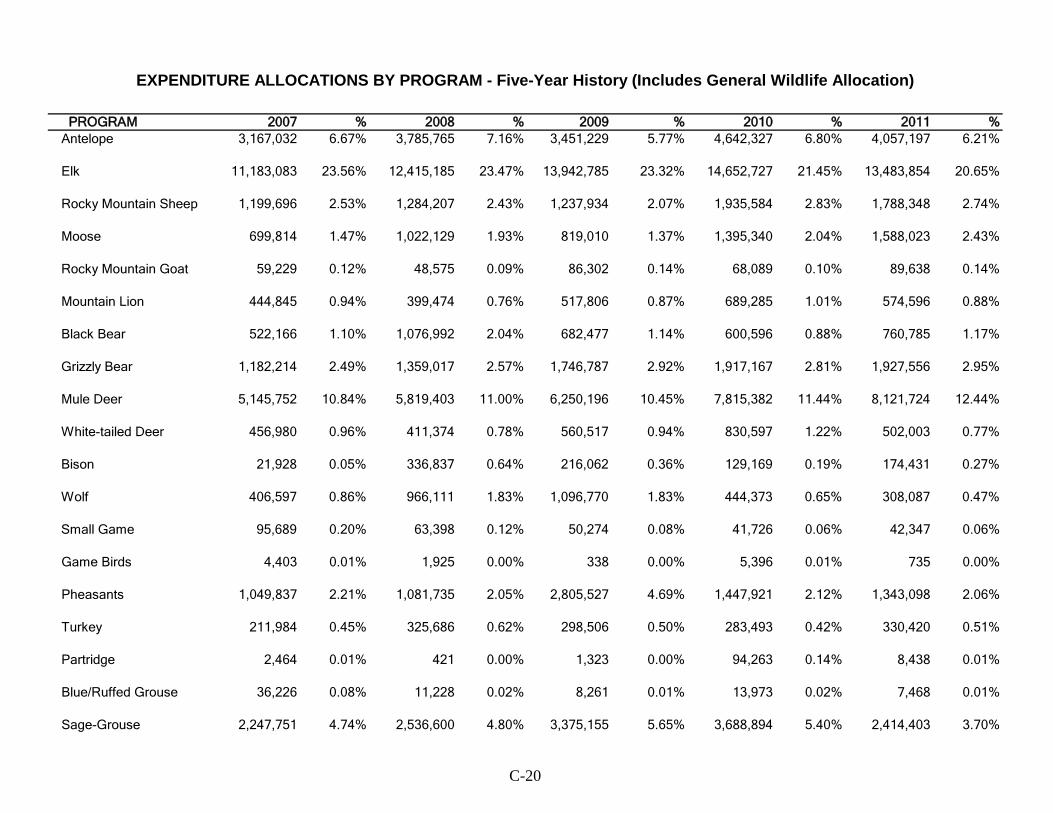
EXPENDITURE ALLOCATIONS BY PROGRAM - Five-Year History (Includes General Wildlife Allocation)
C-20
PROGRAM 2007 % 2008 % 2009 % 2010 % 2011 % Antelope 3,167,032 6.67% 3,785,765 7.16% 3,451,229 5.77% 4,642,327 6.80% 4,057,197 6.21%
Elk 11,183,083 23.56% 12,415,185 23.47% 13,942,785 23.32% 14,652,727 21.45% 13,483,854 20.65%
Rocky Mountain Sheep 1,199,696 2.53% 1,284,207 2.43% 1,237,934 2.07% 1,935,584 2.83% 1,788,348 2.74%
Moose 699,814 1.47% 1,022,129 1.93% 819,010 1.37% 1,395,340 2.04% 1,588,023 2.43%
Rocky Mountain Goat 59,229 0.12% 48,575 0.09% 86,302 0.14% 68,089 0.10% 89,638 0.14%
Mountain Lion 444,845 0.94% 399,474 0.76% 517,806 0.87% 689,285 1.01% 574,596 0.88%
Black Bear 522,166 1.10% 1,076,992 2.04% 682,477 1.14% 600,596 0.88% 760,785 1.17%
Grizzly Bear 1,182,214 2.49% 1,359,017 2.57% 1,746,787 2.92% 1,917,167 2.81% 1,927,556 2.95%
Mule Deer 5,145,752 10.84% 5,819,403 11.00% 6,250,196 10.45% 7,815,382 11.44% 8,121,724 12.44%
White-tailed Deer 456,980 0.96% 411,374 0.78% 560,517 0.94% 830,597 1.22% 502,003 0.77%
Bison 21,928 0.05% 336,837 0.64% 216,062 0.36% 129,169 0.19% 174,431 0.27%
Wolf 406,597 0.86% 966,111 1.83% 1,096,770 1.83% 444,373 0.65% 308,087 0.47%
Small Game 95,689 0.20% 63,398 0.12% 50,274 0.08% 41,726 0.06% 42,347 0.06%
Game Birds 4,403 0.01% 1,925 0.00% 338 0.00% 5,396 0.01% 735 0.00%
Pheasants 1,049,837 2.21% 1,081,735 2.05% 2,805,527 4.69% 1,447,921 2.12% 1,343,098 2.06%
Turkey 211,984 0.45% 325,686 0.62% 298,506 0.50% 283,493 0.42% 330,420 0.51%
Partridge 2,464 0.01% 421 0.00% 1,323 0.00% 94,263 0.14% 8,438 0.01%
Blue/Ruffed Grouse 36,226 0.08% 11,228 0.02% 8,261 0.01% 13,973 0.02% 7,468 0.01%
Sage-Grouse 2,247,751 4.74% 2,536,600 4.80% 3,375,155 5.65% 3,688,894 5.40% 2,414,403 3.70%
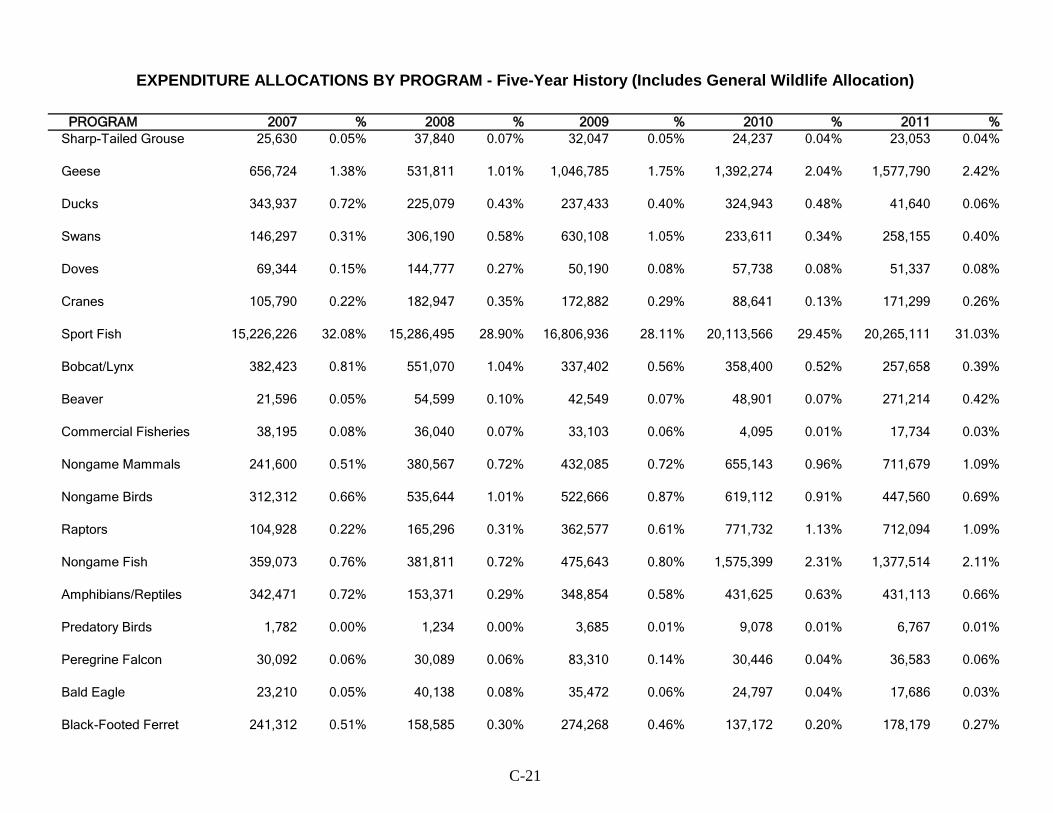
EXPENDITURE ALLOCATIONS BY PROGRAM - Five-Year History (Includes General Wildlife Allocation)
C-21
PROGRAM 2007 % 2008 % 2009 % 2010 % 2011 % Sharp-Tailed Grouse 25,630 0.05% 37,840 0.07% 32,047 0.05% 24,237 0.04% 23,053 0.04%
Geese 656,724 1.38% 531,811 1.01% 1,046,785 1.75% 1,392,274 2.04% 1,577,790 2.42%
Ducks 343,937 0.72% 225,079 0.43% 237,433 0.40% 324,943 0.48% 41,640 0.06%
Swans 146,297 0.31% 306,190 0.58% 630,108 1.05% 233,611 0.34% 258,155 0.40%
Doves 69,344 0.15% 144,777 0.27% 50,190 0.08% 57,738 0.08% 51,337 0.08%
Cranes 105,790 0.22% 182,947 0.35% 172,882 0.29% 88,641 0.13% 171,299 0.26%
Sport Fish 15,226,226 32.08% 15,286,495 28.90% 16,806,936 28.11% 20,113,566 29.45% 20,265,111 31.03%
Bobcat/Lynx 382,423 0.81% 551,070 1.04% 337,402 0.56% 358,400 0.52% 257,658 0.39%
Beaver 21,596 0.05% 54,599 0.10% 42,549 0.07% 48,901 0.07% 271,214 0.42%
Commercial Fisheries 38,195 0.08% 36,040 0.07% 33,103 0.06% 4,095 0.01% 17,734 0.03%
Nongame Mammals 241,600 0.51% 380,567 0.72% 432,085 0.72% 655,143 0.96% 711,679 1.09%
Nongame Birds 312,312 0.66% 535,644 1.01% 522,666 0.87% 619,112 0.91% 447,560 0.69%
Raptors 104,928 0.22% 165,296 0.31% 362,577 0.61% 771,732 1.13% 712,094 1.09%
Nongame Fish 359,073 0.76% 381,811 0.72% 475,643 0.80% 1,575,399 2.31% 1,377,514 2.11%
Amphibians/Reptiles 342,471 0.72% 153,371 0.29% 348,854 0.58% 431,625 0.63% 431,113 0.66%
Predatory Birds 1,782 0.00% 1,234 0.00% 3,685 0.01% 9,078 0.01% 6,767 0.01%
Peregrine Falcon 30,092 0.06% 30,089 0.06% 83,310 0.14% 30,446 0.04% 36,583 0.06%
Bald Eagle 23,210 0.05% 40,138 0.08% 35,472 0.06% 24,797 0.04% 17,686 0.03%
Black-Footed Ferret 241,312 0.51% 158,585 0.30% 274,268 0.46% 137,172 0.20% 178,179 0.27%
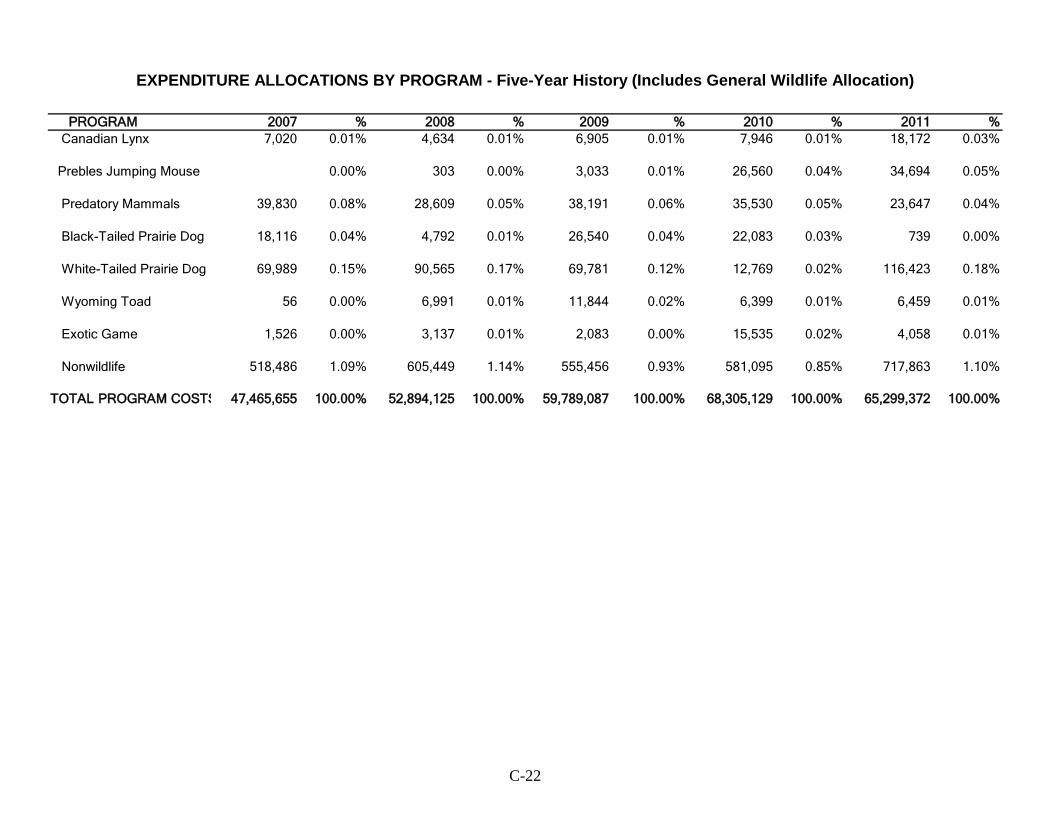
EXPENDITURE ALLOCATIONS BY PROGRAM - Five-Year History (Includes General Wildlife Allocation)
C-22
PROGRAM 2007 % 2008 % 2009 % 2010 % 2011 % Canadian Lynx 7,020 0.01% 4,634 0.01% 6,905 0.01% 7,946 0.01% 18,172 0.03%
Prebles Jumping Mouse 0.00% 303 0.00% 3,033 0.01% 26,560 0.04% 34,694 0.05%
Predatory Mammals 39,830 0.08% 28,609 0.05% 38,191 0.06% 35,530 0.05% 23,647 0.04%
Black-Tailed Prairie Dog 18,116 0.04% 4,792 0.01% 26,540 0.04% 22,083 0.03% 739 0.00%
White-Tailed Prairie Dog 69,989 0.15% 90,565 0.17% 69,781 0.12% 12,769 0.02% 116,423 0.18%
Wyoming Toad 56 0.00% 6,991 0.01% 11,844 0.02% 6,399 0.01% 6,459 0.01%
Exotic Game 1,526 0.00% 3,137 0.01% 2,083 0.00% 15,535 0.02% 4,058 0.01%
Nonwildlife 518,486 1.09% 605,449 1.14% 555,456 0.93% 581,095 0.85% 717,863 1.10%
TOTAL PROGRAM COSTS 47,465,655 100.00% 52,894,125 100.00% 59,789,087 100.00% 68,305,129 100.00% 65,299,372 100.00%
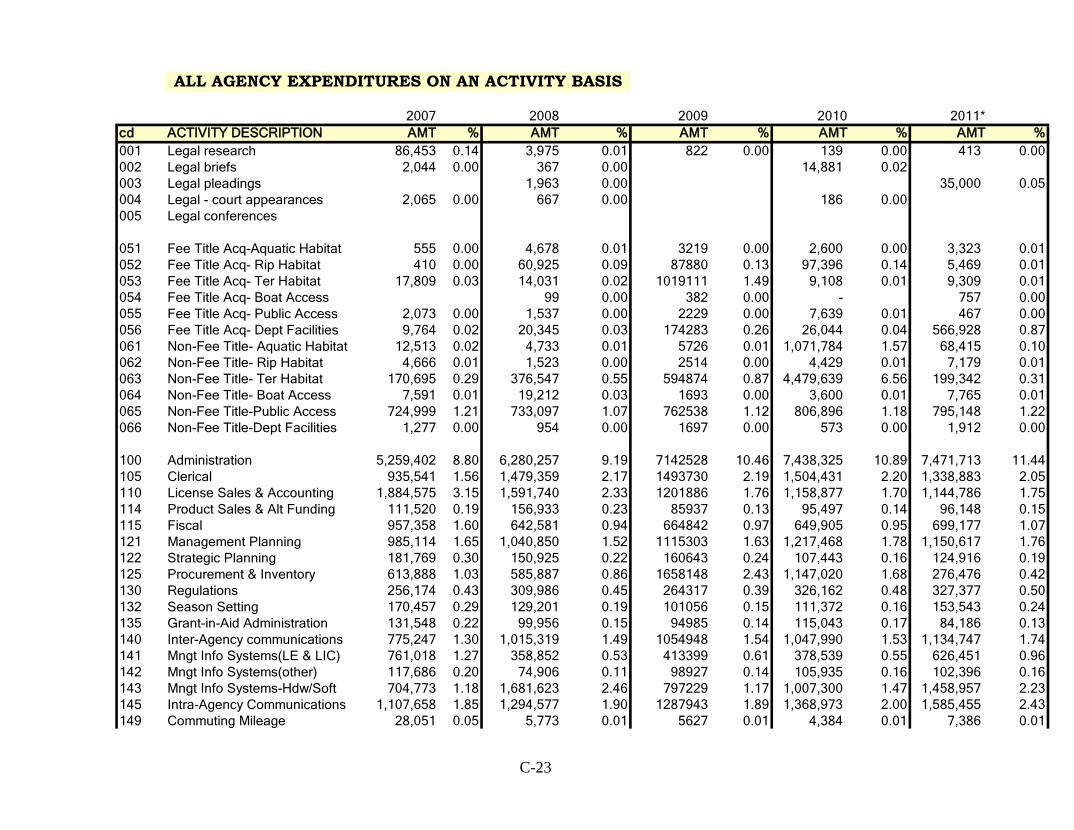
C-23
ALL AGENCY EXPENDITURES ON AN ACTIVITY BASIS
2007 2008 2009 2010 2011*cd ACTIVITY DESCRIPTION AMT % AMT % AMT % AMT % AMT %001 Legal research 86,453 0.14 3,975 0.01 822 0.00 139 0.00 413 0.00002 Legal briefs 2,044 0.00 367 0.00 14,881 0.02003 Legal pleadings 1,963 0.00 35,000 0.05004 Legal - court appearances 2,065 0.00 667 0.00 186 0.00005 Legal conferences
051 Fee Title Acq-Aquatic Habitat 555 0.00 4,678 0.01 3219 0.00 2,600 0.00 3,323 0.01052 Fee Title Acq- Rip Habitat 410 0.00 60,925 0.09 87880 0.13 97,396 0.14 5,469 0.01053 Fee Title Acq- Ter Habitat 17,809 0.03 14,031 0.02 1019111 1.49 9,108 0.01 9,309 0.01054 Fee Title Acq- Boat Access 99 0.00 382 0.00 - 757 0.00055 Fee Title Acq- Public Access 2,073 0.00 1,537 0.00 2229 0.00 7,639 0.01 467 0.00056 Fee Title Acq- Dept Facilities 9,764 0.02 20,345 0.03 174283 0.26 26,044 0.04 566,928 0.87061 Non-Fee Title- Aquatic Habitat 12,513 0.02 4,733 0.01 5726 0.01 1,071,784 1.57 68,415 0.10062 Non-Fee Title- Rip Habitat 4,666 0.01 1,523 0.00 2514 0.00 4,429 0.01 7,179 0.01063 Non-Fee Title- Ter Habitat 170,695 0.29 376,547 0.55 594874 0.87 4,479,639 6.56 199,342 0.31064 Non-Fee Title- Boat Access 7,591 0.01 19,212 0.03 1693 0.00 3,600 0.01 7,765 0.01065 Non-Fee Title-Public Access 724,999 1.21 733,097 1.07 762538 1.12 806,896 1.18 795,148 1.22066 Non-Fee Title-Dept Facilities 1,277 0.00 954 0.00 1697 0.00 573 0.00 1,912 0.00
100 Administration 5,259,402 8.80 6,280,257 9.19 7142528 10.46 7,438,325 10.89 7,471,713 11.44105 Clerical 935,541 1.56 1,479,359 2.17 1493730 2.19 1,504,431 2.20 1,338,883 2.05110 License Sales & Accounting 1,884,575 3.15 1,591,740 2.33 1201886 1.76 1,158,877 1.70 1,144,786 1.75114 Product Sales & Alt Funding 111,520 0.19 156,933 0.23 85937 0.13 95,497 0.14 96,148 0.15115 Fiscal 957,358 1.60 642,581 0.94 664842 0.97 649,905 0.95 699,177 1.07121 Management Planning 985,114 1.65 1,040,850 1.52 1115303 1.63 1,217,468 1.78 1,150,617 1.76122 Strategic Planning 181,769 0.30 150,925 0.22 160643 0.24 107,443 0.16 124,916 0.19125 Procurement & Inventory 613,888 1.03 585,887 0.86 1658148 2.43 1,147,020 1.68 276,476 0.42130 Regulations 256,174 0.43 309,986 0.45 264317 0.39 326,162 0.48 327,377 0.50132 Season Setting 170,457 0.29 129,201 0.19 101056 0.15 111,372 0.16 153,543 0.24135 Grant-in-Aid Administration 131,548 0.22 99,956 0.15 94985 0.14 115,043 0.17 84,186 0.13140 Inter-Agency communications 775,247 1.30 1,015,319 1.49 1054948 1.54 1,047,990 1.53 1,134,747 1.74141 Mngt Info Systems(LE & LIC) 761,018 1.27 358,852 0.53 413399 0.61 378,539 0.55 626,451 0.96142 Mngt Info Systems(other) 117,686 0.20 74,906 0.11 98927 0.14 105,935 0.16 102,396 0.16143 Mngt Info Systems-Hdw/Soft 704,773 1.18 1,681,623 2.46 797229 1.17 1,007,300 1.47 1,458,957 2.23145 Intra-Agency Communications 1,107,658 1.85 1,294,577 1.90 1287943 1.89 1,368,973 2.00 1,585,455 2.43149 Commuting Mileage 28,051 0.05 5,773 0.01 5627 0.01 4,384 0.01 7,386 0.01
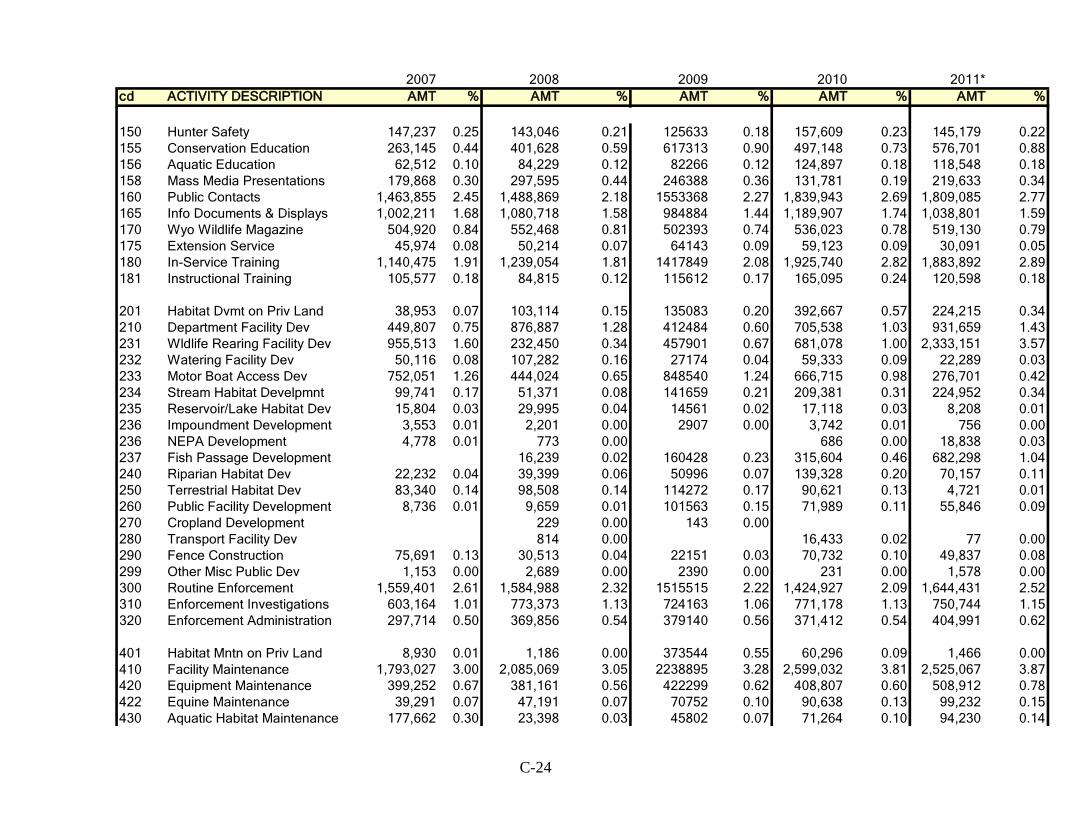
C-24
2007 2008 2009 2010 2011*cd ACTIVITY DESCRIPTION AMT % AMT % AMT % AMT % AMT %
150 Hunter Safety 147,237 0.25 143,046 0.21 125633 0.18 157,609 0.23 145,179 0.22155 Conservation Education 263,145 0.44 401,628 0.59 617313 0.90 497,148 0.73 576,701 0.88156 Aquatic Education 62,512 0.10 84,229 0.12 82266 0.12 124,897 0.18 118,548 0.18158 Mass Media Presentations 179,868 0.30 297,595 0.44 246388 0.36 131,781 0.19 219,633 0.34160 Public Contacts 1,463,855 2.45 1,488,869 2.18 1553368 2.27 1,839,943 2.69 1,809,085 2.77165 Info Documents & Displays 1,002,211 1.68 1,080,718 1.58 984884 1.44 1,189,907 1.74 1,038,801 1.59170 Wyo Wildlife Magazine 504,920 0.84 552,468 0.81 502393 0.74 536,023 0.78 519,130 0.79175 Extension Service 45,974 0.08 50,214 0.07 64143 0.09 59,123 0.09 30,091 0.05180 In-Service Training 1,140,475 1.91 1,239,054 1.81 1417849 2.08 1,925,740 2.82 1,883,892 2.89181 Instructional Training 105,577 0.18 84,815 0.12 115612 0.17 165,095 0.24 120,598 0.18
201 Habitat Dvmt on Priv Land 38,953 0.07 103,114 0.15 135083 0.20 392,667 0.57 224,215 0.34210 Department Facility Dev 449,807 0.75 876,887 1.28 412484 0.60 705,538 1.03 931,659 1.43231 Wldlife Rearing Facility Dev 955,513 1.60 232,450 0.34 457901 0.67 681,078 1.00 2,333,151 3.57232 Watering Facility Dev 50,116 0.08 107,282 0.16 27174 0.04 59,333 0.09 22,289 0.03233 Motor Boat Access Dev 752,051 1.26 444,024 0.65 848540 1.24 666,715 0.98 276,701 0.42234 Stream Habitat Develpmnt 99,741 0.17 51,371 0.08 141659 0.21 209,381 0.31 224,952 0.34235 Reservoir/Lake Habitat Dev 15,804 0.03 29,995 0.04 14561 0.02 17,118 0.03 8,208 0.01236 Impoundment Development 3,553 0.01 2,201 0.00 2907 0.00 3,742 0.01 756 0.00236 NEPA Development 4,778 0.01 773 0.00 686 0.00 18,838 0.03237 Fish Passage Development 16,239 0.02 160428 0.23 315,604 0.46 682,298 1.04240 Riparian Habitat Dev 22,232 0.04 39,399 0.06 50996 0.07 139,328 0.20 70,157 0.11250 Terrestrial Habitat Dev 83,340 0.14 98,508 0.14 114272 0.17 90,621 0.13 4,721 0.01260 Public Facility Development 8,736 0.01 9,659 0.01 101563 0.15 71,989 0.11 55,846 0.09270 Cropland Development 229 0.00 143 0.00280 Transport Facility Dev 814 0.00 16,433 0.02 77 0.00290 Fence Construction 75,691 0.13 30,513 0.04 22151 0.03 70,732 0.10 49,837 0.08299 Other Misc Public Dev 1,153 0.00 2,689 0.00 2390 0.00 231 0.00 1,578 0.00300 Routine Enforcement 1,559,401 2.61 1,584,988 2.32 1515515 2.22 1,424,927 2.09 1,644,431 2.52310 Enforcement Investigations 603,164 1.01 773,373 1.13 724163 1.06 771,178 1.13 750,744 1.15320 Enforcement Administration 297,714 0.50 369,856 0.54 379140 0.56 371,412 0.54 404,991 0.62
401 Habitat Mntn on Priv Land 8,930 0.01 1,186 0.00 373544 0.55 60,296 0.09 1,466 0.00410 Facility Maintenance 1,793,027 3.00 2,085,069 3.05 2238895 3.28 2,599,032 3.81 2,525,067 3.87420 Equipment Maintenance 399,252 0.67 381,161 0.56 422299 0.62 408,807 0.60 508,912 0.78422 Equine Maintenance 39,291 0.07 47,191 0.07 70752 0.10 90,638 0.13 99,232 0.15430 Aquatic Habitat Maintenance 177,662 0.30 23,398 0.03 45802 0.07 71,264 0.10 94,230 0.14
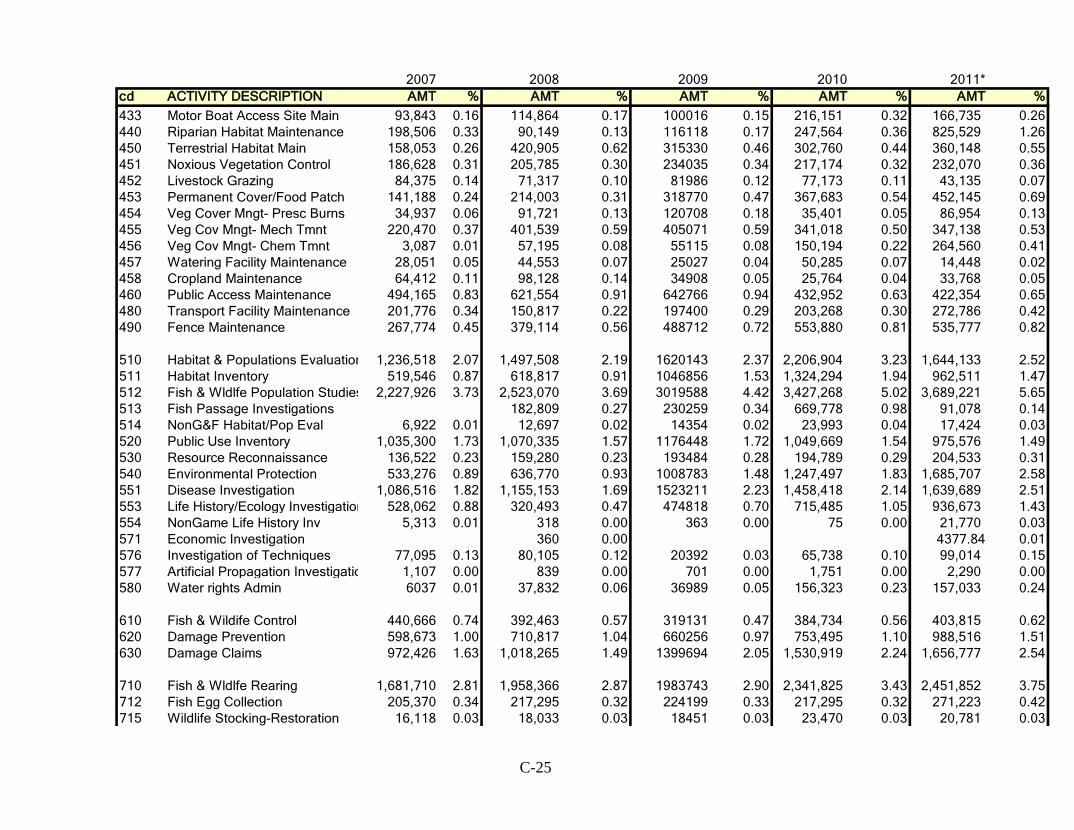
C-25
2007 2008 2009 2010 2011*cd ACTIVITY DESCRIPTION AMT % AMT % AMT % AMT % AMT %433 Motor Boat Access Site Main 93,843 0.16 114,864 0.17 100016 0.15 216,151 0.32 166,735 0.26440 Riparian Habitat Maintenance 198,506 0.33 90,149 0.13 116118 0.17 247,564 0.36 825,529 1.26450 Terrestrial Habitat Main 158,053 0.26 420,905 0.62 315330 0.46 302,760 0.44 360,148 0.55451 Noxious Vegetation Control 186,628 0.31 205,785 0.30 234035 0.34 217,174 0.32 232,070 0.36452 Livestock Grazing 84,375 0.14 71,317 0.10 81986 0.12 77,173 0.11 43,135 0.07453 Permanent Cover/Food Patch 141,188 0.24 214,003 0.31 318770 0.47 367,683 0.54 452,145 0.69454 Veg Cover Mngt- Presc Burns 34,937 0.06 91,721 0.13 120708 0.18 35,401 0.05 86,954 0.13455 Veg Cov Mngt- Mech Tmnt 220,470 0.37 401,539 0.59 405071 0.59 341,018 0.50 347,138 0.53456 Veg Cov Mngt- Chem Tmnt 3,087 0.01 57,195 0.08 55115 0.08 150,194 0.22 264,560 0.41457 Watering Facility Maintenance 28,051 0.05 44,553 0.07 25027 0.04 50,285 0.07 14,448 0.02458 Cropland Maintenance 64,412 0.11 98,128 0.14 34908 0.05 25,764 0.04 33,768 0.05460 Public Access Maintenance 494,165 0.83 621,554 0.91 642766 0.94 432,952 0.63 422,354 0.65480 Transport Facility Maintenance 201,776 0.34 150,817 0.22 197400 0.29 203,268 0.30 272,786 0.42490 Fence Maintenance 267,774 0.45 379,114 0.56 488712 0.72 553,880 0.81 535,777 0.82
510 Habitat & Populations Evaluation 1,236,518 2.07 1,497,508 2.19 1620143 2.37 2,206,904 3.23 1,644,133 2.52511 Habitat Inventory 519,546 0.87 618,817 0.91 1046856 1.53 1,324,294 1.94 962,511 1.47512 Fish & Wldlfe Population Studies 2,227,926 3.73 2,523,070 3.69 3019588 4.42 3,427,268 5.02 3,689,221 5.65513 Fish Passage Investigations 182,809 0.27 230259 0.34 669,778 0.98 91,078 0.14514 NonG&F Habitat/Pop Eval 6,922 0.01 12,697 0.02 14354 0.02 23,993 0.04 17,424 0.03520 Public Use Inventory 1,035,300 1.73 1,070,335 1.57 1176448 1.72 1,049,669 1.54 975,576 1.49530 Resource Reconnaissance 136,522 0.23 159,280 0.23 193484 0.28 194,789 0.29 204,533 0.31540 Environmental Protection 533,276 0.89 636,770 0.93 1008783 1.48 1,247,497 1.83 1,685,707 2.58551 Disease Investigation 1,086,516 1.82 1,155,153 1.69 1523211 2.23 1,458,418 2.14 1,639,689 2.51553 Life History/Ecology Investigation 528,062 0.88 320,493 0.47 474818 0.70 715,485 1.05 936,673 1.43554 NonGame Life History Inv 5,313 0.01 318 0.00 363 0.00 75 0.00 21,770 0.03571 Economic Investigation 360 0.00 4377.84 0.01576 Investigation of Techniques 77,095 0.13 80,105 0.12 20392 0.03 65,738 0.10 99,014 0.15577 Artificial Propagation Investigatio 1,107 0.00 839 0.00 701 0.00 1,751 0.00 2,290 0.00580 Water rights Admin 6037 0.01 37,832 0.06 36989 0.05 156,323 0.23 157,033 0.24
610 Fish & Wildife Control 440,666 0.74 392,463 0.57 319131 0.47 384,734 0.56 403,815 0.62620 Damage Prevention 598,673 1.00 710,817 1.04 660256 0.97 753,495 1.10 988,516 1.51630 Damage Claims 972,426 1.63 1,018,265 1.49 1399694 2.05 1,530,919 2.24 1,656,777 2.54
710 Fish & Wldlfe Rearing 1,681,710 2.81 1,958,366 2.87 1983743 2.90 2,341,825 3.43 2,451,852 3.75712 Fish Egg Collection 205,370 0.34 217,295 0.32 224199 0.33 217,295 0.32 271,223 0.42715 Wildlife Stocking-Restoration 16,118 0.03 18,033 0.03 18451 0.03 23,470 0.03 20,781 0.03
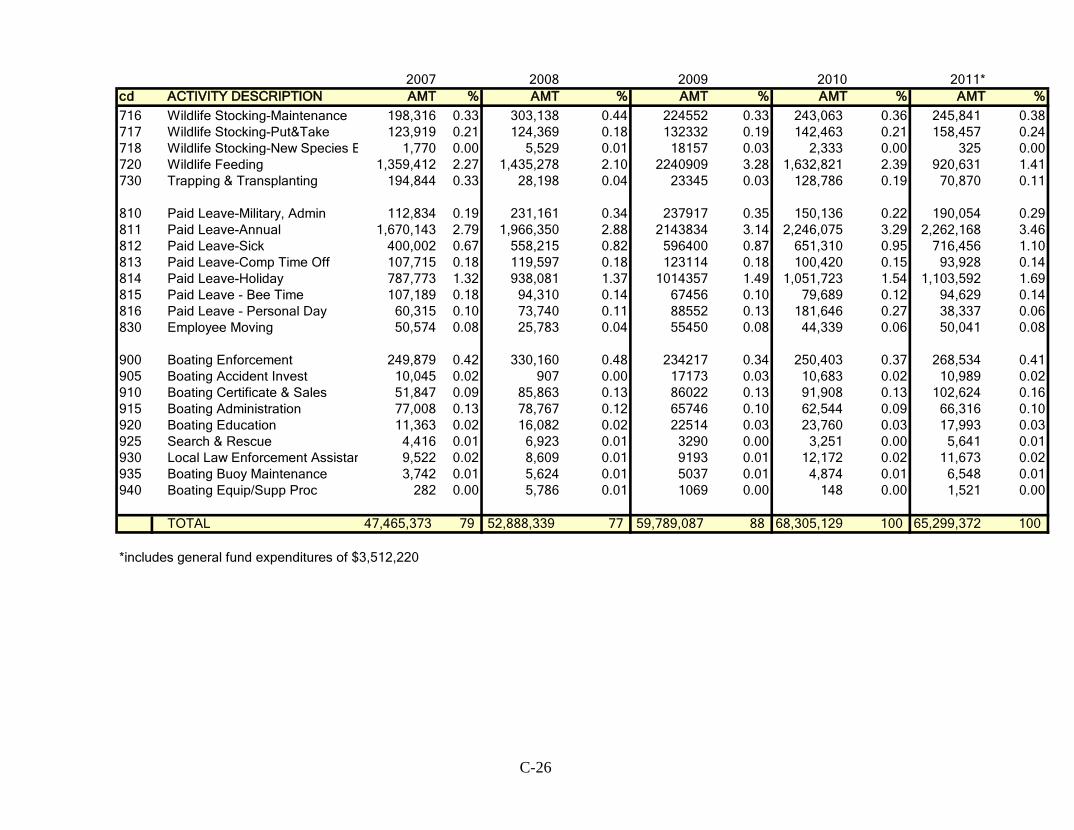
C-26
2007 2008 2009 2010 2011*cd ACTIVITY DESCRIPTION AMT % AMT % AMT % AMT % AMT %716 Wildlife Stocking-Maintenance 198,316 0.33 303,138 0.44 224552 0.33 243,063 0.36 245,841 0.38717 Wildlife Stocking-Put&Take 123,919 0.21 124,369 0.18 132332 0.19 142,463 0.21 158,457 0.24718 Wildlife Stocking-New Species E 1,770 0.00 5,529 0.01 18157 0.03 2,333 0.00 325 0.00720 Wildlife Feeding 1,359,412 2.27 1,435,278 2.10 2240909 3.28 1,632,821 2.39 920,631 1.41730 Trapping & Transplanting 194,844 0.33 28,198 0.04 23345 0.03 128,786 0.19 70,870 0.11
810 Paid Leave-Military, Admin 112,834 0.19 231,161 0.34 237917 0.35 150,136 0.22 190,054 0.29811 Paid Leave-Annual 1,670,143 2.79 1,966,350 2.88 2143834 3.14 2,246,075 3.29 2,262,168 3.46812 Paid Leave-Sick 400,002 0.67 558,215 0.82 596400 0.87 651,310 0.95 716,456 1.10813 Paid Leave-Comp Time Off 107,715 0.18 119,597 0.18 123114 0.18 100,420 0.15 93,928 0.14814 Paid Leave-Holiday 787,773 1.32 938,081 1.37 1014357 1.49 1,051,723 1.54 1,103,592 1.69815 Paid Leave - Bee Time 107,189 0.18 94,310 0.14 67456 0.10 79,689 0.12 94,629 0.14816 Paid Leave - Personal Day 60,315 0.10 73,740 0.11 88552 0.13 181,646 0.27 38,337 0.06830 Employee Moving 50,574 0.08 25,783 0.04 55450 0.08 44,339 0.06 50,041 0.08
900 Boating Enforcement 249,879 0.42 330,160 0.48 234217 0.34 250,403 0.37 268,534 0.41905 Boating Accident Invest 10,045 0.02 907 0.00 17173 0.03 10,683 0.02 10,989 0.02910 Boating Certificate & Sales 51,847 0.09 85,863 0.13 86022 0.13 91,908 0.13 102,624 0.16915 Boating Administration 77,008 0.13 78,767 0.12 65746 0.10 62,544 0.09 66,316 0.10920 Boating Education 11,363 0.02 16,082 0.02 22514 0.03 23,760 0.03 17,993 0.03925 Search & Rescue 4,416 0.01 6,923 0.01 3290 0.00 3,251 0.00 5,641 0.01930 Local Law Enforcement Assistan 9,522 0.02 8,609 0.01 9193 0.01 12,172 0.02 11,673 0.02935 Boating Buoy Maintenance 3,742 0.01 5,624 0.01 5037 0.01 4,874 0.01 6,548 0.01940 Boating Equip/Supp Proc 282 0.00 5,786 0.01 1069 0.00 148 0.00 1,521 0.00
TOTAL 47,465,373 79 52,888,339 77 59,789,087 88 68,305,129 100 65,299,372 100
*includes general fund expenditures of $3,512,220
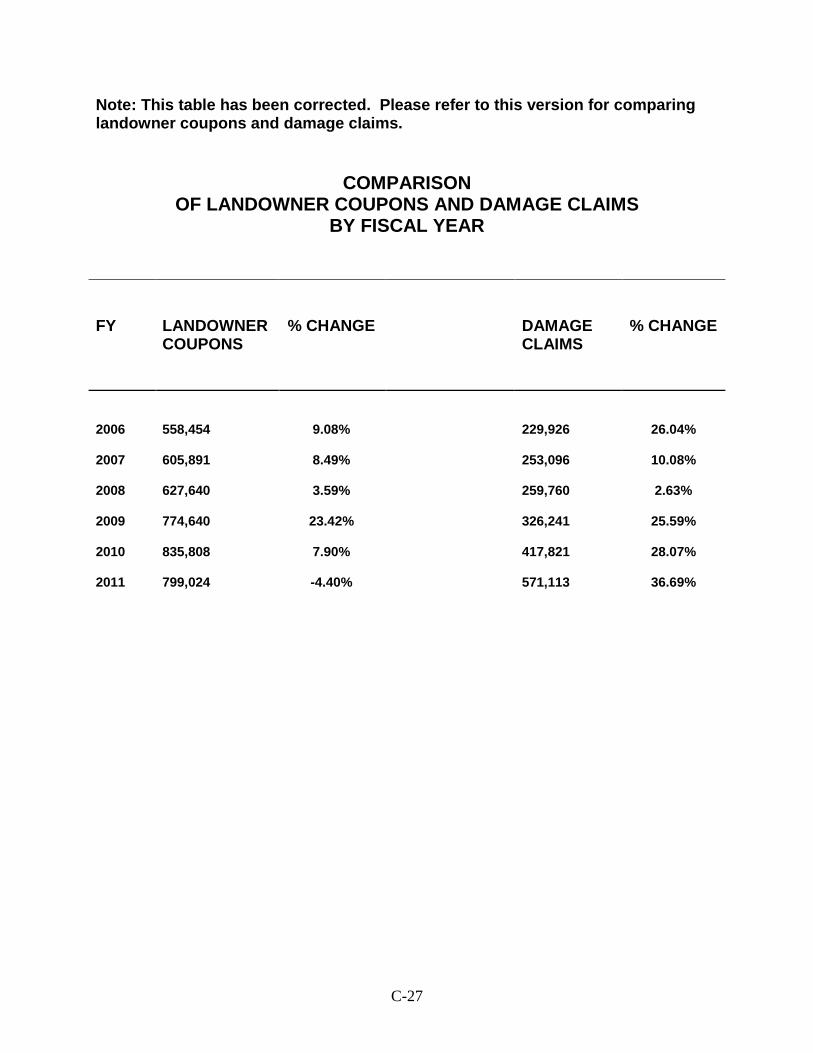
C-27
Note: This table has been corrected. Please refer to this version for comparing landowner coupons and damage claims.
COMPARISON
OF LANDOWNER COUPONS AND DAMAGE CLAIMS BY FISCAL YEAR
FY LANDOWNER
COUPONS % CHANGE DAMAGE
CLAIMS % CHANGE
2006 558,454 9.08% 229,926 26.04% 2007 605,891 8.49% 253,096 10.08% 2008 627,640 3.59% 259,760 2.63% 2009 774,640 23.42% 326,241 25.59% 2010 835,808 7.90% 417,821 28.07% 2011 799,024 -4.40% 571,113 36.69%
REFERENCES Responsive Management. 1998. Wyoming 1997 hunting expenditures. Wyoming Game
and Fish Department. Responsive Management, Harrisonburg, VA. _____. 2001. Wyoming small game/upland game bird expenditure survey. Wyoming
Game and Fish Department. Responsive Management, Harrisonburg, VA. _____. 2002. Hunting and trapping expenditures in Wyoming during the 2001 season.
Wyoming Game and Fish Department. Responsive Management, Harrisonburg, VA.
_____. 2004. Wyoming resident and nonresident deer, elk, and antelope hunter
expenditure survey. Wyoming Game and Fish Department. Responsive Management, Harrisonburg, VA.
University of Wyoming, Department of Geography and Recreation. 1990. Hunting and
fishing expenditure estimates for Wyoming, 1989. Wyoming Game and Fish Department. Department of Geography and Recreation. 141 pp.
2008 U.S. Department of the Interior, Fish and Wildlife Service and U.S. Department of
Commerce, U.S. Census Bureau. 2006 National Survey of Fishing, Hunting, and Wildlife-Associated Recreation: Wyoming. 91 pp.
Wyoming Game and Fish Department 2010 Job Completion Reports. _____. 2010 License Sales Data. _____. 2011. 2010 Annual Report of Big and Trophy Game Harvest. 311 pp. _____. 2011. 2010 Annual Report of Small and Upland Game Harvest. 116 pp. Wyoming Game and Fish Department 2011 Internal Client Satisfaction Survey Report. Wyoming Game and Fish Department 2011 External Strategic Plan Survey Report.