Embed Size (px)
Citation preview

The Trichonis Lake Seismogenic Zone (W. Greece). Detailed Investigation Derived by Relocation of the Locally Recorded April-June 2007 Swarm and Inversion of Focal Mechanisms
I. Kassaras, V. Kapetanidis, G. Kaviris, A. Karakonstantis, A. Moshou,
P. Papadimitriou, N. Voulgaris, K. Makropoulos, G. Papadopoulos
UNIVERSITY OF ATHENS Faculty of Geology & GeoenvironmentDepartment of Geophysics and Geothermics

INTRODUCTION
ESC 2012, 33rd General Assembly, Moscow, 19-24 August 2012
• The strongest events reported in the area are an intermediate depth event (M=6.8) striking the city of Agrinio in 1965 and the 31 December 1975 (M=6.0) earthquake located 3 km SE of Trichonis lake.
• Trichonis is the largest natural lake in Greece. It lies between Amvrakikos gulf to the north and Patras and Corinth gulfs to the south, striking almost parallel to them.
Main tectonic features are from Sorel (1989), Waters (1993), Doutsos et al. (1987), Lekkas and Papanikolaou (1997). Epicenters of historical (Papazachos and Papazachou, 2003) and instrumental earthquakes (since 1900, Ms≥4.0, Makropoulos et al., 2012) are represented with yellow and red stars, respectively. Focal mechanisms are for events with Mw≥5.5.
• On April 10, 2007 three shallow earthquakes of Mw=5.0-5.2 took place in the area of Trichonis lake. One day after, an array of 12 portable 3-component stations was deployed around the epicentral area for three months.

LOCATIONS
ESC 2012, 33rd General Assembly, Moscow, 19-24 August 2012
• 1640 hypocenter locations were obtained using HYPOINVERSE and a 1-D velocity model, determined using the average traveltime residuals and the location uncertainties minimization method.
RELOCATIONS
ESC 2012, 33rd General Assembly, Moscow, 19-24 August 2012
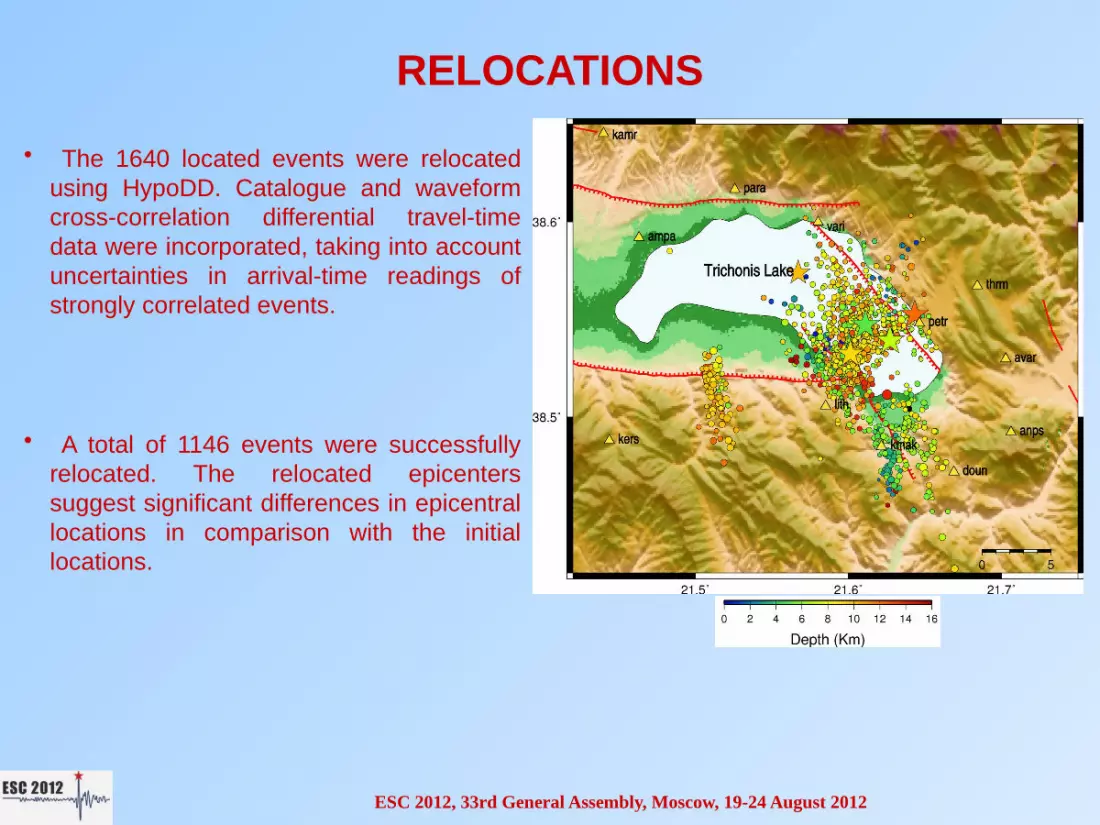
• The 1640 located events were relocated using HypoDD. Catalogue and waveform cross-correlation differential travel-time data were incorporated, taking into account uncertainties in arrival-time readings of strongly correlated events.
• A total of 1146 events were successfully relocated. The relocated epicenters suggest significant differences in epicentral locations in comparison with the initial locations.

ESC 2012, 33rd General Assembly, Moscow, 19-24 August 2012
• The hypocentral cross-sections, perpendicular to the major tectonic structures show the tight clustering of aftershocks after the relocation procedure. Deeper foci do not exceed 16 km depth.
(a) Cross-section of aftershocks at N50°E (SSW-NNE), centered at 38.48°N, 21.48°E, before relocation with HypoDD. (b) the same as (a) after relocation with HypoDD.
RELOCATIONS

FAULT PLANE SOLUTIONS (A)
ESC 2012, 33rd General Assembly, Moscow, 19-24 August 2012
• 136 focal mechanisms were determined in total.
• 131 fault plane solutions were constrained using P-wave first-motion polarities with less than ~10° uncertainty for the nodal planes.
• The source parameters of the 5 largest events were calculated using regional moment tensor inversion.
• The types of the obtained focal mechanisms are predominantly normal and strike-slip, however some earthquakes exhibit reverse faulting.

FAULT PLANE SOLUTIONS (B)
ESC 2012, 33rd General Assembly, Moscow, 19-24 August 2012
• The vertical distribution of focal mechanisms is presented along cross-sections constructed perpendicular to the strike of major fault zones. Three fault zones are clearly identified (F-1, F-2, F-3).
• The westernmost zone is an extensional structure parallel to the strike of Hellenides (cross-section BB’, fault F-2). This extensional structure provides new evidence for the area and has not been reported or even mentioned in previous seismicity studies.
Hypocenter and focal mechanisms cross-sections along SW-NE (N50°) profiles AA’, BB’, CC’, DD’. The size of beachballs is proportional to the magnitude. Large events are excluded due to their location uncertainty. Normal and reverse focal mechanisms are projected as strike-slip mechanisms. Dextral and sinistral strike-slip mechanisms are projected as normal and reverse mechanisms, respectively. Green lines indicate the inferred fault planes, which are named F-1, F-2 and F-3.

ESC 2012, 33rd General Assembly, Moscow, 19-24 August 2012
• To the east, the deformation pattern is more complex and two antithetic zones are identified. In cross-section AA’, south of the lake, a normal fault is depicted, striking NW-SE and dipping NE. To the north it becomes progressively left lateral strike-slip and reverse/thrust at its northernmost activated tip (CC’, DD’, fault F-1). The surface fault trace should be located ~7km SW of the southern margin of the lake.
• A relative pattern is seen for the antithetic NW-SE striking and SW dipping fault, for which focal mechanisms indicate normal faulting down to 6 km depth and a right lateral strike-slip fault between 6 and 10 km depth (cross-section CC’, fault F-3). Extrapolation of aftershocks indicates that the surface fault trace should be located about 4 km NE of the northern margin of the lake, within Pindos thrust and fold belt.
Hypocenter and focal mechanisms cross-sections along SW-NE (N50°) profiles AA’, BB’, CC’, DD’. The size of beachballs is proportional to the magnitude. Large events are excluded due to their location uncertainty. Normal and reverse focal mechanisms are projected as strike-slip mechanisms. Dextral and sinistral strike-slip mechanisms are projected as normal and reverse mechanisms, respectively. Green lines indicate the inferred fault planes, which are named F-1, F-2 and F-3.
FAULT PLANE SOLUTIONS (C)

STRESS TENSOR INVERSION (A)
ESC 2012, 33rd General Assembly, Moscow, 19-24 August 2012
• A stress tensor inversion method was applied to the determined focal mechanisms to produce a local scale model of stress orientation.
• The area was divided into three subareas. Figures show the distribution of P, T-axes, azimuth and dip. Highest homogeneity is observed in subareas 1 and 2, south of the Lake.
Orientation of P and T axes of focal mechanisms located in areas 1, 2 and 3. Black lines in (a) and (d) indicate the strike of P and T axes. Dip angles are shown in (b) and (e) for P and T axes. Arrows show the average dip angle. The length of arrows is proportional to the observations homogeneity. Azimuths are shown in (c) and (f) for P and T axes.

STRESS TENSOR INVERSION (A)
ESC 2012, 33rd General Assembly, Moscow, 19-24 August 2012
• The stress field in subarea 3, beneath the lake appears complex. The overall pattern indicates almost horizontal P and T axes, characteristic of oblique lateral deformation. Higher dip values of P axes imply that extensional deformation slightly prevails. The overall directions of P and T axes differ by almost 180°, indicative for antithetic faults.
Orientation of P and T axes of focal mechanisms located in areas 1, 2 and 3. Black lines in (a) and (d) indicate the strike of P and T axes. Dip angles are shown in (b) and (e) for P and T axes. Arrows show the average dip angle. The length of arrows is proportional to the observations homogeneity. Azimuths are shown in (c) and (f) for P and T axes.

STRESS TENSOR INVERSION (B)
ESC 2012, 33rd General Assembly, Moscow, 19-24 August 2012
• Damped iterative inversion of the three subsets of focal mechanisms was performed. • Stress parameters were determined for 15 nodes. The orientation of the minimum principal
stress (σ3) is very similar to each other at all nodes in subareas 1 and 2: The σ3 trends from almost perpendicular to the major tectonic structures and dips nearly horizontally. The azimuth of the maximum principal stress (σ1) is quite uniform in subarea 1. In subarea 2 (node (0,0)) the azimuth appears almost N-S, fact that could be attributed to the deeper foci location, probably indicating some brittle-ductile interaction.
Inverted maximum and minimum principal stress (σ1 and σ3) in subareas 1, 2 and 3. Red and blue arrows indicate the azimuth of σ1 and σ3 at grid points centered at rectangles. The length of stress vectors is reversely proportional to the dip of σ1 and σ3. Numbers at the bottom of each rectangle indicate the coordinates of the grid point and the number of focal mechanisms used for stress tensor inversion. Numbers at the top indicate the depth range of focal mechanisms.

STRESS TENSOR INVERSION (B)
ESC 2012, 33rd General Assembly, Moscow, 19-24 August 2012
• In subarea 3, beneath the lake, the stress field appears reverse. Despite the variable type of faulting, the direction of the principal horizontal axis σ3 is fixed to an average NW-SE direction. East, σ3
is striking almost perpendicular to the NW-SE major tectonic structures. The strike and dip of the maximum principal stress component σ1 appears quite homogeneous. West, σ1 is perpendicular to the NW-SE major tectonic structures.
• Best constrained stress ratios R in nodes are close to unity, showing that σ2≈σ3. It is likely to assume that vertical stress is close to the overburden load; hence topography is probably the driving force for the observed diversity beneath the lake. At the central part of the lake, R≈0.5, showing that compressional equals extensional stress.
Inverted maximum and minimum principal stress (σ1 and σ3) in subareas 1, 2 and 3. Red and blue arrows indicate the azimuth of σ1 and σ3 at grid points centered at rectangles. The length of stress vectors is reversely proportional to the dip of σ1 and σ3. Numbers at the bottom of each rectangle indicate the coordinates of the grid point and the number of focal mechanisms used for stress tensor inversion. Numbers at the top indicate the depth range of focal mechanisms.

STRESS TENSOR INVERSION (B)
ESC 2012, 33rd General Assembly, Moscow, 19-24 August 2012
• The prevailing horizontal component of the stress field in the study area is extensional, with its largest magnitude observed onshore. South and NE of the lake, σ3 is striking NE-SW, which is compatible both with the direction of the velocity field obtained by GPS measurements in the area and the strain direction observed is furthermore compatible strain direction observed throughout the internal Hellenic Arc. Beneath the lake the maximum horizontal components σ1 and σ3 are striking NW-SE, rotated by ~90°. It is assumed that this abrupt change of the stress field orientation is a local effect resulted by stress relaxation due to reduction of vertical forces hosted beneath low topography.

CONCLUSIONS (A)
ESC 2012, 33rd General Assembly, Moscow, 19-24 August 2012
• The installation of a temporary dense local network following the occurrence of three moderate earthquakes provided for the first time a large amount of high quality local digital recordings in Trichonis Lake Seismogenic Zone.
• Approximately 2000 aftershocks were located with HYPOINVERSE. An optimum velocity model which minimized location errors was derived, yielding 1640 confident hypocentral solutions in terms of uncertainty and misfit.
• Double difference relocation using both waveform and catalogue data provided 1146 hypocentral locations improved by the order of one magnitude.

CONCLUSIONS (B)
ESC 2012, 33rd General Assembly, Moscow, 19-24 August 2012
• The spatial distribution of the relocated aftershocks reveals that this zone is the one activated in 1975, with the activation of three structures, striking NW-SE.
• Evidence exists for the activation of the deeper part of the south dipping marginal normal fault, about 20 days after the beginning of the sequence.
• The second activated structure is parallel, dipping south. Its trace should be north of the lake.
• The third larger scale structure is antithetic, dipping NE. It is suggested, in agreement with Kiratzi et al. (2008), that this is the fault that generated the 1975 and 2007 sequences.
• However, in contradiction with the previous authors, it is inferred that this is not the normal fault that bounds the south-eastern bank of the lake but a parallel fault located approximately 7 km SW.
CONCLUSIONS (C)
ESC 2012, 33rd General Assembly, Moscow, 19-24 August 2012
• Focal mechanisms determined by regional body wave modeling and P-wave first motion data are predominantly normal, however, strike-slip and reverse type focal mechanisms are observed, indicating substantial deformation of the upper crust.
• South and north of the lake, focal mechanisms imply NW-SE normal faulting on antithetic planes.
• Dextral and sinistral oblique slip, strike-slip and reverse faulting are observed beneath the lake on two antithetic planes.
• The SW dipping structure is characterized by normal (shallow) and dextral strike-slip (deep part) faulting in NW-SE direction.
• The south part of the predominant antithetic NW-SE striking and NE dipping plane, which likely produced the 2007 sequence, is characterized by pure normal faulting, its middle part by dextral oblique and strike-slip faulting and its north tip by pure reverse faulting.

CONCLUSIONS (D)
ESC 2012, 33rd General Assembly, Moscow, 19-24 August 2012
• Without regard to faulting type, the averaged directions of prevailing compressional (P) and extensional (T) axes are rather uniform.
• South and north of the lake, where extension dominates, T-axis is striking ~N220°.
• Beneath the lake complexity occurs. Inversion of the obtained focal mechanisms provided spatial variations of the stress field, compatible with regional kinematics. The stress field appears rotated by 90° beneath the lake.
• Topography seems to play a key role for the local scale deformation, as homogeneous focal mechanisms, compatible with the tectonics stress field, are observed onshore (high topography), while diverse focal mechanisms and reversed stress field is observed offshore (low topography).

CONCLUSIONS (E)
ESC 2012, 33rd General Assembly, Moscow, 19-24 August 2012
• Concerning the 2007 deformation pattern, extension is predominant and only locally beneath the lake horizontal or compressional deformation occurs, generating an anticlockwise rotation of the volume enclosed by the antithetic faults.
• None of the E-W trending structures was activated during the swarm.
• The SE trending regional velocity field is compatible with the inferred structures, predicting extensional or left-lateral deformation hosted in NW-SE faults.
Seismotectonic features in the broader study area: Red barbed lines and red arrows indicate activated faults and the resolved maximum horizontal stress σ3, respectively. Black lines are mapped or inferred faults. Green arrows denote regional extension. Red beachball is the 1975 event. Black beachballs are the 5 strongest 2007 events. Black arrows denote the direction of the surface velocity field.

THANK YOU!!!
ESC 2012, 33rd General Assembly, Moscow, 19-24 August 2012


![1.Intro pres ICCA workshop gbf.ppt [Read-Only]](https://img.pdfslide.net/doc/110x75/6317f4e73394f2252e028964/1intro-pres-icca-workshop-gbfppt-read-only.jpg)


